
SARS-CoV-2 pandemic severity in Canada and peer nations

 Download this article as a PDF
Published by: The Public Health Agency of Canada
Issue: Volume 49-5, May 2023: Innovative Technologies in Public Health
Date published: May 2023
ISSN: 1481-8531
Submit a manuscript
About CCDR
Browse
Volume 49-5, May 2023: Innovative Technologies in Public Health
Overview
Relative pandemic severity in Canada and four peer nations during the SARS-CoV-2 pandemic
Amy Peng1, Alison Simmons1, Afia Amoako1, Ashleigh Tuite1,2, David Fisman1
Affiliations
1 Dalla Lana School of Public Health, University of Toronto, Toronto, ON
2 Public Health Agency of Canada, Ottawa, ON
Correspondence
Suggested citation
Peng A, Simmons AE, Amoako A, Tuite AR, Fisman DN. Relative pandemic severity in Canada and four peer nations during the SARS-CoV-2 pandemic. Can Commun Dis Rep 2023;49(5):197–205. https://doi.org/10.14745/ccdr.v49i05a05
Keywords: Canada, pandemic severity, SARS-CoV-2, standardization, health economics, public health
Abstract
Background: National responses to the severe acute respiratory syndrome coronavirus 2 (SARS-CoV-2) pandemic have been highly variable. We sought to explore the effectiveness of the Canadian pandemic response up to May 2022 relative to responses in four peer countries with similar political, economic and health systems, and with close historical and cultural ties to Canada.
Methods: We used reported age-specific mortality data to generate estimates of pandemic mortality standardized to the Canadian population. Age-specific case fatality, hospitalization, and intensive care admission probabilities for the Canadian province of Ontario were applied to estimated deaths, to calculate hospitalizations and intensive care admissions averted by the Canadian response. Health impacts were valued in both monetary terms, and in terms of lost quality-adjusted life years.
Results: We estimated that the Canadian pandemic response averted 94,492, 64,306 and 13,641 deaths relative to the responses of the United States, United Kingdom and France, respectively, and more than 480,000 hospitalizations relative to the United States. The United States pandemic response, if applied to Canada, would have resulted in more than $40 billion in economic losses due to healthcare expenditures and lost quality-adjusted life years. In contrast, an Australian pandemic response applied to Canada would have averted over 28,000 additional deaths and averted nearly $9 billion in costs.
Conclusion: Canada outperformed several peer countries that aimed for mitigation rather than elimination of SARS-CoV-2 in the first two years of the pandemic, with substantial numbers of lives saved and economic costs averted. However, a comparison with Australia demonstrated that an elimination focus would have saved Canada tens of thousands of lives as well as substantial economic costs.
Introduction
The global severe acute respiratory syndrome coronavirus 2 (SARS-CoV-2) pandemic has taken a fearsome toll on mortality, life expectancy and population health globally, but not all countries have been impacted equally. The reasons for this heterogeneity are only partly understood. Population age structure is a key contributor to SARS-CoV-2 severity Footnote 1 Footnote 2; however, countries with older age distributions (such as Japan) have been less severely affected than its high-income peers Footnote 3. Japan's early focus on the airborne nature of SARS-CoV-2, and the widespread acceptance of masking, may also have been important mitigators Footnote 3 Footnote 4. Marked heterogeneity in severity was seen across countries that have similar age structures but were slow to recognize airborne transmission of SARS-CoV-2.
A case in point is the differential severity of the pandemic in Canada and the United States (US); both are wealthy, federal democracies with advanced medical care systems. In both countries, the coronavirus disease 2019 (COVID-19) pandemic has had a major impact on population health and the economy. The similarities and differences between the two countries' healthcare systems have made cross-national comparisons an important source of insight into the strengths and weaknesses of their respective health systems Footnote 5. During the COVID-19 pandemic, both COVID-19 cases and deaths per capita have been substantially higher in the US than in Canada Footnote 6. Australia represents another reasonable peer for Canada for comparison purposes. Australia is similar to Canada in terms of income, culture and governance, but employed more stringent pandemic control measure and consequently had much lower per capita SARS-CoV-2 pandemic mortality as of May 2022 Footnote 7. The United Kingdom (UK) and France share ties of economy, culture and history with Canada (as hubs of the British Commonwealth and La Francophonie, both of which include Canada), and may also represent appropriate comparators.
Debate in the Canadian public sphere around pandemic policy has often focussed on whether Canada's approach to disease control should have been more or less stringent. Assuming that differences in outcomes were at least partly driven by policy rather than the independent actions and choices of individuals, we sought to explore the differences in outcomes that Canada would have experienced over the first two years of the SARS-CoV-2 pandemic had it followed the path of the US, the UK, France or Australia. We had previously performed such an analysis in March 2021, with comparison restricted to Canada and the US Footnote 6. While our objective was not to perform a formal cost-utility analysis of the Canadian pandemic response relative to responses in these peer nations, the question of costs averted, or excess costs accrued, both through hospitalizations and premature loss of life, is an important one, and we incorporated simple valuations of these quantities into our analysis. These may help inform future cost-utility analyses on this question.
Methods
We obtained national COVID-19-attributed death estimates from the Public Health Agency of Canada, and national health authorities for the US, the UK, France and Australia until late April or early May of 2022, as available Footnote 7 Footnote 8 Footnote 9 Footnote 10 Footnote 11. We chose these countries as comparator peers because all are high income countries with advanced health systems, and all have strong cultural, political, and historical links to, and similarities with Canada. Of these five countries, all but Australia Footnote 12 Footnote 13 sought to mitigate rather than eliminate SARS-CoV-2 during the first two years of the pandemic. Some Canadian provinces and territories, notably Atlantic provinces and Northern Territories, Footnote 14 did pursue elimination at times. Population estimates were obtained from national census agencies for all countries Footnote 15 Footnote 16 Footnote 17 Footnote 18 Footnote 19. We calculated the number of excess or deficit deaths that would have been expected in Canada under approaches employed in peer countries using direct standardization Footnote 20. Because country death data were reported using slightly different age groupings, we reallocated Canadian deaths to mirror the distribution of SARS-CoV-2 deaths, by two-year age increments, due to data availability in the province of Ontario (available to January 18, 2022). Deaths were assumed to be equally distributed between years in each two-year category. Standardized mortality ratios (SMR) for Canada, relative to other countries, were estimated by dividing observed by expected deaths (i.e. the deaths that would have occurred with a US, UK, France or Australia-equivalent response). The 95% confidence limits for SMR were calculated by estimating standard errors as (1/A+1/B)1/2, where A and B are death counts in each of the two peer countries, as described previously Footnote 20.
Observed deaths were subtracted from expected deaths to calculate deaths averted. We divided averted deaths by age-specific case-fatality estimates from Ontario to estimate averted cases. We applied age-specific risks of hospital admission and intensive care admission, derived from Ontario case data, to calculate hospital and intensive care admissions averted. We placed a monetary value on hospitalizations and intensive care unit (ICU) admissions averted based on Canadian cost estimates generated by the Canadian Institute for Health Information Footnote 21. The approach of Briggs et al., modified for the Canadian context by Kirwin et al., was used to estimate quality-adjusted life years (QALY) lost for deaths occurring in each age group Footnote 22 Footnote 23. We monetized QALY losses averted by applying a net expected benefit approach, with QALY valued at $30,000 as per Kirwin et al. Footnote 23. We compared the stringency of pandemic responses using the Oxford Government Coronavirus Response Tracker's Pandemic Stringency Index Footnote 24. The stringency was plotted against time and differences in the stringency between Canada and other countries were evaluated with the Wilcoxon rank-sum test. All input data are publicly available.
Results
Fewer SARS-CoV-2-related deaths per capita had occurred in Canada than in the US in all age groups as of May 2022, with SMR significantly less than one for all age groups in Canada. A similar pattern was seen when Canada was compared to the UK, except in children aged 0–14 years, where there was no significant difference between the two countries (SMR 1.02, 95% CI: 0.67–1.55). In comparison with France, Canada experienced significantly fewer deaths per capita in adults aged 40–89 years, more deaths than France in those aged 20–29 years and 90 years and older, and no difference in those younger than 20 years. In comparison with Australia, Canada had significantly higher SARS-CoV-2-related deaths per capita in all age groups except those aged 10–19 years, where differences were not significant (SMR 2.24, 95% CI: 0.81–6.16) (Table 1).
| Age group (years) |
Deaths | Population | Cumulative mortality per 1,000 | Expected deaths, Canadian population | Observed Canadian deathsFootnote a | Standardized mortality ratio | 95% CI |
|---|---|---|---|---|---|---|---|
| United States | |||||||
| 0–17 | 1,045 | 73,284,400 | 0.01 | 103.42 | 37 | 0.35 | 0.25–0.49 |
| 18–29 | 6,257 | 52,870,600 | 0.12 | 700.11 | 136 | 0.19 | 0.16–0.23 |
| 30–39 | 18,148 | 43,375,000 | 0.42 | 2,244.47 | 315 | 0.14 | 0.13–0.16 |
| 40–49 | 42,961 | 39,929,000 | 1.08 | 5,265.77 | 660 | 0.13 | 0.12–0.14 |
| 50–64 | 187,272 | 62,110,000 | 3.02 | 23,329.55 | 3,772 | 0.16 | 0.16–0.17 |
| 65–74 | 229,682 | 31,487,000 | 7.29 | 29,816.49 | 6,422 | 0.22 | 0.21–0.22 |
| 75–84 | 257,553 | 15,407,000 | 16.72 | 35,486.56 | 10,899 | 0.31 | 0.30–0.31 |
| 85 and over | 255,780 | 5,893,000 | 43.40 | 37,823.67 | 18,038 | 0.48 | 0.47–0.48 |
| Total | 991,396 | 324,356,000 | - | 134,770 | 40,278 | - | - |
| United Kingdom | |||||||
| 0–14 | 64 | 11,974,857 | 0.005 | 32 | 33 | 1.02 | 0.67–1.55 |
| 15–44 | 2,748 | 25,311,086 | 0.109 | 1,631 | 685 | 0.42 | 0.39–0.46 |
| 45–64 | 21,139 | 17,286,653 | 1.223 | 12,378 | 4,466 | 0.36 | 0.35–0.37 |
| 65–74 | 30,745 | 6,719,287 | 4.576 | 18,703 | 6,491 | 0.35 | 0.34–0.36 |
| 75–84 | 59,945 | 4,129,982 | 14.515 | 30,812 | 21,317 | 0.69 | 0.68–0.70 |
| 85 and over | 78,125 | 1,659,369 | 47.081 | 41,028 | 7,286 | 0.18 | 0.17–0.18 |
| Total | 192,766 | 67,081,234 | - | 104,584 | 40,278 | - | - |
| France | |||||||
| 0–9 | 37 | 7,706,041 | 0.005 | 19 | 29 | 1.54 | 0.95–2.50 |
| 10–19 | 31 | 8,421,914 | 0.004 | 15 | 15 | 0.98 | 0.53–1.82 |
| 20–29 | 147 | 7,525,983 | 0.020 | 99 | 128 | 1.29 | 1.02–1.63 |
| 30–39 | 465 | 8,279,577 | 0.056 | 301 | 315 | 1.05 | 0.91–1.21 |
| 40–49 | 1,337 | 8,572,713 | 0.156 | 763 | 660 | 0.87 | 0.79–0.95 |
| 50–59 | 4,576 | 8,813,899 | 0.519 | 2,664 | 1,862 | 0.70 | 0.66–0.74 |
| 60–69 | 13,344 | 8,000,803 | 1.668 | 8,074 | 4,349 | 0.54 | 0.52–0.56 |
| 70–79 | 26,358 | 5,959,261 | 4.423 | 13,862 | 8,633 | 0.62 | 0.61–0.64 |
| 80–89 | 43,387 | 3,214,055 | 13.499 | 18,460 | 13,844 | 0.75 | 0.74–0.76 |
| 90 and over | 25,895 | 927,995 | 27.904 | 9,662 | 10,443 | 1.08 | 1.06–1.11 |
| Total | 115,577 | 67,422,241 | - | 53,919 | 40,278 | - | - |
| Australia | |||||||
| 0–9 | 8 | 3,156,780 | 0.003 | 10 | 29 | 2.91 | 1.33–6.37 |
| 10–19 | 5 | 3,097,360 | 0.002 | 7 | 15 | 2.24 | 0.81–6.16 |
| 20–29 | 22 | 3,476,779 | 0.006 | 32 | 128 | 3.97 | 2.53–6.24 |
| 30–39 | 65 | 3,780,122 | 0.017 | 92 | 315 | 3.41 | 2.61–4.46 |
| 40–49 | 124 | 3,294,734 | 0.038 | 184 | 660 | 3.58 | 2.96–4.34 |
| 50–59 | 322 | 3,143,647 | 0.102 | 526 | 1,862 | 3.54 | 3.15–3.99 |
| 60–69 | 726 | 2,737,883 | 0.265 | 1,284 | 4,349 | 3.39 | 3.13–3.66 |
| 70–79 | 1,579 | 1,952,572 | 0.809 | 2,534 | 8,633 | 3.41 | 3.23–3.59 |
| 80–89 | 2,695 | 876,320 | 3.075 | 4,205 | 13,844 | 3.29 | 3.16–3.43 |
| 90 and over | 1,925 | 221,945 | 8.673 | 3,003 | 10,443 | 3.48 | 3.31–3.65 |
| Total | 7,471 | 25,738,142 | - | 11,878 | 40,278 | - | - |
|
|||||||
When compared to the US, UK and France's SARS-CoV-2 responses, we estimated that Canada's response prevented 94,492 (95% CI: 93,593–95,360), 64,306 (95% CI: 63,394–65,189) and 13,641 (95% CI: 12,489–14,735) deaths, respectively. In contrast, an Australian response applied to Canada would have saved 28,400 (95% CI: 26,097–30,939) lives of the total number of Canadians (n=40,278) that had been lost to SARS-CoV-2 as of May 2022 (Table 2).
| Outcome | Comparator peer country | |||||||
|---|---|---|---|---|---|---|---|---|
| United States | 95% CI | United Kingdom | 95% CI | France | 95% CI | AustraliaFootnote b | 95% CI | |
| Deaths averted | 94,492 | 93,593–95,360 | 64,306 | 63,394–65,189 | 13,641 | 12,489–14,735 | −28,400 | −30,939–−26,097 |
| Hospitalizations averted | 483,009 | 465,046–516,497 | 196,611 | 184,256–209,756 | 39,367 | 26,213–50,528 | −83,281 | −110,498–−67,197 |
| ICU admissions averted | 108,157 | 99,635–117,714 | 40,131 | 37,002–43,514 | 8,984 | 6,873–10,683 | −15,335 | −20,059–−12,380 |
| QALY gained | 1,060,180 | 943,164–1,172,874 | 569,981 | 514,483–635,306 | 133,517 | 107,018–158,498 | −231,100 | −277,758–−191,373 |
| Hospitalization costs averted | 10.73 | 10.32–11.47 | 4.37 | 4.09–4.66 | 0.87 | 0.59–1.13 | −1.85 | −2.42–−1.49 |
| ICU costs averted | 5.18 | 4.78–5.65 | 1.92 | 1.77–2.08 | 0.43 | 0.33–0.51 | −0.73 | −0.95–−0.59 |
| Hospitalization costs averted (non-ICU) | 5.55 | 5.55–5.81 | 2.45 | 2.31–2.58 | 0.44 | 0.25–0.62 | −1.12 | −1.46–−0.90 |
| Net benefit of QALY gained | 31.81 | 28.29–35.19 | 17.10 | 15.43–19.06 | 4.01 | 3.26–4.74 | −6.93 | −8.00–−5.50 |
| Total costs averted | 42.54 | 38.62–46.65 | 21.47 | 19.52–23.71 | 4.88 | 3.83–5.88 | −8.78 | −10.77–−7.21 |
|
||||||||
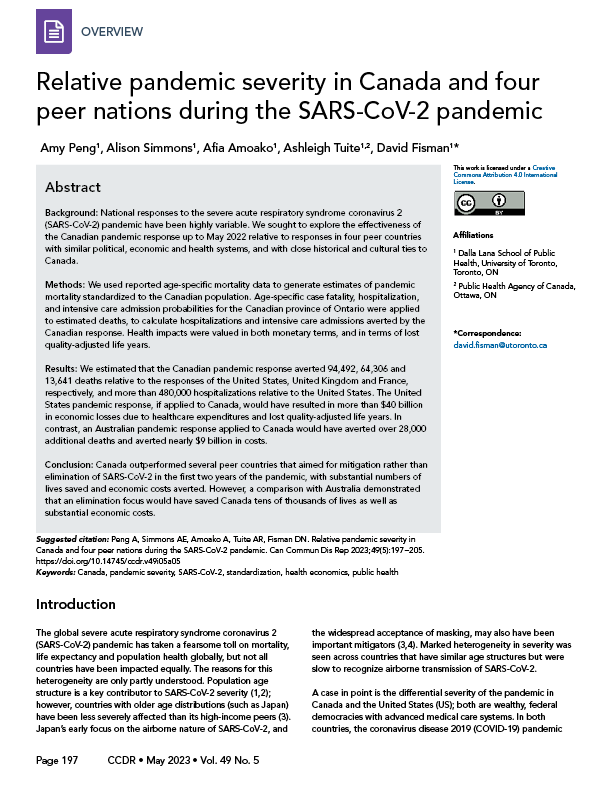
Distributions of deaths by age differed markedly between the US and the other countries analyzed. For example, half of deaths in the US occurred in individuals under the age of 55 years; in other countries, half of the fatalities occurred in those under approximately 75 years of age with the remainder occurring in those 75 years of age and over (Figure 1). A similar divergence between the US response and those in other countries was seen when we applied age-specific QALY losses to death data (Figure 2).
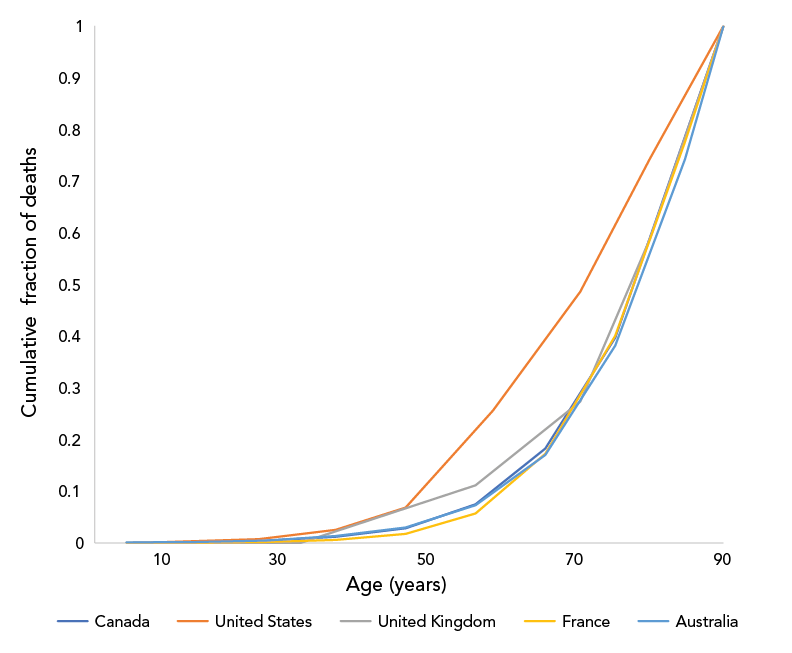
Figure 1 - Text description
The graph shows the cumulative fraction of deaths due to SARS-CoV-2, by age group, in Canada, the United States, the United Kingdom, France and Australia. The cumulative fraction of deaths for all countries begins at 0, at age 0 and ends at 1, in the oldest age group (assigned an age of 90 years). The largest fraction of deaths occurred in individuals aged 60 years and over in all countries, but a larger fraction of deaths occurred in individuals under age 60 in the United States, and in the United Kingdom, than in the other three countries.
| Country | Age | Deaths |
|---|---|---|
| Canada | 5.5 | 0.00072 |
| 15.5 | 0.00109241 | |
| 24.5 | 0.00427032 | |
| 34.5 | 0.01209097 | |
| 44.5 | 0.02847708 | |
| 54.5 | 0.07470579 | |
| 64.5 | 0.18268037 | |
| 74.5 | 0.39701574 | |
| 90 | 1 | |
| United States | 8.5 | 0.00104636 |
| 23.5 | 0.00731152 | |
| 34.5 | 0.02548318 | |
| 44.5 | 0.06850019 | |
| 57 | 0.25601633 | |
| 69.5 | 0.48599777 | |
| 79.5 | 0.74388654 | |
| 90 | 1 | |
| United Kingdom | 7 | 0.00033681 |
| 29.5 | 0.00033681 | |
| 54.5 | 0.11158417 | |
| 69.5 | 0.27338463 | |
| 79.5 | 0.58885474 | |
| 90 | 1 | |
| France | 4.5 | 0.00032013 |
| 14.5 | 0.00058835 | |
| 24.5 | 0.00186023 | |
| 34.5 | 0.00588352 | |
| 44.5 | 0.01745157 | |
| 54.5 | 0.05704422 | |
| 64.5 | 0.17249972 | |
| 74.5 | 0.40055547 | |
| 84.5 | 0.77595023 | |
| 90 | 1 | |
| Australia | 4.5 | 0.00107081 |
| 14.5 | 0.00174006 | |
| 24.5 | 0.00468478 | |
| 34.5 | 0.01338509 | |
| 44.5 | 0.0299826 | |
| 54.5 | 0.07308259 | |
| 64.5 | 0.17025833 | |
| 74.5 | 0.38160889 | |
| 84.5 | 0.74233704 | |
| 90 | 1 |
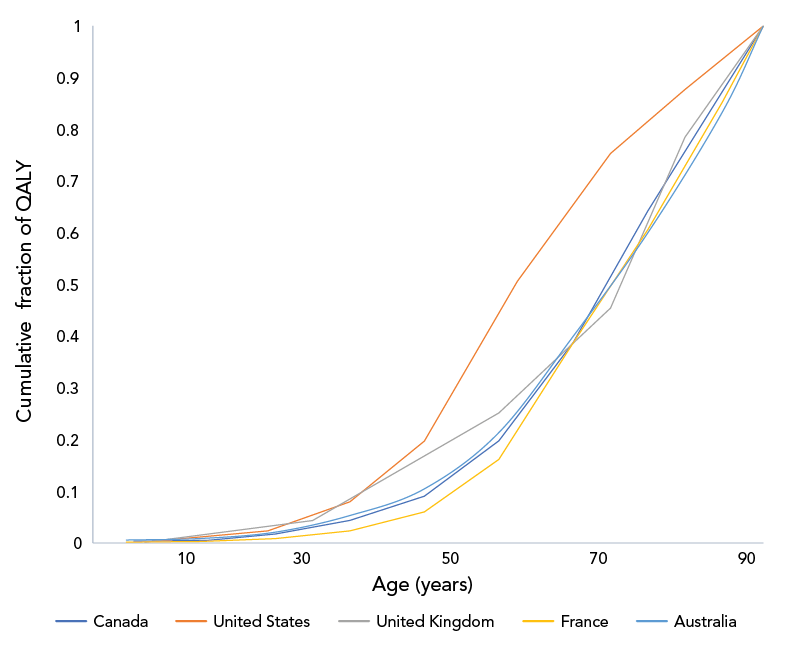
Figure 2 - Text description
The graph shows the cumulative fraction of quality adjusted life years (QALY) lost due to SARS-CoV-2, by age group, in Canada, the United States, the United Kingdom, France and Australia. The cumulative fraction of QALY lost for all countries begins at 0, at age 0 and ends at 1, in the oldest age group (assigned an age of 90 years). As with cumulative deaths, the largest fraction of QALY losses occurred in individuals aged 60 years and over. A larger fraction of QALY losses occurred in individuals under age 60 in the United States, and in the United Kingdom, than in the other three countries, due to proportionately more deaths in younger individuals.
| Country | Age | QALY |
|---|---|---|
| Canada | 5.5 | 0.00341789 |
| 15.5 | 0.00500714 | |
| 24.5 | 0.01717573 | |
| 34.5 | 0.04355921 | |
| 44.5 | 0.09037771 | |
| 54.5 | 0.19742485 | |
| 64.5 | 0.38773189 | |
| 74.5 | 0.64228377 | |
| 90 | 1 | |
| United States | 8.5 | 0.00389746 |
| 23.5 | 0.02340023 | |
| 34.5 | 0.07964475 | |
| 44.5 | 0.19694987 | |
| 57 | 0.50601893 | |
| 69.5 | 0.75351813 | |
| 79.5 | 0.87718473 | |
| 90 | 1 | |
| United Kingdom | 7 | 0.00138564 |
| 29.5 | 0.04343299 | |
| 54.5 | 0.25148219 | |
| 69.5 | 0.45455367 | |
| 79.5 | 0.7849251 | |
| 90 | 1 | |
| France | 4.5 | 0.0016837 |
| 14.5 | 0.00295183 | |
| 24.5 | 0.00834757 | |
| 34.5 | 0.02338513 | |
| 44.5 | 0.06000425 | |
| 54.5 | 0.16157866 | |
| 64.5 | 0.38703082 | |
| 74.5 | 0.60600736 | |
| 84.5 | 0.8527404 | |
| 90 | 1 | |
| Australia | 4.5 | 0.00554277 |
| 14.5 | 0.00865697 | |
| 24.5 | 0.02095202 | |
| 34.5 | 0.05295658 | |
| 44.5 | 0.1046663 | |
| 54.5 | 0.21349118 | |
| 64.5 | 0.40024909 | |
| 74.5 | 0.59997817 | |
| 84.5 | 0.83332424 | |
| 90 | 1 |
We estimated that Canada's response saved over one million QALYs, nearly 500,000 hospitalizations and over 100,000 ICU admissions relative to what would have occurred with a response equivalent to that seen in the US (Table 2). The value of QALY losses and hospitalizations averted is estimated to be approximately $43 billion, with $32 billion due to aversion of lost QALY and the remainder due to averted hospitalizations. The Canadian response also saved QALY and averted hospitalizations and ICU admissions relative to UK and French responses. When compared to the Australian response, Canada's response was estimated to have resulted in approximately 230,000 additional QALY lost, over 80,000 excess hospital admissions and over 15,000 excess ICU admissions as of May 2022, representing a loss of $8.78 ($7.21 to $10.77) billion (Table 2). Age-specific estimates of deaths, healthcare utilization and costs averted for each of the four peer comparator countries are presented in Table 2.
The stringency of the Canadian pandemic response from March 1, 2020, to May 1, 2022, was significantly higher than the stringency in the US, the UK and France, and was also higher than the Australian stringency (p<0.001 for all comparisons) (Appendix, Table A1 and Figure A1).
Discussion
The cultural similarities and integrated economies of Canada and the US, which also have very different health systems, has long encouraged comparative research between these two countries Footnote 5 Footnote 25 Footnote 26 Footnote 27. During the current SARS-CoV-2 pandemic, this type of research has continued, spurred, in part, by the remarkable difference in the pandemic's impact on the two countries Footnote 28. Here, we demonstrate that application of age-specific US data to Canada resulted in a far deadlier pandemic in the US, with a more than three-fold higher total deaths relative to those that had occurred in Canada as of May 2022. A challenge with this type of comparison is that the US's pandemic response has emerged as a global outlier, with SARS-CoV-2 taking a far greater toll in terms of loss of life than in any other high-income peer country. The outlier status of the US Footnote 28 has the effect of making Canada-US comparisons predictable in result, perhaps unfairly elevating the effectiveness of the Canadian pandemic response. As such, we also evaluated Canada's response relative to the UK, France and Australia, which given cultural, political, economic and historical similarities to Canada, are also fair comparators.
We find that, as with the US, application of the UK's pandemic response to Canada would have resulted in tens of thousands of additional deaths, as well as billions of dollars in excess economic losses. While Canada appears to have outperformed France as well, differences in pandemic repercussions between these two countries were more modest. In contrast, Australia emerges as a model of what Canada might have achieved by taking a more aggressive stance on disease control during the first two years of the SARS-CoV-2 pandemic. Indeed, we estimate that over 75% of Canadian pandemic deaths to date could have been averted through an Australian response, with cost savings of approximately $10 billion.
Our work complements that of Razak et al., who also found that Canada had outperformed most of its G10 peers (except for Japan) with respect to pandemic-attributable mortality Footnote 29. However, the use of standardization, as applied here, allows us to see that the Canadian approach was far more effective than the US and UK approaches in preventing deaths in younger adults, with consequently greater gains in quality-adjusted survival. As public health and government officials in these five countries likely had access to similar information for decision-making, differences in outcomes likely reflected active policy choices. The complexity of the pandemic, and societal responses to it, make identification of causal factors challenging. Galvani et al. noted that a key difference between Canada and the US may relate to universal public healthcare in the former Footnote 28; however, universal public healthcare is also available in the UK, France and Australia. Razak et al. noted that Canada outperformed many high-income peer countries on vaccination Footnote 29. We have also suggested that cultural differences between countries, including differences in social capital and trust in government, may be important Footnote 30.
While Canada's pandemic response, as reflected in the Oxford Stringency Index, was more stringent on average than the responses in the US, the UK and France, it was also more stringent than Australia's, suggesting that stringency alone cannot explain differences in outcomes. Data from Aknin et al. suggest that it may not have been stringency, but the decision to aim for elimination rather than mitigation, which resulted in the low stringency and low deaths seen in countries like Australia Footnote 31. Although more aggressive pandemic control strategies have been criticized over perceived negative mental health impacts, Aknin et al. also demonstrated that the impact of excess pandemic deaths far outweighed the impact of public health interventions as a driver of negative mental health effects during the pandemic Footnote 31. This suggests that Canada's approach, in addition to saving more lives and reducing more costs than US and UK responses, may have been more protective of population mental health. More stringent control strategies have also been criticized as resulting in greater negative economic impacts, and indeed Canada's GDP declined by 1.6% in the first two years of the pandemic Footnote 29; however, the $43 billion Canada effectively gained by avoiding a US-style pandemic response represents over 2% of Canadian GDP (valued at around $2.1 trillion $CDN).
Limitations
Our analysis has three key limitations. We have not attempted to capture consequences or costs of the pandemic on mental health. It should be noted that Aknin et al. Footnote 31 found that a pandemic elimination rather than mitigation stance decreased overall stringency and mental health impacts. Other important costs and impacts that we did not include, and which would likely further widen the gap in health and economic consequences between these peer countries, include disutility and lost earnings associated with hospitalization, long-term costs of chronic disease, including cardiac, respiratory and neurological disease, in those who survive SARS-CoV-2 infection, and the health, economic and societal impacts of parental loss due to the pandemic Footnote 32 Footnote 33 Footnote 34 Footnote 35. As we have included only QALY gains and losses associated with death, and not incorporated those associated with short-term illness and hospitalization, or with the post-acute COVID syndrome (commonly referred to as "long COVID"), our estimates for QALY lost represent lower bounds for all countries Footnote 36. A second limitation of our analysis is our use of Ontario-specific case fatalities and hospitalization and intensive care admission risks to estimate outcomes averted at a national level. We use these data for pragmatic reasons: they were the most complete and granular Canadian death data to which we had access. Furthermore, Ontario's epidemiology is likely similar to that of Canada overall, both because of similarities in demographics and health systems across the country, and also because the population of Ontario represents approximately 40% of the Canadian population and 35% of Canada's COVID-19 case load, such that the province's epidemiology strongly influences that of Canada as a whole. Lastly, we assumed that attribution of COVID-19 deaths in Canada and comparator peer countries occurred in a comparable manner. The best available data (based on ratios of reported COVID-19 mortality to all-cause excess mortality during the pandemic) suggest that this is likely to have been the case for Canada, the US and France; reporting of COVID-19 mortality may have been more accurate in the UK than in Canada, which would tend to exaggerate the differences in outcomes between these two countries. More accurate reporting of COVID-19 deaths in Australia would lead us to underestimate the degree to which this country outperformed comparator peer countries Footnote 37.
Conclusion
Canada's relatively strong pandemic response during the first two years of the SARS-CoV-2 pandemic resulted in large numbers of deaths, hospitalizations and ICU admissions averted relative to responses in the US and UK, and more modest gains relative to France. A disease control stance focussed on elimination rather than mitigation, as was pursued in Australia during the same time period, would have resulted in further health and economic benefits.
Authors' statement
AP — Data acquisition, cleaning and analysis, drafting of manuscript
AA — Conceptualization, manuscript editing and revision
AS — Conceptualization, manuscript editing and revision
AT — Conceptualization, manuscript editing and revision
DF — Project lead, conceptualization, drafting, editing and revision of manuscript
All authors approved the final version for publication.
Competing interests
DNF has served on advisory boards related to influenza and SARS-CoV-2 vaccines for Seqirus, Pfizer, AstraZeneca and Sanofi-Pasteur Vaccines, and has served as a legal expert on issues related to COVID-19 epidemiology for the Elementary Teachers Federation of Ontario and the Registered Nurses Association of Ontario. ART was employed by the Public Health Agency of Canada when the research was conducted.
Acknowledgements
The authors wish to thank Canada's outstanding public health professionals for their tireless dedication during the SARS-CoV-2 pandemic. Your work saved many lives, and we thank you.
Funding
The research was supported by a grant to DNF from the Canadian Institutes of Health Research (Canadian 2019 Novel Coronavirus (COVID-19) Rapid Research Funding OV4-170360).
References
- Footnote 1
-
Levin AT, Hanage WP, Owusu-Boaitey N, Cochran KB, Walsh SP, Meyerowitz-Katz G. Assessing the age specificity of infection fatality rates for COVID-19: systematic review, meta-analysis, and public policy implications. Eur J Epidemiol 2020;35(12):1123–38. https://doi.org/10.1007/s10654-020-00698-1
- Footnote 2
-
Fisman DN, Greer AL, Tuite AR. Age Is Just a Number: A Critically Important Number for COVID-19 Case Fatality. Ann Intern Med 2020;173(9):762–3. https://doi.org/10.7326/M20-4048
- Footnote 3
-
Oshitani H. COVID lessons from Japan: the right messaging empowers citizens. Nature 2022;605(7911):589. https://doi.org/10.1038/d41586-022-01385-9
- Footnote 4
-
Craft L. Japan has long accepted COVID's airborne spread, and scientists say ventilation is key. CBS News; July 13, 2020. https://www.cbsnews.com/news/coronavirus-japan-has-long-accepted-covids-airborne-spread-and-scientists-say-ventilation-is-key/
- Footnote 5
-
Rouleau JL, Moyé LA, Pfeffer MA, Arnold JM, Bernstein V, Cuddy TE, Dagenais GR, Geltman EM, Goldman S, Gordon D, Hamm P, Klein M, Lamas GA, McCans J, McEwan P, Menapace FJ, Parker JO, Sestier F, Sussex B, Braunwald E, for the SAVE Investigators. A comparison of management patterns after acute myocardial infarction in Canada and the United States. The SAVE investigators. N Engl J Med 1993;328(11):779–84. https://doi.org/10.1056/NEJM199303183281108
- Footnote 6
-
Fisman DN, Tuite AR. Estimated Deaths, Intensive Care Admissions and Hospitalizations Averted in Canada during the COVID-19 Pandemic. medRxiv 2021:2021.03.23.21253873. https://doi.org/10.1101/2021.03.23.21253873
- Footnote 7
-
Australian Government. Department of Health. Coronavirus (COVID-19) case numbers and statistics. Canberra (AU): Government of Australia; 2023. [Accessed 2022 June 7]. https://www.health.gov.au/health-alerts/covid-19/case-numbers-and-statistics#cases-and-deaths-by-age-and-sex
- Footnote 8
-
U.S. Centers for Disease Control and Prevention. Weekly Updates by Select Demographic and Geographic Characteristics. Atlanta (GA): CDC; 2023. [Accessed 2022 June 7]. https://www.cdc.gov/nchs/nvss/vsrr/covid_weekly/index.htm
- Footnote 9
-
Public Health Agency of Canada. COVID-19 daily epidemiology update: Key updates. Ottawa, ON: PHAC; 2023. [Accessed 2022 June 7]. https://health-infobase.canada.ca/covid-19/epidemiological-summary-covid-19-cases.html
- Footnote 10
-
Santé publique France. The COVID-19 epidemic in France. Paris (FR): SPF; 2023. [Accessed 2022 June 14]. https://www.santepubliquefrance.fr/dossiers/coronavirus-covid-19
- Footnote 11
-
United Kingdom Office for National Statistics. Deaths registered weekly in England and Wales, provisional. ONS; Feb 21, 2023. [Accessed 2022 June 14]. https://www.ons.gov.uk/peoplepopulationandcommunity/birthsdeathsandmarriages/deaths/datasets/weeklyprovisionalfiguresondeathsregisteredinenglandandwales
- Footnote 12
-
De Foo C, Grépin KA, Cook AR, Hsu LY, Bartos M, Singh S, Asgari N, Teo YY, Heymann DL, Legido-Quigley H. Navigating from SARS-CoV-2 elimination to endemicity in Australia, Hong Kong, New Zealand, and Singapore. Lancet 2021;398(10311):1547–51. https://doi.org/10.1016/S0140-6736(21)02186-3
- Footnote 13
-
Stobart A, Duckett S. Australia's Response to COVID-19. Health Econ Policy Law 2022;17(1):95–106. https://doi.org/10.1017/S1744133121000244
- Footnote 14
-
Hurford A, Martignoni MM, Loredo-Osti JC, Anokye F, Arino J, Husain BS, Gaas B, Watmough J. Pandemic modelling for regions implementing an elimination strategy. J Theor Biol 2023;561:111378. https://doi.org/10.1016/j.jtbi.2022.111378
- Footnote 15
-
Statistics Canada. Population estimates on July 1st, by age and sex. Table: 17-10-0005-01 (formerly CANSIM 051-0001). Ottawa, ON: StatCan; Dec 21, 2022. [Accessed 2022 June 14] https://www150.statcan.gc.ca/t1/tbl1/en/tv.action?pid=1710000501
- Footnote 16
-
United States Census Bureau. Age and Sex Tables. Washington, DC: US Census Bureau; 2021. [Accessed 2022 June 14]. https://www.census.gov/topics/population/age-and-sex/data/tables.html
- Footnote 17
-
United Kingdom Office for National Statistics. Population estimates. [Accessed 2022 June 14]. https://www.ons.gov.uk/peoplepopulationandcommunity/populationandmigration/populationestimates
- Footnote 18
-
Institut national de la statistique et des etudes economiques. Demographic balance sheet 2019. INSEE; Jan 14, 2020. [Accessed 2022 June 14]. https://www.insee.fr/en/statistiques/2382597?sommaire=2382613
- Footnote 19
-
Australian Bureau of Statistics. Population. Canberra (AU): ABS; Dec 15, 2022. [Accessed 2022 June 14]. https://www.abs.gov.au/statistics/people/population
- Footnote 20
-
Fisman DN, Greer AL, Brankston G, Hillmer M, O'Brien SF, Drews SJ, Tuite AR. COVID-19 Case Age Distribution: Correction for Differential Testing by Age. Ann Intern Med 2021;174(10):1430–8. https://doi.org/10.7326/M20-7003
- Footnote 21
-
Canadian Institutes for Health Information. COVID-19 hospitalization and emergency department statistics. CIHI; Feb 2, 2023. [Accessed 2022 June 15]. https://www.cihi.ca/en/covid-19-hospitalization-and-emergency-department-statistics
- Footnote 22
-
Briggs AH, Goldstein DA, Kirwin E, Meacock R, Pandya A, Vanness DJ, Wisløff T. Estimating (quality-adjusted) life-year losses associated with deaths: with application to COVID-19. Health Econ 2021;30(3):699–707. https://doi.org/10.1002/hec.4208
- Footnote 23
-
Kirwin E, Rafferty E, Harback K, Round J, McCabe C. A Net Benefit Approach for the Optimal Allocation of a COVID-19 Vaccine. Pharmacoeconomics 2021;39(9):1059–73. https://doi.org/10.1007/s40273-021-01037-2
- Footnote 24
-
Mathieu E, Ritchie H, Rodés-Guirao L, Appel C, Gavrilov D, Giattino C, Hasel J, Macdonald B, Dattani S, Beltekian D, Ortiz-Ospina E, Roser M. COVID-19: Stringency Index. Our World In Data. [Accessed 2022 August 3]. https://ourworldindata.org/covid-stringency-index
- Footnote 25
-
Gohmann SF. A comparison of health care in Canada and the United States: the case of Pap smears. Med Care 2010;48(11):1036–40. https://doi.org/10.1097/MLR.0b013e3181eb31d2
- Footnote 26
-
Zajacova A, Siddiqi A. A comparison of health and socioeconomic gradients in health between the United States and Canada. Soc Sci Med 2022;306:115099. https://doi.org/10.1016/j.socscimed.2022.115099
- Footnote 27
-
Fisher S, Bennett C, Hennessy D, Finès P, Jessri M, Bader Eddeen A, Frank J, Robertson T, Taljaard M, Rosella LC, Sanmartin C, Jha P, Leyland A, Manuel DG. Comparison of mortality hazard ratios associated with health behaviours in Canada and the United States: a population-based linked health survey study. BMC Public Health 2022;22(1):478. https://doi.org/10.1186/s12889-022-12849-y
- Footnote 28
-
Galvani AP, Parpia AS, Pandey A, Sah P, Colón K, Friedman G, Campbell T, Kahn JG, Singer BH, Fitzpatrick MC. Universal healthcare as pandemic preparedness: the lives and costs that could have been saved during the COVID-19 pandemic. Proc Natl Acad Sci USA 2022;119(25):e2200536119. https://doi.org/10.1073/pnas.2200536119
- Footnote 29
-
Razak F, Shin S, Naylor CD, Slutsky AS. Canada's response to the initial 2 years of the COVID-19 pandemic: a comparison with peer countries. CMAJ 2022;194(25):E870–7. https://doi.org/10.1503/cmaj.220316
- Footnote 30
-
Fisman D. Universal healthcare and the pandemic mortality gap. Proc Natl Acad Sci USA 2022;119(29):e2208032119. https://doi.org/10.1073/pnas.2208032119
- Footnote 31
-
Aknin LB, Andretti B, Goldszmidt R, Helliwell JF, Petherick A, De Neve JE, Dunn EW, Fancourt D, Goldberg E, Jones SP, Karadag O, Karam E, Layard R, Saxena S, Thornton E, Whillans A, Zaki J. Policy stringency and mental health during the COVID-19 pandemic: a longitudinal analysis of data from 15 countries. Lancet Public Health 2022;7(5):e417–26. https://doi.org/10.1016/S2468-2667(22)00060-3
- Footnote 32
-
van Lith TJ, Sluis WM, Wijers NT, Meijer FJ, Kamphuis-van Ulzen K, de Bresser J, Dankbaar JW, van den Heuvel FM, Antoni ML, Mulders-Manders CM, de Mast Q, van de Veerdonk FL, Klok FA, Tuladhar AM, Cannegieter SC, Wermer MJ, van der Worp HB, Huisman MV, de Leeuw FE. Prevalence, risk factors, and long-term outcomes of cerebral ischemia in hospitalized COVID-19 patients - study rationale and protocol of the CORONIS study: A multicentre prospective cohort study. Eur Stroke J 2022;7(2):180–7. https://doi.org/10.1177/23969873221092538
- Footnote 33
-
Hillis SD, Unwin HJ, Chen Y, Cluver L, Sherr L, Goldman PS, Ratmann O, Donnelly CA, Bhatt S, Villaveces A, Butchart A, Bachman G, Rawlings L, Green P, Nelson CA 3rd, Flaxman S. Global minimum estimates of children affected by COVID-19-associated orphanhood and deaths of caregivers: a modelling study. Lancet 2021;398(10298):391–402. https://doi.org/10.1016/S0140-6736(21)01253-8
- Footnote 34
-
Sidik SM. Heart disease after COVID: what the data say. Nature 2022;608(7921):26–8. https://doi.org/10.1038/d41586-022-02074-3
- Footnote 35
-
Ledford H. How common is long COVID? Why studies give different answers. Nature 2022;606(7916):852–3. https://doi.org/10.1038/d41586-022-01702-2
- Footnote 36
-
Alkodaymi MS, Omrani OA, Fawzy NA, Shaar BA, Almamlouk R, Riaz M, Obeidat M, Obeidat Y, Gerberi D, Taha RM, Kashour Z, Kashour T, Berbari EF, Alkattan K, Tleyjeh IM. Prevalence of post-acute COVID-19 syndrome symptoms at different follow-up periods: a systematic review and meta-analysis. Clin Microbiol Infect 2022;28(5):657–66. https://doi.org/10.1016/j.cmi.2022.01.014
- Footnote 37
-
COVID-19 Excess Mortality Collaborators. Estimating excess mortality due to the COVID-19 pandemic: a systematic analysis of COVID-19-related mortality, 2020-21. Lancet 2022;399(10334):1513–36. https://doi.org/10.1016/S0140-6736(21)02796-3
Appendix
| Country | Mean | SD | p-valueFootnote a |
|---|---|---|---|
| Canada | 58.60 | 21.71 | N/A |
| Australia | 54.88 | 18.76 | <0.001 |
| France | 48.84 | 21.08 | <0.001 |
| United Kingdom | 51.14 | 24.05 | <0.001 |
| United States | 53.12 | 17.98 | <0.001 |
|
|||
Figure A1 - Text description
A)
The figure shows the stringency of pandemic control measures in Canada, the United States and the United Kingdom from January 2020 to May 2022. Stringency varied over time, but stringency was high, and similar in all three countries, to January 2021. Subsequently stringency was lower in the United States and United Kingdom than in Canada.
B)
The figure shows the stringency of pandemic control measures in Canada and Australia from January 2020 to May 2022. Stringency varied over time, but stringency was on average higher in Canada than Australia, despite Australias policy aim of SARS-CoV-2 elimination rather than mitigation prior to 2022. Australian stringency was volatile, reflecting transient intensification of pandemic control when outbreaks occurred.
C)
The figure shows the stringency of pandemic control measures in Canada and France from January 2020 to May 2022. Stringency varied over time, but stringency was on average higher in Canada than France from the summer of 2020 onwards.
