
Figures and tables: Economic Burden of Illness in Canada, 2005–2008
Summary of EBIC 2005-2008 Results
Figures and Tables
| Cost Component | 2008 | % of Total | 2007 | % of Total | 2006 | % of Total | 2005 | % of Total |
|---|---|---|---|---|---|---|---|---|
| Direct CostsTable 1 - Footnote 1, Table 1 - Footnote 2 | ||||||||
| Hospital Care Expenditures | 50,155.8 | 26.0 | 47,780.6 | 25.9 | 46,120.0 | 26.0 | 44,217.6 | 26.1 |
| Attributable | 39,744.9 | 20.6 | 38,224.2 | 20.8 | 35,935.7 | 20.2 | 33,831.1 | 20.0 |
| Unattributable | 10,410.8 | 5.4 | 9,556.4 | 5.2 | 10,184.4 | 5.7 | 10,386.5 | 6.1 |
| Drug Expenditures | 28,509.7 | 14.8 | 27,625.2 | 15.0 | 26,796.6 | 15.1 | 25,253.6 | 14.9 |
| Attributable | 21,633.3 | 11.2 | 20,952.3 | 11.4 | 19,990.9 | 11.3 | 19,296.7 | 11.4 |
| Unattributable | 6,876.4 | 3.6 | 6,672.8 | 3.6 | 6,805.7 | 3.8 | 5,956.9 | 3.5 |
| Physician Care Expenditures | 24,280.5 | 12.6 | 22,520.9 | 12.2 | 21,406.6 | 12.1 | 20,203.7 | 11.9 |
| Attributable | 24,280.5 | 12.6 | 22,520.9 | 12.2 | 21,406.6 | 12.1 | 20,203.7 | 11.9 |
| Unattributable | 0.0 | 0.0 | 0.0 | 0.0 | 0.0 | 0.0 | 0.0 | 0.0 |
| Other Direct Costs | 72,676.8 | 37.7 | 69,503.5 | 37.7 | 66,745.7 | 37.6 | 63,548.8 | 37.5 |
| Attributable | 0.0 | 0.0 | 0.0 | 0.0 | 0.0 | 0.0 | 0.0 | 0.0 |
| Unattributable | 72,676.8 | 37.7 | 69,503.5 | 37.7 | 66,745.7 | 37.6 | 63,548.8 | 37.5 |
| Total Direct Costs | 175,622.8 | 91.1 | 167,430.2 | 90.9 | 161,069.0 | 90.7 | 153,223.7 | 90.4 |
| Indirect Costs | ||||||||
| Mortality Costs | 463.5 | 0.2 | 461.5 | 0.3 | 470.7 | 0.3 | 469.8 | 0.3 |
| Attributable | 463.5 | 0.2 | 461.5 | 0.3 | 470.7 | 0.3 | 469.8 | 0.3 |
| Unattributable | 0.0 | 0.0 | 0.0 | 0.0 | 0.0 | 0.0 | 0.0 | 0.0 |
| Morbidity Costs | 16,741.3 | 8.7 | 16,312.9 | 8.9 | 16,028.0 | 9.0 | 15,760.4 | 9.3 |
| Attributable | 10,423.1 | 5.4 | 10,117.0 | 5.5 | 9,931.4 | 5.6 | 9,766.3 | 5.8 |
| UnattributableTable 1 - Footnote 3 | 6,318.23 | 3.3 | 6,195.9 | 3.4 | 6,096.6 | 3.4 | 5,994.1 | 3.5 |
| Total Indirect Costs | 17,204.8 | 8.9 | 16,774.4 | 9.1 | 16,498.7 | 9.3 | 16,230.2 | 9.6 |
| Total Cost of Illness | 192,827.6 | 100.0 | 184,204.5 | 100.0 | 177,567.8 | 100.0 | 169,453.9 | 100.0 |
Footnotes:
|
||||||||
| Cost Component | 2008 | % of Total | 2007 | % of Total | 2006 | % of Total | 2005 | % of Total |
|---|---|---|---|---|---|---|---|---|
| Direct CostsTable 2 - Footnote 1, Table 2 - Footnote 2 | ||||||||
| Hospital Care Expenditures | 49,122.5 | 26.0 | 45,729.9 | 25.9 | 43,190.5 | 26.0 | 40,611.9 | 26.1 |
| Attributable | 38,926.1 | 20.6 | 36,583.7 | 20.8 | 33,653.0 | 20.2 | 31,072.4 | 20.0 |
| Unattributable | 10,196.4 | 5.4 | 9,146.3 | 5.2 | 9,537.5 | 5.7 | 9,539.5 | 6.1 |
| Drug Expenditures | 27,922.4 | 14.8 | 26,439.5 | 15.0 | 25,094.5 | 15.1 | 23,194.3 | 14.9 |
| Attributable | 21,187.6 | 11.2 | 20,053.1 | 11.4 | 18,721.1 | 11.3 | 17,723.2 | 11.4 |
| Unattributable | 6,734.8 | 3.6 | 6,386.4 | 3.6 | 6,373.4 | 3.8 | 5,471.1 | 3.5 |
| Physician Care Expenditures | 23,780.3 | 12.6 | 21,554.3 | 12.2 | 20,046.9 | 12.1 | 18,556.2 | 11.9 |
| Attributable | 23,780.3 | 12.6 | 21,554.3 | 12.2 | 20,046.9 | 12.1 | 18,556.2 | 11.9 |
| Unattributable | 0.0 | 0.0 | 0.0 | 0.0 | 0.0 | 0.0 | 0.0 | 0.0 |
| Other Direct Costs | 71,179.6 | 37.7 | 66,520.5 | 37.7 | 62,506.1 | 37.6 | 58,366.7 | 37.5 |
| Attributable | 0.0 | 0.0 | 0.0 | 0.0 | 0.0 | 0.0 | 0.0 | 0.0 |
| Unattributable | 71,179.6 | 37.7 | 66,520.5 | 37.7 | 62,506.1 | 37.6 | 58,366.7 | 37.5 |
| Total Direct Costs | 172,004.8 | 91.1 | 160,244.3 | 90.9 | 150,838.0 | 90.7 | 140,729.0 | 90.4 |
| Indirect Costs | ||||||||
| Mortality Costs | 454.0 | 0.2 | 441.7 | 0.3 | 440.8 | 0.3 | 431.5 | 0.3 |
| Attributable | 454.0 | 0.2 | 441.7 | 0.3 | 440.8 | 0.3 | 431.5 | 0.3 |
| Unattributable | 0.0 | 0.0 | 0.0 | 0.0 | 0.0 | 0.0 | 0.0 | 0.0 |
| Morbidity Costs | 16,396.4 | 8.7 | 15,612.7 | 8.9 | 15,010.0 | 9.0 | 14,475.2 | 9.3 |
| Attributable | 10,208.3 | 5.4 | 9,682.8 | 5.5 | 9,300.6 | 5.6 | 8,969.9 | 5.8 |
| UnattributableTable 2 - Footnote 3 | 6,188.07 | 3.3 | 5,930.0 | 3.4 | 5,709.4 | 3.4 | 5,505.3 | 3.5 |
| Total Indirect Costs | 16,850.4 | 8.9 | 16,054.5 | 9.1 | 15,450.7 | 9.3 | 14,906.7 | 9.6 |
| Total Cost of Illness | 188,855.2 | 100.0 | 176,298.8 | 100.0 | 166,288.8 | 100.0 | 155,635.8 | 100.0 |
Footnotes:
|
||||||||
| Diagnostic Category | Hospital Care | % of Hospital Care | Drug | % of Drug | Physician Care | % of Physician Care | Other Direct | % of Other Direct | Total Direct | % of Total Direct | Direct Rank |
|---|---|---|---|---|---|---|---|---|---|---|---|
| Certain Infectious and Parasitic Diseases | 871.1 | 1.8 | 696.7 | 2.5 | 509.3 | 2.1 | 0.0 | 0.0 | 2,077.0 | 1.2 | 16 |
| Respiratory Infections | 958.9 | 2.0 | 509.3 | 1.8 | 1,125.2 | 4.7 | 0.0 | 0.0 | 2,593.3 | 1.5 | 12 |
| Maternal Conditions | 1,382.7 | 2.8 | 58.5 | 0.2 | 792.1 | 3.3 | 0.0 | 0.0 | 2,233.3 | 1.3 | 13 |
| Perinatal Conditions | 928.6 | 1.9 | 9.8 | 0.0 | 42.0 | 0.2 | 0.0 | 0.0 | 980.4 | 0.6 | 18 |
| Nutritional Deficiencies | 108.7 | 0.2 | 77.2 | 0.3 | 158.0 | 0.7 | 0.0 | 0.0 | 343.9 | 0.2 | 22 |
| Malignant Neoplasms | 2,329.4 | 4.7 | 467.1 | 1.7 | 1,031.7 | 4.3 | 0.0 | 0.0 | 3,828.2 | 2.2 | 8 |
| Other Neoplasms | 431.3 | 0.9 | 49.8 | 0.2 | 484.0 | 2.0 | 0.0 | 0.0 | 965.1 | 0.6 | 19 |
| Diabetes Mellitus | 492.7 | 1.0 | 1,198.2 | 4.3 | 487.3 | 2.0 | 0.0 | 0.0 | 2,178.2 | 1.3 | 14 |
| Endocrine Disorders | 423.4 | 0.9 | 1,728.4 | 6.2 | 587.5 | 2.5 | 0.0 | 0.0 | 2,739.2 | 1.6 | 11 |
| Neuropsychiatric Conditions | 5,520.3 | 11.2 | 3,551.3 | 12.7 | 2,347.0 | 9.9 | 0.0 | 0.0 | 11,418.6 | 6.6 | 2 |
| Sense Organ Diseases | 520.3 | 1.1 | 283.4 | 1.0 | 1,329.3 | 5.6 | 0.0 | 0.0 | 2,132.9 | 1.2 | 15 |
| Cardiovascular Diseases | 5,068.0 | 10.3 | 4,272.7 | 15.3 | 2,352.0 | 9.9 | 0.0 | 0.0 | 11,692.7 | 6.8 | 1 |
| Respiratory Diseases | 1,818.5 | 3.7 | 1,197.2 | 4.3 | 632.6 | 2.7 | 0.0 | 0.0 | 3,648.3 | 2.1 | 10 |
| Digestive Diseases | 2,839.4 | 5.8 | 1,434.0 | 5.1 | 1,232.6 | 5.2 | 0.0 | 0.0 | 5,506.0 | 3.2 | 5 |
| Genitourinary Diseases | 1,499.2 | 3.1 | 670.8 | 2.4 | 1,626.4 | 6.8 | 0.0 | 0.0 | 3,796.5 | 2.2 | 9 |
| Skin Diseases | 410.3 | 0.8 | 680.5 | 2.4 | 833.1 | 3.5 | 0.0 | 0.0 | 1,923.9 | 1.1 | 17 |
| Musculoskeletal Diseases | 1,795.9 | 3.7 | 1,982.5 | 7.1 | 2,002.5 | 8.4 | 0.0 | 0.0 | 5,780.8 | 3.4 | 4 |
| Congenital Anomalies | 302.9 | 0.6 | 35.0 | 0.1 | 139.0 | 0.6 | 0.0 | 0.0 | 477.0 | 0.3 | 20 |
| Oral Conditions | 153.6 | 0.3 | 42.3 | 0.2 | 214.1 | 0.9 | 0.0 | 0.0 | 410.0 | 0.2 | 21 |
| Injuries | 3,395.8 | 6.9 | 259.7 | 0.9 | 1,435.0 | 6.0 | 0.0 | 0.0 | 5,090.5 | 3.0 | 7 |
| Symptoms, Signs and Ill-Defined Conditions | 2,131.7 | 4.3 | 1,283.1 | 4.6 | 1,846.1 | 7.8 | 0.0 | 0.0 | 5,260.8 | 3.1 | 6 |
| Factors Influencing Health and Contact with Health Services | 5,543.4 | 11.3 | 700.4 | 2.5 | 2,573.7 | 10.8 | 0.0 | 0.0 | 8,817.5 | 5.1 | 3 |
| Total EBIC Cost Estimates | 38,926.1 | 79.2 | 21,187.6 | 75.9 | 23,780.3 | 100.0 | 0.0 | 0.0 | 83,894.0 | 48.8 | |
| Unattributable CostsTable 3 - Footnote 1 | 10,196.4 | 20.8 | 6,734.8 | 24.1 | 0.0 | 0.0 | 71,179.6 | 100.0 | 88,110.8 | 51.2 | |
| Total CostsTable 3 - Footnote 2 | 49,122.5 | 100.0 | 27,922.4 | 100.0 | 23,780.3 | 100.0 | 71,179.6 | 100.0 | 172,004.8 | 100.0 | |
Footnotes:
|
|||||||||||
| Diagnostic Category | Mortality | % of Mortality | Morbidity | % of Morbidity | Total Indirect | % of Total Indirect | Indirect Rank | Total (Direct + Indirect) |
% of Total (Direct + Indirect) | Total (Direct + Indirect) Rank |
|---|---|---|---|---|---|---|---|---|---|---|
| Certain Infectious and Parasitic Diseases | 13.0 | 2.9 | 826.9 | 5.0 | 839.9 | 5.0 | 5 | 2,916.9 | 1.5 | 12 |
| Respiratory Infections | 5.1 | 1.1 | 2,812.4 | 17.2 | 2,817.6 | 16.7 | 2 | 5,410.8 | 2.9 | 7 |
| Maternal Conditions | 0.2 | 0.0 | - | - | 0.2 | 0.0 | 18 | 2,233.5 | 1.2 | 15 |
| Perinatal Conditions | 0.1 | 0.0 | - | - | 0.1 | 0.0 | 19 | 980.5 | 0.5 | 18 |
| Nutritional Deficiencies | 0.3 | 0.1 | - | - | 0.3 | 0.0 | 17 | 344.2 | 0.2 | 22 |
| Malignant Neoplasms | 166.0 | 36.6 | 420.0 | 2.6 | 586.1 | 3.5 | 6 | 4,414.2 | 2.3 | 9 |
| Other Neoplasms | 1.8 | 0.4 | - | - | 1.8 | 0.0 | 15 | 966.9 | 0.5 | 19 |
| Diabetes Mellitus | 12.3 | 2.7 | 132.9 | 0.8 | 145.2 | 0.9 | 10 | 2,323.4 | 1.2 | 14 |
| Endocrine Disorders | 6.3 | 1.4 | - | - | 6.3 | 0.0 | 13 | 2,745.6 | 1.5 | 13 |
| Neuropsychiatric Conditions | 19.1 | 4.2 | 1,024.4 | 6.2 | 1,043.4 | 6.2 | 4 | 12,462.0 | 6.6 | 1 |
| Sense Organ Diseases | 0.0 | 0.0 | - | - | 0.0 | 0.0 | 21 | 2,132.9 | 1.1 | 16 |
| Cardiovascular Diseases | 92.4 | 20.4 | 269.6 | 1.6 | 362.0 | 2.1 | 7 | 12,054.7 | 6.4 | 2 |
| Respiratory Diseases | 11.3 | 2.5 | 110.0 | 0.7 | 121.3 | 0.7 | 11 | 3,769.6 | 2.0 | 11 |
| Digestive Diseases | 24.5 | 5.4 | 151.1 | 0.9 | 175.6 | 1.0 | 8 | 5,681.6 | 3.0 | 6 |
| Genitourinary Diseases | 3.8 | 0.8 | 156.5 | 1.0 | 160.3 | 1.0 | 9 | 3,956.8 | 2.1 | 10 |
| Skin Diseases | 0.4 | 0.1 | - | - | 0.4 | 0.0 | 16 | 1,924.3 | 1.0 | 17 |
| Musculoskeletal Diseases | 2.5 | 0.5 | 1,395.5 | 8.5 | 1,398.0 | 8.3 | 3 | 7,178.8 | 3.8 | 5 |
| Congenital Anomalies | 2.9 | 0.6 | - | - | 2.9 | 0.0 | 14 | 479.8 | 0.3 | 20 |
| Oral Conditions | 0.0 | 0.0 | - | - | 0.0 | 0.0 | 20 | 410.0 | 0.2 | 21 |
| Injuries | 84.6 | 18.6 | 2,909.0 | 17.7 | 2,993.5 | 17.8 | 1 | 8,084.1 | 4.3 | 4 |
| Symptoms. Signs and Ill-Defined Conditions | 7.5 | 1.6 | - | - | 7.5 | 0.0 | 12 | 5,268.3 | 2.8 | 8 |
| Factors Influencing Health and Contact with Health Services | - | - | - | - | 0.0 | 0.0 | 22 | 8,817.5 | 4.7 | 3 |
| Total EBIC Cost Estimates | 454.0 | 100.0 | 10,208.3 | 62.3 | 10,662.3 | 63.3 | 94 556.4 | 50.1 | ||
| Unattributable CostsTable 3B - Footnote 1 | 0.0 | 0.0 | 6,188.1 | 37.7 | 6,188.1 | 36.7 | 94 298.8 | 49.9 | ||
| Total CostsTable 3B - Footnote 2 | 454.0 | 100.0 | 16,396.4 | 100.0 | 16,850.4 | 100.0 | 188,855.2 | 100.0 | ||
Footnotes:
|
||||||||||
Figure 1: Cost Distribution by Direct Cost Component for the Five Diagnostic Categories with the Highest Total Direct Costs, Canada, 2008

Notes: 'Other diagnostic categories' include the costs from all other EBIC diagnostic categories not individually displayed in the figure.
Any discrepancies may be due to rounding.
Text Equivalent - Figure 1
| Diagnostic Category | Percentage of Costs Attributed to Hospital Care | Percentage of Costs Attributed to Drugs | Percentage of Costs Attributed to Physician Care |
|---|---|---|---|
| Cardiovascular Diseases ($11.7 billion) |
43.3 | 36.5 | 20.1 |
| Neuropsychiatric Conditions ($11.4 billion) | 48.3 | 31.1 | 20.6 |
| Digestive Diseases ($5.5 billion) |
51.6 | 26.0 | 22.4 |
| Musculoskeletal Diseases ($5.8 billion) |
31.1 | 34.3 | 34.6 |
| Injuries ($5.1 billion) |
66.7 | 5.1 | 28.2 |
| Other Diagnostic Categories ($44.4 billion) | 45.7 | 21.8 | 32.5 |
Figure 2: Cost Distribution by Indirect Cost Component for the Five Diagnostic Categories with the Highest Total Indirect Costs, Canada, 2008

Notes: Mortality costs represented 0.2% of costs in the ‘Respiratory infections’ and ‘Musculoskeletal diseases’ categories; these numeric values are represented but not displayed in the figure. 'Other diagnostic categories' include the costs from all other EBIC diagnostic categories not individually displayed in the figure. Any discrepancies may be due to rounding.
Text Equivalent - Figure 2
| Diagnostic Category | Percentage of Costs Attributed to Mortality | Percentage of Costs Attributed to Morbidity |
|---|---|---|
| Injuries ($3.0 billion) |
2.8 | 97.2 |
| Respiratory Infections ($2.8 billion) |
0.2 | 99.8 |
| Musculoskeletal Diseases ($1.4 billion) |
0.2 | 99.8 |
| Neuropsychiatric Conditions ($1.0 billion) |
1.8 | 98.2 |
| Certain Infectious and Parasitic Diseases ($0.8 billion) |
1.5 | 98.5 |
Figure 3: Cost Distribution by Cost Component for the Five Diagnostic Categories with the Highest Total Costs, Canada, 2008

Notes: Mortality costs represented 0.2%, 0.8%, 1.1%, 0.0%, 0.4% and 0.5% of costs in the ‘Neuropsychiatric conditions’, ‘Cardiovascular diseases’, ‘Injuries’, ‘Musculoskeletal diseases’, ‘Digestive diseases’ and ‘Other diagnostic categories’ respectively; these numeric values are represented but not displayed in the figure. 'Other diagnostic categories' include the costs from all other EBIC diagnostic categories not individually displayed in the figure. Any discrepancies may be due to rounding.
Text Equivalent - Figure 3
| Diagnostic Category | Percentage of Costs Attributed to Hospital Care | Percentage of Costs Attributed to Drugs | Percentage of Costs Attributed to Physician Care | Percentage of Costs Attributed to Mortality | Percentage of Costs Attributed to Morbidity |
|---|---|---|---|---|---|
| Neuropsychiatric Conditions ($12.5 billion) |
44.3 | 28.5 | 18.8 | 0.2 | 8.2 |
| Cardiovascular Diseases ($12.1 billion) |
42.0 | 35.4 | 19.5 | 0.8 | 2.2 |
| Injuries ($8.1 billion) |
42.0 | 3.2 | 17.8 | 1.1 | 36.0 |
| Musculoskeletal Diseases ($7.2 billion) |
25.0 | 27.6 | 27.9 | 0.0 | 19.4 |
| Digestive Diseases ($5.7 billion) |
50.0 | 25.2 | 21.7 | 0.4 | 2.7 |
| Other Diagnostic Categories ($49.1 billion) |
41.4 | 19.7 | 29.4 | 0.5 | 9.1 |
Figure 4: Direct Cost Distribution by Sex, Canada, 2008

Notes: The above figure represents the cost distribution by sex for total direct costs of $83.9 billion.
Any discrepancies may be due to rounding.
Text Equivalent - Figure 4
In 2008, males and females accounted for 45.9% and 54.1% the direct costs ($83.9 billion) respectively.
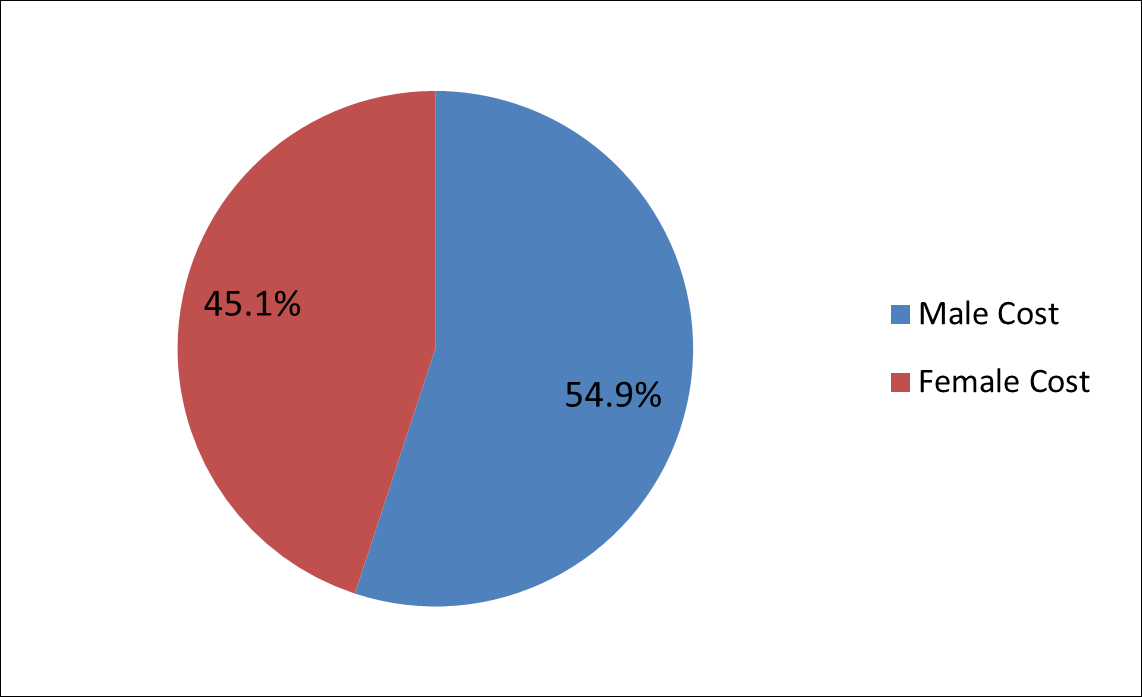
Figure 5: Indirect Cost Distribution by Sex, Canada, 2008

Notes: The above figure represents the cost distribution by sex for total indirect costs of $16.9 billion.
Any discrepancies may be due to rounding.
Text Equivalent - Figure 5
In 2008, males and females accounted for 54.9% and 45.1% the indirect costs ($16.9 billion) respectively.
Figure 6: Total Cost Distribution by Sex, Canada, 2008

Notes: The above figure represents the cost distribution by sex for total costs of $100.7 billion.
Any discrepancies may be due to rounding.
Text Equivalent - Figure 6
In 2008, males and females accounted for 47.4% and 52.6% the indirect costs ($100.7 billion) respectively.
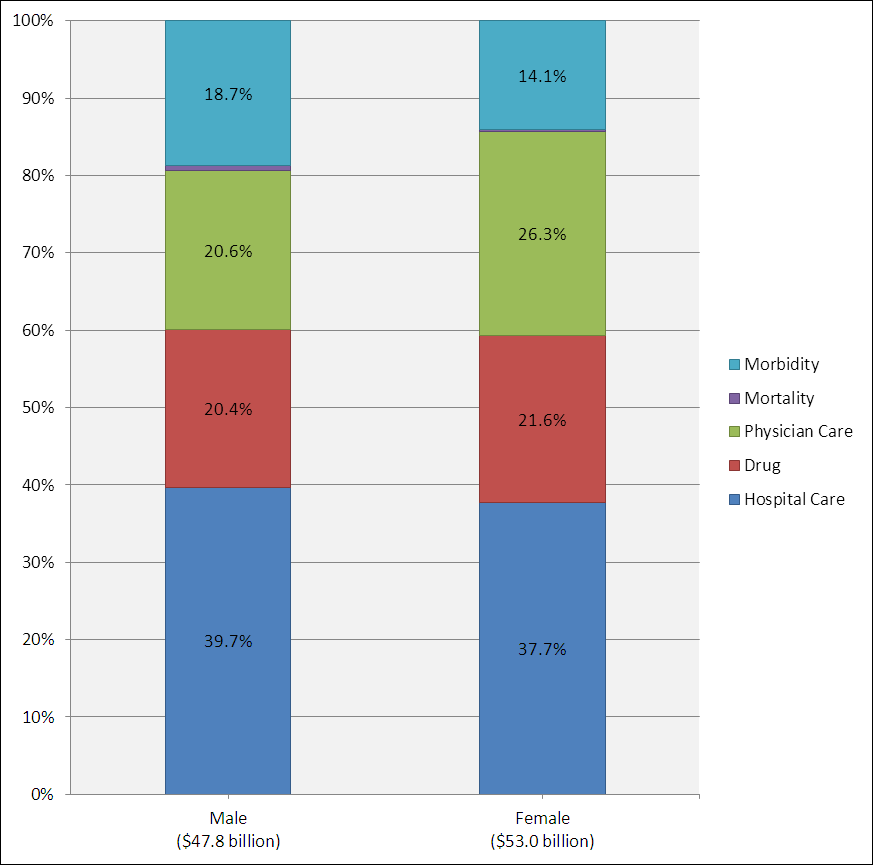
Figure 7: Cost Distribution by Sex and Cost Component, Canada, 2008

Notes: Mortality costs for males and females represented 0.7% and 0.2% of totals costs respectively; this numeric value is represented but not displayed in the figure. Any discrepancies may be due to rounding.
Text Equivalent - Figure 7
| Sex | Percentage of Costs Attributed to Hospital Care | Percentage of Costs Attributed to Drugs | Percentage of Costs Attributed to Physician Care | Percentage of Costs Attributed to Mortality | Percentage of Costs Attributed to Morbidity |
|---|---|---|---|---|---|
| Male ($47.8 billion) |
39.7 | 20.4 | 20.6 | 0.7 | 18.7 |
| Female ($53.0 billion) |
37.7 | 21.6 | 26.3 | 0.2 | 14.1 |
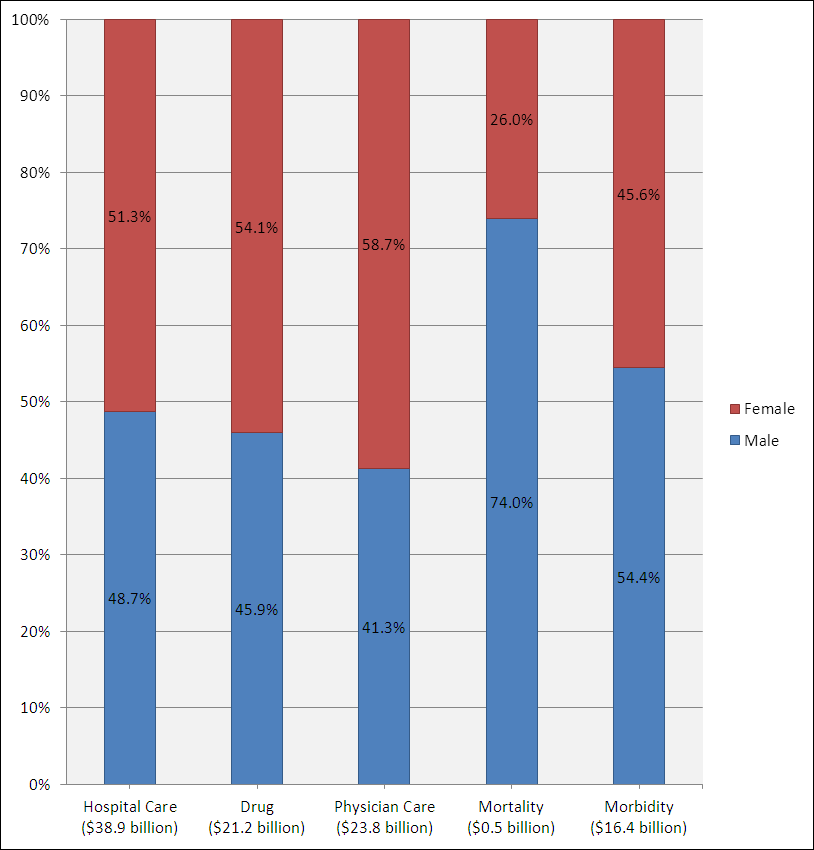
Figure 8: Cost Distribution by Cost Component and Sex, Canada, 2008

Note: Any discrepancies may be due to rounding.
Text Equivalent - Figure 8
| Cost Component | Percentage of Costs Attributed to Males | Percentage of Costs Attributed to Females |
|---|---|---|
| Hospital Care ($38.9 billion) |
48.7 | 51.3 |
| Drug ($21.2 billion) |
45.9 | 54.1 |
| Physician Care ($23.8 billion) |
41.3 | 58.7 |
| Mortality ($0.5 billion) |
74.0 | 26.0 |
| Morbidity ($16.4 billion) |
54.4 | 45.6 |
Figure 9: Direct Cost Distribution by Age Group, Canada, 2008

Notes: The above figure represents the cost distribution by age group for total direct costs of $83.9 billion.
Any discrepancies may be due to rounding.
Text Equivalent - Figure 9
| Age Group | Percentage of Direct Costs |
|---|---|
| 0-14 years | 7.6 |
| 15-34 years | 15.0 |
| 35-54 years | 24.1 |
| 55-64 years | 16.2 |
| 65-74 years | 15.6 |
| 75+ years | 21.6 |
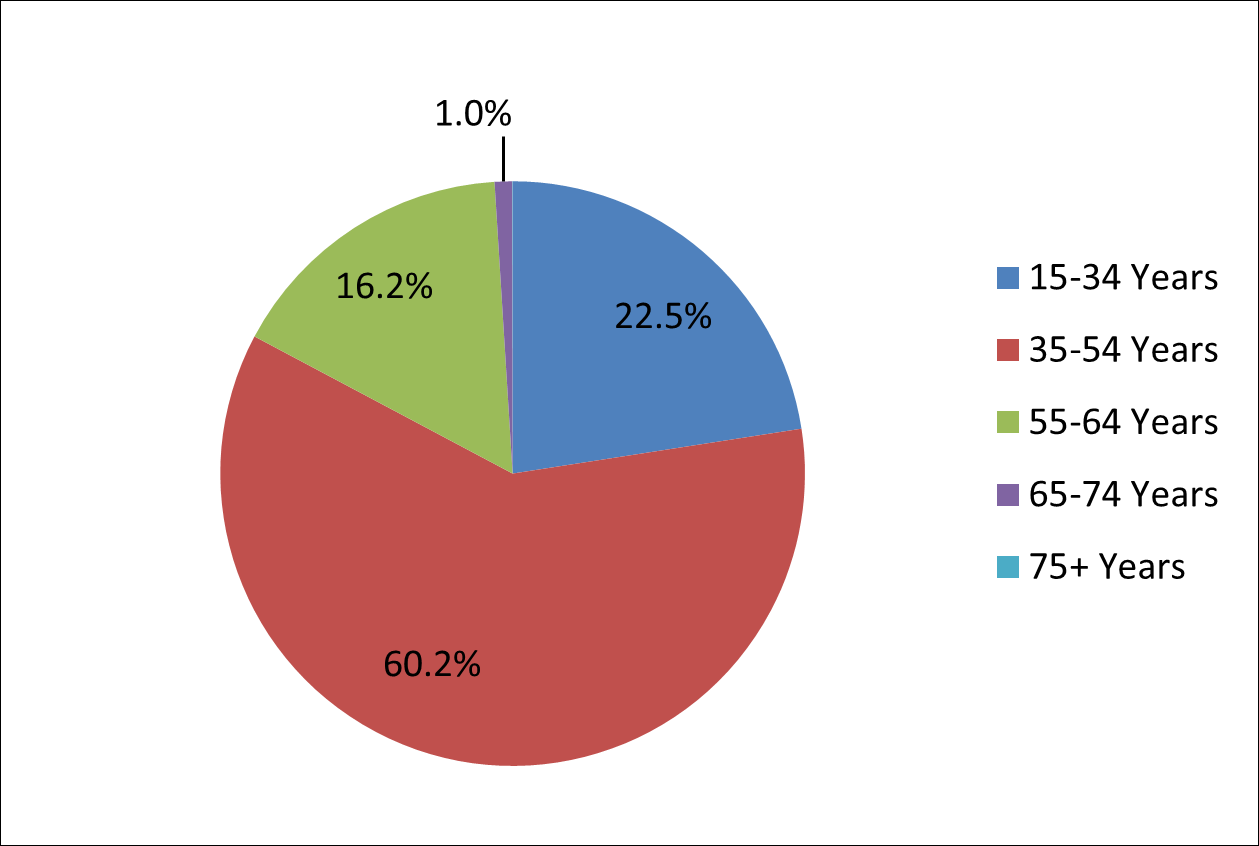
Figure 10: Indirect Cost Distribution by Age Group, Canada, 2008

Notes: The above figure represents the cost distribution by age group for total indirect costs of $16.9 billion. Individuals aged 75 years and older represented 0.0% of indirect costs; this numeric value is represented but not displayed in the figure. Any discrepancies may be due to rounding.
Text Equivalent - Figure 10
| Age Group | Percentage of Indirect Costs |
|---|---|
| 15-34 years | 22.5 |
| 35-54 years | 60.2 |
| 55-64 years | 16.2 |
| 65-74 years | 1.0 |
| 75+ years | 0.0 |
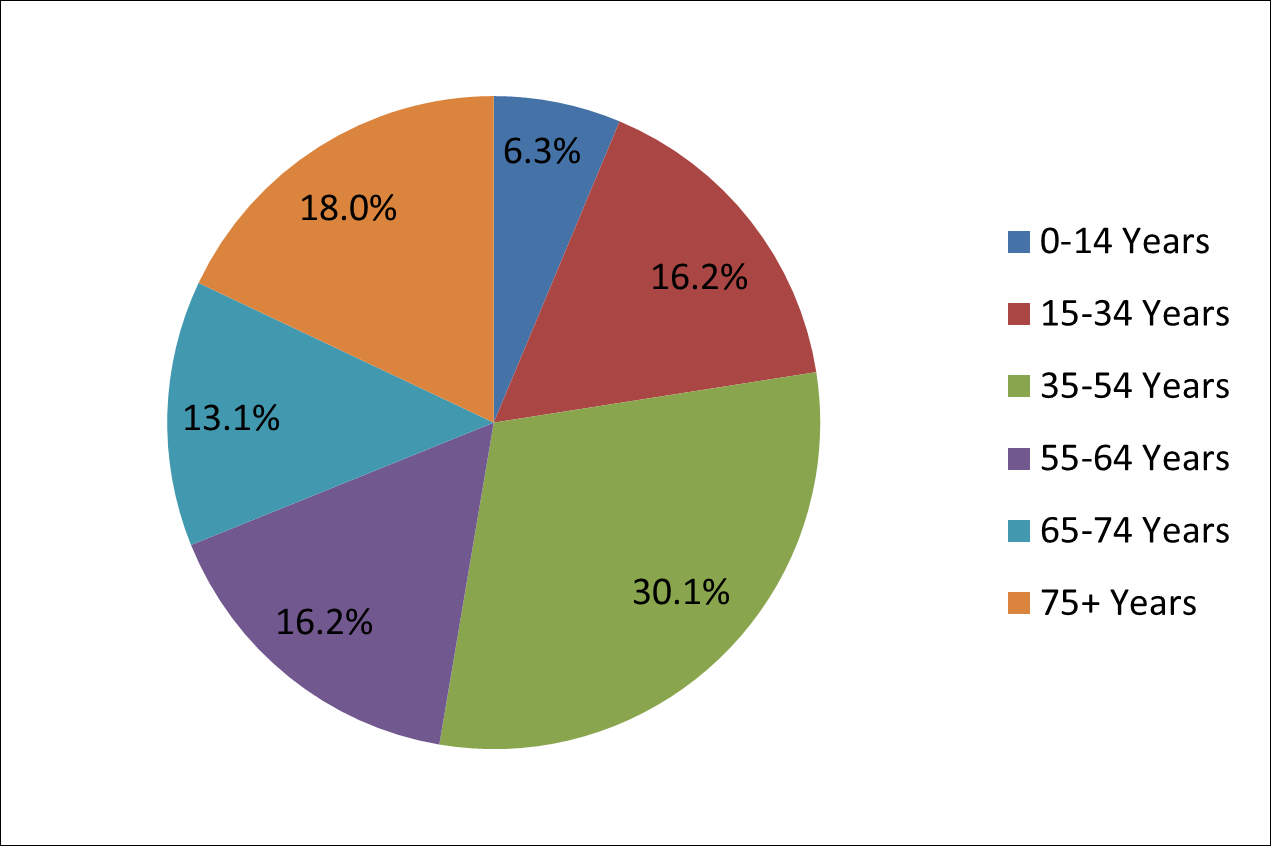
Figure 11: Total Cost Distribution by Age Group, Canada, 2008

Notes: The above figure represents the cost distribution by age group for total costs of $100.7 billion.
Any discrepancies may be due to rounding.
Text Equivalent - Figure 11
| Age Group | Percentage of Total Costs |
|---|---|
| 0-14 years | 6.3 |
| 15-34 years | 16.2 |
| 35-54 years | 30.1 |
| 55-64 years | 16.2 |
| 65-74 years | 13.1 |
| 75+ years | 18.0 |
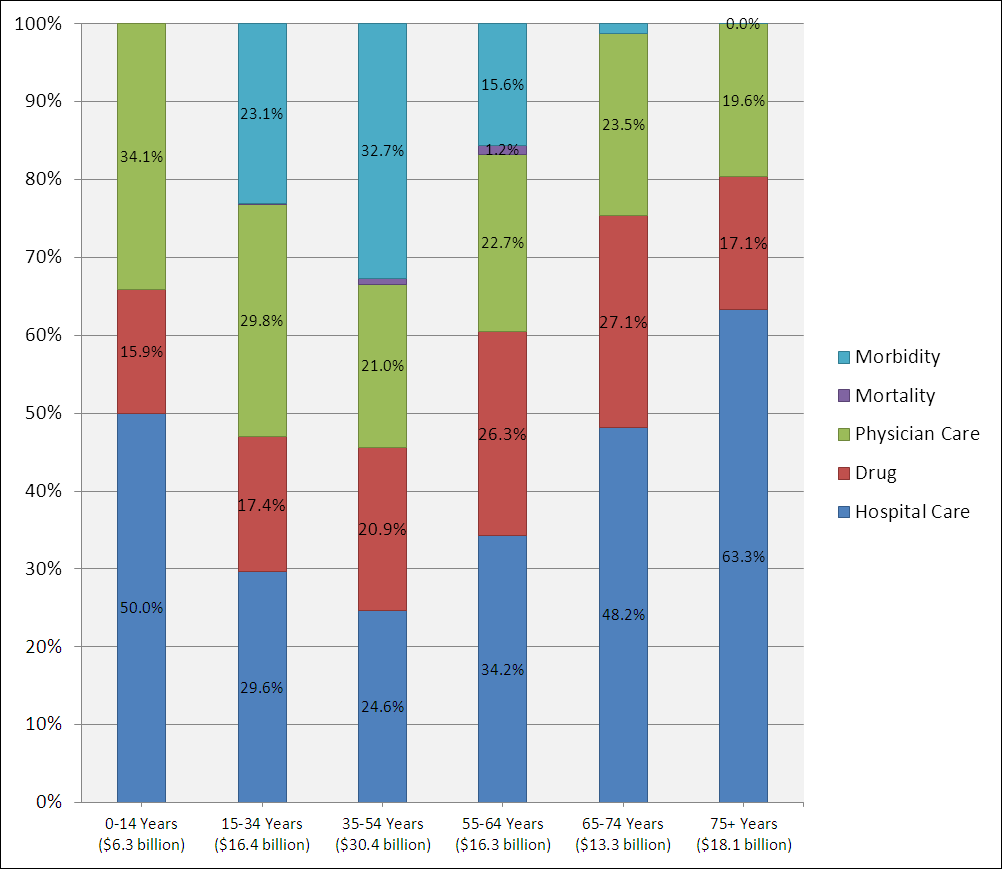
Figure 12: Cost Distribution by Age Group and Cost Component, Canada, 2008

Notes: Mortality costs for individuals aged 15-34 years and 35-54 years represented 0.2% and 0.8% of totals costs respectively; this numeric value is represented but not displayed in the figure. Similarly, morbidity costs for individuals aged 65-74 years represented 1.2% of total costs, this number is represented but not displayed in the figure. In this report, mortality and morbidity costs were only estimated for individuals aged 15-64 years and 15-75 years respectively. Any discrepancies may be due to rounding.
Text Equivalent - Figure 12
| Age Group | Percentage of Costs Attributed to Hospital Care | Percentage of Costs Attributed to Drugs | Percentage of Costs Attributed to Physician Care | Percentage of Costs Attributed to Mortality | Percentage of Costs Attributed to Morbidity |
|---|---|---|---|---|---|
| 0-14 years ($6.3 billion) |
50.0 | 15.9 | 34.1 | - | - |
| 15-34 years ($16.4 billion) |
29.6 | 17.4 | 29.8 | 0.2 | 23.1 |
| 35-54 years ($30.4 billion) |
24.6 | 20.9 | 21.0 | 0.8 | 32.7 |
| 55-64 years ($16.3 billion) |
34.2 | 26.3 | 22.7 | 1.2 | 15.6 |
| 65-74 years ($13.3 billion) |
48.2 | 27.1 | 23.5 | - | 1.2 |
| 75+ years ($18.1 billion) |
63.3 | 17.1 | 19.6 | - | 0.0 |
Figure 13: Cost Distribution by Cost Component and Age Group, Canada, 2008

Notes: Morbidity costs for individuals aged 65-74 years and 75+ years represented 1.0% and 0.0% of total morbidity costs respectively; these numeric values are represented but not displayed in the figure. In this report, mortality and morbidity costs were only estimated for individuals aged 15-64 years and 15-75 years respectively. Any discrepancies may be due to rounding.
Text Equivalent - Figure 13
| Cost Component | Percentage of Costs Attributed to Age Group 0-14 years | Percentage of Costs Attributed to Age Group 15-34 years | Percentage of Costs Attributed to Age Group 35-54 years | Percentage of Costs Attributed to Age Group 55-64 years | Percentage of Costs Attributed to Age Group 65-74 years | Percentage of Costs Attributed to Age Group 75+ years |
|---|---|---|---|---|---|---|
| Hospital Care ($38.9 billion) |
8.1 | 12.4 | 19.2 | 14.4 | 16.4 | 29.4 |
| Drug ($21.2 billion) |
4.8 | 13.4 | 30.0 | 20.3 | 17.0 | 14.6 |
| Physician Care ($23.8 billion) |
9.1 | 20.5 | 26.8 | 15.6 | 13.1 | 14.9 |
| Mortality ($0.5 billion) |
- | 6.2 | 51.8 | 42.0 | - | - |
| Morbidity ($16.4 billion) |
- | 23.0 | 60.5 | 15.5 | 1.0 | 0.0 |
Page details
- Date modified: