
Chronic fatigue syndrome and fibromyalgia in Canada: prevalence and associations with six health status indicators - HPCDP: Volume 35-1, March 2015
Volume 35 · Number 1 · March 2015
Health Promotion and Chronic Disease Prevention in Canada
Navigate This Article
Chronic fatigue syndrome and fibromyalgia in Canada: prevalence and associations with six health status indicators
C. Rusu, MD (1); M. E. Gee, MSc (1); C. Lagacé, MSc (1); M. Parlor, LLB (2)
https://doi.org/10.24095/hpcdp.35.1.02
This article has been peer reviewed.
Author references:
- Centre for Chronic Disease Prevention, Public Health Agency of Canada, Ottawa, Ontario, Canada
- National ME/FM Action Network, Nepean, Ontario, Canada
Correspondence: Claudia Lagacé, Centre for Public Health Infrastructure, Public Health Agency of Canada, 120 Colonnade Road, A.L. 6701A, Ottawa, ON K1A 0K9; Tel: 418-842-2685; Fax: 613-960-3966; Email: claudia.lagace@phac-aspc.gc.ca
Abstract
Introduction: Few studies have considered the factors independently associated with chronic fatigue syndrome (CFS) and/or fibromyalgia (FM) or considered the impact of these conditions on health status using population-based data.
Methods: We used data from the nationally representative 2010 Canadian Community Health Survey (n= 59 101) to describe self-reported health professional-diagnosed CFS and/or FM, and their associations with 6 health status indicators.
Results: In 2010, diagnosed CFS and FM are reported by 1.4% (95% confidence interval [CI]: 1.3%–1.6%) and 1.5% (1.4%–1.7%), respectively, of the Canadian household population aged 12 years and over, with comorbid CFS and FM affecting 0.3% (0.3%–0.4%) of that population. Prevalent CFS and/or FM were more common among women, adults aged 40 years and over, those with lowest income, and those with certain risk factors for chronic disease (i.e. obesity, physical inactivity and smoking). After controlling for differences between the groups, people with CFS and/or FM reported poorer health status than those with neither condition on 5 indicators of health status, but not on the measure of fair/poor mental health. Having both CFS and FM and having multiple comorbid conditions was associated with poorer health status.
Conclusion: Co-occurrence of CFS and FM and having other chronic conditions were strongly related to poorer health status and accounted for much of the differences in health status. Understanding factors contributing to improved quality of life in people with CFS and/or FM, particularly in those with both conditions and other comorbidities, may be an important area for future research.
Keywords: myalgic encephalomyelitis, fibromyalgia, health status, health surveys, cross-sectional studies
Introduction
In 2003, about 1.3% of the adult Canadian population reported having chronic fatigue syndrome (CFS) and 1.5% reported having fibromyalgia (FM).Footnote 1 CFS, or myalgic encephalomyelitis, is characterized by persistent and profound physical and cognitive fatigue, whereas FM is characterized by chronic and widespread musculoskeletal pain.Footnote 2 In addition, these 2 conditions often co-occur.Footnote 1, Footnote 2, Footnote 3,Footnote 4 Co-occurrence of multiple chronic conditions in the same individual increases the costs and intensifies the use of health care resourcesFootnote 5, Footnote 6 and, as demonstrated in the context of other chronic conditions, can profoundly affect people's health-related quality of life.Footnote 6, Footnote 7, Footnote 8, Footnote 9, Footnote 10
A few studies in CanadaFootnote 1, Footnote 2 and elsewhereFootnote 11, Footnote 12, Footnote 13 have considered the impact of CFS and FM on health status. Lavergne et al.Footnote 1 showed that Canadian patients with CFS/FM had poorer health status, measured using the Short Form-36, compared to the general Canadian population. In this tertiary care / referral clinic patient population, considered by the authors to be more impaired than other people of the same sex and age range with these disorders (e.g. people with CFS and/or FM selected as part of population-based surveys), lower functioning was associated with younger age at onset, lower socio-economic status, and CFS and FM coexisting.Footnote 2 Nonetheless, data from the national population-based 2003 Canadian Community Health Survey (CCHS) indicate that Canadians with CFS and FM report poorer general health and mental health, greater dissatisfaction with life, higher prevalence of mental illness, needing more assistance in the activities of daily living and using health care services more often.Footnote 1 These data also showed that being female, older, of lower income, and of lower educational attainment are associated with prevalent CFSFootnote 1 and FM.Footnote 1, Footnote 14 However, analyses did not consider whether these factors were independently associated with these conditions.
Using more recent data, from the 2010 CCHS, we sought to determine
- the factors independently associated with having CFS and FM;
- the impact of these conditions on health status; and
- the factors associated with poorer health status among Canadians with these conditions.
Methods
Data source
We analyzed data from the 2010 CCHS– Annual Component Share File. The CCHS is a cross-sectional survey conducted by Statistics Canada that collects information related to the health of Canadians (i.e. health status, health behaviours, chronic conditions, various demographic and socio-economic health determinants, etc.). The target population was aged 12 years and older and lived in private dwellings in the 10 provinces and 3 territories of Canada. The survey did not include institutional residents, full-time members of the Canadian Forces, or people living on Indian Reserves or Crown lands or in certain remote regions, which accounted for less than 2% of the overall Canadian population aged 12 years and older. Data were collected between January and December 2010. Further details on survey methodology, including strategies to ensure representativeness of the sample, have been published elsewhere.Footnote 15 The overall household-level response rate to the survey was 80.7% and person-level response rate was 88.6%, with a final sample size of 59 302 people aged 12 years or older who agreed to share their data with certain governmental partners.
Analytical strategy
We developed our analytical strategy in 3 interrelated stages:
- Covariates were identified a priori based on previous studies of CFS and FM, either using CCHS dataFootnote 1, Footnote 14 or conducted in clinical settings.Footnote 2, Footnote 3 We did not consider some potential covariates, namely disease severity, duration of illness, and stressful life events,Footnote 2 because the CCHS did not measure them.
- We examined bivariate relationships between potential covariates and CFS/FM.
- We retained covariates in multivariate models if they were associated with CFS and FM at the bivariate level.
Our analytical strategy was constrained by the available sample size. In order to produce reliable estimates for most health indicator variables and covariates, some response categories had to be combined with others and some variables were dichotomized. The sections below describe in details how each variable was analyzed.
CFS and FM
As part of the interview, respondents were asked "Do you have chronic fatigue syndrome?" and "Do you have fibromyalgia?" The following introduction was read to respondents at the beginning of the chronic conditions module: "Now I'd like to ask about certain long-term health conditions which you may have. We are interested in 'long-term conditions' which are expected to last or have already lasted 6 months or more and that have been diagnosed by a health professional." Answering "yes" to either question qualified a respondent as a case. No verification was done to confirm the diagnosis or to determine what case definition was used by the health professional who made the diagnosis.
People who either refused or did not state an answer to the questions about CFS or FM were excluded (n = 201), leaving 59 101 respondents available for analysis.
Covariates
Prevalence of CFS and FM were described by sex, age (12–39, 40–59 and 60+ years), ethnicity (white, Aboriginal, other), highest level of household education (postsecondary graduate, some post-secondary, secondary graduate, less than secondary education), marital status (single vs. widowed/separated/divorced vs. married/common-law) and adjusted income adequacy quintile. For the latter, respondents were divided into income quintiles based on the ratio of their total household income to the low income cut-off corresponding to their household and community size, as derived by Statistics Canada; this measure provides, for each respondent, a relative measure of their household income to the household incomes of all other respondents.Footnote 15
For the education variable, we included a "not stated" category because 8% of participants did not provide a response to the question.
For respondents with missing income information, Statistics Canada uses nearest neighbour donor imputation that models income based on family structure, sociodemographics, some health variables and income based on aggregate tax information; income was imputed for 33% of respondents (18% based on fully reported income; 4% based on partially reported income; and 12% without income information).Footnote 15 We also included a "not stated" category for the remaining 2.4% who had missing values for the income variable; this proportion represents the residents of the 3 territories, for whom Statistics Canada does not calculate an adjusted income adequacy quintile.
Prevalence of CFS and FM were also described by body mass index (BMI), based on self-reported height and weight (underweight/normal weight < 25 kg/m2, overweight 25–29 kg/m2; and obese ≥ 30 kg/m2), alcohol consumption (weekly alcohol consumption, less than weekly and did not consume any alcohol in the past 12 months), smoking status (never, former, current), fruit and vegetable consumption (< 5 vs. ≥ 5 servings/day) and physical activity (active, moderately active, inactive). The physical activity index is based on total estimated daily energy expenditure calculated from self-reported frequency and duration of leisure-time and transportation-related physical activities for the 3 months prior to the interview.Footnote 15
We also examined the presence of other chronic conditions. We defined comorbidity as the total number of other chronic conditions reported and categorized these in 2 groups: less than 3 versus 3 or more. This cut-off was determined based on the results of our bivariate analysis that showed that a feature of CFS and FM is that almost all of respondents with the conditions had at least 1 or 2 other chronic conditions. The chronic conditions included in the 2010 CCHS were asthma, arthritis, back problems, chronic obstructive pulmonary disease (COPD), bowel disorders, multiple chemical sensitivities, migraine, high blood pressure, heart disease, diabetes, cancer, stomach ulcer, urinary incontinence, mood disorder, anxiety disorder, Alzheimer or other dementia, amyotrophic lateral sclerosis, cerebral palsy, dystonia, epilepsy, hydrocephalus, Huntington disease, muscular dystrophy, multiple sclerosis, Parkinson disease, spina bifida, stroke, Tourette syndrome and neurological conditions caused by brain and/or spinal cord injury and/or tumour.
Health status indicators
Six self-reported health status indicators were estimated among Canadians with both CFS and FM, CFS only, FM only and neither CFS nor FM: fair/poor general health, fair/poor mental health, activity limitations, help needed for tasks, severe level of impairment and presence of pain.
- Fair/poor general and mental health. We based general health and mental health status on the self-report items "In general, would you say your health is: excellent, very good, good, fair, poor?" and "In general, would you say your mental health is: excellent, very good, good, fair, poor?" We dichotomized the responses as fair/ poor versus excellent/very good/good for each respective question.
- Activity limitations. We derived a measure of the limitations in a respondent's daily activities based on the responses—often, sometimes or never—to a series of 5 questions:
- "Do you have any difficulty hearing, seeing, communicating, walking, climbing stairs, bending, learning or doing any similar activities?" and "Does a long-term physical condition or mental condition or health problem reduce the amount or the kind of activity you can do…
- at home?…
- at school?…
- at work?…
- in other activities, for example, transportation or leisure?"
- Help needed for tasks. We classified respondents as needing help for tasks if they reported requiring the help of another person to perform any 1 of 6 activities of daily living: preparing meals, getting to appointments/running errands, doing housework, personal care, moving about inside the house and looking after personal finances.
- Severe level of impairment. We measured health-related quality of life using the Health Utilities Index (HUI). The HUI health states are defined by 8 attributes (vision, hearing, speech, ambulation, dexterity, emotion, cognition, and pain and discomfort), with 5 or 6 levels of functioning for each attribute. A utility function is used to obtain an overall score for health states that range from -0.36 to 1.0 (-0.36 = health status worse than death, 0.0 = health status equal to death and 1.0 = perfect health). We grouped HUI scores into 2 categories reflecting level of impairment: none to moderate (0.70–1.00) and severe (< 0.70).
- Presence of pain was assessed with the following question: "Are you usually free of pain or discomfort?" [Yes vs. no].
Statistical analysis
We analyzed data using SAS Enterprise Guide version 5.1 (SAS Institute Inc., Cary, NC, US). Significance was specified as a p value of less than 0.05 in all analyses. To account for sample allocation and survey design, all estimates were weighted using survey weights generated by Statistics Canada, and 95% confidence intervals (CI) were estimated using bootstrap resampling method. Associations were quantified using prevalence ratios (PRs) estimated using multivariate binomial regression, using an intercept of -4 to improve convergence.Footnote 16
Results
Prevalence of CFS and FM
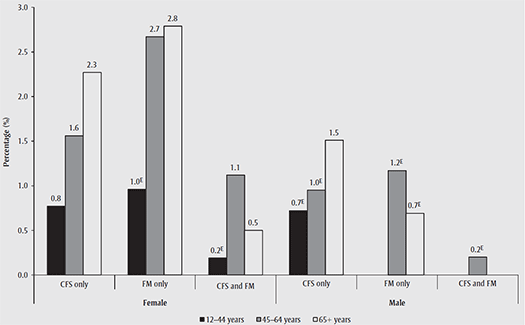
In 2010, about 411 000 (1.4%; 95% CI: 1.3%–1.6%) and 444 000 (1.5%; 95% CI: 1.4%–1.7%) of Canadians aged 12 years and older reported having been diagnosed with CFS and FM, respectively. About 0.3% (95% CI: 0.3%–0.4%) of the total household population reported having both conditions. Approximately 1 in 4 people with CFS (23.0%) also reported having FM, and 1 in 5 people with FM (21.2%) also reported having CFS. Overall, the prevalence of CFS and/or FM was higher in women across all age groups (Figure 1).
FIGURE 1
Prevalence of chronic fatigue syndrome, fibromyalgia and both conditions by age and sex, Canadians 12 years and older, 2010 Canadian Community Health Survey
[FIGURE 1, Text Equivalent]
In 2010, about 411 000 (1.4%; 95% CI: 1.3%â€"1.6%) and 444 000 (1.5%; 95% CI: 1.4%â€"1.7%) of Canadians aged 12 years and older reported having been diagnosed with CFS and FM, respectively. About 0.3% (95% CI: 0.3%â€"0.4%) of the total household population reported having both conditions. Approximately 1 in 4 people with CFS (23.0%) also reported having FM, and 1 in 5 people with FM (21.2%) also reported having CFS. Overall, the prevalence of CFS and/or FM was higher in women across all age groups.
Abbreviations: CFS, chronic fatigue syndrome; FM, fibromyalgia.
Note: Prevalence estimates for males with FM only aged 12–44 and for males with comorbid FM and CFS aged 12–44 and 65+ are not shown due to high sampling variability.
E Interpret with caution – coefficient of variation between 16.6% and 33.3%.
Factors associated with prevalent CFS and FM
After adjusting for covariates, women, adults aged 40 years and over and those with the lowest income were more likely to report having been diagnosed with CFS or FM (Table 1). In addition, prevalent CFS was associated, in multivariate analysis, with physical inactivity, former or current smoking and less frequent consumption of alcohol. FM was associated with obesity and less than weekly or no consumption of alcohol. Comorbidities were largely present in people with CFS and/or FM, as 65.2% (95% CI: 59.9–70.6) reported 3 or more comorbidities.
| Characteristics | Chronic Fatigue Syndrome | Fibromyalgia | ||||
|---|---|---|---|---|---|---|
| N | % | Multivariate PR (95% CI) | N | % | Multivariate PR (95% CI) | |
| Sex | ||||||
| Male | 313 | 1.0 | Referent | 157 | 0.7Reference E | Referent |
| Female | 693 | 1.8 | 1.7 (1.2–2.2) | 956 | 2.4 | 3.5 (2.3–5.4) |
| Age, years | ||||||
| 12–39 | 160 | 0.8 | Referent | 103 | 0.4Reference E | Referent |
| 40–59 | 378 | 1.8 | 2.1 (1.3–3.4) | 472 | 2.3 | 4.3 (2.7–6.9) |
| ≥ 60 | 468 | 2.2 | 2.0 (1.3–3.2) | 538 | 2.6 | 3.5 (2.2–5.8) |
| Ethnicity | ||||||
| White | 861 | 1.5 | Referent | 996 | 1.6 | Referent |
| Aboriginal off-reserve | 66 | 2.3Reference E | 1.5 (0.9–2.4) | 54 | 1.7Reference E | 1.2 (0.7–1.9) |
| Other | 60 | 1.2Reference E | 0.9 (0.5–1.5) | 47 | 1.2Reference E | 0.6 (0.3–1.5) |
| Education | ||||||
| Post-secondary graduate | 440 | 1.3 | Referent | 562 | 1.5 | Referent |
| Some post-secondary | 76 | 1.2Reference E | 1.4 (0.9–2.2) | 73 | 1.5Reference E | 1.0 (0.6–1.6) |
| Secondary school graduate | 180 | 1.7 | 0.9 (0.6–1.3) | 177 | 1.6 | 0.8 (0.5–1.1) |
| Less than secondary school | 287 | 1.8 | 1.1 (0.8–1.5) | 281 | 1.6 | 0.8 (0.6–1.1) |
| Not stated | 57 | 1.5Reference E | 1.4 (0.8–2.5) | 48 | 1.5Reference E | 1.2 (0.5–3.2) |
| Income adequacy | ||||||
| Quintile 5 (highest) | 94 | 0.8Reference E | Referent | 139 | 1.0 | Referent |
| Quintile 4 | 126 | 0.9 | 1.1 (0.7–1.8) | 172 | 1.7 | 1.7 (1.1–2.6) |
| Quintile 3 | 148 | 1.3 | 1.5 (0.8–2.5) | 190 | 1.4 | 1.2 (0.7–1.9) |
| Quintile 2 | 245 | 1.6 | 1.6 (1.0–2.7) | 252 | 1.4 | 1.1 (0.8–1.7) |
| Quintile 1 (lowest) | 379 | 2.5 | 2.3 (1.4–3.9) | 347 | 2.1 | 1.6 (1.0–2.4) |
| Not stated | – | Reference F | – | Reference F | ||
| Marital status | ||||||
| Single | 191 | 1.0 | Referent | 137 | 0.6 | Referent |
| Married/common-law | 462 | 1.4 | 1.1 (0.7–1.8) | 402 | 3.8 | 1.6 (0.9–2.8) |
| Widowed/separated/divorced | 348 | 2.7 | 1.0 (0.6–1.4) | 571 | 1.5 | 1.2 (0.7–1.8) |
| Body mass index, kg/m2 | ||||||
| < 25 | 375 | 1.1 | Referent | 371 | 1.2 | Referent |
| 25–29 | 281 | 1.4 | 1.2 (0.9–1.6) | 356 | 1.6 | 1.3 (0.9–1.7) |
| ≥ 30 | 254 | 1.8 | 1.2 (0.9–1.6) | 319 | 2.3 | 1.5 (1.1–2.1) |
| Physical activity | ||||||
| Active | 151 | 0.8 | Referent | 170 | 1.0 | Referent |
| Moderately active | 170 | 1.1 | 1.2 (0.8–1.9) | 234 | 1.1 | 0.8 (0.6–1.3) |
| Inactive | 624 | 1.8 | 1.6 (1.2–2.2) | 688 | 2.0 | 1.4 (1.0–1.8) |
| Drinks alcohol | ||||||
| At least weekly | 237 | 0.9 | Referent | 296 | 1.2 | Referent |
| Less than weekly | 419 | 1.7 | 1.5 (1.2–2.0) | 435 | 1.6 | 1.3 (1.0–1.8) |
| Not in past 12 months | 336 | 2.0 | 1.8 (1.3–2.6) | 369 | 2.1 | 1.8 (1.3–2.5) |
| Smoking status | ||||||
| Never smoker | 272 | 1.0 | Referent | 333 | 1.3 | Referent |
| Former smoker | 392 | 1.4 | 1.7 (1.2–2.4) | 499 | 1.8 | 1.2 (0.8–1.8) |
| Current smoker | 336 | 2.3 | 2.7 (1.9–3.8) | 276 | 1.6 | 1.3 (0.8–1.9) |
| Fruit and vegetable consumption | ||||||
| < 5 servings/day | 549 | 1.3 | Referent | 572 | 1.6 | Referent |
| ≥ 5 servings/day | 336 | 1.3 | 1.2 (0.9–1.6) | 467 | 1.4 | 0.9 (0.7–1.1) |
Abbreviations: CI, confidence interval; PR, prevalence ratio. Note: Statistically significant associations (p < 0.05) are bolded. |
||||||
Impact of CFS and/or FM on health status
Canadians with CFS and/or FM reported having indicators of poor health status more commonly than did Canadians with neither of these conditions (Table 2).
| Health status outcome | CFS and FM (n = 270) |
CFS only (n = 736) |
FM only (n = 843) |
Neither CFS nor FM (n = 57 252) |
|---|---|---|---|---|
| % (95% CI) | % (95% CI) | % (95% CI) | % (95% CI) | |
| Fair/poor general health | 77.0 (69.4–84.6) | 60.3 (54.0–66.6) | 38.7 (32.4–44.9) | 10.4 (10.0–10.8) |
| Fair/poor mental health | 40.9 (30.4–51.4) | 32.4 (25.5–39.2) | 16.5 (10.5–22.5)Reference E | 4.7 (4.4–5.0) |
| Severe level of impairment | 81.0 (74.0–87.9) | 53.3 (46.6–60.1) | 45.2 (38.0–52.5) | 11.5 (11.0–11.9) |
| Presence of pain | 94.8 (92.0–97.6) | 56.7 (50.1–63.3) | 73.6 (67.3–79.9) | 16.0 (15.4–16.5) |
| Activity limitation | 92.8 (88.1–97.4) | 79.0 (73.1–84.9) | 71.0 (63.9–78.2) | 27.3 (26.7–28.0) |
| Help needed for tasks | 65.5 (57.2–73.8) | 41.7 (35.3–48.1) | 31.6 (25.3–37.9) | 8.2 (7.9–8.6) |
|
Abbreviations: CFS, chronic fatigue syndrome; FM, fibromyalgia. |
||||
After controlling for differences in the number of other chronic conditions, sociodemographics and health risk factors, people with CFS and/or FM were 1.2 to 1.9 times more likely to report poor health status (5 indicators) compared to those without these conditions (Table 3). No significant difference was found for the sixth indicator, self-reported fair/poor mental health.
| CFS and/or FM | Fair/poor general health |
Fair/poor mental health |
Severe level of impairment |
Presence of pain |
Activity limitations |
Help needed for tasks |
|---|---|---|---|---|---|---|
| PR (95% CI) | PR (95% CI) | PR (95% CI) | PR (95% CI) | PR (95% CI) | PR (95% CI) | |
| Crude | ||||||
| Ref: neither CFS nor FM | 1.0 | 1.0 | 1.0 | 1.0 | 1.0 | 1.0 |
| CFS and FM | 7.4 (6.7–8.2) | 8.8 (6.7–11.6) | 7.0 (6.4–7.8) | 5.9 (5.7–6.2) | 3.4 (3.2–3.6) | 7.9 (6.9–9.2) |
| CFS only | 5.8 (5.2–6.5) | 6.9 (5.6–8.6) | 4.6 (4.1–5.3) | 3.5 (3.1–4.0) | 2.9 (2.7–3.1) | 5.0 (4.3–5.9) |
| FM only | 3.7 (3.2–4.4) | 3.5 (2.5–5.1) | 3.9 (3.1–5.3) | 4.6 (4.2–5.1) | 2.6 (2.3–2.9) | 3.8 (3.3–5.9) |
| Partially adjustedReference a | ||||||
| Ref: neither CFS nor FM | 1.0 | 1.0 | 1.0 | 1.0 | 1.0 | 1.0 |
| CFS and FM | 1.2 (0.9–1.7) | 1.0 (0.3–3.0) | 1.3 (0.7–2.3) | 1.7 (1.0–2.8) | 1.0 (0.5–2.1) | 1.4 (0.8–2.3) |
| CFS only | 1.4 (1.2–1.7) | 2.7 (1.9–3.8) | 1.3 (0.9–2.0) | 1.2 (1.0–1.4) | 1.2 (0.9–1.6) | 1.3 (0.9–1.9) |
| FM only | 1.2 (1.0–1.4) | 1.2 (0.6–2.4) | 1.3 (1.0–1.7) | 1.8 (1.5–2.1) | 1.2 (1.0–1.5) | 1.2 (0.9–1.7) |
| Fully adjustedReference b | ||||||
| Ref: neither CFS nor FM | 1.0 | 1.0 | 1.0 | 1.0 | 1.0 | 1.0 |
| CFS and FM | 1.4 (1.1–1.7) | 1.4 (0.9–2.2) | 1.5 (1.2–1.9) | 1.9 (1.2–2.9) | 1.1 (0.8–1.4) | 1.4 (1.1–1.7) |
| CFS only | 1.4 (1.2–1.6) | 1.4 (0.9–2.1) | 1.3 (1.1–1.5) | 1.2 (1.0–1.3) | 1.2 (1.0–1.3) | 1.2 (1.0–1.4) |
| FM only | 1.3 (1.1–1.5) | 0.8 (0.5–1.4) | 1.4 (1.2–1.6) | 1.8 (1.6–2.1) | 1.2 (1.1–1.4) | 1.2 (1.0–1.3) |
Abbreviations: CFS, chronic fatigue syndrome; CI, confidence interval; FM, fibromyalgia; PR, prevalence ratio; Ref, referent. Note: Statistically significant associations (p <.05) are shown in bold. |
||||||
Factors associated with poor health status in people with CFS and/or FM
The factors most consistently associated with indicators of poor health status among people with CFS or FM were
- being diagnosed with both CFS and FM;
- being diagnosed with 3 or more other chronic conditions; and
- being physically inactive (Table 4), independent of sociodemographic and health characteristics.
Compared to those with either CFS or FM, people with both conditions were 1.3 to 1.6 times more likely to report fair to poor general health, a severe level of impairment (based on health utility index score), pain, having activity limitations and requiring assistance in the activities of daily living. In addition, people with CFS and/or FM and with 3 or more other chronic conditions had 1.6 to 2.9 times the likelihood of reporting these indicators of poor health. Finally, people classified as physically inactive were 1.2 to 1.8 times more likely to report fair to poor general health, severe level of impairment, activity limitations and needing help with tasks. Furthermore, some sociodemographic and lifestyle factors were associated with 1 or 2 indicators of poor health status (Table 4).
| Characteristics | Fair/poor general health |
Fair/poor mental health |
Severe level of impairment |
Presence of pain |
Activity limitations |
Help needed for tasks |
|---|---|---|---|---|---|---|
| PR (95% CI) | PR (95% CI) | PR (95% CI) | PR (95% CI) | PR (95% CI) | PR (95% CI) | |
| CFS or FM comorbidity | ||||||
| Ref: either CFS or FM | 1.0 | 1.0 | 1.0 | 1.0 | 1.0 | 1.0 |
| Both CFS and FM | 1.3 (1.1–1.5) | 1.4 (0.9–2.0) | 1.3 (1.0–1.6) | 1.6 (1.1–2.4) | 1.3 (1.0–1.7) | 1.4 (1.1–1.7) |
| Number of other chronic conditions | ||||||
| Ref: 0–2 | 1.0 | 1.0 | 1.0 | 1.0 | 1.0 | 1.0 |
| ≥ 3 | 2.0 (1.4–2.7) | 2.7 (1.6–4.5) | 2.0 (1.3–3.1) | 1.6 (1.1–2.4) | 1.6 (1.1–2.2) | 2.9 (2.0–4.2) |
| Gender | ||||||
| Ref: female | 1.0 | 1.0 | 1.0 | 1.0 | 1.0 | 1.0 |
| Male | 1.1 (0.9–1.3) | 1.3 (0.9–1.8) | 1.2 (0.9–1.4) | 1.0 (0.8–1.2) | 0.9 (0.8–1.1) | 0.9 (0.7–1.1) |
| Age, years | ||||||
| Ref: 12–39 | 1.0 | 1.0 | 1.0 | 1.0 | 1.0 | 1.0 |
| 40–59 | 0.9 (0.6–1.4) | 0.8 (0.3–2.1) | 1.7 (0.9–3.2) | 2.3 (1.2–4.4) | 1.3 (0.9–1.8) | 1.4 (0.6–3.5) |
| 60+ | 0.8 (0.5–1.3) | 0.5 (0.2–1.3) | 1.5 (0.8–2.8) | 1.8 (1.0–3.3) | 1.2 (0.9–1.8) | 1.7 (0.7–4.2) |
| Ethnicity | ||||||
| Ref: White | 1.0 | 1.0 | 1.0 | 1.0 | 1.0 | 1.0 |
| Aboriginal off-reserve | 1.2 (0.9–1.6) | 1.6 (0.9–2.6) | 1.1 (0.8–1.4) | 1.1 (0.8–1.4) | 0.8 (0.6–1.1) | 1.2 (0.8–1.8) |
| Other | 0.9 (0.6–1.4) | 1.4 (0.8–2.5) | 0.8 (0.5–1.2) | 0.9 (0.6–1.3) | 0.7 (0.5–1.1) | 1.2 (0.7–1.9) |
| Education | ||||||
| Ref: Post-secondary graduate | 1.0 | 1.0 | 1.0 | 1.0 | 1.0 | 1.0 |
| Some post-secondary | 1.2 (1.0–1.6) | 1.5 (0.9–2.6) | 1.2 (0.9–1.5) | 1.0 (0.8–1.2) | 1.0 (0.8–1.2) | 1.2 (0.9–1.7) |
| High school graduate | 1.2 (1.0–1.6) | 0.7 (0.4–1.1) | 1.1 (0.9–1.4) | 1.0 (0.8–1.2) | 1.2 (1.0–1.5) | 1.1 (0.8–1.5) |
| Less than high school | 1.3 (1.1–1.6) | 1.2 (0.8–1.8) | 1.1 (0.9–1.3) | 0.9 (0.7–1.0) | 1.0 (0.8–1.2) | 0.9 (0.7–1.2) |
| Not stated | 1.3 (0.8–2.0) | 1.8 (0.6–5.5) | 0.8 (0.5–1.5) | 0.7 (0.4–1.3) | 1.0 (0.6–1.6) | 1.1 (0.6–1.5) |
| Income adequacy | ||||||
| Ref: Quintile 5 (highest) | 1.0 | 1.0 | 1.0 | 1.0 | 1.0 | 1.0 |
| Quintile 4 | 1.3 (0.9–1.9) | 1.4 (0.7–2.6) | 1.1 (0.8–1.7) | 1.2 (0.9–1.6) | 1.1 (0.8–1.5) | 1.0 (0.6–1.5) |
| Quintile 3 | 1.4 (1.0–2.1) | 1.7 (0.8–3.5) | 0.9 (0.6–1.3) | 1.1 (0.9–1.5) | 1.4 (1.0–1.9) | 1.2 (0.7–1.9) |
| Quintile 2 | 1.4 (1.0–1.9) | 1.9 (1.0–3.6) | 1.2 (0.9–1.7) | 1.3 (1.0–1.6) | 1.4 (1.0–1.6) | 1.3 (0.8–2.0) |
| Quintile 1 (lowest) | 1.5 (1.0–2.1) | 1.8 (1.0–3.3) | 1.3 (0.9–1.8) | 1.3 (1.0–1.8) | 1.5 (1.1–2.1) | 1.5 (1.0–2.3) |
| Not stated | 0.6 (1.0–2.3) | 0.5 (0.0–6.6) | 0.8 (0.4–1.5) | 1.0 (0.5–1.8) | 0.9 (0.4–1.8) | 0.7 (0.2–1.9) |
| Marital status | ||||||
| Ref: Single | 1.0 | 1.0 | 1.0 | 1.0 | 1.0 | 1.0 |
| Married/common-law | 1.1 (0.9–1.4) | 0.7 (0.5–1.2) | 0.8 (0.7–1.0) | 1.1 (0.9–1.4) | 0.8 (0.7–1.1) | 0.7 (0.5–1.0) |
| Widowed/separated/divorced | 1.1 (0.9–1.4) | 0.6 (0.4–0.9) | 0.9 (0.7–1.0) | 1.1 (0.9–1.4) | 0.9 (0.7–1.1) | 0.9 (0.7–1.2) |
| Body mass index, kg/m2 | ||||||
| Ref: < 25 | 1.0 | 1.0 | 1.0 | 1.0 | 1.0 | 1.0 |
| 25–29 | 0.9 (0.8–1.1) | 1.2 (0.8–1.8) | 1.0 (0.8–1.2) | 1.0 (0.9–1.3) | 1.3 (1.0–1.6) | 0.9 (0.7–1.2) |
| ≥ 30 | 1.0 (0.8–1.1) | 1.4 (1.0–1.9) | 1.2 (1.0–1.4) | 1.1 (0.9–1.3) | 1.4 (1.1–1.8) | 1.1 (0.9–1.4) |
| Physical activity | ||||||
| Ref: Active | 1.0 | 1.0 | 1.0 | 1.0 | 1.0 | 1.0 |
| Moderately active | 1.2 (0.9–1.7) | 0.7 (0.4–1.3) | 1.3 (0.8–1.9) | 1.2 (0.9–1.6) | 1.1 (0.8–1.4) | 1.0 (0.6–1.6) |
| Inactive | 1.7 (1.3–2.3) | 1.1 (0.7–1.8) | 1.4 (1.1–2.0) | 1.3 (1.0–1.8) | 1.2 (1.0–1.4) | 1.5 (1.0–2.2) |
| Drinks alcohol | ||||||
| Ref: At least weekly | 1.0 | 1.0 | 1.0 | 1.0 | 1.0 | 1.0 |
| Less than weekly | 1.5 (1.1–1.9) | 1.7 (1.1–2.5) | 1.1 (0.9–1.3) | 1.1 (0.9–1.3) | 1.2 (1.0–1.4) | 1.2 (0.9–1.6) |
| Not in past 12 months | 1.4 (1.1–1.8) | 1.7 (1.2–2.6) | 1.1 (0.9–1.4) | 1.2 (1.0–1.4) | 1.0 (0.9–1.2) | 1.4 (1.0–1.9) |
| Smoking | ||||||
| Ref: Never smoker | 1.0 | 1.0 | 1.0 | 1.0 | 1.0 | 1.0 |
| Former smoker | 1.3 (1.0–1.6) | 1.4 (0.9–2.0) | 0.9 (0.7–1.1) | 0.8 (0.7–1.0) | 0.9 (0.8–1.1) | 1.2 (0.9–1.6) |
| Current smoker | 1.4 (1.1–1.8) | 1.6 (1.1–2.5) | 1.1 (0.9–1.4) | 0.9 (0.7–1.1) | 1.2 (1.0–1.6) | 1.4 (1.1–1.9) |
| Fruit and vegetable consumption, servings per day | ||||||
| Ref: < 5 servings | 1.0 | 1.0 | 1.0 | 1.0 | 1.0 | 1.0 |
| ≥ 5 | 1.1 (0.9–1.2) | 0.8 (0.5–1.2) | 1.0 (0.8–1.1) | 1.1 (1.0–1.3) | 1.0 (0.9–1.2) | 1.4 (1.1–1.7) |
|
Abbreviations: CFS, chronic fatigue syndrome; FM, fibromyalgia; Ref, referent; PR, prevalence ratio. Note: Statistically significant associations (p <.05) are shown in bold. |
||||||
Discussion
We used data from a nationally representative population-based survey of Canadians to estimate the prevalence and correlates of CFS and FM. In 2010, approximately 1.4% and 1.5% of the Canadian household population reported having been diagnosed with CFS and FM, respectively, representing 411 000 and 444 000 Canadians aged 12 years and older.
Consistent with other Canadian and recent worldwide data, Endnote 1, Endnote 14, Endnote 17 we found that female sex, being 40 years of age and older and low income were associated with prevalent CFS and FM. Whether lower socio-economic status is a determinant or a consequence of CFS/FM remains unclear, given the cross-sectional nature of the survey. CFS and FM may affect a person's ability to work and, as a result, affect total household income. In a study of people with CFS living in the United Kingdom, Collin et al.Endnote 18 found that 50% discontinued their employment due to symptoms related to CFS. The authors estimated that CFS cost the UK economy £75 to £129 million in lost productivity.Endnote 18 Similarly, Reynolds et al.Endnote 19 estimated a 37% decline in household productivity and a 54% reduction in labour force productivity as a result of CFS. The annual total value of lost productivity in the United States was about $9.1 billion or $20 000 per person with CFS. Knight et al.Endnote 20 estimated that FM costs the US economy $7333 per patient in lost productivity due to disability and $1228 per patient in lost productivity due to absenteeism. Thus, inability to work or reduced work time due to CFS or FM may affect income, as opposed to lower income being a determinant of these conditions.
We also showed, consistent with findings from the 2000–2001 CCHS,Endnote 14 that lifestyle risk factors for chronic disease (i.e. obesity, physical inactivity and smoking) were associated with CFS and/or FM, but again the direction of the relationship is unclear given the cross-sectional nature of the data. In the current analysis, people who were obese were 1.5 times more likely to report having FM. Ursini et al.Endnote 21 hypothesized a number of mechanisms linking FM and obesity including reduced physical activity, sleep disturbances, depression, thyroid dysfunction, and hormonal disturbances involving the deregulation of insulin-like growth factor.
In our analysis, self-reported physical inactivity was related to reporting a diagnosis of CFS. Using data from the prospective 1958 National Child Development Study birth cohort in England, Wales, and Scotland, Goodwin et al.Endnote 22 showed that weekly physical activity at age 23 and 33 years was unrelated to the development of CFS by the age of 42 years. This lack of correlation is in contrast to the finding from the 1946 birth cohort in these same countries that showed more frequent exercise in childhood and early adulthood predicted CFS by the age of 53 years.Endnote 23 Although only 2 prospective studies, to our knowledge, have examined this relationship, these findings suggest that physical inactivity is more likely a consequence of CFS than a cause. Physical inactivity may arise from greater physical impairment, fatigue and pain in CFS and FM, and was associated with these factors in our analysis.
Our study found that former and current smoking was also related to CFS; to our knowledge no study has prospectively considered whether smoking is a risk factor for CFS.
Comorbidity, whether having both CFS and FM or having other chronic conditions in addition to CFS or FM, is a central issue in the population examined in this study. Other studies have shown that patients diagnosed with both FM and CFS reported a worse disease course, worse overall health, greater dissatisfaction with health and greater disease impact than those with CFS or FM alone.Endnote 2, Endnote 24 Our results also show that a person's level of comorbidity may substantially affect their health status outcomes. In addition, 2 out of 3 people with CFS and/or FM reported at least 3 other chronic conditions. Our analysis showed that the number of concurrent health conditions among those with CFS and/or FM largely accounted for much of the differences in health status when compared to those with neither condition. Thus, our findings point to the importance of considering the cumulative effects of coexisting chronic conditions and CFS/FM when examining health outcomes in people with either or both conditions.
Strengths and limitations
Our study is strengthened by our use of a large, population-based survey of the Canadian population living in the community, with a good response rate. The CCHS provides comprehensive data on descriptive variables, enabling in-depth analysis of the health status of people living with CFS and FM as well as allowing comparisons with different subgroups. The CCHS relies on self-reporting of chronic conditions and health events. While it is the most practical method of assessing disease status in large population studies, self-reporting of diagnosis is susceptible to misclassification, resulting in potential under- or over-estimation of disease prevalence and societal burden. In our study, CCHS respondents self-reported their disease history (including the diagnosis of CFS and/or FM), and there was no third-party corroboration or verification of these self-reports. Research has found acceptable to good agreement between self-reported physical health conditions and diagnoses made by medical professionals, Endnote 25 but validation of self-reported CFS and FM in particular has not, to our knowledge, been specifically undertaken. Studies of diagnostic practices, focussing on the case definition used by health professionals in diagnosing CFS/FM, are scarce and have yet to be done in Canada.
As previously acknowledged, the crosssectional design of the survey does not allow the examination of possible causal pathways or mechanisms, so it is unclear whether the associations we found with lifestyle risk behaviours could be viewed as
- risk factors for developing the conditions or
- a result of the condition.
Etiological studies (such as case-control or cohort studies) are required to determine whether, in the context of CFS and FM, these represent potential preventable risk factors or not. Finally, while we have included in our analytical strategy the important covariates identified in the CFS and FM literature, our analysis was restricted to the set of variables collected by the CCHS. This may have precluded the inclusion of other important covariates that may have been confounders of the associations we examined in this study, such as disease severity or duration of illness.
Conclusion
We found that, in 2010, CFS and FM were reported by approximately 1.4% and 1.5%, respectively, of the Canadian household population 12 years of age and older. We observed that prevalent CFS and FM were related to female sex, adults 40 years and older and lifestyle risk factors for chronic diseases, although the reasons behind these associations are unclear. These findings may warrant further research to examine whether these lifestyle risk factors are part of the causal pathway or are the effects of the conditions. Co-occurrence of CFS and FM and having other diagnosed chronic conditions were strongly related to poorer health status and accounted for much of the differences in health status. Comorbidity as a driving force behind poorer health status cannot be ignored.
Given the relative paucity of data on CFS and FM, these results from a community-based survey are relevant to the field of public health. They reinforce prior findings that these conditions frequently co-occur with a range of other diseases. Because CFS or FM without comorbidities is actually rare, researchers and clinicians can anticipate substantial complexity in their studies and clinical care. In particular, research that does not exclude patients with comorbidities would be most relevant to health professionals and public health practitioners. Finally, understanding the factors that contribute to improved quality of life in people with CFS and/or FM, particularly in those with both conditions and other comorbidities, may be an important area for future research.
Acknowledgments
The Canadian Community Health Survey was conducted by Statistics Canada in partnership with Health Canada and the Public Health Agency of Canada with funding from the Canadian federal government.