
Chapter 4: Cancer incidence in Canada: trends and projections (1983-2032) – Larynx cancer - HPCDP: Volume 35, Supplement 1, Spring 2015
Chapter 4: Projections by Cancer Site
7. Larynx cancer
During 2003–2007, the average annual number of new cases of laryngeal cancer in Canada was 900 in males and 195 in females, approximately 1.1% and 0.3% of all new male and female cancer cases, respectively (Tables 4.7.1 and 4.7.2). Cancer of the larynx was much more common in males than in females.
| Period | Age | New cases | |||||||||||
|---|---|---|---|---|---|---|---|---|---|---|---|---|---|
| CA | BC | AB | SK | MB | ON | QC | NB | NS | PE | NL | TC | ||
| 2003–07 | <45 | 20 | 0 | 0 | 0 | 0 | 5 | 5 | 0 | 0 | 0 | 0 | 0 |
| 45–54 | 110 | 10 | 10 | 5 | 0 | 40 | 35 | 0 | 5 | 0 | 0 | 0 | |
| 55–64 | 260 | 25 | 20 | 5 | 5 | 90 | 90 | 5 | 10 | 0 | 5 | 0 | |
| 65–74 | 295 | 25 | 15 | 10 | 10 | 105 | 100 | 10 | 10 | 0 | 5 | 0 | |
| 75–84 | 185 | 20 | 10 | 5 | 5 | 65 | 60 | 5 | 5 | 0 | 5 | 0 | |
| 85+ | 35 | 5 | 0 | 0 | 0 | 15 | 10 | 0 | 0 | 0 | 0 | 0 | |
| Total | 900 | 90 | 55 | 25 | 25 | 320 | 305 | 25 | 30 | 5 | 20 | 0 | |
| 2008–12 | <45 | 15 | 0 | 0 | 0 | 0 | 5 | 5 | 0 | 0 | 0 | 0 | 0 |
| 45–54 | 105 | 10 | 10 | 5 | 5 | 40 | 30 | 5 | 5 | 0 | 5 | 0 | |
| 55–64 | 255 | 25 | 20 | 10 | 5 | 95 | 80 | 5 | 10 | 0 | 5 | 0 | |
| 65–74 | 270 | 30 | 15 | 5 | 5 | 95 | 90 | 10 | 10 | 0 | 5 | 0 | |
| 75–84 | 185 | 20 | 10 | 5 | 5 | 65 | 65 | 5 | 5 | 0 | 5 | 0 | |
| 85+ | 45 | 5 | 5 | 0 | 0 | 15 | 15 | 0 | 0 | 0 | 0 | 0 | |
| Total | 870 | 90 | 60 | 25 | 20 | 315 | 285 | 25 | 30 | 5 | 20 | 0 | |
| 2013–17 | <45 | 10 | 0 | 0 | 0 | 0 | 5 | 5 | 0 | 0 | 0 | 0 | 0 |
| 45–54 | 85 | 10 | 10 | 5 | 0 | 35 | 25 | 5 | 5 | 0 | 0 | 0 | |
| 55–64 | 260 | 25 | 25 | 10 | 5 | 105 | 75 | 5 | 10 | 0 | 5 | 0 | |
| 65–74 | 275 | 30 | 15 | 5 | 5 | 100 | 90 | 10 | 10 | 5 | 10 | 0 | |
| 75–84 | 175 | 20 | 10 | 5 | 5 | 60 | 60 | 5 | 5 | 0 | 5 | 0 | |
| 85+ | 50 | 5 | 5 | 0 | 0 | 20 | 15 | 0 | 0 | 0 | 0 | 0 | |
| Total | 860 | 95 | 65 | 25 | 20 | 325 | 270 | 25 | 30 | 10 | 20 | 0 | |
| 2018–22 | <45 | 10 | 0 | 0 | 0 | 0 | 5 | 5 | 0 | 0 | 0 | 0 | 0 |
| 45–54 | 70 | 10 | 5 | 5 | 0 | 30 | 20 | 0 | 5 | 0 | 0 | 0 | |
| 55–64 | 260 | 30 | 30 | 15 | 5 | 105 | 70 | 5 | 10 | 0 | 5 | 0 | |
| 65–74 | 290 | 30 | 20 | 10 | 10 | 115 | 90 | 5 | 10 | 5 | 10 | 0 | |
| 75–84 | 180 | 20 | 10 | 5 | 5 | 65 | 60 | 10 | 5 | 0 | 5 | 0 | |
| 85+ | 55 | 5 | 5 | 0 | 0 | 20 | 20 | 0 | 0 | 0 | 0 | 0 | |
| Total | 865 | 100 | 75 | 30 | 20 | 340 | 260 | 25 | 30 | 10 | 25 | 0 | |
| 2023–27 | <45 | 10 | 5 | 0 | 0 | 0 | 5 | 5 | 0 | 0 | 0 | 0 | 0 |
| 45–54 | 65 | 10 | 5 | 5 | 0 | 30 | 15 | 0 | 5 | 0 | 0 | 0 | |
| 55–64 | 235 | 30 | 25 | 10 | 5 | 100 | 65 | 5 | 10 | 0 | 5 | 0 | |
| 65–74 | 320 | 40 | 30 | 15 | 10 | 135 | 90 | 10 | 10 | 5 | 10 | 0 | |
| 75–84 | 200 | 25 | 15 | 5 | 5 | 70 | 65 | 10 | 5 | 0 | 5 | 0 | |
| 85+ | 55 | 5 | 5 | 0 | 0 | 20 | 20 | 0 | 0 | 0 | 0 | 0 | |
| Total | 890 | 115 | 80 | 35 | 25 | 360 | 260 | 25 | 35 | 10 | 25 | 0 | |
| 2028–32 | <45 | 10 | 5 | 0 | 0 | 0 | 5 | 5 | 0 | 0 | 0 | 0 | 0 |
| 45–54 | 65 | 5 | 5 | 5 | 0 | 30 | 20 | 0 | 5 | 0 | 0 | 0 | |
| 55–64 | 205 | 25 | 25 | 10 | 5 | 95 | 55 | 5 | 10 | 0 | 5 | 0 | |
| 65–74 | 335 | 50 | 30 | 15 | 10 | 140 | 90 | 10 | 15 | 5 | 10 | 0 | |
| 75–84 | 225 | 30 | 20 | 5 | 5 | 85 | 70 | 10 | 5 | 0 | 10 | 0 | |
| 85+ | 60 | 10 | 5 | 0 | 0 | 25 | 20 | 0 | 0 | 0 | 0 | 0 | |
| Total | 900 | 125 | 90 | 35 | 25 | 380 | 260 | 25 | 35 | 10 | 25 | 0 | |
|
Abbreviations: AB, Alberta; BC, British Columbia; CA, Canada; MB, Manitoba; NB, New Brunswick; NL, Newfoundland and Labrador; NS, Nova Scotia; ON, Ontario; PE, Prince Edward Island; QC, Quebec; SK, Saskatchewan; TC, All Territories (Yukon, Northwest Territories and Nunavut). Note: Totals may not add up due to rounding. |
|||||||||||||
| Period | Age | New cases | |||||||||||
|---|---|---|---|---|---|---|---|---|---|---|---|---|---|
| CA | BC | AB | SK | MB | ON | QC | NB | NS | PE | NL | TC | ||
| 2003–07 | <45 | 5 | 0 | 0 | 0 | 0 | 0 | 0 | 0 | 0 | 0 | 0 | 0 |
| 45–54 | 25 | 0 | 0 | 0 | 0 | 10 | 10 | 0 | 0 | 0 | 0 | 0 | |
| 55–64 | 50 | 5 | 5 | 0 | 0 | 20 | 15 | 0 | 0 | 0 | 0 | 0 | |
| 65–74 | 65 | 5 | 5 | 0 | 0 | 25 | 25 | 0 | 0 | 0 | 0 | 0 | |
| 75–84 | 40 | 5 | 5 | 0 | 0 | 15 | 15 | 0 | 0 | 0 | 0 | 0 | |
| 85+ | 15 | 0 | 0 | 0 | 0 | 5 | 5 | 0 | 0 | 0 | 0 | 0 | |
| Total | 195 | 15 | 15 | 5 | 5 | 70 | 70 | 5 | 5 | 0 | 5 | 0 | |
| 2008–12 | <45 | 5 | 0 | 0 | 0 | 0 | 0 | 0 | 0 | 0 | 0 | 0 | 0 |
| 45–54 | 20 | 0 | 0 | 0 | 0 | 10 | 5 | 0 | 0 | 0 | 0 | 0 | |
| 55–64 | 50 | 5 | 5 | 0 | 0 | 20 | 15 | 0 | 0 | 0 | 0 | 0 | |
| 65–74 | 55 | 5 | 5 | 0 | 0 | 20 | 20 | 0 | 0 | 0 | 0 | 0 | |
| 75–84 | 45 | 5 | 5 | 0 | 0 | 15 | 15 | 0 | 0 | 0 | 0 | 0 | |
| 85+ | 15 | 0 | 0 | 0 | 0 | 5 | 5 | 0 | 0 | 0 | 0 | 0 | |
| Total | 185 | 20 | 15 | 5 | 5 | 70 | 65 | 5 | 5 | 0 | 5 | 0 | |
| 2013–17 | <45 | 5 | 0 | 0 | 0 | 0 | 0 | 0 | 0 | 0 | 0 | 0 | 0 |
| 45–54 | 15 | 0 | 0 | 0 | 0 | 10 | 5 | 0 | 0 | 0 | 0 | 0 | |
| 55–64 | 45 | 5 | 5 | 0 | 0 | 20 | 15 | 0 | 0 | 0 | 0 | 0 | |
| 65–74 | 55 | 5 | 5 | 0 | 0 | 20 | 20 | 0 | 0 | 0 | 0 | 0 | |
| 75–84 | 45 | 5 | 5 | 0 | 0 | 15 | 15 | 0 | 0 | 0 | 0 | 0 | |
| 85+ | 15 | 0 | 0 | 0 | 0 | 5 | 5 | 0 | 0 | 0 | 0 | 0 | |
| Total | 175 | 20 | 15 | 5 | 5 | 70 | 60 | 5 | 5 | 0 | 0 | 0 | |
| 2018–22 | <45 | 5 | 0 | 0 | 0 | 0 | 5 | 0 | 0 | 0 | 0 | 0 | 0 |
| 45–54 | 10 | 0 | 0 | 0 | 0 | 5 | 5 | 0 | 0 | 0 | 0 | 0 | |
| 55–64 | 40 | 5 | 5 | 0 | 0 | 20 | 10 | 0 | 0 | 0 | 0 | 0 | |
| 65–74 | 55 | 10 | 5 | 0 | 0 | 25 | 20 | 0 | 0 | 0 | 0 | 0 | |
| 75–84 | 40 | 5 | 5 | 0 | 0 | 15 | 15 | 0 | 0 | 0 | 0 | 0 | |
| 85+ | 20 | 0 | 0 | 0 | 0 | 5 | 10 | 0 | 0 | 0 | 0 | 0 | |
| Total | 170 | 20 | 15 | 5 | 5 | 75 | 55 | 5 | 5 | 0 | 0 | 0 | |
| 2023–27 | <45 | 5 | 0 | 0 | 0 | 0 | 5 | 0 | 0 | 0 | 0 | 0 | 0 |
| 45–54 | 10 | 0 | 0 | 0 | 0 | 5 | 5 | 0 | 0 | 0 | 0 | 0 | |
| 55–64 | 30 | 5 | 5 | 0 | 0 | 20 | 10 | 0 | 0 | 0 | 0 | 0 | |
| 65–74 | 55 | 10 | 5 | 0 | 0 | 25 | 20 | 0 | 0 | 0 | 0 | 0 | |
| 75–84 | 40 | 5 | 5 | 0 | 0 | 15 | 15 | 0 | 0 | 0 | 0 | 0 | |
| 85+ | 20 | 0 | 0 | 0 | 0 | 5 | 10 | 0 | 0 | 0 | 0 | 0 | |
| Total | 155 | 25 | 15 | 5 | 5 | 80 | 55 | 5 | 5 | 0 | 0 | 0 | |
| 2028–32 | <45 | 5 | 0 | 0 | 0 | 0 | 5 | 0 | 0 | 0 | 0 | 0 | 0 |
| 45–54 | 10 | 0 | 0 | 0 | 0 | 5 | 5 | 0 | 0 | 0 | 0 | 0 | |
| 55–64 | 25 | 5 | 5 | 0 | 0 | 20 | 10 | 0 | 0 | 0 | 0 | 0 | |
| 65–74 | 50 | 10 | 5 | 0 | 0 | 30 | 15 | 0 | 0 | 0 | 0 | 0 | |
| 75–84 | 40 | 5 | 5 | 0 | 0 | 20 | 15 | 0 | 0 | 0 | 0 | 0 | |
| 85+ | 15 | 0 | 0 | 0 | 0 | 5 | 5 | 0 | 0 | 0 | 0 | 0 | |
| Total | 145 | 25 | 15 | 5 | 5 | 80 | 50 | 5 | 5 | 0 | 0 | 0 | |
|
Abbreviations: AB, Alberta; BC, British Columbia; CA, Canada; MB, Manitoba; NB, New Brunswick; NL, Newfoundland and Labrador; NS, Nova Scotia; ON, Ontario; PE, Prince Edward Island; QC, Quebec; SK, Saskatchewan; TC, All Territories (Yukon, Northwest Territories and Nunavut). Note: Totals may not add up due to rounding. |
|||||||||||||
The male-to-female ratio of ASIRs was 5.1:1 (Tables 4.7.3 and 4.7.4). The lifetime risk of developing laryngeal cancer in Canada is 1 in 170 for males and 1 in 743 for females.Endnote 1 The lifetime probability of dying from the disease is 1 in 407 for malesEndnote 1 and 1 in 1760 for females (estimate based on the same data used for the related reference). The 5-year relative survival rate for larynx cancer in Canada was 63% for both sexes combined between 2006 and 2008.Endnote 1
| Period | Age | ASIRs | |||||||||||
|---|---|---|---|---|---|---|---|---|---|---|---|---|---|
| CA | BC | AB | SK | MB | ON | QC | NB | NS | PE | NL | TC | ||
| 2003–07 | <45 | 0.2 | 0.1 | 0.1 | 0.4 | 0.2 | 0.2 | 0.2 | 0.1 | 0.1 | 0.0 | 0.1 | 1.0 |
| 45–54 | 4.5 | 3.5 | 3.2 | 3.7 | 2.7 | 4.4 | 6.0 | 3.9 | 4.8 | 9.4 | 4.6 | 0.0 | |
| 55–64 | 15.3 | 11.7 | 12.7 | 9.7 | 9.6 | 14.4 | 20.7 | 14.7 | 15.5 | 20.3 | 19.0 | 3.6 | |
| 65–74 | 27.3 | 18.0 | 17.3 | 27.8 | 21.8 | 25.3 | 38.0 | 32.4 | 32.9 | 35.3 | 35.2 | 12.6 | |
| 75–84 | 29.5 | 23.1 | 16.4 | 14.0 | 23.4 | 27.6 | 42.8 | 43.1 | 30.9 | 21.7 | 43.9 | 0.0 | |
| 85+ | 23.0 | 17.4 | 15.5 | 18.6 | 19.5 | 23.0 | 30.4 | 43.7 | 14.9 | 26.6 | 17.9 | 145.1 | |
| Total | 5.1 | 3.7 | 3.4 | 4.1 | 3.8 | 4.8 | 7.0 | 5.9 | 5.4 | 6.2 | 6.3 | 3.3 | |
| 2008–12 | <45 | 0.1 | 0.2 | 0.1 | 0.3 | 0.1 | 0.2 | 0.2 | 0.3 | 0.2 | 0.2 | 0.1 | 0.2 |
| 45–54 | 3.7 | 3.2 | 3.0 | 4.5 | 2.9 | 3.7 | 4.5 | 4.5 | 4.4 | 7.3 | 6.1 | 3.7 | |
| 55–64 | 12.3 | 8.3 | 9.9 | 13.1 | 8.0 | 12.4 | 16.0 | 11.2 | 14.0 | 25.2 | 16.5 | 13.4 | |
| 65–74 | 21.8 | 15.7 | 15.0 | 15.6 | 18.0 | 20.5 | 29.2 | 25.8 | 24.8 | 38.2 | 31.5 | 19.0 | |
| 75–84 | 26.6 | 20.7 | 16.6 | 19.9 | 17.3 | 23.9 | 38.2 | 44.3 | 28.1 | 37.0 | 43.3 | 22.5 | |
| 85+ | 21.2 | 15.2 | 16.8 | 12.1 | 19.2 | 20.7 | 31.2 | 25.0 | 21.4 | 23.7 | 11.5 | 19.5 | |
| Total | 4.2 | 3.1 | 3.1 | 3.7 | 3.1 | 4.0 | 5.6 | 5.2 | 4.7 | 7.3 | 6.0 | 4.0 | |
| 2013–17 | <45 | 0.1 | 0.2 | 0.1 | 0.3 | 0.1 | 0.1 | 0.1 | 0.3 | 0.2 | 0.2 | 0.1 | 0.1 |
| 45–54 | 3.1 | 2.6 | 2.6 | 4.6 | 2.6 | 3.1 | 3.6 | 4.2 | 4.3 | 6.7 | 5.9 | 3.1 | |
| 55–64 | 11.0 | 8.2 | 10.1 | 17.6 | 7.4 | 11.6 | 13.1 | 10.6 | 15.0 | 23.4 | 14.6 | 11.4 | |
| 65–74 | 17.6 | 13.6 | 12.1 | 13.3 | 13.1 | 17.3 | 23.2 | 18.6 | 18.3 | 36.1 | 29.8 | 16.1 | |
| 75–84 | 23.0 | 16.6 | 16.0 | 13.7 | 17.2 | 21.0 | 32.6 | 39.6 | 25.3 | 36.2 | 38.8 | 19.1 | |
| 85+ | 19.0 | 15.7 | 11.7 | 13.3 | 15.0 | 17.9 | 28.6 | 25.4 | 16.8 | 24.0 | 14.6 | 16.7 | |
| Total | 3.6 | 2.8 | 2.8 | 3.8 | 2.7 | 3.5 | 4.7 | 4.5 | 4.2 | 6.9 | 5.5 | 3.4 | |
| 2018–22 | <45 | 0.1 | 0.2 | 0.1 | 0.3 | 0.1 | 0.1 | 0.1 | 0.3 | 0.2 | 0.2 | 0.1 | 0.1 |
| 45–54 | 2.6 | 2.2 | 2.4 | 4.6 | 2.4 | 3.1 | 3.2 | 4.1 | 4.2 | 6.2 | 5.7 | 2.7 | |
| 55–64 | 10.0 | 8.4 | 10.2 | 17.8 | 6.6 | 10.4 | 11.5 | 10.0 | 14.6 | 21.6 | 14.0 | 10.0 | |
| 65–74 | 15.5 | 11.8 | 11.6 | 17.0 | 12.1 | 16.1 | 19.6 | 15.4 | 17.0 | 33.8 | 26.3 | 14.2 | |
| 75–84 | 19.4 | 16.5 | 13.8 | 9.8 | 15.7 | 17.9 | 26.5 | 32.1 | 20.9 | 34.7 | 37.3 | 16.8 | |
| 85+ | 17.7 | 12.8 | 13.5 | 11.9 | 12.4 | 16.5 | 27.9 | 26.7 | 15.1 | 23.8 | 13.6 | 14.5 | |
| Total | 3.1 | 2.6 | 2.7 | 3.9 | 2.4 | 3.2 | 4.0 | 4.0 | 3.9 | 6.4 | 5.2 | 3.0 | |
| 2023–27 | <45 | 0.1 | 0.2 | 0.1 | 0.3 | 0.1 | 0.1 | 0.1 | 0.3 | 0.2 | 0.2 | 0.1 | 0.1 |
| 45–54 | 2.5 | 2.0 | 2.3 | 4.7 | 2.3 | 3.0 | 3.1 | 4.0 | 4.1 | 5.7 | 5.7 | 2.6 | |
| 55–64 | 9.1 | 7.9 | 9.8 | 18.0 | 6.2 | 9.5 | 10.7 | 9.8 | 14.5 | 19.8 | 13.7 | 9.4 | |
| 65–74 | 14.8 | 13.3 | 12.8 | 21.3 | 12.1 | 16.0 | 17.7 | 15.4 | 18.4 | 31.3 | 24.6 | 13.4 | |
| 75–84 | 16.6 | 15.4 | 12.0 | 7.9 | 12.6 | 15.9 | 22.9 | 24.2 | 15.5 | 32.8 | 36.4 | 15.8 | |
| 85+ | 15.4 | 11.5 | 13.1 | 6.0 | 16.2 | 14.9 | 23.9 | 22.9 | 13.8 | 23.0 | 11.9 | 13.5 | |
| Total | 2.9 | 2.6 | 2.6 | 4.1 | 2.3 | 3.0 | 3.6 | 3.6 | 3.7 | 6.0 | 5.0 | 2.8 | |
| 2028–32 | <45 | 0.1 | 0.2 | 0.1 | 0.3 | 0.1 | 0.1 | 0.1 | 0.3 | 0.2 | 0.2 | 0.1 | 0.1 |
| 45–54 | 2.4 | 1.9 | 2.2 | 4.7 | 2.2 | 2.9 | 2.9 | 3.9 | 4.1 | 5.2 | 5.6 | 2.4 | |
| 55–64 | 8.4 | 7.4 | 9.5 | 18.1 | 5.8 | 9.7 | 10.2 | 9.5 | 14.3 | 18.2 | 13.5 | 8.7 | |
| 65–74 | 13.8 | 13.9 | 13.1 | 21.5 | 11.5 | 14.4 | 16.3 | 15.0 | 18.2 | 28.8 | 24.1 | 12.1 | |
| 75–84 | 15.1 | 14.6 | 12.3 | 11.3 | 12.2 | 15.4 | 20.2 | 21.9 | 15.4 | 30.7 | 32.8 | 14.5 | |
| 85+ | 13.2 | 13.2 | 11.1 | 5.2 | 12.2 | 12.6 | 19.8 | 18.0 | 10.5 | 22.0 | 12.6 | 12.4 | |
| Total | 2.7 | 2.6 | 2.6 | 4.2 | 2.2 | 2.9 | 3.3 | 3.4 | 3.7 | 5.5 | 4.8 | 2.5 | |
|
Abbreviations: AB, Alberta; BC, British Columbia; CA, Canada; MB, Manitoba; NB, New Brunswick; NL, Newfoundland and Labrador; NS, Nova Scotia; ON, Ontario; PE, Prince Edward Island; QC, Quebec; SK, Saskatchewan; TC, All Territories (Yukon, Northwest Territories and Nunavut). |
|||||||||||||
| Period | Age | ASIRs | |||||||||||
|---|---|---|---|---|---|---|---|---|---|---|---|---|---|
| CA | BC | AB | SK | MB | ON | QC | NB | NS | PE | NL | TC | ||
| 2003–07 | <45 | 0.0 | 0.0 | 0.0 | 0.1 | 0.0 | 0.0 | 0.1 | 0.1 | 0.0 | 0.0 | 0.0 | 0.0 |
| 45–54 | 0.9 | 0.1 | 0.6 | 0.6 | 0.9 | 0.9 | 1.5 | 1.3 | 1.6 | 0.0 | 0.5 | 2.9 | |
| 55–64 | 2.8 | 2.3 | 2.2 | 2.7 | 1.5 | 2.7 | 3.6 | 2.1 | 3.5 | 2.7 | 4.8 | 0.0 | |
| 65–74 | 5.5 | 3.8 | 4.1 | 3.7 | 4.4 | 5.2 | 8.2 | 2.7 | 3.7 | 7.3 | 3.1 | 14.3 | |
| 75–84 | 4.8 | 3.7 | 4.9 | 3.3 | 3.8 | 4.3 | 6.6 | 8.3 | 2.9 | 0.0 | 3.1 | 0.0 | |
| 85+ | 3.7 | 2.5 | 2.2 | 3.8 | 5.0 | 3.8 | 5.7 | 0.0 | 1.6 | 0.0 | 0.0 | 0.0 | |
| Total | 1.0 | 0.6 | 0.7 | 0.7 | 0.7 | 0.9 | 1.4 | 0.9 | 0.9 | 0.7 | 0.8 | 1.3 | |
| 2008–12 | <45 | 0.0 | 0.1 | 0.0 | 0.0 | 0.0 | 0.1 | 0.1 | 0.1 | 0.1 | 0.1 | 0.0 | 0.1 |
| 45–54 | 0.7 | 0.3 | 0.7 | 0.6 | 0.7 | 0.8 | 1.1 | 1.3 | 1.3 | 0.9 | 0.6 | 0.9 | |
| 55–64 | 2.3 | 1.8 | 1.7 | 2.2 | 2.2 | 2.3 | 3.0 | 3.2 | 3.1 | 2.8 | 1.8 | 2.9 | |
| 65–74 | 4.2 | 3.5 | 3.0 | 3.9 | 3.3 | 3.8 | 6.0 | 5.0 | 4.0 | 3.5 | 3.4 | 5.3 | |
| 75–84 | 5.0 | 3.8 | 4.6 | 3.7 | 2.9 | 5.0 | 6.9 | 4.8 | 3.2 | 3.8 | 4.1 | 6.4 | |
| 85+ | 3.0 | 1.8 | 2.8 | 2.9 | 2.2 | 2.6 | 5.2 | 3.5 | 1.7 | 2.7 | 2.4 | 3.8 | |
| Total | 0.8 | 0.6 | 0.6 | 0.7 | 0.7 | 0.8 | 1.1 | 1.0 | 0.9 | 0.8 | 0.7 | 1.0 | |
| 2013–17 | <45 | 0.0 | 0.1 | 0.0 | 0.0 | 0.0 | 0.1 | 0.1 | 0.1 | 0.1 | 0.1 | 0.0 | 0.1 |
| 45–54 | 0.5 | 0.3 | 0.7 | 0.5 | 0.6 | 0.7 | 0.8 | 1.1 | 1.1 | 0.8 | 0.4 | 0.7 | |
| 55–64 | 1.8 | 1.6 | 1.6 | 1.7 | 1.9 | 2.0 | 2.3 | 2.8 | 2.8 | 2.3 | 1.5 | 2.3 | |
| 65–74 | 3.3 | 3.2 | 2.1 | 3.3 | 2.9 | 3.2 | 4.7 | 4.4 | 3.6 | 3.0 | 2.7 | 4.2 | |
| 75–84 | 4.4 | 3.3 | 4.1 | 3.6 | 2.6 | 4.4 | 6.1 | 4.6 | 3.0 | 3.2 | 3.6 | 5.7 | |
| 85+ | 3.3 | 2.2 | 2.9 | 3.0 | 2.1 | 3.0 | 5.5 | 3.5 | 1.6 | 2.3 | 2.7 | 4.2 | |
| Total | 0.7 | 0.6 | 0.6 | 0.6 | 0.6 | 0.7 | 0.9 | 0.9 | 0.8 | 0.7 | 0.5 | 0.8 | |
| 2018–22 | <45 | 0.0 | 0.1 | 0.0 | 0.0 | 0.0 | 0.1 | 0.1 | 0.1 | 0.0 | 0.0 | 0.0 | 0.0 |
| 45–54 | 0.4 | 0.3 | 0.7 | 0.4 | 0.5 | 0.7 | 0.7 | 0.9 | 1.0 | 0.7 | 0.4 | 0.6 | |
| 55–64 | 1.5 | 1.5 | 1.6 | 1.4 | 1.7 | 2.0 | 1.9 | 2.4 | 2.4 | 2.0 | 1.3 | 2.0 | |
| 65–74 | 2.7 | 2.6 | 1.9 | 2.7 | 2.5 | 2.9 | 3.8 | 3.8 | 3.2 | 2.5 | 2.2 | 3.4 | |
| 75–84 | 3.4 | 3.3 | 2.8 | 3.2 | 2.3 | 3.4 | 4.7 | 4.2 | 2.8 | 2.7 | 2.8 | 4.4 | |
| 85+ | 3.3 | 2.2 | 3.0 | 3.0 | 1.9 | 3.3 | 5.7 | 3.5 | 1.5 | 1.9 | 2.7 | 4.2 | |
| Total | 0.5 | 0.5 | 0.5 | 0.5 | 0.5 | 0.6 | 0.8 | 0.8 | 0.7 | 0.6 | 0.4 | 0.7 | |
| 2023–27 | <45 | 0.0 | 0.1 | 0.0 | 0.0 | 0.0 | 0.1 | 0.1 | 0.1 | 0.0 | 0.0 | 0.0 | 0.0 |
| 45–54 | 0.4 | 0.3 | 0.7 | 0.3 | 0.5 | 0.7 | 0.7 | 0.8 | 0.9 | 0.6 | 0.4 | 0.6 | |
| 55–64 | 1.2 | 1.5 | 1.6 | 1.1 | 1.4 | 1.9 | 1.6 | 2.0 | 2.1 | 1.7 | 1.0 | 1.5 | |
| 65–74 | 2.3 | 2.5 | 1.9 | 2.2 | 2.1 | 2.7 | 3.2 | 3.3 | 2.9 | 2.1 | 1.9 | 2.9 | |
| 75–84 | 2.8 | 3.0 | 2.1 | 2.7 | 1.9 | 3.1 | 4.1 | 3.6 | 2.6 | 2.3 | 2.3 | 3.6 | |
| 85+ | 2.8 | 1.8 | 2.5 | 2.8 | 1.6 | 2.8 | 5.0 | 3.3 | 1.4 | 1.6 | 2.3 | 3.6 | |
| Total | 0.5 | 0.5 | 0.5 | 0.4 | 0.4 | 0.6 | 0.7 | 0.7 | 0.6 | 0.5 | 0.4 | 0.6 | |
| 2028–32 | <45 | 0.0 | 0.1 | 0.0 | 0.0 | 0.0 | 0.1 | 0.1 | 0.0 | 0.0 | 0.0 | 0.0 | 0.0 |
| 45–54 | 0.4 | 0.3 | 0.7 | 0.2 | 0.4 | 0.7 | 0.7 | 0.7 | 0.8 | 0.5 | 0.3 | 0.5 | |
| 55–64 | 1.1 | 1.4 | 1.5 | 0.9 | 1.2 | 1.9 | 1.5 | 1.7 | 1.9 | 1.4 | 0.9 | 1.3 | |
| 65–74 | 1.9 | 2.5 | 1.9 | 1.8 | 1.8 | 2.7 | 2.7 | 2.8 | 2.5 | 1.8 | 1.6 | 2.5 | |
| 75–84 | 2.2 | 2.6 | 1.9 | 2.2 | 1.7 | 2.9 | 3.2 | 3.2 | 2.3 | 2.0 | 1.8 | 2.9 | |
| 85+ | 2.0 | 2.2 | 1.4 | 2.5 | 1.4 | 2.0 | 3.7 | 2.9 | 1.3 | 1.4 | 1.6 | 2.5 | |
| Total | 0.4 | 0.5 | 0.4 | 0.3 | 0.4 | 0.6 | 0.6 | 0.6 | 0.5 | 0.4 | 0.3 | 0.5 | |
|
Abbreviations: AB, Alberta; BC, British Columbia; CA, Canada; MB, Manitoba; NB, New Brunswick; NL, Newfoundland and Labrador; NS, Nova Scotia; ON, Ontario; PE, Prince Edward Island; QC, Quebec; SK, Saskatchewan; TC, All Territories (Yukon, Northwest Territories and Nunavut). |
|||||||||||||
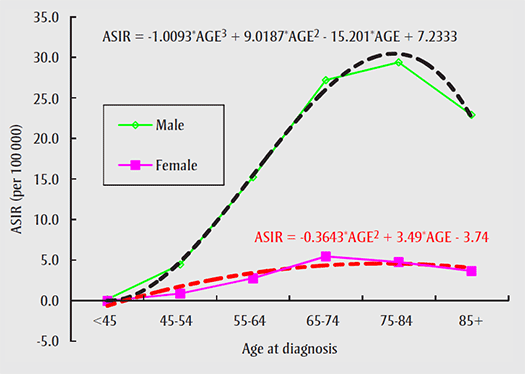
Figure 4.7.1 shows the pattern by which ASIRs of laryngeal cancer changed with age between 2003 and 2007. In 2003–2007, laryngeal cancer was rare in males younger than 45 (0.2 per 100 000), but the incidence increased sharply with age, peaking at 29.5 per 100 000 in those aged 75 to 84. For females, the incidence increased gradually with age, from 0.0 in those under 45 to 5.5 per 100 000 in the 65–74 age range, and then decreased to 3.7 per 100 000 in those aged 85 or older. Approximately 86% of laryngeal cancer cases occurred in those aged 55 and over in both sexes.
FIGURE 4.7.1
Age-standardized incidence rates (ASIRs) for larynx cancer, Canada, 2003–2007
[FIGURE 4.7.1, Text Equivalent]
Figure 4.7.1 shows the pattern by which ASIRs of laryngeal cancer changed with age. In 2003-2007, laryngeal cancer was rare in males younger than 45 (0.2 per 100 000), but the incidence increased sharply with age, peaking at 29.5 per 100 000 in those aged 75 to 84. For females, the incidence increased gradually with age, from 0.0 in those under 45 to 5.5 per 100 000 in the 65-74 age range, and then decreased to 3.7 per 100 000 in those aged 85 or older.
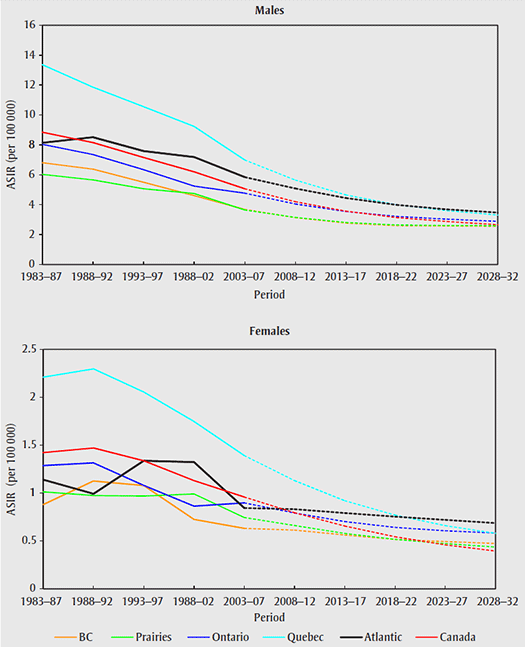
The ASIRs of laryngeal cancer in Canada have decreased steadily from 1983–1987 to 2003–2007, by 43% (from 8.8 to 5.1 per 100 000) in males and by 33% (from 1.4 to 1.0 per 100 000) in females (Figure 4.7.2). During 1998–2007, the incidence rate of larynx cancer decreased the most rapidly of all cancers (3.8% per year in males and 3.4 per year in females) (Figures 3.1 and 3.2). When the rates are analyzed by age, significant decreases over time occurred in each age group in males. This finding compares with either very slowly decreasing or stable trends, in terms of absolute changes in rates, in females of each age group (Figure 4.7.3). Inter-regional comparison of incidence illustrates approximately parallel decreases for males. No geographical pattern was observed for females, except in Quebec, where the rates decreased consistently from the late 1980s and were higher in females as well as in males) than those in other regions over time (Figure 4.7.2). In 2003–2007, the ASIRs were higher in Quebec and lower in western Canada for both sexes.
FIGURE 4.7.2
Age-standardized incidence rates (ASIRs) by region, larynx cancer, 1983–2032
[FIGURE 4.7.2, Text Equivalent]
The ASIRs of laryngeal cancer in Canada have decreased steadily from 1983-1987 to 2003-2007, by 43% (from 8.8 to 5.1 per 100 000) in males and by 33% (from 1.4 to 1.0 per 100 000) in females. The predictions show that the rates of laryngeal cancer will continue to decrease in males and females, most markedly in Quebec. In general, the incidence rates are projected to be higher in eastern Canada than in the western regions, but the long-term trends indicate a regional convergence of rates.
The ASIRs of laryngeal cancer in males are expected to decrease by 43% to 49% in age groups above 45. Similarly, the rates in females of the same age will decrease by 47% to 65%, but as the ASIRs are much lower in females the absolute changes in ASIRs will be much smaller (Figure 4.7.3). The long-term trends of the rates in males and females are projected to converge in each age group. The predictions in Figure 4.7.2 show that the rates of laryngeal cancer will continue to decrease in males and females, most markedly in Quebec. In general, the incidence rates are projected to be higher in eastern Canada than in the western regions, but the long-term trends indicate a regional convergence of rates.
FIGURE 4.7.3
Age-standardized incidence rates (ASIRs) for larynx cancer by age group, Canada, 1983–2032 (red lines denote males, blue lines denote females)

[FIGURE 4.7.3, Text Equivalent]
The ASIRs in males are expected to decrease by 43% to 49% in age groups above 45. Similarly, the rates in females of the same age will decrease by 47% to 65%, but as the ASIRs are much lower in females the absolute changes in ASIRs will be much smaller. The long-term trends of the rates in males and females are projected to converge in each age group.
From 2003–2007 to 2028–2032, national larynx cancer ASIRs are expected to decrease by 47% in males, from 5.1 to 2.7 per 100 000, and by 59% in females, from 1.0 to 0.4 per 100 000 (Tables 4.7.3 and 4.7.4). The annual number of male cases is projected to be unchanged at around 900, and the number of female cases, to drop by 26%, from 195 to 145 (Tables 4.7.1 and 4.7.2).
Comments
Avoiding smoking and alcohol consumption could prevent over 90% of laryngeal cancers.Endnote 125, Endnote 126, Endnote 127 While most of the risk is linked to smoking, reducing drinking alone could still prevent one-quarter of the cancers. The strongly declining observed and projected rates in males likely reflect the role of decreased smoking since the 1960s.Endnote 42, Endnote 43 The higher prevalence of smoking in males is also reflected in the much higher males ASIRs compared with female ASIRs. It is likely that incidence rates in females will drop more sharply than shown in these projections, given the declining pattern of smoking prevalence and the long latency period between the smoking reduction and the decrease in cancer incidence rate as discussed in Section 1, about oral cancers.