
Original quantitative research - Effectiveness of the CANRISK tool in the identification of dysglycemia in a Canadian South Asian Population
Health Promotion and Chronic Disease Prevention in Canada
Gina Agarwal, MBBS, PhD, MRCGP, FCFPAuthor reference 1; Ying Jiang, MD, MScAuthor reference 2; Chantal Lemieux, PhDAuthor reference 2Author reference 3; Susan Rogers Van Katwyk, BScAuthor reference 2; Yang Mao, PhDAuthor reference 2; Heather Orpana, PhDAuthor reference 2Author reference 3; Maylene Fong, MSNAuthor reference 4; Howard Morrison, PhDAuthor reference 2
https://doi.org/10.24095/hpcdp.38.7/8.03
This article has been peer reviewed.
Author reference:
- Author reference 1
-
Departments of Family Medicine and Clinical Epidemiology and Biostatistics, McMaster University, Hamilton, Ontario, Canada
- Author reference 2
-
Public Health Agency of Canada, Ottawa, Ontario, Canada
- Author reference 3
-
School of Epidemiology and Public Health, University of Ottawa, Ottawa, Ontario, Canada
- Author reference 4
-
Vancouver Coastal Health, Vancouver, British Columbia, Canada
Correspondance: Gina Agarwal, Department of Family Medicine, McMaster University, Hamilton, ON L7N 1A3; Email: gina.agarwal@gmail.com
Abstract
Introduction: South Asians have a higher than average risk of developing type 2 diabetes. We ascertained the effectiveness of CANRISK, an existing diabetes risk assessment tool, examining its sensitivity and specificity at two different predetermined scoring cut-off points comparing those participants under the age of 40 and those 40 and over. We examined the predictive ability of a model based on CANRISK variables, comparing ethno-specific body mass index (BMI) and waist circumference (WC) cut-off points with the original BMI and WC cut-off points to see if predictive ability could be improved for this population.
Methods: Canadian South Asians of unknown diabetes status, age 18 to 78, were recruited across seven provinces from various community or health centers. CANRISK variables were collected followed by oral glucose tolerance testing. Descriptive analysis, logistic regression including alternative ethno-specific BMI and WC cut-off points, and sensitivity and specificity analyses were performed.
Results: 832 participants were recruited (584 under age 40). Using the entire study sample, logistic regression models including CANRISK variables predicted dysglycemia effectively (AUC of 0.80). However, by using alternative BMI/WC cut-off points with the scoring algorithm, predictive power via AUC was not improved. Sensitivity and specificity of CANRISK using the original pre-determined “high risk” cut-off point of 33 points in individuals age 40 years or over were 93% and 35%, respectively; in individuals under 40, these were 33% and 92%, respectively. Using the lower pre-determined “moderate risk” cut-off point of 21 points improved the sensitivity to 77% and specificity to 53% in the younger age group.
Conclusions: The existing CANRISK is an adequate risk assessment tool for dysglycemia in Canadian South Asians for those age 40 years and over; however, the tool does not work as well for individuals under 40. The lower cut-off of 21 points may be warranted for younger individuals to minimize false negatives. Ethno-specific BMI/WC cut-off points did not improve predictive ability of the CANRISK scoring algorithm as measured by AUC.
Keywords: CANRISK, Type 2 Diabetes, South Asians, risk-assessment, screening, sensitivity and specificity
Highlights
- CANRISK data were analyzed from a convenience sample of Canadian South Asians; 70% of participants were under 40 years old, 12.4% had prediabetes and 3.7% had undetected diabetes.
- CANRISK is an adequate risk assessment tool for dysglycemia risk in Canadian South Asians aged 40 and over using the standard “high risk” score cut-off point; the “moderate risk” cut-off point of 21 was shown to be more sensitive for individuals under 40, highlighting how differently CANRISK performs by age.
- Alternative ethnicity-specific body mass index / waist circumference cut-off points did not improve the predictive ability of a logistic regression model using the CANRISK variables.
Introduction
South Asians (people claiming heredity from India, Pakistan, Bangladesh, Sri Lanka, Nepal, and Bhutan) are at a higher risk of developing type 2 diabetes (T2DM) than the average Canadian.Footnote 1 For South Asians in North America, this risk is two to three times higher than the general population, with an earlier mean age at diagnosis.Footnote 2 When compared to immigrants from the United States or Western Europe, the prevalence odds ratio for diabetes among South Asian immigrants to Canada was 4.01 for men and 3.22 for women.Footnote 3 This increased risk may be due to biological factors, a preponderance to be sedentary and certain dietary factors.Footnote 4Footnote 5Footnote 6Footnote 7Footnote 8Footnote 9Footnote 10Footnote 11Footnote 12Footnote 13Footnote 14
At 4.8% of the population, people of South Asian origin are the largest visible minority group in Canada.Footnote 15 Given their population size, growth rateFootnote 16 and increased risk for T2DM, it is important to validate a diabetes risk assessment tool for the Canadian South Asian population. Additionally, the onset of diabetes for this population may occur earlier, which may require that screening be initiated at an earlier age.Footnote 2 A validated risk assessment tool has been suggested for younger South Asians,Footnote 17 as evidence shows that diabetes detected and treated at an earlier time point can slow the progression or even prevent frank diabetes.Footnote 18Footnote 19Footnote 20
The Public Health Agency of Canada’s diabetes risk assessment tool, CANRISK, was developed based on a Finnish diabetes risk assessment tool.Footnote 21 It is now widely used across Canada. It was developed for those aged 40 or over, both for use in a primary care setting and by individuals themselves. Furthermore, it is used to assess risk of prediabetes and diabetes (dysglycemia) and to determine which individuals would benefit from further targeted screening. Although recommended,Footnote 22 it is not feasible to screen everyone aged 40 years and over. The tool consists of a series of questions that form a risk score, resulting in categories based on dysglycemia risk (low = a score below 21, moderate = 21–32, high = 33+). These existing score cut-off points were determined by modelling data from a large sample of Canadians from seven provinces (n = 6223) where CANRISK was administered in conjunction with the gold standard oral glucose tolerance test.Footnote 23 It is these score cut-off points that are used in practice for all populations across Canada. It is also important to note that CANRISK was originally validated on a Canadian population aged 40 and over,Footnote 23 and is, therefore, not validated in a younger general population. However, a recent study using a sample of Indigenous Peoples, similar to the current study, found that CANRISK could be used on those below the age 40 with an adjustment of the score cut-off in order to improve the tool’s sensitivity and reduce false negatives for this age group.Footnote 24
When CANRISK was developed,Footnote 23 only a small number of Canadian South Asians (n=323), most of whom were 40 years or older, were included in the sample used to develop the scoring algorithm. Therefore, it has not been specifically validated among Canadian South Asians, over or under 40 years of age. Furthermore, both waist circumference (WC) and body mass index (BMI) have been linked to diabetes in South Asians at lower cut-off points than those in other ethnicities.Footnote 25Footnote 26 One study showed that Canadian South Asians have a glucose level at a BMI cut-off point of 21.0 kg/m2 corresponding to that of Caucasian Canadians with a BMI of 30 kg/m2Footnote 27. Higher glucose levels at lower BMI levels may lead to T2DM at lower BMI levels. Therefore, the inclusion of ethnic-specific cut-off points may yield better predictive ability than the original CANRISK WC/BMI cut-off points.
The primary aim of this paper was to evaluate the effectiveness of CANRISK as a risk assessment tool for dysglycemia as measured by a standard oral glucose tolerance test (OGTT) in a population exclusively comprised of South Asians residing in Canada, with emphasis on a younger population aged 18 to 39. The secondary aim was to test whether the predictive ability of a logistic model including the variables from CANRISK would be improved with ethnic-specific BMI and WC cut-off points specific to South Asian populations.
Methods
As part of the validation of the CANRISK tool, the Public Health Agency of Canada collected data from a large multi-ethnic convenience sample of Canadians from across Canada.Footnote 23 They have since collected a second phase of data, focussing on people of higher risk ethnicities aged 20 to 39 years, and the current study analyzed a sub-sample of South Asian participants from this data set, pooled over both phases of data collection. Note that sub-sample characteristics are described in the results section.
Participant recruitment
During the periods from 2007 and 2011 (Phase 1), and from 2013 to 2015 (Phase 2), residents aged between 18 and 78, from seven Canadian provinces (British Columbia, Saskatchewan, Manitoba, Ontario, New Brunswick, Nova Scotia and Prince Edward Island), of unknown diabetes status, were approached to participate in a dysglycemia risk assessment study. Though several large urban sites were deliberately included to ensure a diverse multi-ethnic sample of participants aged 40 and over in Phase 1 (2007–2011), Phase 2 of recruitment in 2013–2015 was specifically aimed at increasing the number of participants mainly aged 20-39 and of specific ethnicities (East Asian, South Asian, First Nations and Métis, and Inuit). In Phase 1, most participants were recruited during opportunistic community health centre visits, although some were recruited through local mail-outs from community health centres and the regional health authority. In Phase 2, social media sites (Facebook and Twitter), posters, brochures and pamphlets advertised study recruitment, and interested participants contacted local public health nurses. Participants were excluded if they already had diabetes, were currently pregnant or were not living within the local study area. Participants in Phase 2 received $50 in compensation in either cash or as a food voucher.
Data collection and risk assessment
After informed consent was provided, individuals were invited for a dysglycemia assessment conducted at a local community centre. The assessment consisted of a self-administration of CANRISK, anthropometric measurements and two venous blood samples as part of an oral glucose tolerance test (OGTT). Study participants were weighed dressed in indoor clothing without shoes, using a digital standing scale. Height was determined using a standardised tape measure attached to the wall. Waist circumference (WC) was measured as the minimum circumference between the umbilicus and xiphoid process. Nurses and health centre staff were able to help study participants in English and other languages as needed and received training on how to conduct the anthropometric measurements to ensure the standardisation of the measurements.
The CANRISK questionnaire includes questions on gender, age, self-reported physical activity (such as brisk walking for at least 30 minutes each day), self-reported fruit and vegetable consumption (consumption every day/not every day), history of high blood pressure, history of high blood glucose, family history of diabetes, ethnicity (both mother’s and father’s), and education.Footnote 23 The time it typically took to complete CANRISK was approximately less than 5 minutes. Since WC, weight and height were collected as continuous variables, it was possible to create categories based on different referenced cut-off points. The CANRISK used World Health Organisation (WHO) and Canadian Diabetes Association (CDA) standard cut-off points for BMI: < 25 kg/m2 (underweight and normal weight), 25–29.9 kg/m2 (overweight), 30–34.9 kg/m2 (obesity class 1) and 35+ kg/m2 (obesity class 2+);Footnote 28 and for WC: small (male < 94 cm and female < 80 cm), medium (male 94–102 cm and female 80–88 cm) and large (male > 102 cm and female > 88 cm).Footnote 29 In the current analysis, alternative South Asian specific cut-off points for BMIFootnote 26 were: < 23.5 kg/m2 (underweight/normal weight); 23.5–27.5 kg/m2 (overweight) and greater than 27.5 kg/m2 (obese). Additionally, alternative South Asian specific cut-off points for WC (25) were: male < 90 cm, female < 80 cm (small); male 90–100 cm, female 80–90 cm (medium); male > 100 cm, female > 90 cm (large).
Participants had their glycemic status confirmed with an OGTT, i.e., testing their fasting plasma glucose (FPG), administering a 75 g glucose challenge, and a further plasma glucose test taken two hours later, as recommended by WHO and CDA guidelines.Footnote 22Footnote 30 An individual was classified as having prediabetes if they had an FPG level of 6.1 to <7.0 mmol/L and/or a 2-hour serum glucose of 7.8–11.0 mmol/L, or having diabetes if they had an FPG level of 7.0 mmol/L or higher and/or a 2-hour serum glucose level of 11.1 mmol/L or higher.Footnote 22Footnote 30
Data analysis
Descriptive analyses were undertaken to characterize study participants. A series of logistic regressions were performed using SAS 9.3, with the presence or absence of dysglycemia as the outcome variable. These analyses were conducted to determine if the predictive ability of the original CANRISK model could be improved with alternative WC and BMI cut-off points for a Canadian South Asian population. Specifically, Model A used the original CANRISK variables, Model B used CANRISK variables with alternative WC cut-off points, Model C used CANRISK variables with alternative BMI cut-off points, and Model D used CANRISK variables with both alternative WC and BMI cut-off points. The Hosmer-Lemeshow Goodness of Fit testFootnote 31 and a Receiver Operating Characteristic (ROC) Curve, measured by the area under the curve (AUC), were used to assess model fit and predictive ability.
CANRISK was originally developed for use by those 40 and over, and a score of 0 for age was accorded to participants aged 40 to 44.Footnote 23 In the present analyses those who were under the age of 40 were also accorded an age score of 0. Points assigned to each variable are weighted based on the original CANRISK model, which only included data from individuals aged 40 and over, and by disregarding the variability in the age variable we reduced the maximum points a young individual can be assigned. To compensate for the loss of this variable in our younger participants, an alternative CANRISK cut-off was proposed. This cut-off was similar to a previous study using a sample of young Indigenous Peoples.Footnote 24 We investigated the predictive ability of CANRISK for this younger population by comparing an alternative CANRISK cut-off point of 21 points “Moderate Risk” to the original cut-off point of 33 points “High Risk”. A score equal to or above the cut-off point was classified as positive for dysglycemia risk while a score below the cut-off point was classified as negative.
Sensitivity and specificity were calculated to evaluate the effectiveness of CANRISK in the detection of dysglycemia risk by comparing both CANRISK cut-off points among older adults (≥ 40 years) and younger adults (< 40 years) using the original and alternative CANRISK score cut-offs. Sensitivity was defined as the proportion of people with a positive CANRISK score among those with a positive OGTT test. Specificity was defined as the proportion of people who had a negative CANRISK risk score among those with a negative OGTT test. The positive predictive value (PPV) was the proportion of subjects with a positive OGTT among those with a positive CANRISK score test. The negative predictive value (NPV) was defined as the proportion of subjects without dysglycemia as determined by OGTT among those with a negative CANRISK score. The accuracy rate was the proportion of the laboratory test confirmed positive or negative CANRISK scores out of the entire study population. The PPV, NPV and accuracy were calculated to be able to allow a comparison with the CANRISK results in the original validation population.Footnote 23
Results
The sub-sample used in this analysis consisted of 832 Canadian South Asian individuals pooled from both Phase 1 (n = 323) and Phase 2 (n = 509). The majority were from the 18–39 age group (70%) and female (62%) (Table 1). Nearly half had obtained college or higher education. Using CANRISK BMI cut-off points, 50% were considered overweight or obese, but using the alternative cut-off points specific for Asian populations,Footnote 26 66% were overweight or obese.Using CANRISK and alternative WC cut-off points, 42% and 39%, respectively, of our sample were identified as having a large waist circumference. Eighty percent reported consuming fruits and vegetables daily and 63% self-reported regular physical activity. Based on the results of FPG and/or OGTT, dysglycemic status (Table 2) was noted in 16% of participants; 12% were classified as having prediabetes and 4% were classified as having diabetes.
| Sample characteristics | Pooled total sample (N = 832) | % of pooled total sample |
|---|---|---|
| Gender | ||
| Female | 518 | 62.26 |
| Male | 314 | 37.74 |
| Age | ||
| 18–29 | 230 | 27.64 |
| 30–39 | 354 | 42.55 |
| 40–44 | 40 | 4.81 |
| 45–54 | 68 | 8.17 |
| 55–64 | 79 | 9.5 |
| 65+ | 61 | 7.33 |
| BMI (kg/m2) – CANRISK cut-off points | ||
| Normal/underweight (< 25) | 420 | 50.48 |
| Overweight (25–29.9) | 281 | 33.77 |
| Obese, class 1 (30–34.9) | 107 | 12.86 |
| Obese, class 2+ (≥ 35) | 24 | 2.88 |
| BMI (kg/m2) – Alternative cut-off points | ||
| Normal/underweight (< 23.5) | 279 | 33.53 |
| Overweight (23.5–27.5) | 326 | 39.18 |
| Obese (> 27.5) | 227 | 27.28 |
| Waist circumference – CANRISK cut-off points | ||
| Male < 94, Female < 80 | 292 | 36.14 |
| Male 94–102, Female 80–88 | 174 | 21.53 |
| Male > 102, Female > 88 | 342 | 42.33 |
| Waist circumference – Alternative cut-off points | ||
| Male < 90, Female < 80 | 221 | 27.35 |
| Male 90–100, Female 80–90 | 268 | 33.17 |
| Male > 100, Female > 90 | 319 | 39.48 |
| Daily brisk physical activity (No) | 311 | 37.42 |
| Daily consumption of fruit/vegetable (No) | 165 | 19.86 |
| High blood pressure (Yes) | 99 | 11.93 |
| High blood sugar (Yes) | 68 | 8.19 |
| Positive family history of diabetes | ||
| No relatives with DM (all relatives = No) | 367 | 44.11 |
| Secondary relative has DM (sibling or other = Yes) | 139 | 16.71 |
| Primary relative has DM (mother, father, or child = Yes) | 293 | 35.22 |
| No confirmed cases, but suspected cases (no relatives marked as yes, but some relatives marked “unsure”) | 33 | 3.97 |
| Education | ||
| Some high school or less | 106 | 12.74 |
| High school diploma | 123 | 14.78 |
| Some college or university | 233 | 28 |
| College or university degree | 370 | 44.47 |
| History of macrosomia (% of female) | 32 | 6.18 |
Abbreviations: BMI, body mass index; DM, diabetes mellitus. Note: Sample is those from the CANRISK study Phase 1 (n = 323), Phase 2 (n = 509) who identified South Asian as their mother’s or father’s ethnicity. |
||
| Status | Total sample | |
|---|---|---|
| % of total sample | Cases detected (N) | |
| Prediabetes | ||
| A) FPG only or 2hPG only | 10.5 | 87 |
| B) Both FPG and 2hPG | 1.9 | 16 |
| C) Total prediabetes (A + B) | 12.4 | 103 |
| Diabetes | ||
| D) FPG only or 2hPG only | 2.4 | 20 |
| E) Both FPG and 2hPG | 1.3 | 11 |
| F) Total diabetes (D + E) | 3.7 | 31 |
| Total cases of dysglycemia (C + F) | 16.1 | 134 |
| Abbreviations: 2hPG, plasma glucose after 2-hour glucose challenge; FPG, fasting plasma glucose. | ||
Odds ratios derived from adjusted logistic regression for all four models are presented in Table 3. All four logistic regression models passed the Hosmer-Lemeshow goodness of fit testFootnote 31 with p-values ranging from 0.53 to 0.98 (Table 3). Regardless of the model, the odds of dysglycemia increased with age, with significantly higher odds in the 55 to 64 and 65+ age groups as compared to those aged 40 to 44. Using CANRISK cut-off points, individuals with class 2 obesity had significantly greater odds of dysglycemia than those in the normal or underweight group (Models A and B); using ethnic-specific BMI cut-off points, those who were considered obese had significantly higher odds than those who were normal/underweight (Models C and D). Men and women with medium or large waist circumference using CANRISK cut-off points had no significantly higher odds of dysglycemia (Model A and C); while those with medium waist circumference using alternative cut-off points had significantly higher odds of dysglycemia (Model B and D). All four logistic regression models show good predictive ability for dysglycemia, with similar AUCs of ranging from 0.80 to 0.81. In other words, alternative BMI and/or WC cut-off points did not alter the AUC much, nor did it improve the model fit. The sensitivity and specificity observed using the whole sample of Canadian South Asians at the original CANRISK score cut-off of 33 points were 69% and 78%, respectively. The PPV was 38% and the total accuracy rate was 77%.
| Variable | Model A: original CANRISK cut-off points | Model B: alternative WC cut-off points | Model C: alternative BMI cut-off points | Model D: alternative WC and BMI cut-off points | ||||||||
|---|---|---|---|---|---|---|---|---|---|---|---|---|
| OR | 95% CI | OR | 95% CI | OR | 95% CI | OR | 95% CI | |||||
| Age | ||||||||||||
| 18–29 | 0.65 | 0.16 | 2.64 | 0.69 | 0.17 | 2.78 | 0.67 | 0.17 | 2.74 | 0.70 | 0.17 | 2.86 |
| 30–39 | 1.39 | 0.39 | 4.93 | 1.39 | 0.39 | 4.94 | 1.41 | 0.40 | 5.04 | 1.43 | 0.40 | 5.09 |
| 40–44 | Ref | Ref | Ref | Ref | ||||||||
| 45–54 | 3.13 | 0.80 | 12.20 | 3.21 | 0.82 | 12.49 | 3.19 | 0.82 | 12.45 | 3.25 | 0.83 | 12.68 |
| 55–64 | 5.94 | 1.58 | 22.30 | 5.88 | 1.57 | 22.02 | 6.19 | 1.65 | 23.23 | 6.13 | 1.64 | 22.98 |
| 65+ | 4.93 | 1.26 | 19.36 | 4.69 | 1.20 | 18.31 | 5.46 | 1.38 | 21.53 | 5.19 | 1.32 | 20.41 |
| BMI (kg/m2) CANRISK cut-off points | ||||||||||||
| Normal/underweight (< 25) | Ref | Ref | N/A | N/A | N/A | N/A | N/A | N/A | ||||
| Overweight (25–29.9) | 1.57 | 0.93 | 2.67 | 1.53 | 0.90 | 2.62 | N/A | N/A | N/A | N/A | N/A | N/A |
| Obese, class I (30–34.9) | 1.87 | 0.95 | 3.69 | 1.82 | 0.91 | 3.65 | N/A | N/A | N/A | N/A | N/A | N/A |
| Obese, class II and above (> 35) | 4.02 | 1.31 | 12.34 | 3.83 | 1.23 | 11.90 | N/A | N/A | N/A | N/A | N/A | N/A |
| BMI (kg/m2) Alternative cut-off points | ||||||||||||
| Normal/underweight (< 23.5) | N/A | N/A | N/A | N/A | N/A | N/A | Ref | Ref | ||||
| Overweight (23.5–27.5) | N/A | N/A | N/A | N/A | N/A | N/A | 1.39 | 0.73 | 2.66 | 1.28 | 0.66 | 2.46 |
| Obese (> 27.5) | N/A | N/A | N/A | N/A | N/A | N/A | 2.90 | 1.43 | 5.91 | 2.74 | 1.32 | 5.67 |
| WC (cm) – CANRISK cut-off points | ||||||||||||
| Male < 94, Female < 80 | Ref | N/A | N/A | N/A | Ref | N/A | N/A | N/A | ||||
| Male 94–102, Female 80–88 | 1.94 | 0.97 | 3.90 | N/A | N/A | N/A | 1.84 | 0.91 | 3.68 | N/A | N/A | N/A |
| Male > 102, Female > 88 | 1.94 | 0.91 | 4.14 | N/A | N/A | N/A | 1.54 | 0.70 | 3.37 | N/A | N/A | N/A |
| WC (cm) – Alternative cut-off points | ||||||||||||
| Male < 90, Female < 80 | N/A | N/A | N/A | Ref | N/A | N/A | N/A | Ref | ||||
| Male 90–100, Female 80–90 | N/A | N/A | N/A | 2.67 | 1.17 | 6.10 | N/A | N/A | N/A | 2.55 | 1.11 | 5.87 |
| Male > 100, Female > 90 | N/A | N/A | N/A | 2.80 | 1.12 | 6.99 | N/A | N/A | N/A | 2.24 | 0.87 | 5.72 |
| Daily brisk physical activity | ||||||||||||
| Yes | Ref | Ref | Ref | Ref | ||||||||
| No | 1.07 | 0.68 | 1.67 | 1.07 | 0.68 | 1.67 | 1.05 | 0.67 | 1.65 | 1.06 | 0.68 | 1.66 |
| Daily consumption of fruit/vegetable | ||||||||||||
| Yes | Ref | Ref | Ref | Ref | ||||||||
| No | 0.68 | 0.36 | 1.28 | 0.69 | 0.37 | 1.30 | 0.71 | 0.38 | 1.33 | 0.72 | 0.39 | 1.35 |
| High blood pressure | ||||||||||||
| Yes | 0.94 | 0.52 | 1.70 | 0.95 | 0.53 | 1.71 | 0.94 | 0.52 | 1.71 | 0.96 | 0.53 | 1.73 |
| No | Ref | Ref | Ref | Ref | ||||||||
| High blood sugar | ||||||||||||
| Yes | 2.08 | 1.07 | 4.03 | 2.10 | 1.09 | 4.05 | 2.03 | 1.06 | 3.89 | 2.05 | 1.07 | 3.92 |
| No | Ref | Ref | Ref | Ref | ||||||||
| Positive family history of diabetes | ||||||||||||
| None | Ref | Ref | Ref | Ref | ||||||||
| DM relativesTable 3 Footnote a | 1.24 | 0.93 | 1.65 | 1.24 | 0.93 | 1.65 | 1.22 | 0.92 | 1.63 | 1.22 | 0.92 | 1.63 |
| Gender | ||||||||||||
| Female | Ref | Ref | Ref | Ref | ||||||||
| Male | 2.19 | 1.27 | 3.77 | 1.97 | 1.21 | 3.22 | 1.94 | 1.12 | 3.38 | 1.84 | 1.12 | 3.03 |
| Education | ||||||||||||
| Some high school or less | 1.66 | 0.92 | 2.97 | 1.62 | 0.91 | 2.91 | 1.63 | 0.92 | 2.92 | 1.62 | 0.91 | 2.90 |
| High school diploma | 1.13 | 0.62 | 2.07 | 1.13 | 0.62 | 2.07 | 1.12 | 0.61 | 2.06 | 1.12 | 0.60 | 2.06 |
| Some/graduated college or university | Ref | Ref | Ref | Ref | ||||||||
| History of macrosomia | ||||||||||||
| No/NA | Ref | Ref | Ref | Ref | ||||||||
| Yes | 1.32 | 0.45 | 3.86 | 1.31 | 0.45 | 3.86 | 1.25 | 0.43 | 3.69 | 1.26 | 0.43 | 3.73 |
| AUC | 0.80 | 0.80 | 0.80 | 0.81 | ||||||||
| Hosmer-Lemeshow goodness of fit | p = 0.62 (DF = 8) | p = 0.53 (DF = 8) | p = 0.98 (DF = 8) | p = 0.94 (DF = 8) | ||||||||
Abbreviations: AUC, area under the curve; BMI, body mass index; CI, confidence interval; DF, degrees of freedom; kg, kilogram; m, metre; NA, not applicable; OR, odds ratio; Ref, reference group; WC, waist circumference. Note: N/A = not applicable.
|
||||||||||||
However, despite adequate model fit and predictive ability, as measured by AUC, across the entire study sample, the tool functions differently across age groups. Sensitivity and specificity analysis by age group (Table 4) showed that by using the original CANRISK cut-off of 33 points, in those aged 40 years and over, the sensitivity was 93%, specificity 35%, PPV 41% and accuracy rate 54%. In those aged under 40 years, sensitivity was 33%, specificity was 92%, PPV was 28% and accuracy was 87%. When using the alternative lower CANRISK cut-off of 21 points, sensitivity was 100% in those 40 years and over, specificity was 10%, and accuracy was 40%. However, in those aged under 40 years, the sensitivity was improved to 77%, specificity was 53%, and accuracy was 56%. The ROC curves for each age group depicting the sensitivity and specificity at different CANRISK score cut-offs can be seen in Figure 1.
| Cut-off points | Age group | |
|---|---|---|
| Under 40 (n = 584) | 40 and over (n = 248) | |
| Cut-off point of 33 | ||
| Sensitivity | 32.7 | 92.7 |
| Specificity | 91.9 | 34.9 |
| Positive predictive value | 28.3 | 41.3 |
| Negative predictive value | 93.3 | 90.6 |
| AccuracyTable 4 Footnote a | 86.6 | 54.0 |
| Cut-off point of 21 | ||
| Sensitivity | 76.9 | 100.0 |
| Specificity | 53.4 | 9.6 |
| Positive predictive value | 13.9 | 35.3 |
| Negative predictive value | 96.0 | 100.0 |
| AccuracyTable 4 Footnote a | 55.5 | 39.5 |
Notes: Total N is 832. See Figure 1 for associated ROC curves.
|
||
Figure 1. CANRISK predicts dysglycemia: ROC with CANRISK cut-off points and AUC by age group
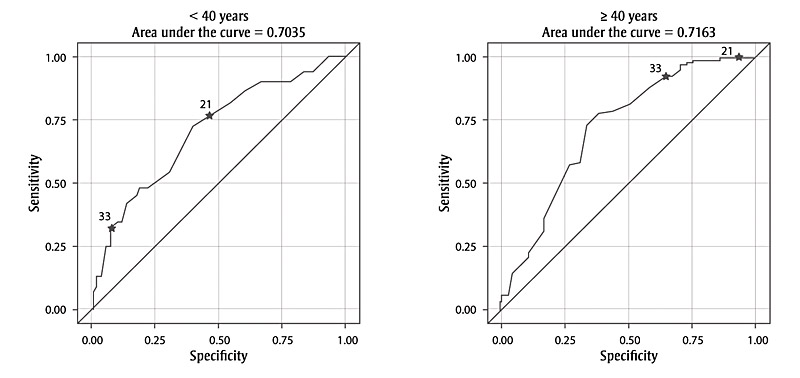
Abbreviations: AUC, area under the curve; ROC, Receiver Operating Characteristic.
Note: Stars on ROC curves indicate the sensitivity and specificity at predetermined CANRISK cut-off points: 21 represents “moderate risk” and 33 represents “high risk”.
Text Description
This figure depicts the ROC curves for each age group, showing the sensitivity and specificity at different CANRISK score cut-offs.
For those aged < 40 years, the area under the curve is 0.7035. The ROC curve is an ascending curve that is constantly above the y = x line, starting at the intersection of 0.00 sensitivity and 0.00 specificity and ending at the intersection of 1.00 sensitivity and 1.00 specificity. At 0.25 specificity, the curve is approximately at 0.50 sensitivity; at 0.50 specificity, it is approximately at 0.79 sensitivity; and at 0.75 specificity, it is approximately at 0.90 sensitivity. At the original and alternative CANRISK cut-off points, the curve is at the following:
| Cut-off point | Specificity | Sensitivity |
|---|---|---|
| 33 | 0.08 | 0.33 |
| 21 | 0.47 | 0.77 |
For those aged ≥ 40 years, the area under the curve is 0.7163. The ROC curve is an ascending curve that is constantly above the y = x line, starting at the intersection of 0.00 sensitivity and 0.00 specificity and ending at the intersection of 1.00 sensitivity and 1.00 specificity. At 0.25 specificity, the curve is approximately at 0.53 sensitivity; at 0.50 specificity, it is approximately at 0.80 sensitivity; and at 0.75 specificity, it is approximately at 0.97 sensitivity. At the original and alternative CANRISK cut-off points, the curve is at the following:
| Cut-off point | Specificity | Sensitivity |
|---|---|---|
| 33 | 0.65 | 0.93 |
| 21 | 0.90 | 1.00 |
Discussion
The original CANRISK model demonstrated good predictive ability via AUC for dysglycemia in this Canadian South Asian sample, including younger participants under the age of 40 years; an age group not originally included in the sample upon which CANRISK was validated. The sensitivity and specificity observed using the whole sample of Canadian South Asians at the original CANRISK score cut-off of 33 points were marginally better than those reported in original validation study for the general population sample;Footnote 23 respectively, sensitivity of 69% vs 66%; specificity of 78% vs 70%; and PPV of 38% vs 36% and a total accuracy rate of 77% vs 64%.
When looking at the age group under 40 separately, adjustments to the cut-off point may have to be made; this highlights that the CANRISK tool performs differently across these two age groups. In the age 40 group or over, the relatively high sensitivity of 93% and low specificity of 35% would be acceptable when the tool is used as the first step of a screening process to triage those at high risk for further clinical testing. However, in the age group under 40, it may be more appropriate to use the lower “Moderate Risk” CANRISK cut-off of 21 points as the first step in the screening process to increase sensitivity from 33% using the “High Risk” cut-off to 77%. The lower cut-off point would also result in a decrease in specificity and a resulting increase in false positives. However, favouring the reduction of false negatives is more desirable in this context than reducing false positives, while still maintaining a balance, as it would minimize the number of young individuals mistakenly identified as lower diabetes-risk and encourage a greater number of younger individuals at risk to seek further screening and to consider important lifestyle changes. This is most important for this age group considering diabetes incidence rates are increasing at younger ages, especially among South Asians.Footnote 2 If this approach were adopted, the tool administration instructions would need to be altered for the Canadian South Asian population below 40 years of age utilising the CANRISK. This recommendation was made in another study finding similar results for a young Indigenous Peoples population.Footnote 24 It is important to note that this recommendation has not yet been tested on a younger group of the general Canadian population, i.e., it has thus far only been tested on a sample entirely made of individuals below the age of 40 from Indigenous PeoplesFootnote 24 as well as Canadian South Asian (in the current study) populations.
For South Asians, finding a solution to help young individuals assess their diabetes risk is important as the onset of diabetes is occurring at younger ages than before.Footnote 2 A formal risk assessment approach for South Asians has been suggestedFootnote 17 to help individuals reduce or prevent their risk of diabetes by allowing them the opportunity to make lifestyle changes such as increase in exercise and changes in diet.Footnote 18Footnote 19Footnote 20 For instance, South Asians have been shown to be less physically active than their Western European counterparts. In one study, South Asians in the UK reported 50–75% lower physical activity levels than those of European descent.Footnote 7 Overall calories and carbohydrate content are higher in the South Asian diet compared to standard European meals.Footnote 14 Furthermore, many South Asians have transitioned from a traditional diet to a non-traditional diet higher in animal proteins, sugar, and fats including trans-fats.Footnote 14 With the knowledge from CANRISK that their health may be at risk, individuals of all ages may be more likely to initiate these lifestyle changes.
We hypothesized that the predictive ability of the model using CANRISK variables as predictors could be enhanced for Canadian South Asians by the addition of ethnic-specific cut-off points for WC and BMI. However, our results show that the model fit and AUC were not significantly improved when using South Asian-specific cut-off points for either WC or BMI. In other words, changing the CANRISK WC and/or BMI cut-off points to South Asian specific cut-off points did not improve the predictive ability of the CANRISK model beyond what the original CANRISK WC and BMI cut-off points could predict within a sample of Canadian South Asians. We can, therefore, conclude that there is no indication to modify the original CANRISK WC and/or BMI cut-off points in the tool for this population. Ethnic-specific WC and BMI cut-off points were also found to not improve CANRISK predictive ability in a sample of individuals from First Nations and Métis communities.Footnote 24
The Indian Diabetes Risk Score (IDRS) tool identifies people with undiagnosed diabetes using four simple parameters, requiring minimal time and effort, with the potential to considerably reduce the costs of screening.Footnote 32 It is shorter than CANRISK, consisting of four questions on age, waist circumference, family history and physical activity. In an Indian population, it was found to have an AUC of 0.70, sensitivity of 73% and specificity of 60% for determining undiagnosed diabetes, with a PPV of 17%, and accuracy of 61%.Footnote 32 Our current results on our sample of Canadian South Asians using the original CANRISK cut-off points with all ages show the CANRISK to outperform the predictive ability of IDRS with an AUC of 0.80. Using all ages and the original CANRISK cut-off point of 33 points, our results demonstrate similar sensitivity and specificity, higher PPV from 17% with the IDRS to 38% on the CANRISK, and higher total accuracy from 61% with the IDRS to 77% with the CANRISK. The improved predictive ability may be because the CANRISK collects more information (12 questions) compared to the IDRS (4 questions) allowing for a more specific predictive model. The IDRS has not been tested among Canadian South Asians and further work is needed to assess whether a tool developed specifically for a South Asian population would be preferable to CANRISK.
Potential limitations of this work include a sampling bias resulting from an over-representation of the “worried well” – that is, the recruited population was made up of self-selected volunteers who were more likely to be worried about diabetes, and therefore more likely to respond to recruitment efforts. This is in addition to a sampling bias created by only recruiting individuals from community health centres who may already have an invested interest in their health compared to the general Canadian South Asian population. The smoking rates in this group were almost half (2.6%) of that described in the literature for Canadian South Asians 5.0%.Footnote 33 Since recruitment materials and CANRISK were only provided in English and French, it is possible that some of the South Asian population would not have been able to participate due to language restrictions. Although, statistics show that most Canadian South Asians can speak either English or French.Footnote 34
In addition, differences in recruitment methods between Phase 1 and Phase 2 may have created a bias given the purposeful sampling of younger adults in Phase 2. Considering the age distribution in our sample does not represent the general Canadian South Asian population, as it includes a very large proportion of individuals below the age of 40, the results from this study need to be interpreted with this in mind. That is, due to this age-related sampling bias, all models presented should be interpreted with caution as reliability among older adults is weakened (as can be seen with the larger CI among these age categories in the logistic model). It is also important to note that our sample is generally small, especially when comparing between age categories, as the older age category only consisted of 248 individuals. In addition, recruitment during Phase 2 emphasized social media and included incentives, while Phase 1 mostly focussed on public health outreach. These differences in recruitment between phases of data collection could have resulted in somewhat different populations of Canadian South Asian individuals participating in each phase in addition to age differences. Furthermore, participation rates could not be calculated due to the nature of the study sample mentioned above. As a result, the generalizability of the current data to the general Canadian South Asian population cannot be confirmed and should, therefore, be interpreted with caution.
It is also important to note that WC measurement was conducted by trained staff according to the WHO protocol. While this is ideal in the context of research, it is not consistent with the application of CANRISK when used for self-assessment. This poses a problem with ecological validity as there may be discrepancies in the variability of WC measurement when comparing the measurements from self-assessment to those from trained health staff.
Conclusion
This study has shown that CANRISK is effective at detecting individuals at high risk for dysglycemia in Canadian South Asians aged 40 years and older. An adjustment of the CANRISK score cut-off point to the “Moderate Risk” category of 21 points for individuals under age 40 is recommended to increase tool sensitivity and avoid false negatives, which is important for this increasingly at-risk population. In addition, using different ethno-specific WC and BMI cut-off points in the CANRISK logistic regression model did not improve predictive ability as measured by AUC. It is important to note that the generalizability of the results from the current sample to the general Canadian South Asian population cannot be confirmed and should, therefore, be interpreted with caution.
Acknowledgements
We gratefully acknowledge Health PEI (Charlottetown, Summerside and O’Leary sites), the Diabetes Care Program of Nova Scotia (Kentville and Antigonish sites), New Brunswick Health and Wellness (Fredericton and Lameque sites), Ontario Health and Wellness (the Mississauga site at Credit Valley Hospital), Manitoba Health and Wellness (Brandon and Winnipeg sites), the Saskatoon Regional Health Authority, and particularly the Vancouver Coastal Health Authority, for their support on data collection and community engagement.
Ethical review
Research ethics board review was obtained in writing from each of the regions in which data were collected and from the Health Canada/Public Health Agency of Canada Research Ethics Board.
Conflicts of interest
Dr. Gina Agarwal was commissioned to lead this project by the Applied Research Division of the Health Promotion and Chronic Disease Prevention Branch of the Public Health Agency of Canada.
Authors’ contributions and statement
GA, YJ, HM and YM contributed substantially to the study design and drafted the paper. HO provided methodological advice for data analysis. SRVK and CL analysed the data. MF developed site collection protocols and completed data acquisition. GA, YJ, CL and HO reviewed and revised the paper. All authors read and gave final approval of this version to be published and agreed to be guarantors of the work.
The content and views expressed in this article are those of the authors and do not necessarily reflect those of the Government of Canada.
References:
- Footnote 1
-
Oza-Frank R, Ali MK, Vaccarino V, Narayan KV. Asian Americans: diabetes prevalence across US and World Health Organization weight classifications. Diabetes Care. 2009;32(9):1644-6.
- Footnote 2
-
Rana A, de Souza RJ, Kandasamy S, Lear SA, Anand SS. Cardiovascular risk among South Asians living in Canada: a systematic review and meta-analysis. CMAJ Open. 2014;2(3):E183-91.
- Footnote 3
-
Creatore MI, Moineddin R, Booth G, et al. Age-and sex-related prevalence of diabetes mellitus among immigrants to Ontario, Canada. CMAJ. 2010;182(8):781-9.
- Footnote 4
-
Chan JC, Malik V, Jia W, Kadowaki T, Yajnik CS, Yoon KH, Hu FB. Diabetes in Asia: epidemiology, risk factors, and pathophysiology. JAMA. 2009;301(20):2129-40.
- Footnote 5
-
Patel KC, Bhopal R. Diabetes epidemic in the South Asian Diaspora: action before desperation. J Royal Soc Med. 2007;100(3):115-6.
- Footnote 6
-
Ramachandran A, Ma W. RC and Snehalatha C. Diabetes in Asia. Lancet. 2010;375(9712):408-18.
- Footnote 7
-
Fischbacher CM, Hunt S, Alexander L. How physically active are South Asians in the United Kingdom? A literature review. J Public Health (Oxf). 2004;26(3):250-8.
- Footnote 8
-
Kahn SE. The relative contributions of insulin resistance and beta-cell dysfunction to the pathophysiology of type 2 diabetes. Diabetologia. 2003;46(1):3-19.
- Footnote 9
-
Raji A, Seely EW, Arky RA, Simonson DC. Body fat distribution and insulin resistance in healthy Asian Indians and Caucasians. J Clin Endocrinol Metab. 2001;86(11):5366-71.
- Footnote 10
-
Neel JV. Diabetes mellitus: a “thrifty” genotype rendered detrimental by “progress”? Am J Hum Genet. 1962;14(4):353.
- Footnote 11
-
Gujral UP, Pradeepa R, Weber MB, Narayan KM, Mohan V. Type 2 diabetes in South Asians: similarities and differences with white Caucasian and other populations. Ann N Y Acad Sci. 2013;1281(1):51-63.
- Footnote 12
-
Chan JC, Malik V, Jia W, Kadowaki T, Yajnik CS, Yoon KH, Hu FB. Diabetes in Asia: epidemiology, risk factors, and pathophysiology. JAMA. 2009;301(20):2129-40.
- Footnote 13
-
Drong AW, Lindgren CM, McCarthy MI. The genetic and epigenetic basis of type 2 diabetes and obesity. Clin Pharmacol Ther. 2012;92(6):707-15.
- Footnote 14
-
Kulkarni KD. Food, culture, and diabetes in the United States. Clin Diabetes. 2004;22(4):190-2.
- Footnote 15
-
Chui T, Flanders J, Anderson T. Immigration and ethnocultural diversity in Canada. Ottawa (ON): Statistics Canada; 2013. Catalogue no. 99-010-XWE2011001. Available at: https://www12.statcan.gc.ca/nhs-enm/2011/as-sa/99-010-x/99-010-x2011001-eng.cfm
- Footnote 16
-
Malenfant ÉC, Lebel A, Martel L. Projections of the Diversity of the Canadian Population, 2006-2031. Ottawa (ON): Statistics Canada, Demography Division; 2010. Catalogue no. 91-551-X. Available at: http://www.statcan.gc.ca/daily-quotidien/100309/dq100309a-eng.htm
- Footnote 17
-
Webb DR, Gray LJ, Khunti K, et al. Screening for diabetes using an oral glucose tolerance test within a Western multi-ethnic population identifies modifiable cardiovascular risk: the ADDITION-Leicester study. Diabetologia. 2011;54(9):2237-46. doi: 10.1007/s00125-011-2189-2.
- Footnote 18
-
Pan XR, Li GW, Hu YH, et al. Effects of diet and exercise in preventing NIDDM in people with impaired glucose tolerance. The Da Qing IGT and Diabetes Study. Diabetes Care. 1997;20:537-44.
- Footnote 19
-
Knowler WC, Barrett-Connor E, Fowler SE, et al. The Diabetes Prevention Program Research Group. Reduction in the incidence of type 2 diabetes with lifestyle intervention or metformin. N Engl J Med. 2002;346:393-403.
- Footnote 20
-
Lindström J, Ilanne-Parikka P, Peltonen M, et al. The Finnish Diabetes Prevention Study Group: sustained reduction in the incidence of type 2 diabetes by lifestyle intervention: follow-up of the Finnish Diabetes Prevention Study. Lancet. 2006;368:1673-9.
- Footnote 21
-
Lindström J, Tuomilehto J. The diabetes risk score. Diabetes care. 2003;26(3):725-31.
- Footnote 22
-
Cheng AY. Canadian Diabetes Association 2013 clinical practice guidelines for the prevention and management of diabetes in Canada. Can J Diabetes. 2013;37:S1-3.
- Footnote 23
-
Robinson CA, Agarwal G, Nerenberg K. Validating the CANRISK prognostic model for assessing diabetes risk in Canada's multi-ethnic population. Chronic Dis Inj Can. 2011;32(1):19-31.
- Footnote 24
-
Agarwal G, Jiang Y, Rogers Van Katwyk S, et al. Effectiveness of the CANRISK tool in the identification of dysglycemia in First Nations and Métis in Canada. Health Promot Chronic Dis Prev Can. 2018;38(2):55-63.
- Footnote 25
-
Cameron AJ, Sicree RA, Zimmet PZ, et al. Cut‐points for waist circumference in Europids and South Asians. Obesity. 2010;18(10):2039-46.
- Footnote 26
-
Barba C, Cavalli-Sforza T, Cutter J, Darnton-Hill I. Appropriate body-mass index for Asian populations and its implications for policy and intervention strategies. WHO Expert Consultation. Lancet. 2004;363(9403):157.
- Footnote 27
-
Razak F, Anand SS, Shannon H, et al. Defining obesity cut points in a multiethnic population. Circulation. 2007;115(16):2111-8.
- Footnote 28
-
Obesity: preventing and managing the global epidemic. Report of a WHO consultation. Geneva, Switzerland: World Health Organization Technical Report Series; 2000.
- Footnote 29
-
Wharton S, Sharma AM, Lau DC. Weight management in diabetes. Canadian Diabetes Association Clinical Practice Guidelines Expert Committee. Can J Diabetes. 2013;37 Suppl 1:S82-6.
- Footnote 30
-
World Health Organization. Definition and diagnosis of diabetes mellitus and intermediate hyperglycemia: report of a WHO consultation. Geneva, Switzerland: WHO. 2006.
- Footnote 31
-
Hosmer Jr DW, Lemeshow S, Sturdivant RX. Applied logistic regression. Vol. 398. John Wiley & Sons; 2013.
- Footnote 32
-
Mohan V, Deepa R, Deepa M, Somannavar S, Datta M. A simplified Indian Diabetes Risk Score for screening for undiagnosed diabetic subjects. J Assoc Physicians India. 2005;53:759-63.
- Footnote 33
-
Fraser Health Authority. South Asian Health Report [Internet]. 2015 [cited 2016 Sep 19]. Available at: http://www.fraserhealth.ca/about-us/health-reports/
- Footnote 34
-
Statistics Canada. The South Asian Community in Canada [Internet]. Ottawa (ON): Statistics Canada; 2007. Available at: http://www.statcan.gc.ca/pub/89-621-x/89-621-x2007006-eng.htm#7