
Original quantitative research – Sentinel surveillance of suspected opioid-related poisonings and injuries: trends and context derived from the electronic Canadian Hospitals Injury Reporting and Prevention Program, March 2011 to June 2017
Health Promotion and Chronic Disease Prevention in Canada
Minh T. Do, PhDAuthor reference 1Author reference 2Author reference 3; Vicky C. Chang, MPHAuthor reference 1Author reference 2; Semra Tibebu, MPHAuthor reference 1Author reference 2; Wendy Thompson, MScAuthor reference 1; Anne-Marie Ugnat, PhDAuthor reference 1
https://doi.org/10.24095/hpcdp.38.9.03
This article has been peer reviewed.
Author references:
- Author reference 1
-
Public Health Agency of Canada, Ottawa, Ontario, Canada
- Author reference 2
-
Dalla Lana School of Public Health, University of Toronto, Toronto, Ontario, Canada
- Author reference 3
-
Department of Health Sciences, Carleton University, Ottawa, Ontario, Canada
Correspondence: Minh T. Do, Surveillance and Epidemiology Division, Public Health Agency of Canada, 785 Carling Avenue, Ottawa, ON K1A 0K9; Tel: 613-797-7587; Fax: 613-941-2057; Email: minht.do@canada.ca
Abstract
Introduction: The opioid epidemic is currently a major public health problem in Canada. As such, knowledge of upstream risk factors associated with opioid use is needed to inform injury prevention, health promotion and harm reduction efforts.
Methods: We analyzed data extracted from 11 pediatric and 6 general hospital emergency departments (EDs) as part of the electronic Canadian Hospitals Injury Reporting and Prevention Program (eCHIRPP) from March 2011 to June 2017. We identified suspected opioid-related injuries using search strings and manually verified them. We computed age-adjusted and sex-stratified proportionate injury ratios (PIRs) and 95% confidence intervals (CIs) to compare opioid-related injuries to all injuries in eCHIRPP. Negative binomial regression was used to determine trends over time. We conducted qualitative analyses of narratives to identify common themes across life stages.
Results: Between March 2011 and June 2017, 583 suspected opioid-related poisoning/injury cases were identified from eCHIRPP. Most of the cases were females (55%). Many of the injuries occurred in patients’ own homes (51%). Forty-five percent of the injuries were intentional self-harm. Among children (aged 1–9 years), most injuries were caused by inadvertent consumption of opioids left unattended. Among youth (aged 10–19 years) and adults (aged 20–49 years), opioid use was associated with underlying mental illness. Overall, the average annual percent change (AAPC) in the rate of injuries (per 100 000 eCHIRPP cases) has been increasing since 2012 (AAPC = 11.9%, p < .05). The increase is particularly evident for males (AAPC = 16.3%, p < .05). Compared to other injuries, people with suspected opioid-related injuries were more likely to be admitted to hospital (PIR = 5.3, 95% CI: 4.6–6.2).
Conclusion: The upstream determinants of opioid-related injuries are complex and likely vary by subpopulations. Therefore, continued monitoring of risk factors is important in providing the evidence necessary to prevent future overdoses and deaths.
Keywords: emergency department, ED, opioid, opiate, poisoning, surveillance, CHIRPP, Canada
Highlights
- Compared to all injuries in eCHIRPP, those with opioid-related injuries were more likely to be female, and the injuries were more likely to occur with the intent to self-harm, at home, between 12:00 a.m. and 7:59 a.m. and to result in admission to the hospital.
- The average annual percentage change (AAPC) in the number of suspected opioid-related injury/poisoning cases (per 100 000 eCHIRPP cases) has been increasing since 2012 (AAPC = 11.9%, p < .05). The increase is particularly evident for males (AAPC = 16.3%, p < .05).
- Among young children (aged < 5 years), access to medication (e.g. pills found on the floor), combined with lack of supervision, was the most common factor contributing to opioid-related poisoning.
- Suicide attempt accounted for the largest proportion of cases in youth (33%), followed by older adults (28%) and adults (9%). Recreational use of opioids was most commonly reported by adults.
Introduction
In recent years, the number of deaths and hospitalizations related to opioid use has been increasing dramatically in some regions within Canada, with little evidence that the crisis is abating. In 2016, there were 2861 apparent opioid-related deaths (8.1 per 100 000) in Canada, far exceeding the number of motor vehicle fatalities (5.2 per 100 000) in 2015.Footnote 1Footnote 2 Similarly, the Canadian Institute for Health Information (CIHI) also reported parallel increases in opioid-related emergency department (ED) visits and hospital admissions in some parts of Canada.Footnote 3 Particularly concerning were youths (aged 15–24 years), the age group for which some of the largest increases have been observed for both hospitalizations and ED visits.Footnote 3
The current opioid crisis in Canada has been driven by high opioid-prescription rates as well as the increased importation of highly potent synthetic opioids supplying the illegal market such as fentanyl and the more potent carfentanil. Although many reports have focussed on opioid-related deaths among adults, much of the current discourse surrounding the opioid crisis has failed to examine the situation in youth and adolescents. The electronic Canadian Hospitals Injury Reporting and Prevention Program (eCHIRPP) collected data from 11 pediatric hospitals and 6 general hospitals across the country on opioid-related poisonings and injuries, and thus presents an existing data source that may provide some additional insight into the crisis. In addition, this surveillance system collected narrative information on circumstances prior to the injuries and poisonings, thereby providing opportunities for in-depth analyses.
Study objectives
The purpose of this study was to provide an overview of emergency department visits for suspected opioid-related poisonings or injuries recorded in eCHIRPP from March 2011 to June 2017. Specifically, the objectives of this study were to
- describe the epidemiology (person, place and time) of opioid-related poisonings/injuries and compare it to that of all other injury events in eCHIRPP;
- examine temporal trends (2011–2016), by sex and age group; and
- describe contextual factors (e.g. intent, preinjury events) surrounding opioid-related poisonings/injuries (and identify patterns by life stages) through qualitative evaluation.
Methods
Data source
eCHIRPP is an ED-based injury and poisoning sentinel surveillance system funded and administered by the Public Health Agency of Canada (PHAC). Details on the development and recent advances of the CHIRPP have been described elsewhere.Footnote 4 Established in 1990, the CHIRPP currently operates in 11 pediatric and 6 general hospitals across Canada. During their visit to the ED of a participating CHIRPP hospital, patients (or someone on their behalf, e.g. a parent or guardian) are asked to fill out a reporting form detailing the circumstances of the injury/poisoning event (e.g. time, place, activity), including both close-ended and open-ended (free-text) questions. The attending physician or other hospital staff then complete the form by providing details on clinical features (e.g. body part and nature of injury) and treatment or disposition. Since 2011, instead of centralized data entry and coding by PHAC, data have been entered directly by CHIRPP site coordinators into a web-based electronic system (eCHIRPP), which greatly enhances the timeliness of data entry and dissemination. PHAC coders then verify the data accessed through the online eCHIRPP platform, perform interpretive coding of free-text narratives and conduct data quality checks. For the purposes of this study, analyses were based on data recorded in eCHIRPP from March 2011 to June 27, 2017 (all ages; total records searched: n = 786 758). The quality of CHIRPP data has been previously evaluated.Footnote 5Footnote 6
Case selection
We conducted a search of all relevant data fields, including narratives, product codes and substances, within the eCHIRPP database to identify all suspected opioid-related poisonings and injuries. We defined a “suspected” injury event as one meeting the search criteria. The search strategy was developed using search terms that included generic drug names (e.g. “amidone,” “buprenorphine,” “codeine,” “fentanyl,” “heroin,” “hydrocodone,” “hydromorphone,” “laudanum,” “meperidine,” “methadone,” “morphine,” “naloxone,” “oxycodone” and “tramadol”), common trade (brand) names (e.g. “Dilaudid,” “Duragesic,” “Empracet,” “Emtec,” “Endocet,” “Lenoltec,” “MS Contin,” “Narcan,” “OxyContin,” “Oxycocet,” “Percocet,” “Roxicet,” “Statex,” “Suboxone,” “Tramacet,” “Tylenol” (#1, 2, 3 or 4) and “Vicodin”), and nonspecific terms (e.g. “opiate,” “opioid” and “opium”). Synonyms, truncated terms and different spellings/misspellings were also searched where applicable. To ensure the accuracy of case selection, we reviewed the narratives of all cases captured by the search and excluded cases where the poisoning/injury event did not involve opioids (e.g. taking regular Tylenol [acetaminophen] only, or taking opioid pain medication after an injury event with no indication of poisoning or adverse reaction). Cases for which the date of poisoning/injury or date of birth were unknown were excluded (n = 2).
Variables
Variables pertaining to person (age and gender), place (location where the poisoning/injury event occurred) and time (year, day of the week and time of the day) were obtained from the eCHIRPP database. Other variables of interest included intent of poisoning/injury (unintentional, intentional self-harm or assault/maltreatment) and disposition (observation or treatment in ED or admission to hospital). Additionally, since drugs and substances are not routinely coded or are only coded into broad categories in the eCHIRPP database, we reviewed the narrative fields (Injury Event Description, Product, and Substance) of all identified cases to manually code specific opioids and any co-occurring substances (e.g. alcohol, medications, illicit drugs) involved. For combination products such as those containing acetaminophen plus an opioid (e.g. codeine in Tylenol 3, oxycodone in Percocet), the nonopioid component (acetaminophen) was coded as a co-occurring substance.
Statistical analysis
We conducted descriptive analyses to examine the distribution of characteristics (age, location, day of week, time of day, intent and disposition) of suspected opioid-related poisoning and injury cases, overall and stratified by gender. We calculated means and standard deviations (SDs) for continuous variables, while frequency distributions (counts and proportions) were computed for categorical variables. We also generated frequency distributions to identify the most commonly involved opioids and co-occurring substances by age group (< 10, 10–19, 20–49, and ≥ 50 years) and gender. Furthermore, we used proportionate injury ratios (PIRs) to compare specific characteristics of opioid-related cases to all injury/poisoning cases within the eCHIRPP database. The PIR was calculated as a ratio of the observed number of opioid-related cases for a given characteristic (e.g. intentional self-harm) to the expected number of cases based on age- (10-year age groups) and sex-specific proportions of that characteristic among all eCHIRPP cases.Footnote 7 We calculated PIRs with 95% confidence intervals (CIs) for both sexes combined, and separately for males and females.
Since CHIRPP is not population-based, incidence rates could not be determined; instead, we calculated the proportion of opioid-related cases among all injury/poisoning cases in eCHIRPP (presented as number of opioid-related cases per 100 000 eCHIRPP cases) for each year. We evaluated temporal trends in the proportion of opioid-related poisonings/injuries among all eCHIRPP cases using negative binomial regression and calculated average annual percent changes (AAPCs) with 95% CIs, overall and by gender and age group. The AAPC was calculated using the following formula: AAPC = [eβ ‒ 1] × 100, where β is the slope from the regression of log proportions on year.Footnote 8 We included 2017 data up to the month of June but excluded anything between January and June 2017 from the trend analysis because of incomplete data due to potential delays in data entry by CHIRPP sites and possible differential (i.e. more timely) reporting of opioid-related cases relative to other injuries. We also conducted analyses excluding cases from 2011 (i.e. the year CHIRPP transitioned to eCHIRPP) and then including 2011 but excluding 2016 (because of delayed reporting by some hospitals) to examine the potential impact on trends. We also conducted additional sensitivity analysis restricting to only the 11 pediatric hospitals to determine potential impacts on the trends. All analyses were performed using SAS Enterprise Guide, version 5.1 (SAS Institute Inc., Cary, NC, USA) and Microsoft Excel 2014 (Microsoft Corp., Redmond, WA, USA).
Qualitative coding and analysis of narratives
To supplement the quantitative statistical analysis as described above, we conducted a qualitative analysis of the free-text narratives to provide a better understanding of contextual factors and circumstances that may have contributed to opioid-related poisonings and injuries. We used content analysis to code the narratives through an inductive approach.Footnote 9Footnote 10 First, we scanned the narratives to identify recurrent words, phrases, events or themes. We then developed coding categories and subcategories based on key themes emerging from the data. Next, narratives of individual cases were read and re-read in detail and coded into relevant categories in an iterative process involving ongoing interpretation of data and modification of the coding scheme (e.g. adding or collapsing categories). Coding was completed independently by two members of the research team (VC and ST), and discrepancies were resolved through discussion and consensus. Given differences in risk factors and context surrounding injuries/poisonings, results were presented by specific life-stage groups: newborns and infants (aged < 1 year); toddlers and children (1–9 years); youth (10–19 years); adults (20–49 years); and older adults (≥ 50 years). In addition to descriptions and examples of the identified themes, we also reported frequencies of coded categories. Themes and contexts were grouped into broader categories based on temporality: 1) event (the injury event itself, e.g. overdose with suicidal intent); 2) proximal (more immediate/recent) factors likely contributing to the event (e.g. recent life stressors); and 3) distal (upstream) risk factors (e.g. mental health, history of substance abuse, previous self-harm/suicide attempts).
Results
Case characteristics
A total of 583 suspected opioid-related poisoning/injury events were reported to eCHIRPP between March 2011 and June 2017, of which 55% involved females. Table 1 presents basic demographic and injury characteristics of the cases, overall and by gender. Due to the nature of CHIRPP hospitals (mostly pediatric), nearly two-thirds (66%) of all cases identified involved people under 20 years of age (males: 58%, females: 72%). Youth aged 15 to 19 years accounted for the greatest proportion of cases among both males (26%) and females (38%), whereas children aged 5 to 9 years accounted for less than 1% of all cases. Overall, 48% of cases were unintentional in nature and 45% occurred with the intention to self-harm. Notably, intentional self-harm accounted for a larger proportion of cases among females (51%) than males (37%). Moreover, while cases involving patients under 10 years of age were almost exclusively unintentional, 57%, 55% and 65% of cases involving people aged 10 to 19, 20 to 49, and 50 years or older, respectively, were due to intentional self-harm (data not shown). In terms of location of injury/poisoning, the majority of cases occurred in the person’s own home (51%). Other common places of occurrence (where specified) included other people’s homes (8%) and street, highway or public road (4%). No clear patterns were observed by day of the week, with the highest and lowest number of cases occurring on Friday (16%) and Thursday (12%), respectively. Where time of the day was reported (n = 394), the largest proportion of cases occurred between 4:00 p.m. and 7:59 p.m. (27%). Of all suspected opioid-related cases, 30% resulted in admission to the hospital, with a higher proportion among females (32%) than males (27%).
| Characteristic | All | Males | Females | |||
|---|---|---|---|---|---|---|
| n | (%) | n | (%) | n | (%) | |
| Total | 583 | (100) | 261 | (44.8) | 322 | (55.2) |
| Age (years) | ||||||
| Mean (SD) | 22.1 | (17.8) | 24.1 | (19.1) | 20.5 | (16.6) |
| Median (IQR) | 16 | (13–32) | 16 | (10–38) | 16 | (14–23) |
| Age group (years) | ||||||
| < 1 | 18 | (3.1) | 8 | (3.1) | 10 | (3.1) |
| 1 | 37 | (6.3) | 15 | (5.7) | 22 | (6.8) |
| 2–9 | 73 | (12.5) | 41 | (15.7) | 32 | (9.9) |
| 10–14 | 65 | (11.1) | 20 | (7.7) | 45 | (14.0) |
| 15–19 | 189 | (32.4) | 67 | (25.7) | 122 | (37.9) |
| 20–29 | 45 | (7.7) | 19 | (7.3) | 26 | (8.1) |
| 30–39 | 46 | (7.9) | 27 | (10.3) | 19 | (5.9) |
| 40–49 | 50 | (8.6) | 32 | (12.3) | 18 | (5.6) |
| 50–64 | 44 | (7.5) | 26 | (10.0) | 18 | (5.6) |
| ≥ 65 | 16 | (2.7) | 6 | (2.3) | 10 | (3.1) |
| Intent | ||||||
| Unintentional | 280 | (48.0) | 143 | (54.8) | 137 | (42.5) |
| Intentional self-harm | 261 | (44.8) | 96 | (36.8) | 165 | (51.2) |
| Maltreatment or assault | 10 | (1.7) | 5 | (1.9) | 5 | (1.6) |
| Other/not specified | 32 | (5.5) | 17 | (6.5) | 15 | (4.7) |
| LocationTable 1 Footnote a | ||||||
| Own home | 299 | (51.3) | 116 | (44.4) | 183 | (56.8) |
| Other people's homes | 45 | (7.7) | 25 | (9.6) | 20 | (6.2) |
| Residential institution | 10 | (1.7) | 5 | (1.9) | 5 | (1.6) |
| School or public administrative location | 11 | (1.9) | 6 | (2.3) | 5 | (1.6) |
| Street, highway or public road | 24 | (4.1) | 16 | (6.1) | 8 | (2.5) |
| Trade or service location | 15 | (2.6) | 10 | (3.8) | 5 | (1.6) |
| Unspecified/unknown | 164 | (28.1) | 76 | (29.1) | 88 | (27.3) |
| Day of week | ||||||
| Monday | 88 | (15.1) | 36 | (13.8) | 52 | (16.1) |
| Tuesday | 83 | (14.2) | 41 | (15.7) | 42 | (13.0) |
| Wednesday | 89 | (15.3) | 42 | (16.1) | 47 | (14.6) |
| Thursday | 68 | (11.7) | 33 | (12.6) | 35 | (10.9) |
| Friday | 93 | (16.0) | 44 | (16.9) | 49 | (15.2) |
| Saturday | 90 | (15.4) | 42 | (16.1) | 48 | (14.9) |
| Sunday | 72 | (12.3) | 23 | (8.8) | 49 | (15.2) |
| Time of day | ||||||
| 12:00 a.m.–3:59 a.m. | 51 | (8.7) | 22 | (8.4) | 29 | (9.0) |
| 4:00 a.m.–7:59 a.m. | 28 | (4.8) | 20 | (7.7) | 8 | (2.5) |
| 8:00 a.m.–11:59 a.m. | 48 | (8.2) | 23 | (8.8) | 25 | (7.8) |
| 12:00 p.m.–3:59 p.m. | 78 | (13.4) | 33 | (12.6) | 45 | (14.0) |
| 4:00 p.m.–7:59 p.m. | 105 | (18.0) | 38 | (14.6) | 67 | (20.8) |
| 8:00 p.m.–11:59 p.m. | 84 | (14.4) | 38 | (14.6) | 46 | (14.3) |
| Unknown | 189 | (32.4) | 87 | (33.3) | 102 | (31.7) |
| Disposition | ||||||
| Left without being seen or advice only | 52 | (8.9) | 23 | (8.8) | 29 | (9.0) |
| Treated in ED, follow-up PRN | 113 | (19.4) | 62 | (23.8) | 51 | (15.8) |
| Treated in ED, follow-up required | 93 | (16.0) | 37 | (14.2) | 56 | (17.4) |
| Observed in ED, follow-up PRN | 100 | (17.2) | 52 | (19.9) | 48 | (14.9) |
| Observed in ED, follow-up required | 52 | (8.9) | 17 | (6.5) | 35 | (10.9) |
| Admitted to hospital | 173 | (29.7) | 70 | (26.8) | 103 | (32.0) |
Abbreviations: eCHIRPP, electronic Canadian Hospitals Injury Reporting and Prevention Program; ED, emergency department; IQR, interquartile range; PRN, as needed; SD, standard deviation.
|
||||||
Comparisons with all cases in eCHIRPP
Table 2 presents PIRs comparing suspected opioid-related poisoning/injury cases to all cases in eCHIRPP in terms of gender, intent, location, day of the week, time of the day and disposition. Compared to all injury/poisoning cases in eCHIRPP, opioid-related cases were significantly more likely to involve females (PIR = 1.30, 95% CI: 1.16–1.45), to occur with the intent to self-harm (PIR = 25.00, 95% CI: 22.15–28.23) and to occur in the person's own home (PIR = 1.98, 95% CI: 1.77–2.22) or in a residential institution (PIR = 2.61, 95% CI: 1.40–4.85). PIRs for day of the week were not significantly different compared to eCHIRPP cases in general, except that a lower proportion of opioid-related cases occurred on Sunday among males (PIR = 0.62, 95% CI: 0.42–0.94). Significantly elevated proportions of opioid-related cases occurred from 12:00 a.m. to 3:59 a.m. (PIR = 3.01, 95% CI: 2.29–3.96) and from 4:00 a.m. to 7:59 a.m. (PIR = 1.88, 95% CI: 1.30–2.73). Furthermore, compared to all cases in eCHIRPP, opioid-related cases were significantly more likely to be observed in the ED (follow-up as needed) (PIR = 5.54, 95% CI: 4.64–6.86) or admitted to the hospital (PIR = 5.32, 95% CI: 4.58–6.17).
| Characteristic | All | Males | Females | |||
|---|---|---|---|---|---|---|
| PIR | 95% CI | PIR | 95% CI | PIR | 95% CI | |
| Gender | ||||||
| Male | 0.78 | 0.69–0.88 | n/a | n/a | ||
| Female | 1.30 | 1.16–1.45 | n/a | n/a | ||
| Intent | ||||||
| Unintentional | 0.50 | 0.44–0.56 | 0.57 | 0.48–0.67 | 0.44 | 0.38–0.52 |
| Intentional self-harm | 25.00 | 22.15–28.23 | 44.25 | 36.23–54.05 | 19.95 | 17.13–23.24 |
| Maltreatment or assault | 1.25 | 0.67–2.32 | 1.08 | 0.45–2.61 | 1.48 | 0.61–3.55 |
| Other/not specified | 11.08 | 7.83–15.66 | 13.64 | 8.48–21.95 | 9.13 | 5.50–15.14 |
| LocationTable 2 Footnote a | ||||||
| Own home | 1.98 | 1.77–2.22 | 1.80 | 1.50–2.16 | 2.11 | 1.83–2.44 |
| Other people's homes | 1.32 | 0.99–1.77 | 1.63 | 1.10–2.41 | 1.07 | 0.69–1.65 |
| Residential institution | 2.61 | 1.40–4.85 | 3.50 | 1.46–8.40 | 2.08 | 0.86–4.99 |
| School or public administrative location | 0.13 | 0.07–0.23 | 0.18 | 0.08–0.40 | 0.10 | 0.04–0.23 |
| Street, highway or public road | 0.54 | 0.36–0.81 | 0.81 | 0.50–1.32 | 0.33 | 0.16–0.65 |
| Trade or service location | 0.94 | 0.57–1.57 | 1.43 | 0.77–2.66 | 0.56 | 0.23–1.35 |
| Unspecified/unknown | 1.06 | 0.91–1.24 | 1.01 | 0.80–1.26 | 1.11 | 0.90–1.37 |
| Day of week | ||||||
| Monday | 1.09 | 0.88–1.34 | 1.00 | 0.72–1.39 | 1.16 | 0.88–1.52 |
| Tuesday | 1.02 | 0.82–1.27 | 1.13 | 0.83–1.54 | 0.93 | 0.69–1.26 |
| Wednesday | 1.08 | 0.88–1.33 | 1.14 | 0.84–1.54 | 1.04 | 0.78–1.38 |
| Thursday | 0.83 | 0.65–1.05 | 0.91 | 0.64–1.27 | 0.77 | 0.55–1.07 |
| Friday | 1.12 | 0.91–1.37 | 1.17 | 0.87–1.57 | 1.08 | 0.82–1.43 |
| Saturday | 0.99 | 0.81–1.22 | 1.02 | 0.75–1.38 | 0.97 | 0.73–1.29 |
| Sunday | 0.87 | 0.69–1.09 | 0.62 | 0.42–0.94 | 1.06 | 0.80–1.41 |
| Time of day | ||||||
| 12:00 a.m.–3:59 a.m. | 3.01 | 2.29–3.96 | 2.76 | 1.82–4.19 | 3.23 | 2.25–4.65 |
| 4:00 a.m.–7:59 a.m. | 1.88 | 1.30–2.73 | 2.89 | 1.86–4.48 | 1.01 | 0.50–2.01 |
| 8:00 a.m.–11:59 a.m. | 0.54 | 0.40–0.71 | 0.55 | 0.37–0.83 | 0.52 | 0.35–0.78 |
| 12:00 p.m.–3:59 p.m. | 0.56 | 0.45–0.70 | 0.52 | 0.37–0.74 | 0.59 | 0.44–0.79 |
| 4:00 p.m.–7:59 p.m. | 0.71 | 0.59–0.86 | 0.59 | 0.43–0.81 | 0.80 | 0.63–1.02 |
| 8:00 p.m.–11:59 p.m. | 1.08 | 0.87–1.33 | 1.11 | 0.81–1.52 | 1.06 | 0.79–1.41 |
| Unknown | 1.95 | 1.69–2.25 | 2.03 | 1.65–2.51 | 1.88 | 1.55–2.28 |
| Disposition | ||||||
| Left without being seen, or advice only | 0.36 | 0.27–0.47 | 0.39 | 0.26–0.59 | 0.33 | 0.23–0.48 |
| Treated in ED, follow-up PRN | 0.49 | 0.41–0.59 | 0.59 | 0.46–0.75 | 0.41 | 0.31–0.54 |
| Treated in ED, follow-up required | 0.67 | 0.55–0.82 | 0.55 | 0.40–0.76 | 0.78 | 0.60–1.02 |
| Observed in ED, follow-up PRN | 5.64 | 4.64–6.86 | 6.92 | 5.28–9.09 | 4.69 | 3.54–6.23 |
| Observed in ED, follow-up required | 3.77 | 2.88–4.95 | 4.74 | 2.95–7.62 | 3.43 | 2.46–4.78 |
| Admitted to hospital | 5.32 | 4.58–6.17 | 3.81 | 3.01–4.81 | 7.29 | 6.01–8.84 |
Abbreviations: CI, confidence interval; eCHIRPP, electronic Canadian Hospitals Injury Reporting and Prevention Program; ED, emergency department; n/a, not applicable; PIR, proportionate injury ratio; PRN, as needed.
| ||||||
Temporal trends
Table 3 provides results of trends analyses for suspected opioid-related poisonings and injuries for the period between 2011 and 2016. In order to assess the robustness of the trends, we also examined different points within this period. Overall, there was a consistent increasing trend for suspected opioid-related poisonings/injuries for this period. Although the confidence intervals were large, significant AAPCs in the number of suspected opioid-related injury/poisoning cases (per 100 000 eCHIRPP cases) were observed starting in 2012 (AAPC = 11.9%, p < .05). The increase is particularly evident for males (AAPC = 16.3%, p < .05). Additional analyses were also conducted restricting to only the 11 pediatric hospitals to determine potential impacts on the trends. Overall, the pattern of results described above did not change (data not shown).
| Period and group | AAPC (%) | 95% CI | p |
|---|---|---|---|
| 2011–2016 | |||
| All | 6.00 | –2.81, 15.61 | .188 |
| Males | 6.89 | –6.06, 21.63 | .312 |
| Females | 5.12 | –3.69, 14.74 | .262 |
| 2011–2015 | |||
| All | 7.49 | –5.60, 22.41 | .276 |
| Males | 9.14 | –9.66, 31.86 | .365 |
| Females | 6.12 | –7.24, 21.41 | .387 |
| 2012–2016 | |||
| All | 11.89 | 2.95, 21.61 | .008Table 3 Footnote * |
| Males | 16.34 | 2.60, 31.93 | .018Table 3 Footnote * |
| Females | 8.27 | –3.55, 21.54 | .178 |
| 2012–2015 | |||
| All | 19.48 | 11.01, 28.60 | < .001Table 3 Footnote * |
| Males | 28.94 | 18.30, 40.54 | < .001Table 3 Footnote * |
| Females | 12.53 | –7.28, 36.57 | .232 |
Abbreviations: AAPC, average annual percentage change; CI, confidence interval; eCHIRPP, electronic Canadian Hospitals Injury Reporting and Prevention Program.
|
|||
Opioid types and co-occurring substances
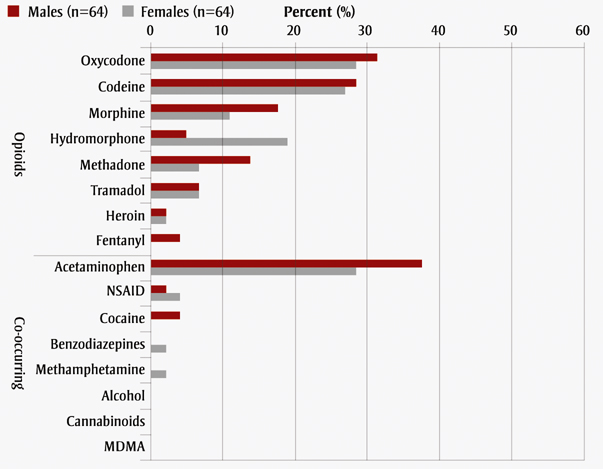
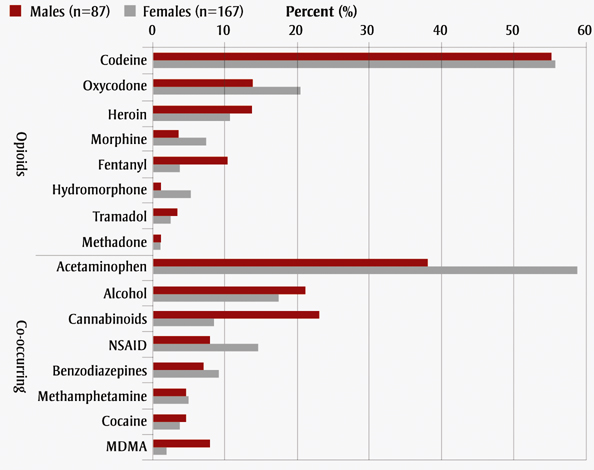
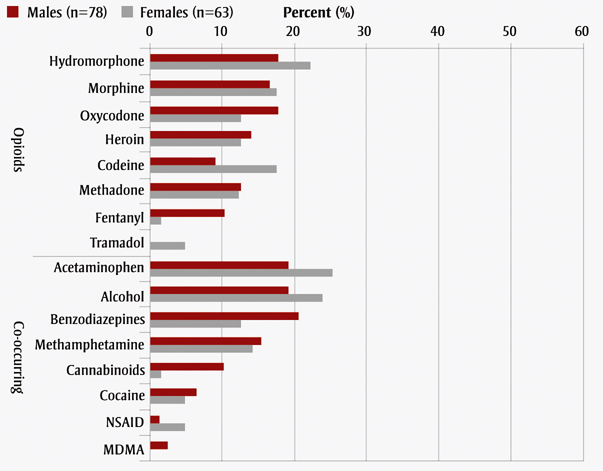
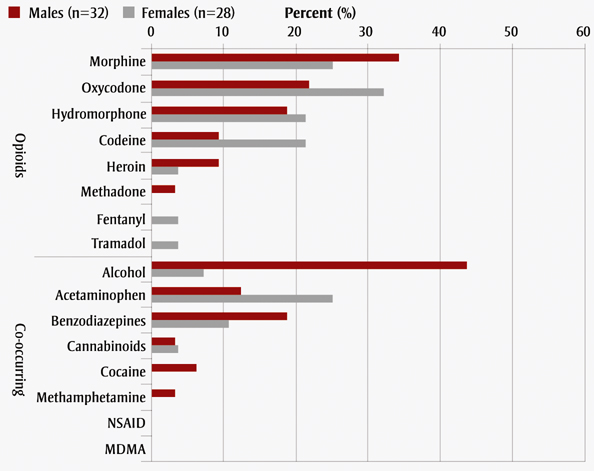
The types of opioids and co-occurring substances most commonly used in suspected opioid-related cases are summarized in Figure 1. The most commonly used types of opioids among children (< 10 years) and youth (10 -19 years) were oxycodone (30%) and codeine (56%), respectively, frequently as combination medication products containing opioids plus acetaminophen (e.g. Tylenol 3, Percocet). In male adults (20 -49 years), use of hydromorphone (18%), oxycodone (18%), morphine (17%), and heroin (14%) was most common. In female adults, use of hydromorphone (22%), codeine (18%), and morphine (18%) was most common. Morphine was the opioid most commonly used by male adults aged 50 years or older (34%) and the second most common type of opioid used by older female adults (25%), after oxycodone (32%). Co-occurring substance use other than acetaminophen was common in both males and females across all age groups (except for < 10 years, with very few cases). Alcohol was the most common co-occurring substance used in older male adults (44%) and the second most common co-occurring substance among youth and adults. Other common co-occurring substances included cannabinoids, benzodiazepines, nonsteroidal anti-inflammatory drugs, methamphetamine and cocaine.
Figure 1. Most commonly used opioids and co-occurring substances among suspected opioid-related cases, by age group and gender, eCHIRPP, March 2011 to June 2017
Figure 1A. Age: <10 years
Text Description
| Category | Substance | Males (n=64) | Females (n=64) |
|---|---|---|---|
| Opioids | Oxycodone | 31.3 | 28.1 |
| Codeine | 28.1 | 26.6 | |
| Morphine | 17.1 | 10.9 | |
| Hydromorphone | 4.7 | 18.8 | |
| Methadone | 14.1 | 6.2 | |
| Tramadol | 6.2 | 6.2 | |
| Heroin | 1.6 | 1.6 | |
| Fentanyl | 3.1 | 0 | |
| Co-occurring | Acetaminophen | 37.5 | 28.1 |
| NSAID | 1.6 | 3.1 | |
| Cocaine | 3.1 | 0 | |
| Benzodiazepines | 0 | 1.6 | |
| Methamphetamine | 0 | 1.6 | |
| Alcohol | 0 | 0 | |
| Cannabinoids | 0 | 0 | |
| MDMA | 0 | 0 |
Figure 1B. Age: 10-19 years
Text Description
| Category | Substance | Males (n=87) | Females (n=167) |
|---|---|---|---|
| Opioids | Codeine | 55.2 | 55.7 |
| Oxycodone | 13.8 | 20.4 | |
| Heroin | 13.8 | 10.8 | |
| Morphine | 3.4 | 7.2 | |
| Fentanyl | 10.3 | 3.6 | |
| Hydromorphone | 1.1 | 5.4 | |
| Tramadol | 3.4 | 2.4 | |
| Methadone | 1.1 | 1.2 | |
| Co-occurring | Acetaminophen | 37.9 | 58.7 |
| Alcohol | 21.1 | 17.4 | |
| Cannabinoids | 23 | 8.4 | |
| NSAID | 8 | 14.4 | |
| Benzodiazepines | 6.9 | 9 | |
| Methamphetamine | 4.6 | 4.8 | |
| Cocaine | 4.6 | 3.6 | |
| MDMA | 8 | 1.8 |
Figure 1C. Age: 20-49 years
Text Description
| Category | Substance | Males (n=78) | Females (n=63) |
|---|---|---|---|
| Opioids | Hydromorphone | 17.9 | 22.2 |
| Morphine | 16.7 | 17.5 | |
| Oxycodone | 17.9 | 12.7 | |
| Heroin | 14.1 | 12.7 | |
| Codeine | 9 | 17.5 | |
| Methadone | 12.8 | 12.7 | |
| Fentanyl | 10.3 | 1.6 | |
| Tramadol | 0 | 4.8 | |
| Co-occurring | Acetaminophen | 19.2 | 25.4 |
| Alcohol | 19.2 | 23.8 | |
| Benzodiazepines | 20.5 | 12.7 | |
| Methamphetamine | 15.4 | 14.3 | |
| Cannabinoids | 10.3 | 1.6 | |
| Cocaine | 6.4 | 4.8 | |
| NSAID | 1.3 | 4.8 | |
| MDMA | 2.6 | 0 |
Figure 1D. Age: ≥50 years
Text Description
| Category | Substance | Males (n=32) | Females (n=28) |
|---|---|---|---|
| Opioids | Morphine | 34.4 | 25 |
| Oxycodone | 21.9 | 32.1 | |
| Hydromorphone | 18.8 | 21.4 | |
| Codeine | 9.4 | 21.4 | |
| Heroin | 9.4 | 3.6 | |
| Methadone | 3.1 | 0 | |
| Fentanyl | 0 | 3.6 | |
| Tramadol | 0 | 3.6 | |
| Co-occurring | Alcohol | 43.8 | 7.1 |
| Acetaminophen | 12.5 | 25 | |
| Benzodiazepines | 18.8 | 10.7 | |
| Cannabinoids | 3.1 | 3.6 | |
| Cocaine | 6.3 | 0 | |
| Methamphetamine | 3.1 | 0 | |
| NSAID | 0 | 0 | |
| MDMA | 0 | 0 |
Abbreviations: eCHIRPP, electronic Canadian Hospitals Injury Reporting and Prevention Program; MDMA, 3,4-methylenedioxymethamphetamine (i.e., ecstasy); NSAID, nonsteroidal anti-inflammatory drug.
Note: Percentages do not add up to 100% because more than one opioid and/or co-occurring substance may be involved, and only the most common types are shown here.
Qualitative analysis of narratives
Qualitative analyses of narratives are summarized in Table 4. Among young children (aged < 5 years), access to medication (e.g. pills found on the floor, retrieved from purse or cabinet), in combination with lack of supervision (e.g. playing alone), is the most common factor contributing to opioid-related poisoning. In addition, of the poisoning cases in children younger than one year old, mothers who took opioids while pregnant were reported in six cases.
Suicide attempt (where mentioned in narrative) accounted for the largest proportion of cases in youth (33%), followed by older adults (28%) and adults (9%). Recreational use of opioids was most commonly reported by adult cases. Mental health was a major reoccurring theme identified from the narratives among youth, adults and older adults. Proximal (direct/recent) contributing factors included recent life stressors (e.g. argument with family, breakup, death of a loved one) and emotional distress (e.g. feeling sad, upset, depressed or stressed). Distal factors (upstream risk factors) included history of substance abuse, depression or other mental health issues and previous self-harm or suicide attempts. Many opioid-related cases also involved other injuries (co-occurring with poisoning or as a result of taking opioids). For example, self-inflicted injuries (e.g. cutting wrists) were common among youth, particularly females aged 15 to 19, and fall-related injuries (e.g. feeling dizzy from medication) were common among older adults. Other injuries included motor vehicle crashes and drug-related assaults.
| Age group; total # of cases | Theme | Description/examples | Frequency n (%) | Selected case characteristics: n (%) |
|---|---|---|---|---|
Newborns & infants n = 18 |
Newborn withdrawal |
|
6 (33%) |
Age 0–2 months: 6 (100%) |
Supervision/accessibility |
|
9 (50%) |
Age 9–11 months: 8 (89%) |
|
Toddlers & children n = 110 |
Supervision/accessibility |
|
99 (90%) |
Male: 50 (51%) |
Incorrect medication/dose |
|
5 (5%) |
— |
|
Youth n = 254 |
Event – Suicide attempt |
|
83 (33%) | Female: 63 (76%) |
Event – Recreational |
|
38 (15%) | Female: 20 (53%) |
|
Event – Therapeutic |
|
13 (5%) | Female: 7 (54%) |
|
Proximal – Emotional distress |
|
38 (15%) | Female: 28 (74%) |
|
Proximal – Recent life stressors |
|
31 (12%) | Female: 22 (71%) |
|
|
Distal – History of mental health‒related issues |
History of substance abuse or addiction (including withdrawal) |
20 (8%) | Male: 12 (60%) |
|
History of depression or other mental health issues (e.g. PTSD, “hearing voices”) |
11 (4%) | Female: 5 (45%) |
||
History of intentional self-harm (e.g. cutting) or previous suicide attempt(s) |
8 (3%) | Female: 7 (88%) |
||
Other injury – Intentional self-harm |
Self-inflicted injuries (e.g. cutting wrists, strangling) where opioids were involved |
19 (7%) |
Female: 18 (95%) |
|
Other injury – Unintentional |
Injuries due to MVC, falls or other mechanism (under the influence of opioids) |
11 (4%) |
Female: 6 (55%) |
|
Other injury – Assault |
Injuries due to assault by others (e.g. kicked), opioids involved |
— |
— |
|
Adults n = 141 |
Event – Recreational |
|
21 (15%) |
Male: 12 (57%) |
Event – Suicide attempt |
|
13 (9%) |
Female: 8 (62%) |
|
Event – Therapeutic |
|
5 (4%) |
— |
|
Proximal – Recent life stressors |
|
10 (7%) |
Female: 67% |
|
Proximal – Emotional distress |
|
8 (6%) |
||
Distal – History of substance abuse |
|
18 (13%) |
Male: 11 (61%) |
|
Other injury – Unintentional |
Fall (e.g. walking after taking opioid medication/drug) |
8 (6%) |
Male: 15 (65%) |
|
MVC (e.g. driving under the influence of opioids) |
— |
|||
Other unintentional injury involving opioids (e.g. needlestick, hitting head) |
11 (8%) |
|||
Other injury – Intentional self-harm |
Self-inflicted injuries (e.g. cutting wrists) where opioids were involved |
— |
Female: 5 (56%) |
|
Other injury – Assault |
Drug-related assault (e.g. beaten up, kicked, stabbed) |
5 (4%) |
||
Older adults (50+ years) n = 60 |
Event – Suicide attempt |
|
17 (28%) |
Male: 9 (53%) |
Event – Recreational |
|
— |
— |
|
Event – Therapeutic |
|
— |
— |
|
Proximal – Recent life stressors |
|
10 (17%) |
Female: 7 (70%) |
|
Other injury – Unintentional |
Fall-related injury under the influence of medication/drug (e.g. feeling dizzy) |
9 (15%) |
Male: 5 (56%) |
|
Other unintentional injury involving opioids (e.g. MVC) |
— |
— |
||
Other injury – Intentional self-harm |
Self-inflicted injuries (e.g. cutting) where opioids were involved |
— |
— |
|
Abbreviations: MVC, motor vehicle collision; PTSD, post-traumatic stress disorder. Note: — Suppressed due to small cell size. |
||||
Discussion
In this study, we described the epidemiology of opioid-related injuries using data collected from eCHIRPP. Consistent with the literature,Footnote 1Footnote 3 our analysis of the eCHIRPP data showed significant increases in the rate of opioid-related injuries (per 100 000 eCHIRPP events) over time. We also observed that females made up the majority (55%) of these cases seen at CHIRPP sites. While the higher proportion of females may reflect differences in health care‒seeking behaviours between men and women, the literature also suggests that men in general are more likely than women to use more types of illegal drugsFootnote 11 that would increase their risk for ED visits and overdose deaths.
Our analysis of eCHIRPP data also showed that most (51%) of the injuries occurred in the person's own home. Although eCHIRPP data come mostly from pediatric populations, similar observations have been reported in the general population. For example, in British Columbia, 61% of deaths due to illicit drug overdoses occurred in private residences.Footnote 12 This finding is important as it presents opportunities for prevention. For example, our analysis shows that some injuries were caused by young children ingesting medication left unattended. Proper storage of medication or other engineering solutions could be used to prevent child access to medications.
For this study, we have also analyzed the eCHIRPP data using a qualitative methodology in order to identify common themes across life-stages. Using this approach, there were some unexpected findings that merit discussion. Among cases involving children less than one year of age, we were surprised to find a number of newborns with withdrawal symptoms. These cases may be due to either neonatal abstinence syndrome (NAS) not identified in the postpartum period, or to inadequate duration of treatment of NAS prior to hospital discharge. A report from the United States showed that the rate of NAS has doubled from 3.6 cases in 2009 to 7.3 cases per 1000 live births in 2013.Footnote 13 It is not clear, and should be investigated, whether the same trends exist in Canada.
Mental health was a major reoccurring theme identified from the narrative among youth, adults and older adults. Proximal (direct/recent) contributing factors included recent life stressors (e.g. argument with family, breakup, death of a loved one) and emotional distress (e.g. feeling sad, upset, depressed or stressed). Distal factors (upstream risk factors) included history of substance abuse, depression or other mental health issues, and previous self-harm or suicide attempts. The themes identified in the qualitative assessment were also confirmed by significantly elevated PIR (PIR = 25.00, 95% CI: 22.15‒28.23) for intentional self-harm. Similarly, opioid-related cases were more likely to be admitted to the hospital compared to other injuries (PIR = 5.32, 95% CI: 4.58‒6.17).
Strengths and limitations
This study benefited from data collected in near real-time from 17 sentinels across Canada. Validation studies previously conducted shows the eCHIRPP data are representative of all injuries captured.Footnote 5Footnote 6 Furthermore, eCHIRPP contains narrative information that provides detailed information on the circumstances prior to the injury. In this study, we were able to use the narrative to qualitatively identify reoccurring themes. To our knowledge, this is the first time qualitative methodology has been used on eCHIRPP data. In this study, the qualitative information provided context for interpreting the quantitative risk estimates. For example, the increase in PIR was supported by the reoccurring theme of mental health relating to distal factors such as history of substance abuse and previous self-harm attempts.
Our study also has several limitations, which may impact the interpretation of the results. Given that eCHIRPP is sentinel in nature, it cannot provide information on the burden of opioid-related injuries or provide estimates of true incidence rate. However, eCHIRPP data has been found to be representative of the injuries in specific contexts, mechanisms and ages; therefore, it can be used to monitor trends to identify changes in the patterns of the opioid-related injuries.Footnote 5Footnote 6 Furthermore, PIR methodology can be used to compare opioid-related injuries to other types of injuries.
Qualitative analysis (narrative coding) was based on information provided (written in the text) at the time of the injury. Therefore, the quality and comprehensiveness of the data are largely dependent on the patients at that time. It is possible that in more severe cases, patients are not capable of providing a complete account of the events prior to the injury or of recalling past history of mental illness. Furthermore, our case definition was based on search strings derived from narratives; it is possible that newer terms have been introduced and as such, some cases could have been missed. Therefore, results should be interpreted with those caveats.
Conclusion
The opioid epidemic is currently a major public health problem in Canada. Results from this study provide some evidence on upstream risk factors associated with opioid use that may be useful to inform injury prevention, health promotion and harm reduction efforts. The causes of opioid-related poisonings and injuries are complex and likely vary by subpopulations, and therefore continued monitoring of risk factors is important in providing the evidence necessary to prevent future overdoses and deaths.
Acknowledgements
The authors would like to thank Steven McFaull for his input on the coding and classification of suspected opioid-related injuries, and James Cheesman for extracting the data. We would also like to thank all of the coders and all of the CHIRPP sites for their contribution to the eCHIRPP network, thereby making this analysis possible.
Conflicts of interest
The authors declare no conflicts of interest.
Authors' contributions and statement
MD, VC, and ST designed, analyzed and interpreted the data and drafted and revised the paper. WT and AU interpreted the data and revised the paper.
The content and views expressed in this article are those of the authors and do not necessarily reflect those of the Government of Canada.
References
- Footnote 1
-
Special Advisory Committee on the Epidemic of Opioid Overdoses. National report: Apparent opioid-related deaths in Canada (January 2016 to December 2017) [Internet]. Ottawa (ON): Public Health Agency of Canada; 2017 [modified 2018 Apr 27; cited 2018 Jun]. Available from: https://www.canada.ca/en/public-health/services/reports-publications/healthy-living/apparent-opioid-related-deaths-report-2016-2017-december.html
- Footnote 2
-
Transport Canada. Canadian motor vehicle traffic collision statistics 2015. Ottawa (ON): Transport Canada; 2017 [Catalogue No.: T45-3E-PDF]. 6 p.
- Footnote 3
-
Canadian Institute for Health Information (CIHI). Opioid-related harms in Canada: Chartbook September 2017. Ottawa (ON): CIHI; 2017. Available from: https://www.cihi.ca/sites/default/files/document/opioid-harms-chart-book-en.pdf
- Footnote 4
-
Crain J, McFaull S, Thompson W, et al. Status report. The Canadian Hospitals Injury Reporting and Prevention Program: a dynamic and innovative injury surveillance system. Health Promot Chronic Dis Prev Can. 2016;36(6):112-7.
- Footnote 5
-
MacPherson AK, White HL, Mongeon S, Mackay M. Examining the sensitivity of an injury surveillance program using population-based estimates. Inj Prev. 2008;14(4):262-5. doi: 10.1136/ip.2008.018374.
- Footnote 6
-
Kang J, Hagel B, Emery CA, Senger T, Meeuwisse W. Assessing the representativeness of the Canadian Hospitals Injury Reporting and Prevention Programme (CHIRPP) sport and recreational injury data in Calgary, Canada. Int J Inj Contr Saf Promot. 2013;20(1):19-26.
- Footnote 7
-
Do MT, Frechette M, McFaull S, Denning B, Ruta M, Thompson W. Injuries in the North—analysis of 20 years of surveillance data collected by the Canadian Hospitals Injury Reporting and Prevention Program. Int J Circumpolar Health [Internet]. 2013 [cited 2018 Jun];72:201090. doi: 10.3402/ijch.v72i0.21090.
- Footnote 8
-
Clegg LX, Hankey BF, Tiwari R, Feuer EJ, Edwards BK. Estimating average annual percent change in trend analysis. Stat Med. 2009;28(29):3670-82.
- Footnote 9
-
Hsieh HF, Shannon SE. Three approaches to qualitative content analysis. Qual Health Res. 2005 Nov;15(9):1277-88.
- Footnote 10
-
Morse M, Field A. Qualitative research methods for health professionals. Thousand Oaks (CA): Sage Publications; 1995. 272 p.
-
Substance Abuse and Mental Health Services Administration (SAMHSA). Results from the 2013 National Survey on Drug Use and Health: summary of national findings. Rockville (MD): US Department of Health and Human Services; 2014. 184 p. [HHS Publication No. (SMA) 14-4863. NSDUH Series H-48.]
- Footnote 12
-
British Columbia Coroners Service. Fentanyl-detected illicit drug overdose deaths January 1, 2008 to April 30, 2018 [Internet]. Burnaby (BC): BC Coroners Service; [updated monthly; cited 2018 June]. Available from: https://www2.gov.bc.ca/assets/gov/public-safety-and-emergency-services/death-investigation/statistical/illicit-drug.pdf
- Footnote 13
-
Brown JD, Doshi PA, Pauly NJ, Talbert JC. Rates of neonatal abstinence syndrome amid efforts to combat the opioid abuse epidemic. JAMA Pediatr. 2016;170(11):1110-12. doi: 10.1001/jamapediatrics.2016.2150.