
At-a-glance – The impact of poisoning-related mortality on life expectancy at birth in Canada, 2000 to 2016
Health Promotion and Chronic Disease Prevention in Canada
Heather M. Orpana, PhDAuthor reference 1,Author reference 2; Justin J. Lang, PhD (1); Diana George, MScAuthor reference 1; Jessica Halverson, MSW, MPHAuthor reference 1
https://doi.org/10.24095/hpcdp.39.2.03
Author references:
Correspondence: Heather Orpana, Centre for Surveillance and Applied Research, Public Health Agency of Canada, 785 Carling Avenue, Ottawa, ON K1A 0K9; Tel: 613-878-5011; Email: heather.orpana@canada.ca
Note: Under the guidelines of the International Committee of Medical Journal Editors (www.icmje.org) about the dissemination of information relevant to a public health crisis, a summary of these results was made available to stakeholders and the public ahead of publication through a quarterly technical report, and is available at the following address: https://www.canada.ca/en/health-canada/services/substance-use/problematic-prescription-drug-use/opioids/data-surveillance-research/harms-deaths/measuring-impact-on-life-expectancy.html
Abstract
Increases in opioid-related mortality have contributed to declines in life expectancy at birth in the United States and British Columbia. Canadian national mortality data from 2000 to 2016 were analyzed to determine the contribution of poisoning-related mortality to changes in life expectancy at birth by age group and sex. From 2000 to 2016, life expectancy at birth increased by almost three years; however, mortality due to unintentional poisonings, including those involving opioids, curbed this increase by 0.16 years. Although a national decrease in life expectancy at birth has not been observed in Canada during this period, current trends suggest that the national opioid overdose crisis will continue to attenuate gains to life expectancy.
Introduction
Both Canada and the United States have experienced recent, dramatic increases in opioid-related mortality. There were more than 9000 apparent opioid-related deaths in Canada between January 2016 and June 2018.Footnote 1 In the United States in 2016 alone, opioids were involved in approximately 42 000 overdose deaths, representing a 21.5% increase in the age-adjusted poisoning overdose mortality rate from 2015.Footnote 2 This growing mortality burden, which disproportionately affects younger adults,Footnote 1,Footnote 2 has the potential to impact life expectancy in affected regions. While life expectancy at birth in the United States increased by two years from 2000 to 2015, drug poisoning mortality more than doubled during the same period and contributed a loss of 0.28 years of life expectancy at birth; of this, opioid-involved poisonings contributed a loss of 0.21 years.Footnote 3 Between 2015 and 2016 alone, Kochanek et al. reported an overall decrease of 0.1 years in life expectancy at birth in the United States, driven by a 0.2-year decrease among males and no change in life expectancy among females.Footnote 4 British Columbia, one of the provinces that experienced the earliest impacts and heaviest burden of the opioid overdose crisis in Canada,Footnote 5 has reported a decrease in life expectancy at birth of 0.38 years between 2014 and 2016, with a third of this decrease being attributed to illicit drug overdoses, primarily opioids.Footnote 6 The impact of the opioid overdose crisis on life expectancy at birth in Canada at the national level has not yet been demonstrated.
The purpose of this study is to examine changes in life expectancy at birth in Canada between 2000 and 2016, and between 2014 and 2016 with a focus on unintentional, intentional, and undetermined poisonings. Changes in life expectancy were decomposed by cause of death, age group, and sex. These analyses will contribute to further understanding the impact of opioid poisoning-related mortality on life expectancy at birth in Canada.
Methods
Data from the Canadian Vital Statistics – Deaths Database were obtained from Table 13-10-0156-01Footnote 7 and population estimates were obtained from Statistics Canada Table 17-10-0005-01Footnote 8. Mortality data were grouped in the following categories: unintentional poisoning by and exposure to narcotics [X42], intentional self-poisoning by and exposure to narcotics [X62], poisoning of undetermined intent by and exposure to narcotics [Y12], other unintentional poisoning [X40, X41, X43-49], other intentional self-poisoning [X60, X61, X63-X69], other poisoning of undetermined intent [Y10, Y11, Y13-Y19], other intentional self-harm [X70-X84], transport accidents [V01-V99], other external causes not already included [W00-W99, X00-X39, X50-X59, Y20-Y89], and residual causes (all other ICD-10 chapters).
Abridged life tables were produced using standard age groups: less than 1 year, 1 to 4 years, and in five-year age groups thereafter, with 90 years and older as the last age group. Life expectancy at birth was calculated using Chiang's method,Footnote 9 and the life table was closed using Hsieh's method.Footnote 10 Period life expectancy represents the life expectancy a hypothetical individual could be expected to live, if they experienced the observed age group and sex-specific probabilities of death during a given period. Arriaga's method was used to decompose changes in life expectancy into age group, sex and cause of death components, using Excel spreadsheets developed by Auger et al.Footnote 11 This approach considers both the direct and indirect effects of age group, sex and cause specific mortality. Analyses were conducted overall for 2000 to 2016 and 2014 to 2016, and for males and females separately for 2000 to 2016. Age group and cause-specific contributions to the difference in life expectancy at birth between males and females in 2016 were also examined.
Results
Life expectancy at birth increased by almost three years, from 79.27 in 2000 to 82.25 in 2016 for males and females combined. Most of the observed increases were attributable to residual causes other than injuries (Table 1). However, while the category of injury-related mortality contributed a small overall increase to the change in life expectancy at birth (0.11 years), within this category, two causes of death contributed a loss to life expectancy at birth for males and females combined: unintentional poisonings by and exposure to narcotics (−0.08) and other unintentional poisonings (−0.08). The increase in life expectancy at birth between 2000 and 2016 was larger for males (3.48 years) than females (2.52 years), and the negative impact of unintentional poisonings (both by and exposure to narcotics and other substances) on life expectancy was larger for males (−0.23 years) than females (−0.09 years). Apart from “other causes of injury” for females from 2000 to 2016, all remaining categories of injury-related mortality contributed either no change or contributed to an increase in life expectancy. Of all injury-related causes, the reduction in deaths due to transport accidents contributed the most to the increase in life expectancy. Much of the impact of unintentional poisonings (both by narcotics and other substances) on life expectancy at birth has accrued since 2014. Between 2014 and 2016, life expectancy at birth increased by 0.53 years for males and females combined (Table 1); however, unintentional poisonings contributed a loss of 0.09 years.
| Cause of death category | 2000 to 2016 | 2014 to 2016 | 2016 | ||||
|---|---|---|---|---|---|---|---|
| Overall | Males | Females | Overall | Males as compared to femalesFootnote a | |||
| Injury-related causes of death | Unintentional poisoning | Unintentional poisoning by and exposure to narcotics and psycho-dysleptics [hallucinogens], not elsewhere classified [X42] | −0.08 | −0.12 | −0.04 | −0.04 | −0.13 |
| Other unintentional poisonings [X40, X41, X43 to X49] |
−0.08 | −0.11 | −0.05 | −0.05 | −0.09 | ||
| Intentional poisonings | Intentional self-poisoning by and exposure to narcotics and psycho-dysleptics [hallucinogens], not elsewhere classified [X62] | 0.00 | 0.00 | 0.00 | 0.00 | 0.00 | |
| Other intentional poisonings [X60, X61, X63 to X69] | 0.02 | 0.04 | 0.00 | 0.01 | −0.01 | ||
| Poisonings with undetermined intent | Poisoning by and exposure to narcotics and psycho-dysleptics [hallucinogens], not elsewhere classified, undetermined intent [Y12] | 0.00 | 0.00 | 0.00 | 0.02 | 0.00 | |
| Other undetermined poisonings [Y10, Y11, Y13 to Y19] | 0.01 | 0.01 | 0.00 | 0.03 | 0.00 | ||
| Other intentional self-harm [X70 to X84] | 0.02 | 0.05 | 0.03 | 0.01 | −0.33 | ||
| Transport accidents [V01 to V99] | 0.16 | 0.22 | 0.10 | 0.02 | −0.14 | ||
| Other injuries [W00-W99, X00-X39, X50-X59, Y20-Y89] | 0.06 | 0.10 | −0.02 | 0.04 | −0.14 | ||
| Residual causes of death [all other ICD-10 chapters] | 2.88 | 3.30 | 2.50 | 0.49 | −3.35 | ||
| Total change in life expectancy | 2.99 | 3.48 | 2.52 | 0.53 | −4.20 | ||
Note: Estimates may not sum to column totals due to rounding.
|
|||||||
In 2016, life expectancy at birth for males was 4.20 years lower than for females (Table 1). Higher mortality due to unintentional poisonings by and exposure to narcotics among males accounted for 0.13 years of this gap and other unintentional poisonings accounted for 0.09 years. Among all other injury-related causes of death, other intentional self-harm contributed the most to this difference between the sexes, at 0.33 years.
As shown in Table 2, most age groups contributed an increase to life expectancy at birth between 2000 and 2016, for both males and females. However, the age groups of 25–29 and 30–34 years old for males each contributed a small decrease. Between 2014 and 2016, for both sexes combined, almost all age groups from 10–14 through to 45–49 years old contributed a small loss to life expectancy at birth, which was offset by gains in life expectancy at birth contributed by adults 55–59 years and older.
| 2000 to 2016 | 2014 to 2016 | 2016 | |||
|---|---|---|---|---|---|
| Age group (years) | Overall | Males | Females | Overall | Males as compared to femalesFootnote a |
| Less than 1 | 0.05 | 0.09 | 0.01 | 0.02 | −0.02 |
| 1–4 | 0.01 | 0.01 | 0.01 | 0.00 | −0.01 |
| 5–9 | 0.02 | 0.02 | 0.01 | 0.00 | 0.00 |
| 10–14 | 0.01 | 0.01 | 0.01 | −0.01 | −0.01 |
| 15–19 | 0.05 | 0.07 | 0.03 | 0.00 | −0.06 |
| 20–24 | 0.03 | 0.05 | 0.02 | −0.02 | −0.12 |
| 25–29 | −0.01 | −0.02 | 0.00 | −0.01 | −0.15 |
| 30–34 | 0.00 | −0.01 | 0.00 | −0.01 | −0.13 |
| 35–39 | 0.03 | 0.04 | 0.01 | 0.00 | −0.10 |
| 40–44 | 0.05 | 0.07 | 0.04 | −0.01 | −0.11 |
| 45–49 | 0.06 | 0.08 | 0.04 | −0.01 | −0.13 |
| 50–54 | 0.10 | 0.12 | 0.08 | 0.00 | −0.16 |
| 55–59 | 0.16 | 0.21 | 0.11 | 0.03 | −0.24 |
| 60–64 | 0.24 | 0.32 | 0.16 | 0.03 | −0.33 |
| 65–69 | 0.35 | 0.45 | 0.23 | 0.04 | −0.40 |
| 70–74 | 0.44 | 0.57 | 0.31 | 0.09 | −0.42 |
| 75–79 | 0.46 | 0.57 | 0.37 | 0.07 | −0.47 |
| 80–84 | 0.40 | 0.45 | 0.38 | 0.08 | −0.49 |
| 85–89 | 0.30 | 0.26 | 0.38 | 0.09 | −0.43 |
| 90 and older | 0.22 | 0.13 | 0.32 | 0.16 | −0.42 |
| Total | 2.99 | 3.48 | 2.52 | 0.53 | −4.20 |
Note: Estimates may not sum to column totals due to rounding.
|
|||||
Figure 1 shows cause-specific contributions to changes in life expectancy at birth by age group between 2000 and 2016 for both sexes combined. Most gains in life expectancy occurred among older adults and residual causes not related to injuries. However, both unintentional poisonings by and exposure to narcotics and other unintentional poisonings for age groups 20–24 through 55–59 years old contributed a loss to life expectancy of at least 0.01 years.
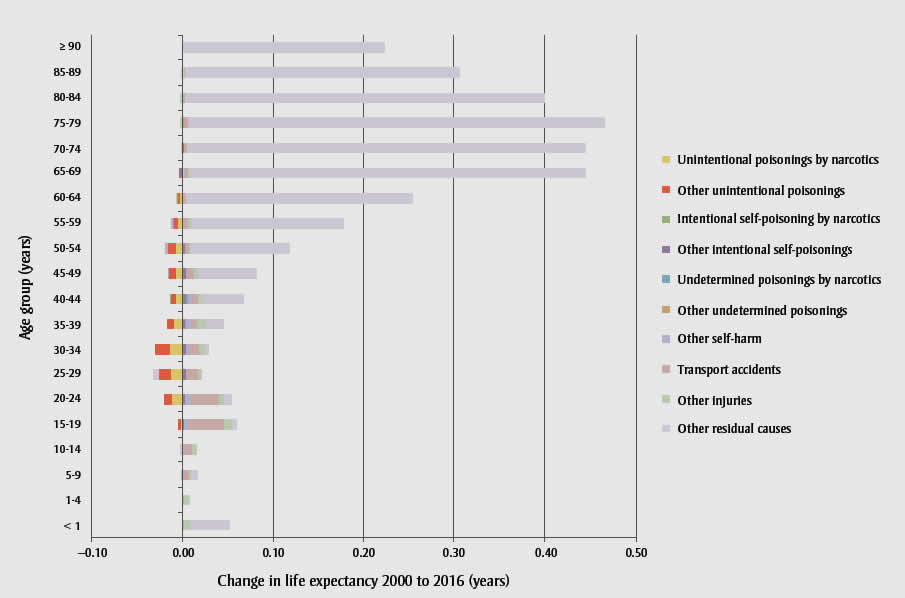
Figure 1 - Text Equivalent
| Age group, years | Change in life expectancy, 2000-2016, in years | |||||||||
|---|---|---|---|---|---|---|---|---|---|---|
| Unintentional poisoning by and exposure to narcotics | Other unintentional poisonings | Intentional self-poisoning by narcotics | Other intentional self-poisonings | Undetermined poisoning by narcotics | Other undetermined poisonings | Other self harm | Transport accidents | Other injuries | Other residual causes | |
| < 1 | 0.00 | 0.00 | 0.00 | 0.00 | 0.00 | 0.00 | 0.00 | 0.00 | 0.01 | 0.04 |
| 1-4 | 0.00 | 0.00 | 0.00 | 0.00 | 0.00 | 0.00 | 0.00 | 0.00 | 0.00 | 0.00 |
| 5-9 | 0.00 | 0.00 | 0.00 | 0.00 | 0.00 | 0.00 | 0.00 | 0.01 | 0.00 | 0.01 |
| 10-14 | 0.00 | 0.00 | 0.00 | 0.00 | 0.00 | 0.00 | 0.00 | 0.01 | 0.00 | 0.00 |
| 15-19 | 0.00 | 0.00 | 0.00 | 0.00 | 0.00 | 0.00 | 0.00 | 0.04 | 0.01 | 0.01 |
| 20-24 | -0.01 | -0.01 | 0.00 | 0.00 | 0.00 | 0.00 | 0.01 | 0.03 | 0.01 | 0.01 |
| 25-29 | -0.01 | -0.01 | 0.00 | 0.00 | 0.00 | 0.00 | 0.00 | 0.01 | 0.00 | -0.01 |
| 30-34 | -0.01 | -0.02 | 0.00 | 0.00 | 0.00 | 0.00 | 0.00 | 0.01 | 0.01 | 0.00 |
| 35-39 | -0.01 | -0.01 | 0.00 | 0.00 | 0.00 | 0.00 | 0.01 | 0.01 | 0.01 | 0.02 |
| 40-44 | -0.01 | -0.01 | 0.00 | 0.00 | 0.00 | 0.00 | 0.00 | 0.01 | 0.01 | 0.04 |
| 45-49 | -0.01 | -0.01 | 0.00 | 0.00 | 0.00 | 0.00 | 0.00 | 0.01 | 0.01 | 0.06 |
| 50-54 | -0.01 | -0.01 | 0.00 | 0.00 | 0.00 | 0.00 | 0.00 | 0.00 | 0.00 | 0.11 |
| 55-59 | 0.00 | -0.01 | 0.00 | 0.00 | 0.00 | 0.00 | 0.00 | 0.00 | 0.00 | 0.17 |
| 60-64 | 0.00 | 0.00 | 0.00 | 0.00 | 0.00 | 0.00 | 0.00 | 0.00 | 0.00 | 0.25 |
| 65-69 | 0.00 | 0.00 | 0.00 | 0.00 | 0.00 | 0.00 | 0.00 | 0.00 | 0.00 | 0.35 |
| 70-74 | 0.00 | 0.00 | 0.00 | 0.00 | 0.00 | 0.00 | 0.00 | 0.00 | 0.00 | 0.44 |
| 75-79 | 0.00 | 0.00 | 0.00 | 0.00 | 0.00 | 0.00 | 0.00 | 0.00 | 0.00 | 0.46 |
| 80-84 | 0.00 | 0.00 | 0.00 | 0.00 | 0.00 | 0.00 | 0.00 | 0.00 | 0.00 | 0.40 |
| 85-89 | 0.00 | 0.00 | 0.00 | 0.00 | 0.00 | 0.00 | 0.00 | 0.00 | 0.00 | 0.31 |
| ≥ 90 | 0.00 | 0.00 | 0.00 | 0.00 | 0.00 | 0.00 | 0.00 | 0.00 | 0.00 | 0.22 |
| Total | -0.08 | -0.08 | 0.00 | 0.02 | 0.00 | 0.01 | 0.02 | 0.16 | 0.06 | 2.88 |
Discussion
Life expectancy at birth in Canada at the national level continues to rise, however gains between 2000 and 2016 and 2014 and 2016 have been attenuated by increases in death due to unintentional poisonings, both those associated with narcotics, as well as other substances. While an overall decline in life expectancy at birth at the national level was not observed, as was observed in the United States and the province of British Columbia,Footnotes 3, Footnotes 4,Footnotes 5this may reflect substantial regional variation in mortality across Canada, and that both British Columbia and the United States experienced relatively earlier impacts of the opioid overdose epidemic, as compared to other regions of Canada. The absence of a decrease, however, does not indicate that Canada is not facing a public health crisis. Decreases in life expectancy are very rare events. Based on life expectancy at birth reported by Statistics Canada for 1921 to 2011, year over year decreases occurred only for a small number of periods in the 1920s and 1930s.Footnote 12 The similar negative contribution by both unintentional poisonings by and exposure to narcotics and other unintentional poisonings to life expectancy at birth is of note. In this study, we used ICD-10 cause of death codes, but not associated diagnostic T codes, due to data disclosure restrictions. As a result, it is likely that not all deaths due to unintentional poisoning by and exposure to narcotics [X42] were associated with opioids, and conversely, that some other unintentional poisonings [X40, X41, X43-49] were associated with opioids. However, given the similar pattern of increasing mortality associated with both cause of death categories, it is important to consider the category of unintentional poisoning as a whole. In the United States, 0.21 of the 0.28-year loss contributed by unintentional poisonings was associated with opioidsFootnote 3 and British Columbia reported that illicit drug overdoses contributed 0.12 years of the decline of 0.38 years of life expectancy at birth between 2014 and 2016.Footnote 6 Available national data indicate that approximately 76% of accidental (unintentional) apparent opioid-related deaths in Canada between January 2016 and June 2018 also involved one or more types of non-opioid substances.Footnote 1 Further refinement of the present analyses using diagnostic T codes would provide additional precision. At the time of this analysis, complete mortality data up to 2016 were available. These analyses will be updated when final mortality data for 2017 become available; given the notable increase in apparent opioid-related deaths in 2017 compared to 2016, as well as preliminary mortality counts for the first half of 2018, it is anticipated that the impact on life expectancy will continue to increase.Footnote 1 We did not conduct regional analyses. As such, the results presented here summarise the national experience. Future analyses may examine regional variations in the contribution of poisoning-related mortality to changes in life expectancy.
It is also of note that deaths due to intentional self-poisoning by and exposure to narcotics, and poisoning by and exposure to narcotics of undetermined intent did not contribute a loss to the gain in life expectancy at the national level during the observed time periods. This suggests that the opioid overdose crisis has not influenced rates of mortality of intentional self-poisoning by and exposure to narcotics at the national level, consistent with recent evidence from Alberta.Footnote 13
While the decrease in most injury-related causes of death contributed to gains in life expectancy at birth in Canada, unintentional poisonings have attenuated overall gains to life expectancy at birth during the observed time periods, for both males and females. Both unintentional poisonings by and exposure to narcotics, and other unintentional poisonings have contributed to this attenuation. While life expectancy at birth continues to increase in Canada, consistent with international trends in similar high-income countries,Footnote 14,Footnote 15 this increase may continue to be slowed by the ongoing opioid overdose crisis and associated increases of deaths due to unintentional poisonings. These findings may change as additional data become available, given the comparative increase in opioid-related deaths reported for 2017 and data for the first half of 2018.Footnote 1
Acknowledgements
We would like to acknowledge the development of the Excel program to decompose differences in life expectancy developed by Auger et al. at the INSPQ.
Conflicts of interest
We declare that we have no conflicts of interest related to this work.
Authors' contributions and statement
JH and DG conceived the project. HO conducted the data analysis and wrote the paper. JJL, DG and JH contributed to interpreting the data and critically revising the paper.
The content and views expressed in this article are those of the authors and do not necessarily reflect those of the Government of Canada.