
Original quantitative research – Trends in chronic disease incidence rates from the Canadian Chronic Disease Surveillance System
Health Promotion and Chronic Disease Prevention in Canada
Naomi C. Hamm, MScAuthor reference 1; Louise Pelletier, MDAuthor reference 2; Joellyn Ellison, MPHAuthor reference 2; Lana Tennenhouse, BScAuthor reference 1; Kim Reimer, BScAuthor reference 3; J. Michael Paterson, MScAuthor reference 4; Rolf Puchtinger, MAAuthor reference 5; Sharon Bartholomew, MHScAuthor reference 2; Karen A. M. Phillips, DVMAuthor reference 6; Lisa M. Lix, PhDAuthor reference 1
https://doi.org/10.24095/hpcdp.39.6/7.02
This article has been peer reviewed.
Author references:
- Author reference 1
-
University of Manitoba, Winnipeg, Manitoba, Canada
- Author reference 2
-
Public Health Agency of Canada, Ottawa, Ontario, Canada
- Author reference 3
-
British Columbia Ministry of Health, Victoria, British Columbia, Canada
- Author reference 4
-
Institute for Clinical Evaluative Sciences, Toronto, Ontario, Canada
- Author reference 5
-
Ministry of Health, Government of Saskatchewan, Regina, Saskatchewan, Canada
- Author reference 6
-
Chief Public Health Office, Prince Edward Island Department of Health and Wellness, Charlottetown, Prince Edward Island, Canada
Correspondence: Lisa M. Lix, Department of Community Health Sciences, University of Manitoba, S113-750 Bannatyne Avenue, Winnipeg, MB R3E 0W3; Tel: 204-789-3573; Fax: 204-789-3905; Email: lisa.lix@umanitoba.ca
Abstract
Introduction: The Public Health Agency of Canada’s Canadian Chronic Disease Surveillance System (CCDSS) produces population-based estimates of chronic disease prevalence and incidence using administrative health data. Our aim was to assess trends in incidence rates over time, trends are essential to understand changes in population risk and to inform policy development.
Methods: Incident cases of diagnosed asthma, chronic obstructive pulmonary disease (COPD), diabetes, hypertension, ischemic heart disease (IHD), and stroke were obtained from the CCDSS online infobase for 1999 to 2012. Trends in national and regional incidence estimates were tested using a negative binomial regression model with year as a linear predictor. Subsequently, models with year as a restricted cubic spline were used to test for departures from linearity using the likelihood ratio test. Age and sex were covariates in all models.
Results: Based on the models with year as a linear predictor, national incidence rates were estimated to have decreased over time for all diseases, except diabetes; regional incidence rates for most diseases and regions were also estimated to have decreased. However, likelihood ratio tests revealed statistically significant departures from a linear year effect for many diseases and regions, particularly for hypertension.
Conclusion: Chronic disease incidence estimates based on CCDSS data are decreasing over time, but not at a constant rate. Further investigations are needed to assess if this decrease is associated with changes in health status, data quality, or physician practices. As well, population characteristics that may influence changing incidence trends also require exploration.
Keywords: administrative data, chronic disease surveillance, trend analysis
Highlights
- Using data from the Canadian Chronic Disease Surveillance System (CCDSS), national incidence rates were estimated to have decreased over time for diagnosed asthma, chronic obstructive pulmonary disease, hypertension, ischemic heart disease, and stroke, but not for diabetes. Decreasing rates were also observed in many regions of Canada.
- Trends in national and regional chronic disease incidence were often non-linear over time, indicating that the rate of change has not been constant.
- Further research is needed to assess the association of changes in national and regional chronic disease incidence rates with changes in population health, administrative data quality, and/or clinician billing practices.
Introduction
Chronic diseases are the leading causes of death and disability worldwide.Footnote 1Footnote 2Footnote 3 Within Canada, age-standardized chronic disease prevalence, the total number of disease cases, has been increasing over time,Footnote 4 whereas age-standardized incidence, the number of new cases, appears to be decreasing for some diseases such as heart disease, stroke, and asthma.Footnote 5Footnote 6Footnote 7Footnote 8Footnote 9Footnote 10Footnote 11Footnote 12Footnote 13Footnote 14Footnote 15Footnote 16Footnote 17Footnote 18 This discrepancy may be due to aging of the population, overall growth in the Canadian population or individuals living longer with the disease. However, disease-specific mortality rates have not been consistently decreasing over time.Footnote 19
Estimating population-based trends in prevalence and incidence can be challenging. Longitudinal population-based surveys are one potential source of data on incident and prevalent cases, but they are costly to conduct on a regular basis and are prone to attrition, which can result in inaccuracies in trend estimates. Moreover, survey data do not consistently contain dates relevant to identifying disease onset, such as the date of first diagnosis or the date of treatment.
Administrative health data that capture disease diagnosis information, such as hospital and physician service (i.e., billing) records are routinely collected and therefore often less expensive and timelier to use for prevalence and incidence trend estimation.Footnote 20 However, changes in data collection methods, coding and classification systems, and clinical and billing practices for chronic diseases can also affect the accuracy of longitudinal trend estimates. As well, the completeness of capture of administrative records for the entire population may change over time, which can result in selection biases. In Canada for example, Newfoundland and Labrador physician service records do not consistently capture patient information from physicians who do not bill on a fee-for-service basis, which disproportionately affects the availability of diagnostic information for rural populations.Footnote 21
One of the routine uses of administrative health data in Canada is for chronic disease surveillance through the Canadian Chronic Disease Surveillance System (CCDSS).Footnote 22 The CCDSSFootnote 23 was created in 2009 to facilitate the collection and reporting of standardized, national estimates of diagnosed chronic disease prevalence, incidence, and health outcomes. It grew out of the National Diabetes Surveillance System (NDSS), which was established in 1999 as a collaborative network of provincial and territorial (P/T) diabetes surveillance systems and supported by Health Canada and then the Public Health Agency of Canada (PHAC).Footnote 24
In 2016, the CCDSS Data Quality Working Group was formed.Footnote 22 It conducts ad hoc data quality studies and examines data quality information that arises from a variety of sources, such as case definition validation studies and narrative reports about changes in data coding practices from P/T administrative staff. Trends in incidence and prevalence estimates may be used, in part, to assess data quality.Footnote 25 Longitudinal trends may be influenced by changes in data quality, in addition to true changes in population health. Unexpected or unexplained changes in trends can suggest opportunities for follow-up data quality investigations.
To date, there have been few, if any, studies that have tested whether trends in chronic disease incidence from the CCDSS are changing over time. The purpose of our study was to assess incidence trends for multiple chronic diseases at national and provincial/regional levels in the CCDSS and determine if these trends are best captured using a linear effect of time.
Methods
Data source
Data were obtained from the CCDSS online infobase for multiple fiscal years over the period from 1999 to 2012, this was the most recent data available at the time of analysis.Footnote 26 The infobase includes documentation on CCDSS methods, and the rules used to identify chronic disease cases within administrative databases. We focused on incident cases of disease because incidence is often not available from survey data and is a key measure of population disease risk. Incidence data were obtained for asthma (ages one year and older, 2000–2012), chronic obstructive pulmonary disease (COPD; ages 35 years and older, 2000–2012), diabetes (ages one year and older, 2000–2012), hypertension (ages 20 years and older, 1999–2012), ischemic heart disease (IHD; ages 20 years and older, 1999–2012), and stroke (ages 20 years and older, 2003–2012). The Data Quality Working Group selected these diseases because it was expected they would have trends of different shapes and directions; these diseases affect different body systems and are therefore less likely to move in concert. Data were obtained for the following regions: British Columbia, Alberta, Saskatchewan, Manitoba, Ontario, Quebec, and Atlantic Canada (New Brunswick, Newfoundland, Nova Scotia, and Prince Edward Island). Data from Northern Canada were excluded due to low event rates and the practical challenges with modelling sparse cell sizes. Incidence counts were grouped by age group and sex. CCDSS data are publicly available by five-year or lifecourse age groups. For this analysis five-year age groups were used.
Statistical analysis
Incidence rates were calculated as the number of new disease cases in a year divided by the total population at risk as of the end of the fiscal year (i.e., March 31st) and expressed per 1000 population. Rates were age standardized using the 2011 Canadian Census population and then described using minimum and maximum values, as well as first year and final year values.
Crude incidence data were subsequently analyzed using multivariable negative binomial regression models. The number of incident disease cases in each year was the outcome. The natural logarithm of the total population for a province or region was the model offset. Model covariates were year, age group, and sex. Age group was included as a cubic covariate based on preliminary assessments of model fit.
This study proceeded in a series of steps to assess trends for each chronic disease and region. The regional data were also combined to assess the trend for Canada as a whole for each chronic disease.
First, a negative binomial model with year as a continuous linear covariate was fit to the data. Next, we applied a series of negative binomial models to the data where year was included as a restricted cubic spline with a truncated power basis. Restricted cubic splines (RCS), or natural splines, are constrained to be linear beyond the boundaries of the first and last knots. The splines are also constrained to have continuous first and second derivatives at each knot, that is, at each location where the piecewise polynomial functions join,Footnote 27 resulting in a flexible, smooth function. Fitting an RCS to the data allowed us to test for linearity without making any assumptions about the data's overall shape.
Three different RCS models were fit to the data: year as an RCS with five knots, year as an RCS with four knots, and year as an RCS with three knots. Using greater than five knots in an RCS is rarely needed to provide a good fit to the data;Footnote 28 less than three knots is equivalent to modelling the predictor as a cubic term in the model. Knots were placed at evenly spaced quantiles based on the recommendations by Harrell.Footnote 27
The Akaike information criterion (AIC)Footnote 29 was used to assess which RCS model best fit the data. Once the best-fitting RCS model was identified, we used a likelihood ratio test to determine if the model with year as an RCS fit the data significantly better than the model with year as a linear effect. Statistical significance was assessed using a nominal α = 0.05.
Statistical analyses were performed using R software, version 3.4.3 (R Foundation for Statistical Computing, Vienna). The base functions and the Modern Applied Statistics with S (MASS) and Regression Modeling Strategies (rms) packages were used.
Results
Table 1 reports estimated age-standardized incidence rates per 1000 population for each chronic disease and region. These rates are provided for the first and final years of available data. In addition, the minimum and maximum estimates and their respective years are reported.
| Region | Measure | Asthma | COPD | Diabetes | Hypertension | IHD | Stroke | ||||||
|---|---|---|---|---|---|---|---|---|---|---|---|---|---|
| Rate (per 1000) |
Year | Rate (per 1000) |
Year | Rate (per 1000) |
Year | Rate (per 1000) |
Year | Rate (per 1000) |
Year | Rate (per 1000) |
Year | ||
| Canada | First year | 8.94 | 2000 | 12.03 | 2000 | 6.60 | 2000 | 31.88 | 1999 | 12.99 | 1999 | 3.83 | 2003 |
| Final year | 4.74 | 2012 | 8.81 | 2012 | 6.17 | 2012 | 22.29 | 2012 | 6.80 | 2012 | 2.97 | 2012 | |
| Minimum rate | 4.74 | 2012 | 8.81 | 2012 | 6.17 | 2012 | 22.29 | 2012 | 6.80 | 2012 | 2.97 | 2012 | |
| Maximum rate | 8.94 | 2000 | 12.03 | 2000 | 7.60 | 2006 | 32.81 | 2000 | 12.99 | 1999 | 3.83 | 2003 | |
| Atlantic | First year | 7.87 | 2000 | 13.61 | 2000 | 7.51 | 2000 | 35.51 | 1999 | 13.30 | 1999 | 3.82 | 2003 |
| Final year | 3.96 | 2012 | 10.45 | 2012 | 7.05 | 2012 | 26.60 | 2012 | 6.93 | 2012 | 2.89 | 2012 | |
| Minimum rate | 3.96 | 2012 | 10.45 | 2012 | 6.97 | 2008 | 26.60 | 2012 | 6.93 | 2012 | 2.89 | 2012 | |
| Maximum rate | 7.87 | 2000 | 13.61 | 2000 | 8.01 | 2006 | 38.11 | 2002 | 13.30 | 1999 | 3.82 | 2003 | |
| Quebec | First year | 9.11 | 2000 | 14.37 | 2000 | 6.12 | 2000 | 31.92 | 1999 | 14.38 | 1999 | 3.56 | 2003 |
| Final year | 4.44 | 2012 | 7.03 | 2012 | 5.33 | 2012 | 18.61 | 2012 | 7.34 | 2012 | 2.68 | 2012 | |
| Minimum rate | 4.44 | 2012 | 7.03 | 2012 | 5.33 | 2012 | 18.61 | 2012 | 7.34 | 2012 | 2.67 | 2011 | |
| Maximum rate | 9.11 | 2000 | 14.37 | 2000 | 6.12 | 2000 | 32.02 | 2000 | 14.38 | 1999 | 3.56 | 2003 | |
| Ontario | First year | 10.10 | 2000 | 11.04 | 2000 | 6.53 | 2000 | 31.09 | 1999 | 13.25 | 1999 | 4.00 | 2003 |
| Final year | 5.27 | 2012 | 8.59 | 2012 | 5.91 | 2012 | 20.73 | 2012 | 6.46 | 2012 | 3.00 | 2012 | |
| Minimum rate | 5.27 | 2012 | 8.59 | 2012 | 5.91 | 2012 | 20.73 | 2012 | 6.46 | 2012 | 3.00 | 2012 | |
| Maximum rate | 10.10 | 2000 | 11.04 | 2000 | 8.44 | 2006 | 32.22 | 2000 | 13.25 | 1999 | 4.00 | 2003 | |
| Manitoba | First year | 8.34 | 2000 | 13.76 | 2000 | 6.79 | 2000 | 29.83 | 1999 | 10.73 | 1999-2000 | 4.43 | 2003 |
| Final year | 6.81 | 2012 | 8.59 | 2012 | 8.21 | 2012 | 28.26 | 2012 | 6.34 | 2010-2012 | 3.25 | 2012 | |
| Minimum rate | 5.56 | 2011 | 8.59 | 2012 | 6.32 | 2008 | 28.26 | 2012 | 6.34 | 2010-2012 | 3.25 | 2012 | |
| Maximum rate | 8.34 | 2000 | 13.76 | 2000 | 8.21 | 2012 | 31.87 | 2003 | 10.73 | 1999-2000 | 4.43 | 2003 | |
| Saskatchewan | First year | 8.18 | 2000 | 10.39 | 2000 | 5.91 | 2000 | 30.57 | 1999 | 11.78 | 1999 | 4.24 | 2003 |
| Final year | 4.72 | 2012 | 9.25 | 2012 | 6.40 | 2012 | 25.43 | 2012 | 6.80 | 2012 | 3.07 | 2012 | |
| Minimum rate | 4.72 | 2012 | 9.11 | 2011 | 5.91 | 2000 | 25.43 | 2012 | 6.80 | 2012 | 3.07 | 2012 | |
| Maximum rate | 8.18 | 2000 | 10.75 | 2007 | 7.29 | 2006 | 36.56 | 2002 | 11.78 | 1999 | 4.24 | 2003 | |
| Alberta | First year | 9.06 | 2000 | 11.90 | 2000 | 6.38 | 2000 | 32.78 | 1999 | 11.96 | 1999 | 3.81 | 2003 |
| Final year | 5.41 | 2012 | 10.46 | 2012 | 6.23 | 2012 | 27.80 | 2012 | 7.14 | 2012 | 3.10 | 2012 | |
| Minimum rate | 5.41 | 2012 | 10.22 | 2008 | 6.16 | 2003 | 27.80 | 2012 | 7.14 | 2012 | 3.10 | 2012 | |
| Maximum rate | 9.06 | 2000 | 11.90 | 2000 | 6.99 | 2009 | 34.75 | 2001 | 11.96 | 1999 | 3.89 | 2004 | |
| British Columbia | First year | 7.32 | 2000 | 9.17 | 2000 | 6.22 | 2000 | 28.03 | 1999 | 10.03 | 1999 | 3.48 | 2003 |
| Final year | 4.81 | 2012 | 10.15 | 2012 | 6.51 | 2012 | 21.84 | 2012 | 6.18 | 2012 | 3.18 | 2012 | |
| Minimum rate | 4.81 | 2012 | 7.92 | 2006 | 6.22 | 2000 | 21.84 | 2012 | 6.18 | 2012 | 3.18 | 2012 | |
| Maximum rate | 7.32 | 2000 | 12.83 | 2009 | 7.97 | 2009 | 33.25 | 2006 | 10.03 | 1999 | 3.52 | 2004 | |
|
Abbreviations: COPD, chronic obstructive pulmonary disease; IHD, ischemic heart disease. |
|||||||||||||
For Canada, the first and final years of available estimates coincide with the highest and lowest values, respectively, for asthma, COPD, IHD, and stroke. Estimated age-standardized incidence rates for diabetes increased from 6.60 per 1000 population in 2000 to 7.60 per 1000 population in 2006 (first year of study observation period), then subsequently decreased to 6.17 per 1000 population in 2012, which was both the final year and lowest rate observed. Hypertension age-standardized incidence rates peaked at 32.81 per 1000 population in 2000, which was 0.93 per 1000 population greater than the first year (1999), before falling to 22.29 per 1000 population in the final and lowest year (2012). Annual crude rates for each region and disease are available upon request from the authors.
Table 2 provides the estimated effects of year as a continuous linear covariate in the multivariable negative binomial regression models for each region and chronic disease. The estimates indicate the average change in the incidence rate per year, after controlling for age and sex. For Canada, asthma (−0.05, p < 0.001), COPD (−0.02, p < 0.001), hypertension (−0.02, p < 0.001), IHD (−0.04, p < 0.001), and stroke (−0.02, p < 0.001) all showed a statistically significant decrease in their incidence rates over time. In contrast, there was no statistically significant linear effect of year for diabetes (0.0007, p = 0.73).
| Chronic disease | Region | Estimate (95% CI) |
|---|---|---|
| Asthma | Canada | −0.05 (−0.06, −0.05)Table 2 Footnote a |
| Atlantic Canada | −0.06 (−0.07, −0.05)Table 2 Footnote a | |
| Quebec | −0.06 (−0.07, −0.05)Table 2 Footnote a | |
| Ontario | −0.06 (−0.07, −0.05)Table 2 Footnote a | |
| Manitoba | −0.02 (−0.03, −0.01)Table 2 Footnote a | |
| Saskatchewan | −0.05 (−0.06, −0.04)Table 2 Footnote a | |
| Alberta | −0.05 (−0.06, −0.04)Table 2 Footnote a | |
| British Columbia | −0.03 (−0.04, −0.02)Table 2 Footnote a | |
| COPD | Canada | −0.02 (−0.02, −0.01)Table 2 Footnote a |
| Atlantic Canada | −0.02 (−0.02, −0.01)Table 2 Footnote a | |
| Quebec | −0.05 (−0.06, −0.04)Table 2 Footnote a | |
| Ontario | −0.01 (−0.02, −0.01)Table 2 Footnote a | |
| Manitoba | −0.03 (−0.04, −0.02)Table 2 Footnote a | |
| Saskatchewan | −0.01 (−0.02, < 0.00)Table 2 Footnote a | |
| Alberta | −0.01 (−0.01, < 0.00)Table 2 Footnote a | |
| British Columbia | 0.03 (0.02, 0.03)Table 2 Footnote a | |
| Diabetes | Canada | > 0.00 (< 0.00, > 0.00) |
| Atlantic Canada | > 0.00 (< 0.00, > 0.00) | |
| Quebec | < 0.00 (−0.01, > 0.00) | |
| Ontario | < 0.00 (−0.01, > 0.00) | |
| Manitoba | 0.01 (> 0.00, 0.01)Table 2 Footnote a | |
| Saskatchewan | 0.01 (> 0.00, 0.02)Table 2 Footnote a | |
| Alberta | 0.01 (> 0.00, 0.01)Table 2 Footnote a | |
| British Columbia | 0.01 (0.01, 0.02)Table 2 Footnote a | |
| Hypertension | Canada | −0.02 (−0.02,−0.02)Table 2 Footnote a |
| Atlantic Canada | −0.02 (−0.02,−0.01)Table 2 Footnote a | |
| Quebec | −0.04 (−0.04, −0.03)Table 2 Footnote a | |
| Ontario | −0.03 (−0.03, −0.02)Table 2 Footnote a | |
| Manitoba | > 0.00 (< 0.00, 0.01) | |
| Saskatchewan | −0.01 (−0.02, −0.01)Table 2 Footnote a | |
| Alberta | −0.01 (−0.01, < 0.00)Table 2 Footnote a | |
| British Columbia | −0.01 (−0.01, < 0.00)Table 2 Footnote a | |
| IHD | Canada | −0.04 (−0.04, −0.03)Table 2 Footnote a |
| Atlantic Canada | −0.03 (−0.04, −0.02)Table 2 Footnote a | |
| Quebec | −0.04 (−0.05, −0.04)Table 2 Footnote a | |
| Ontario | −0.04 (−0.05, −0.04)Table 2 Footnote a | |
| Manitoba | −0.12 (−0.15, −0.09)Table 2 Footnote a | |
| Saskatchewan | −0.04 (−0.04, −0.04)Table 2 Footnote a | |
| Alberta | −0.02 (−0.03, −0.02)Table 2 Footnote a | |
| British Columbia | −0.03 (−0.04, −0.03)Table 2 Footnote a | |
| Stroke | Canada | −0.02 (−0.02, −0.01)Table 2 Footnote a |
| Atlantic Canada | −0.02 (−0.03, −0.02)Table 2 Footnote a | |
| Quebec | −0.02 (−0.03, −0.01)Table 2 Footnote a | |
| Ontario | −0.02 (−0.03, −0.01)Table 2 Footnote a | |
| Manitoba | −0.03 (−0.04, −0.03)Table 2 Footnote a | |
| Saskatchewan | −0.04 (−0.04, −0.03)Table 2 Footnote a | |
| Alberta | −0.02 (−0.02, −0.01)Table 2 Footnote a | |
| British Columbia | < 0.00 (−0.01, 0.01) | |
|
Abbreviations: COPD, chronic obstructive pulmonary disease; IHD, ischemic heart disease.
|
||
In terms of the linear effect for the regions (Table 2), there were statistically significant decreases in incidence rates over time for all regions for asthma, COPD, and IHD. For diabetes, there was a statistically significant increase in incidence estimates over time for the western provinces (Manitoba [0.009, p < 0.001], Saskatchewan [0.01, p < 0.001], Alberta [0.005, p = 0.03] and British Columbia [0.01, p < 0.001]), but no significant change for the other regions. For hypertension, there was no statistically significant change in incidence over time for Manitoba, but for all remaining regions there were statistically significant decreases. For stroke, there was no statistically significant change in incidence over time for British Columbia, while for all other regions there were statistically significant decreases.
Results from the likelihood ratio test for departures of year from a linear trend are reported in Table 3. Overall, the results show that year departed from a linear trend in numerous regions for many diseases. Stroke incidence was most consistently linear over time, with only Manitoba departing from a linear trend (x2 = 17.2, df = 2, p < .001). In contrast, hypertension incidence was non-linear over time for every region except for Manitoba. For Canada, a non-linear incidence trend over time was evident for every disease, except for IHD (p = 0.692) and stroke (p = 0.964).
| Chronic disease | Region | AIC values | Test for departure from linear trend | ||||
|---|---|---|---|---|---|---|---|
| 5 knots | 4 knots | 3 knots | χ2 | df | p-value | ||
| Asthma | Canada | 7686.3 | 7685.2 | 7683.6Table 3 Footnote a | 5.2Table 3 Footnote b | 1.0Table 3 Footnote b | 0.023Table 3 Footnote b |
| Atlantic | 2020.5 | 2018.6 | 2016.8Table 3 Footnote a | 0.2 | 1.0 | 0.694 | |
| Quebec | 2386.2 | 2383.9Table 3 Footnote a | 2384.3 | 6.2Table 3 Footnote b | 2.0Table 3 Footnote b | 0.046Table 3 Footnote b | |
| Ontario | 2565.1 | 2564.8 | 2564.8Table 3 Footnote a | 3.9Table 3 Footnote b | 1.0Table 3 Footnote b | 0.049Table 3 Footnote b | |
| Manitoba | 1862.1 | 1861.9Table 3 Footnote a | 1864.3 | 31.4Table 3 Footnote b | 2.0Table 3 Footnote b | < 0.001Table 3 Footnote b | |
| Saskatchewan | 1777.6 | 1775.6 | 1773.6Table 3 Footnote a | 0.1 | 1.0 | 0.791 | |
| Alberta | 2123.0 | 2121.6 | 2120.8Table 3 Footnote a | 8.1Table 3 Footnote b | 1.0Table 3 Footnote b | 0.005Table 3 Footnote b | |
| British Columbia | 2192.8 | 2191.5Table 3 Footnote a | 2193.5 | 5.2 | 2.0 | 0.074 | |
| COPD | Canada | 4659.2Table 3 Footnote a | 4664.7 | 4683.8 | 50.2Table 3 Footnote b | 3.0Table 3 Footnote b | < 0.001Table 3 Footnote b |
| Atlantic | 1445.6 | 1445.2 | 1445.2Table 3 Footnote a | 0.0 | 1.0 | 0.933 | |
| Quebec | 1644.3 | 1643.4Table 3 Footnote a | 1645.6 | 14.7Table 3 Footnote b | 2.0Table 3 Footnote b | < 0.001Table 3 Footnote b | |
| Ontario | 1744.5 | 1743.3Table 3 Footnote a | 1746.0 | 7.8Table 3 Footnote b | 2.0Table 3 Footnote b | 0.020Table 3 Footnote b | |
| Manitoba | 1242.9 | 1242.8 | 1241.8Table 3 Footnote a | 4.4Table 3 Footnote b | 1.0Table 3 Footnote b | 0.037Table 3 Footnote b | |
| Saskatchewan | 1238.4 | 1237.3 | 1235.9Table 3 Footnote a | 2.0 | 1.0 | 0.159 | |
| Alberta | 1420.5 | 1419.6 | 1417.6Table 3 Footnote a | 2.1 | 1.0 | 0.152 | |
| British Columbia | 1469.5Table 3 Footnote a | 1489.2 | 1517.7 | 63.1Table 3 Footnote b | 3.0Table 3 Footnote b | < 0.001Table 3 Footnote b | |
| Diabetes | Canada | 7019.3 | 7017.7Table 3 Footnote a | 7019.2 | 30.1Table 3 Footnote b | 2.0Table 3 Footnote b | < 0.001Table 3 Footnote b |
| Atlantic | 1832.9Table 3 Footnote a | 1836.1 | 1834.4 | 7.0 | 3.0 | 0.074 | |
| Quebec | 2191.3 | 2190.1 | 2188.6Table 3 Footnote a | 2.2 | 1.0 | 0.142 | |
| Ontario | 2406.1 | 2404.9Table 3 Footnote a | 2407.3 | 45.5Table 3 Footnote b | 2.0Table 3 Footnote b | < 0.001Table 3 Footnote b | |
| Manitoba | 1677.1Table 3 Footnote a | 1677.9 | 1686.3 | 22.0Table 3 Footnote b | 3.0Table 3 Footnote b | < 0.001Table 3 Footnote b | |
| Saskatchewan | 1640.2 | 1638.9Table 3 Footnote a | 1640.8 | 17.0Table 3 Footnote b | 2.0Table 3 Footnote b | < 0.001Table 3 Footnote b | |
| Alberta | 1920.4 | 1918.6 | 1917.7Table 3 Footnote a | 2.4 | 1.0 | 0.123 | |
| British Columbia | 1995.6Table 3 Footnote a | 1995.9 | 2003.0 | 36.1Table 3 Footnote b | 3.0Table 3 Footnote b | < 0.001Table 3 Footnote b | |
| Hypertension | Canada | 6606.8 | 6606.1 | 6605.3Table 3 Footnote a | 70.0Table 3 Footnote b | 1.0Table 3 Footnote b | < 0.001Table 3 Footnote b |
| Atlantic | 1937.1 | 1936.8 | 1936.3Table 3 Footnote a | 33.3Table 3 Footnote b | 1.0Table 3 Footnote b | < 0.001Table 3 Footnote b | |
| Quebec | 2245.0 | 2243.3 | 2242.2Table 3 Footnote a | 8.6Table 3 Footnote b | 1.0Table 3 Footnote b | 0.003Table 3 Footnote b | |
| Ontario | 2373.0 | 2371.5 | 2370.5Table 3 Footnote a | 34.4Table 3 Footnote b | 1.0Table 3 Footnote b | < 0.001Table 3 Footnote b | |
| Manitoba | 1770.6Table 3 Footnote a | 1771.1 | 1771.1 | 4.6 | 3.0 | 0.206 | |
| Saskatchewan | 1734.9Table 3 Footnote a | 1736.9 | 1739.5 | 55.9Table 3 Footnote b | 3.0Table 3 Footnote b | < 0.001Table 3 Footnote b | |
| Alberta | 2066.3 | 2065.1Table 3 Footnote a | 2065.9 | 8.1Table 3 Footnote b | 2.0Table 3 Footnote b | 0.018Table 3 Footnote b | |
| British Columbia | 2086.7 | 2084.2Table 3 Footnote a | 2095.8 | 80.4Table 3 Footnote b | 2.0Table 3 Footnote b | < 0.001Table 3 Footnote b | |
| IHD | Canada | 6213.3 | 6212.9 | 6211.0Table 3 Footnote a | 0.2 | 1.0 | 0.692 |
| Atlantic | 2017.7 | 2017.1 | 2015.9Table 3 Footnote a | 6.9Table 3 Footnote b | 1.0Table 3 Footnote b | 0.008Table 3 Footnote b | |
| Quebec | 2045.7 | 2044.0 | 2042.4Table 3 Footnote a | 2.5 | 1.0 | 0.116 | |
| Ontario | 2233.8Table 3 Footnote a | 2235.8 | 2234.1 | 5.6 | 3.0 | 0.131 | |
| ManitobaTable 3 Footnote c | 636.0 | 634.2 | 634.3Table 3 Footnote a | 4.6Table 3 Footnote b | 1.0Table 3 Footnote b | 0.032Table 3 Footnote b | |
| Saskatchewan | 1437.2 | 1435.3 | 1433.8Table 3 Footnote a | 1.7 | 1.0 | 0.195 | |
| Alberta | 1825.7 | 1824.3Table 3 Footnote a | 1825.4 | 3.5 | 2.0 | 0.173 | |
| British Columbia | 1774.8Table 3 Footnote a | 1777.5 | 1778.8 | 14.2Table 3 Footnote b | 3.0Table 3 Footnote b | 0.003Table 3 Footnote b | |
| Stroke | Canada | 3736.4 | 3734.4 | 3732.6Table 3 Footnote a | 0.002 | 1.0 | 0.964 |
| Atlantic | 977.8 | 975.7 | 974.3Table 3 Footnote a | 0.9 | 1.0 | 0.357 | |
| Quebec | 1306.4 | 1304.5 | 1302.6Table 3 Footnote a | 0.9 | 1.0 | 0.351 | |
| Ontario | 1389.3 | 1387.5 | 1385.5Table 3 Footnote a | 1.1 | 1.0 | 0.290 | |
| Manitoba | 922.8 | 920.3Table 3 Footnote a | 922.4 | 17.2Table 3 Footnote b | 2.0Table 3 Footnote b | < 0.001Table 3 Footnote b | |
| Saskatchewan | 896.6 | 894.8 | 892.9Table 3 Footnote a | 1.6 | 1.0 | 0.203 | |
| Alberta | 1051.7 | 1051.2 | 1049.3Table 3 Footnote a | 0.04 | 1.0 | 0.834 | |
| British Columbia | 1146.0 | 1145.1Table 3 Footnote a | 1147.2 | 4.2 | 2.0 | 0.120 | |
|
Abbreviations: AIC, Akaike information criterion; COPD, chronic obstructive pulmonary disease; IHD, ischemic heart disease.
|
|||||||
Figure 1 reports the national age-standardized incidence rates for all diseases, illustrating the nature of the decreasing trend over time. Diabetes incidence generally increased before beginning to decrease in 2009. Inconsistent changes in incidence rates can be observed over time for diseases where the models with year as an RCS indicated that the national data did not have a linear effect of time (e.g., asthma, COPD, diabetes, and hypertension). For example, COPD incidence displays a mildly cubic shape and hypertension incidence has a slightly quadratic shape, where decreases in incidence rates are minimal at first and begin to increase as time progresses. In contrast, both IHD and stroke show little deviation from a linear trend, as indicated by the spline model results.
Figure 1. Age-standardized chronic disease incidence rate estimates for Canada
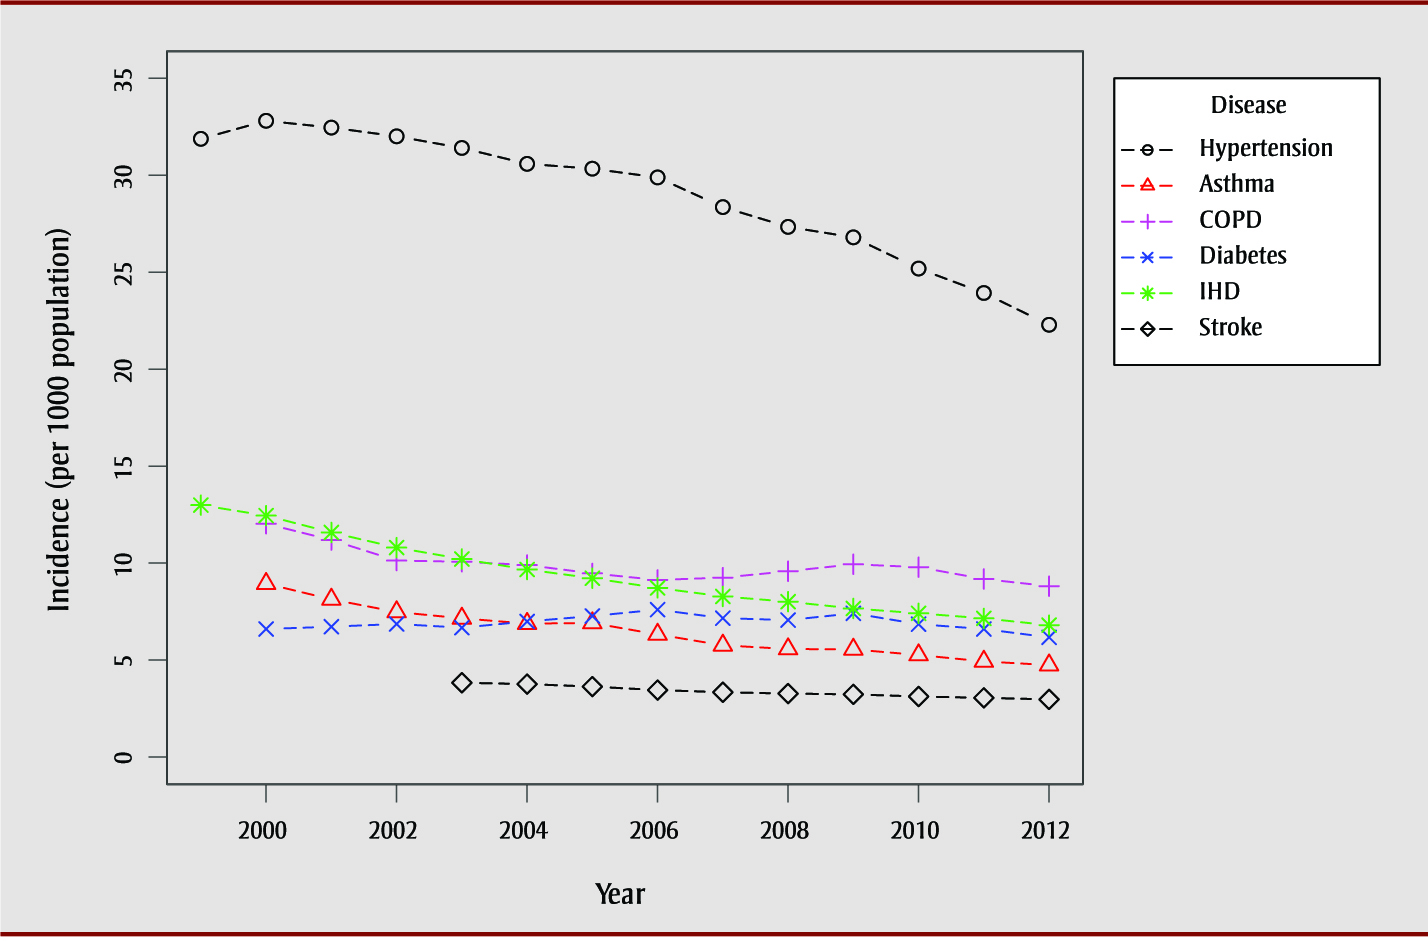
Abbreviations: COPD, chronic obstructive pulmonary disease; IHD, ischemic heart disease.
Text Description
| Year | Incidence (per 1000 population) | |||||
|---|---|---|---|---|---|---|
| Asthma | COPD | Diabetes | Hypertension | IHD | Stroke | |
| 1999 | N.A. | N.A. | N.A. | 31.88 | 12.99 | N.A. |
| 2000 | 8.94 | 12.03 | 6.6 | 32.81 | 12.45 | N.A. |
| 2001 | 8.13 | 11.19 | 6.72 | 32.46 | 11.58 | N.A. |
| 2002 | 7.48 | 10.13 | 6.86 | 32.01 | 10.8 | N.A. |
| 2003 | 7.15 | 10.07 | 6.67 | 31.41 | 10.21 | 3.83 |
| 2004 | 6.88 | 9.9 | 6.99 | 30.59 | 9.67 | 3.76 |
| 2005 | 6.91 | 9.47 | 7.27 | 30.34 | 9.22 | 3.63 |
| 2006 | 6.32 | 9.13 | 7.6 | 29.89 | 8.72 | 3.45 |
| 2007 | 5.76 | 9.25 | 7.16 | 28.36 | 8.28 | 3.34 |
| 2008 | 5.57 | 9.58 | 7.06 | 27.34 | 8.01 | 3.27 |
| 2009 | 5.55 | 9.94 | 7.41 | 26.8 | 7.66 | 3.23 |
| 2010 | 5.26 | 9.79 | 6.85 | 25.19 | 7.41 | 3.12 |
| 2011 | 4.93 | 9.18 | 6.6 | 23.93 | 7.15 | 3.05 |
| 2012 | 4.74 | 8.81 | 6.17 | 22.29 | 6.8 | 2.97 |
Discussion
Our study assessed Canadian chronic disease incidence rates over time and determined if the trends were best captured by modelling time (i.e., year) as a linear effect. Results from the models with a linear time effect showed that chronic disease incidence rates are slowly decreasing for all diseases except diabetes; however, in many cases, allowing for departures from linearity significantly improved model fit. Therefore, to fully understand the changing patterns of chronic disease incidence within and across Canada, researchers should consider using time as a non-linear factor to summarize and explain chronic disease incidence rates.
Previous Canadian studiesFootnote 4Footnote 5Footnote 6Footnote 7Footnote 8Footnote 9Footnote 11Footnote 12Footnote 30Footnote 31Footnote 32Footnote 33 about chronic disease incidence rates have described changes in incidence rates as absolute or relative differences between the first and last years of the study period, ignoring the rate patterns in the interim. Exceptions to this are two studies exploring the incidence rates of type oneFootnote 15 and type twoFootnote 16 diabetes in British Columbia. These studies analyzed the overall annual percent change in incidence rates and reported the years in which significant changes in rates occurred. Results from both studies indicate that changes in diabetes incidence rates were not constant over time and could not be fully described using the difference between the first and last years of observation.
Based on our findings, incidence rates demonstrate an overall downward trend for all diseases except for diabetes. These findings are consistent with findings from other studies that have examined chronic disease incidence rates within Canada using administrative health data. However, previous studies have not necessarily assessed incidence trends over the same period as was used in our study, so comparisons should be made with caution. Age- and sex-standardized stroke hospital admissions rates across Canada dropped by 0.74 per 1000 population between 1994 and 2004Footnote 6 and 0.227 per 1000 population between 2003 and 2013.Footnote 5 Age- and sex-standardized asthma incidence rates in Ontario increased between 1996–1997 and 2000–2001 then remained stable to 2004–2005 among children 14 years and younger while older age groups showed declines ranging from 0.4 to 1.3 per 1000 between 1996 and 2005.Footnote 14 In Ontario, age- and sex-standardized concurrent asthma and COPD incidence rates decreased by 0.4 per 1000 from 2002 to 2012 and age- and sex- standardized COPD incidence rates decreased by 3.3 per 1000 from 1996 to 2007.Footnote 7Footnote 8 Alberta age- and sex-standardized COPD incidence also decreased from 2002 to 2010,Footnote 10 and age- standardized incidence rates decreased by 5.1 per 1000 between 2001 and 2011 in Quebec.Footnote 9 Heart disease incidence rates (age-standardized) decreased in Quebec and Canada overall by approximately 5.6 per 1000 between 2000 and 2013,Footnote 12 and 5.5 per 1000 from 2000–2001 to 2012–2013,Footnote 13 respectively. Age-standardized heart failure incidence decreased in Ontario by 1.49 per 1000 between 1997 and 2007.Footnote 11 In contrast, diabetes incidence appears to be increasing in Alberta (1995–2006; age- and sex-adjusted) and Ontario (1997–2003; age- and sex-adjusted) but a variable trend among youth and children in British Columbia (2002–2003 to 2012–2013; age-standardized).Footnote 15Footnote 16Footnote 17Footnote 18
Potential reasons for the overall decline in chronic disease incidence may include lower prevalence of modifiable risk factorsFootnote 4 and improved prevention strategies.Footnote 34Footnote 35 Differences in incidence patterns between regions could, in part, be due to differences across provinces in the strategies used to address chronic disease and risk factor management.Footnote 36
The decrease in hypertension, stroke, and IHD incidence for Canada is consistent with a decrease in mortality rates for cardiovascular-related diseases, including IHD, acute myocardial infarction, and heart failure.Footnote 13Footnote 19 Other diseases, such as COPD, do not exhibit consistent trends in mortality rates,Footnote 19 suggesting disease treatment may also play a role in the relationship between incidence and mortality rates. For diseases with a shorter average time between detection and death, such as stroke, mortality rates may be more indicative of changing incidence rates, rather than changes in treatment.
CCDSS methods for using administrative data to capture disease incidence have been validated for several chronic diseases, including asthma, COPD, IHD, hypertension, and diabetes.Footnote 37Footnote 38Footnote 39Footnote 40Footnote 41 The first date of disease diagnosis is used in administrative data as a proxy for disease onset. Incidence trends captured by the CCDSS can provide valuable insights into changes in Canadian population health; however, they may be influenced by changes in administrative data quality, such as modifications in data collection methods, coding and classification systems, or billing practices. For example, an increase in the number of healthcare practitioners paid by salary who submit administrative data via shadow-billing rather than the traditional fee-for-service method may increase the number of missing diagnoses codes.Footnote 21 Changes in clinical practice and screening and diagnoses criteria also likely influence trends in chronic disease incidence captured by the CCDSS over time. Moreover, incentive programs within different regions, such as the British Columbia Chronic Disease Incentive Program implemented in April 2006, may also erroneously influence incidence trends, where better healthcare access and continuity of care result in increased disease detection within the first years after program implementation.Footnote 42 Factors influencing administrative data and its collection should be considered when interpreting incidence rates obtained from the CCDSS.
There are several benefits to using CCDSS data to examine chronic disease incidence within Canada. Previous studiesFootnote 4Footnote 7Footnote 8Footnote 9Footnote 10Footnote 11Footnote 12Footnote 14Footnote 15Footnote 16Footnote 17Footnote 18Footnote 31Footnote 32Footnote 33Footnote 43 have only looked at diseases within one region of Canada. With CCDSS data, trends can be examined for Canada as a whole, as well as for different Canadian regions, using publicly available data. There is also good validity to compare the trends within different regions of Canada, as data were obtained using uniform case ascertainment methods. Moreover, CCDSS data can be used to assess longitudinal trends without interruption; national longitudinal survey data are often collected in waves with no available data for the years between waves.
While our analysis allowed us to determine if significant departures from linearity occurred for the time effect, it did not allow us to assess where the departures occurred. Such information would be beneficial to inform if, and how, specific changes in health policy (i.e., access to healthcare, physician reimbursement policies, billing practices), risk factors, and intervention efforts are related to disease incidence.
Future research could examine factors influencing changing incidence of chronic disease over time across Canada. Chronic disease incidence rates estimated from administrative data may be influenced by changes in population health status, clinical diagnostic and screening practices, or administrative practices within provinces, such as physician billing methods. Future analyses could focus on incidence estimates for other chronic diseases that are now a part of the CCDSS, including osteoporosis, depression, and osteoarthritis. The CCDSS Data Quality Working Group plans to explore incidence trends within Canada’s P/Ts and conduct data quality surveys to help ascertain how much changing trends are due to changes in administrative practices or changes in population health.
Acknowledgements
These data were made possible through collaboration between the Public Health Agency of Canada and the respective provincial governments of Alberta, Newfoundland and Labrador, Prince Edward Island, Nova Scotia, New Brunswick, Quebec, Ontario, Manitoba, Saskatchewan, British Columbia, Northwest Territories, Yukon, and Nunavut. The summary data on which the analyses were conducted have been produced by the Public Health Agency of Canada. No endorsement by the provinces and territories is intended or should be inferred. Provincial and territorial data were contributed to the CCDSS as of April 2017.
NCH is supported by the Visual and Automated Data Analytics (VADA) Training Program. LML is supported by a Tier 1 Canada Research Chair (CRC) in Methods for Electronic Health Data Quality.
Conflicts of interest
JMP reports that his employer, ICES, received funding from the Public Health Agency of Canada to provide data to the Canadian Chronic Disease Surveillance System during the conduct of this study. KAMP was supported by funding from the Public Health Agency of Canada during the conduct of this study.
Authors’ contributions and statement
All authors conceived the idea for the study. NCH and LT conducted the analyses. NCH, LML, JE, and LP prepared the draft manuscript. All authors reviewed and approved the final manuscript for submission.
The content and views expressed in this article are those of the authors and do not necessarily reflect those of the Government of Canada.
References
- Footnote 1
-
Hung WW, Ross JS, Boockvar KS, Siu AL. Recent trends in chronic disease, impairment and disability among older adults in the United States. BMC Geriatr. 2011;11:47.
- Footnote 2
-
Thorpe KE, Philyaw M. The medicalization of chronic disease and costs. Annu Rev Public Health. 2012;33(1):409-23.
- Footnote 3
-
Naghavi M, Abajobir AA, Abbafati C, et al. Global, regional, and national age-sex specific mortality for 264 causes of death, 1980–2016: a systematic analysis for the Global Burden of Disease Study 2016. The Lancet. 2017;390(10100):1151-210.
- Footnote 4
-
Public Health Agency of Canada. How Healthy are Canadians? [Internet]. Ottawa (ON) : Public Health Agency of Canada; 2017. Available from: https://www.canada.ca/en/public-health/services/publications/healthy-living/how-healthy-canadians.html
- Footnote 5
-
Kamal N, Lindsay MP, Côté R, Fang J, Kapral MK, Hill MD. Ten-year trends in stroke admissions and outcomes in Canada. Can J Neurol Sci. 2015;42(3):168-75.
- Footnote 6
-
Tu JV, Nardi L, Fang J, et al. National trends in rates of death and hospital admissions related to acute myocardial infarction, heart failure and stroke, 1994-2004. CMAJ. 2009;180(13):E118-125.
- Footnote 7
-
Gershon AS, Wang C, Wilton AS, Raut R, To T. Trends in chronic obstructive pulmonary disease prevalence, incidence, and mortality in Ontario, Canada, 1996 to 2007: a population-based study. Arch Intern Med. 2010;170(6):560-5.
- Footnote 8
-
Kendzerska T, Sadatsafavi M, Aaron SD, et al. Concurrent physician-diagnosed asthma and chronic obstructive pulmonary disease: a population study of prevalence, incidence and mortality. PLOS ONE. 2017;12(3):e0173830.
- Footnote 9
-
Doucet M, Rochette L, Hamel D. Incidence, prevalence, and mortality trends in chronic obstructive pulmonary disease over 2001 to 2011: a public health point of view of the burden. Can Respir J. 2016;2016.
- Footnote 10
-
Ospina MB, Voaklander D, Senthilselvan A, et al. Incidence and prevalence of chronic obstructive pulmonary disease among Aboriginal Peoples in Alberta, Canada. PLOS ONE. 2015;10(4):e0123204.
- Footnote 11
-
Yeung DF, Boom NK, Guo H, Lee DS, Schultz SE, Tu JV. Trends in the incidence and outcomes of heart failure in Ontario, Canada: 1997 to 2007. CMAJ. 2012;184(14):E765-73.
- Footnote 12
-
Blais C, Rochette L. Trends in prevalence, incidence and mortality of diagnosed and silent coronary heart disease in Quebec. Health Promot Chronic Dis Prev Can. 2015;35(10):184-93.
- Footnote 13
-
Public Health Agency of Canada. Report from the Canadian Chronic Disease Surveillance System: Heart Disease in Canada, 2018 [Internet]. Ottawa (ON): Public Health Agency of Canada; 2018. Available from: https://www.canada.ca/en/public-health/services/publications/diseases-conditions/report-heart-disease-Canada-2018.html#s2-1
- Footnote 14
-
Gershon AS, Guan J, Wang C, To T. Trends in asthma prevalence and incidence in Ontario, Canada, 1996-2005: a population study. Am J Epidemiol. 2010;172(6):728-36.
- Footnote 15
-
Fox DA, Islam N, Sutherland J, Reimer K, Amed S. Type 1 diabetes incidence and prevalence trends in a cohort of Canadian children and youth. Pediatr Diabetes. 2018;19(3):501-5.
- Footnote 16
-
Amed S, Islam N, Sutherland J, Reimer K. Incidence and prevalence trends of youth-onset type 2 diabetes in a cohort of Canadian youth: 2002-2013. Pediatr Diabetes. 2018;19(4):630-6.
- Footnote 17
-
Johnson JA, Balko SU, Hugel G, Low C, Svenson LW. Increasing incidence and prevalence with limited survival gains among rural Albertans with diabetes: a retrospective cohort study, 1995-2006. Diabet Med J Br Diabet Assoc. 2009;26(10):989-95.
- Footnote 18
-
Lipscombe LL, Hux JE. Trends in diabetes prevalence, incidence, and mortality in Ontario, Canada 1995-2005: a population-based study. Lancet Lond Engl. 2007;369(9563):750-6.
- Footnote 19
-
Statistics Canada. Deaths and age-specific mortality rates, by selected grouped causes [Internet]. Ottawa (ON): Statistics Canada; 2018 [cited 2018 Nov 29]. Available from: https://www150.statcan.gc.ca/t1/tbl1/en/cv.action?pid=1310039201
- Footnote 20
-
Ward MM. Estimating disease prevalence and incidence using administrative data: some assembly required. J Rheumatol. 2013;40(8):1241-3.
- Footnote 21
-
Lix LM, Yao X, Kephart G, et al. A prediction model to estimate completeness of electronic physician claims databases. BMJ Open. 2015;5(8).
- Footnote 22
-
Lix L, Ayles J, Bartholomew S, et al. The Canadian Chronic Disease Surveillance System: a model for collaborative surveillance. Int J Popul Data Sci. 2018;3(3).
- Footnote 23
-
Public Health Agency of Canada. The Canadian Chronic Disease Surveillance System – an overview [Internet]. Ottawa (ON): Public Health Agency of Canada; 2018. Available from: https://www.canada.ca/en/public-health/services/publications/canadian-chronic-disease-surveillance-system-factsheet.html?utm_source=Stkld&utm_medium=Email&utm_campaign=Launch_CCDSS_Fact_Sheet_EN
- Footnote 24
-
Clottey C, Mo F, LeBrun B, Mickelson P, Niles J, Robbins G. The development of the National Diabetes Surveillance System (NDSS) in Canada. Chronic Dis Can. 2001;22(2):67-9.
- Footnote 25
-
European Centre for Disease Prevention and Control. Data quality monitoring and surveillance system evaluation – A handbook of methods and applications [Internet]. Stockholm: ECDC; 2014. Available from: https://ecdc.europa.eu/sites/portal/files/media/en/publications/Publications/Data-quality-monitoring-surveillance-system-evaluation-Sept-2014.pdf
- Footnote 26
-
Public Health Agency of Canada. Public Health Infobase: Canadian Chronic Disease Surveillance System (CCDSS) [Internet]. Ottawa (ON): Public Health Agency of Canada; 2018. Available from: https://infobase.phac-aspc.gc.ca/ccdss-scsmc/data-tool/
- Footnote 27
-
Harrell F. Regression modeling strategies: with applications to linear models, logistic and ordinal regression, and survival analysis. 2nd ed. Springer International Publishing; 2015.
- Footnote 28
-
Stone CJ. [Generalized Additive Models]: Comment. Stat Sci. 1986;1(3):312-4.
- Footnote 29
-
Akaike H. A new look at the statistical model identification. IEEE Trans Autom Control. 1974;19(6):716-23.
- Footnote 30
-
Robitaille C, Dai S, Waters C, et al. Diagnosed hypertension in Canada: incidence, prevalence and associated mortality. CMAJ. 2012;184(1):E49-56.
- Footnote 31
-
Wijeratne DT, Lajkosz K, Brogly SB, et al. Increasing incidence and prevalence of World Health Organization groups 1 to 4 pulmonary hypertension: a population-based cohort study in Ontario, Canada. Circ Cardiovasc Qual Outcomes. 2018;11(2):e003973.
- Footnote 32
-
Tu K, Chen Z, Lipscombe LL. Prevalence and incidence of hypertension from 1995 to 2005: a population-based study. CMAJ. 2008;178(11):1429-35.
- Footnote 33
-
Blais C, Rochette L, Hamel D, Poirier P. Prevalence, incidence, awareness and control of hypertension in the province of Quebec: perspective from administrative and survey data. Can J Public Health. 2014;105(1):79-85.
- Footnote 34
-
Schiffrin EL, Campbell NRC, Feldman RD, et al. Hypertension in Canada: past, present, and future. Ann Glob Health. 2016;82(2):288-99.
- Footnote 35
-
Maximova K, Hanusaik N, Kishchuk N, Paradis G, O’Loughlin JL. Public health strategies promoting physical activity and healthy eating in Canada: are we changing paradigms? Int J Public Health. 2016;61(5):565-72.
- Footnote 36
-
Kothari A, Gore D, MacDonald M, et al. Chronic disease prevention policy in British Columbia and Ontario considering public health renewal: a comparative policy analysis. BMC Public Health. 2013;13:934.
- Footnote 37
-
Gershon AS, Wang C, Guan J, Vasilevska-Ristovska J, Cicutto L, To T. Identifying patients with physician-diagnosed asthma in health administrative databases. Can Respir J. 2009;16(6):183-8.
- Footnote 38
-
Gershon AS, Wang C, Guan J, Vasilevska-Ristovska J, Cicutto L, To T. Identifying individuals with physcian diagnosed COPD in health administrative databases. COPD. 2009;6(5):388-94.
- Footnote 39
-
Tu K, Mitiku T, Lee DS, Guo H, Tu JV. Validation of physician billing and hospitalization data to identify patients with ischemic heart disease using data from the Electronic Medical Record Administrative data Linked Database (EMRALD). Can J Cardiol. 2010;26(7):e225-228.
- Footnote 40
-
Public Health Agency of Canada. Report from the Canadian Chronic Disease Surveillance System: Hypertension in Canada, 2010 [Internet]. Ottawa (ON): Public Health Agency of Canada; 2010. Available from: https://www.canada.ca/en/public-health/services/chronic-diseases/cardiovascular-disease/report-canadian-chronic-disease-surveillance-system-hypertension-canada-2010.html
- Footnote 41
-
Lipscombe LL, Hwee J, Webster L, Shah BR, Booth GL, Tu K. Identifying diabetes cases from administrative data: a population-based validation study. BMC Health Serv Res. 2018;18.
- Footnote 42
-
Lavergne MR, Law MR, Peterson S, et al. Effect of incentive payments on chronic disease management and health services use in British Columbia, Canada: interrupted time series analysis. Health Policy. 2018;122(2):157-64.
- Footnote 43
-
Dik N, Anthonisen NR, Manfreda J, Roos LL. Physician-diagnosed asthma and allergic rhinitis in Manitoba: 1985-1998. Ann Allergy Asthma Immunol. 2006;96(1):69-75.