
At-a-glance – Initial evaluation of Manitoba’s cannabis surveillance system
Health Promotion and Chronic Disease Prevention in Canada
Anja Bilandzic, MPHAuthor reference footnote 1; Songul Bozat-Emre, PhDAuthor reference footnote 2Author reference footnote 3
https://doi.org/10.24095/hpcdp.40.7/8.04
Correspondence: Anja Bilandzic, 300 Carlton Street, Winnipeg, MB R3B 3M9; Email: anja.bilandzic@canada.ca
Abstract
The Government of Manitoba created a cannabis public health surveillance system in 2018 in preparation for nonmedical cannabis legalization on 17 October, 2018. An initial evaluation was conducted to assess the usefulness, flexibility and simplicity attributes of the system, using an online stakeholder survey, website metrics, system analysis and interviews. Resulting recommendations included creating a detailed communication plan for surveillance products, changing the format and frequency of reporting, maintaining strong relationships with partners and building towards a centralized provincial substance use surveillance database and surveillance system.
Keywords: cannabis, public health surveillance, evaluation, Manitoba
Highlights
- Evaluating public health surveillance systems is essential for understanding system performance and providing guidance for improvement.
- An initial evaluation of Manitoba’s cannabis surveillance system showed that the system was moderately useful, highly flexible and moderately simple.
- Recommendations included creating a detailed communications plan prior to surveillance product release to increase the audience reach; producing a shorter infographic-style product that sets cannabis in context of other substances once or twice a year; and leveraging the existing provincial opioid misuse and overdose surveillance system to include cannabis and other substances.
Introduction
Nonmedical cannabis use was legalized in Canada on 17 October, 2018, when the Cannabis Act came into force.Footnote 1 To prepare for this event, the provincial department of health (Manitoba Health, Seniors and Active Living) created Manitoba’s cannabis surveillance system. The purpose of the system was “… to manage, analyze, and interpret cannabis and related data from a range of stakeholders to provide epidemiologic evidence to inform policy and programs in Manitoba.”Footnote 2 More specific objectives of the system were to
(1) monitor cannabis-use behaviour patterns among people in Manitoba;
(2) measure cannabis-related health impacts among people in Manitoba; and
(3) measure justice-related impacts of cannabis policy in Manitoba.
A list of indicators in the system can be seen in Table 1. An initial baseline report was released in November 2018,Footnote 2 and was modelled from existing opioid misuse and overdose surveillance reports.Footnote 3 In order to better understand the performance of the cannabis surveillance system, and to inform future development at this early stage, an initial evaluation of the system was conducted.
Table 1. Manitoba cannabis surveillance system indicators, by objective
| Indicator | Data source | |
|---|---|---|
| Objective 1: To monitor cannabis use behaviour patterns among youth and adults in Manitoba | ||
| Patterns of use | Percentage of youth who used cannabis in last year (Grades 7–12) | AFM’s Student Survey (2007)Manitoba Youth Health Survey (2012/13) |
| Percentage of youth who used cannabis in last 30 days (high school students) | AFM’s Student Survey (2007) | |
| Quantity of cannabis used per session | Manitoba Cannabis Survey (2017) | |
| Percentage of cannabis users by type of product used (e.g. plant, edible) | Manitoba Cannabis Survey (2017) | |
| Percentage of cannabis users who frequently/often use cannabis alongside alcohol | Manitoba Cannabis Survey (2017) | |
| Driving | Percentage of adults who have driven after using cannabis | Manitoba Cannabis Survey (2017) |
| Percentage of adults with driver’s licences who consumed cannabis within two hours of driving | Statistics Canada National Cannabis Survey | |
| Objective 2: To measure the burden of cannabis-related health harms among youth and adults in Manitoba | ||
| Poisoning | Rate of in-patient hospitalizations that include cannabis poisoning ICD-10-CA diagnosis code (T40.7) | DAD |
| Number of cannabis-related calls to Health Links – Info Santé | Health Links – Info Santé | |
| Number of cannabis-related calls to Manitoba Poison Control Centre | MB Poison Control Centre | |
| Mental wellness | Rate of in-patient hospitalizations that include cannabis-related disorder ICD-10-CA diagnosis codes (F12.x) | DAD |
| Rate of in-patient hospitalizations that include cannabis abuse ICD-10-CA diagnosis code (F12.1) | DAD | |
| Rate of in-patient hospitalizations that include cannabis dependence syndrome ICD-10-CA diagnosis code (F12.2) | DAD | |
| Rate of in-patient hospitalizations that include cannabis-related psychotic disorder ICD-10-CA diagnosis code (F12.5) | DAD | |
| Proportion of clients with past-year cannabis use in publicly funded substance use treatment centres | Addiction Policy and Support Branch, MHSAL | |
| Objective 3: To measure justice-related impacts of cannabis policy among youth and adults in Manitoba | ||
| Justice | Number of samples that tested positive for THC or CBD | HC Drug Analysis Service |
| Rate of charges for drug-impaired operation of vehicle/vessel/aircraft among youth (12–17 years) | Statistics Canada UCRS | |
| Rate of charges for drug-impaired operation of vehicle/vessel/aircraft among adults (18+ years) | Statistics Canada UCRS | |
| Rate of charges for cannabis possession among youth (12–17 years) | Statistics Canada UCRS | |
| Rate of charges for cannabis possession among adults (18+ years) | Statistics Canada UCRS | |
| Rate of charges for cannabis trafficking among youth (12–17 years) | Statistics Canada UCRS | |
| Rate of charges for cannabis trafficking among adults (18+ years) | Statistics Canada UCRS | |
The objectives of this initial evaluation were to (1) understand if Manitoba’s cannabis surveillance system was meeting its intended objectives, and (2) to define the direction that a sustainable and relevant provincial cannabis surveillance system should take going forward. Specifically, these objectives relate to the content of the system (i.e. which indicators should be used), the identification of stakeholders’ needs and the format and frequency of reporting.
Methods
We undertook an evaluation using guidance from the Centers of Disease Control and PreventionFootnote 4 (CDC) and the European Centre for Disease Prevention and Control,Footnote 5 with specific direction from recent work from the CDC in evaluating behavioural health surveillance systems.Footnote 6Footnote 7 Three attributes, deemed to be the most relevant for a new and changing system, were selected for evaluation: usefulness, flexibility and simplicity. For each attribute, we used multiple evaluation methods (described below), and then made a global assessment based on these results to summarize and communicate our findings. For example, when assessing the overall usefulness (i.e. low, moderate or high), we considered results from an online survey and from website metrics to make a judgment within our organizational context.
Usefulness
This attribute measures whether the system and its outputs are helpful and important for stakeholders. We assessed usefulness through an online survey and website metrics. We conducted the survey using a snowball approach, whereby key stakeholders who received the survey were instructed to send it to others in their networks. The survey covered topics relating to the overall usefulness of the surveillance system baseline report, specific indicator and content questions, and direction for the future. (A copy of the survey is available upon request.) The website metrics measured the number of users accessing the report landing page, and their characteristics in the three months following the release of the baseline report.
Flexibility
This attribute refers to the ability of the system to adapt to changes in stakeholder needs. We assessed flexibility by analyzing the system as a whole (i.e. is it possible to add, delete or modify indicators?). We also created hypothetical scenarios for adding a new indicator (cannabis poisoning in children) using each of the existing health-related data sources. We consulted external data providers about feasibility and process questions when required.
Simplicity
This attribute refers to the system structure and how easy it is to use. We assessed simplicity by analyzing the system as a whole (i.e. how many organizations, data types and human resources are needed) and by documenting and analyzing the data collection, management and analysis steps of the surveillance cycle for each data source.
Results
Usefulness
Initially, we sent the online survey to 52 stakeholders in Manitoba; after snowball sampling, there were 62 survey respondents. The largest proportion of respondents were from regional public health (44%), followed by provincial public health (21%), and other provincial departments (16%). The remainder were from other areas of the government or crown corporations, nongovernmental organizations and other agencies.
The key findings of the survey were as follows:
- Most respondents (55%) were not aware of the baseline report; 24% were aware but had not reviewed it, and 21% were aware and had reviewed it.
- Eighty-three percent of respondents said the overall report was somewhat or very useful; 63% said they already have used or plan to use the information in their work.
- The two most common intentions for using the baseline report were to influence education and awareness activities, and to provide general context to other work.
- Behavioural indicators were most highly rated for usefulness, followed by cannabis-related disorder hospitalizations (ICD-10-CA: F12). In general, poisoning information was rated to be less useful.
- Most respondents (74%) preferred to see the cannabis data in the context of other substances.
- Most respondents (65%) preferred a shorter, infographic style of reporting.
- Annual reporting was favoured by 41% of respondents, and semi-annual by 31%.
Available website metrics captured unique page views for the cannabis surveillance website. Metrics on the report access itself (PDF) were not available. Key findings of the website metrics assessment for usefulness were as follows:
- There were 191 page visits; 56% were internal government views, and 44% were external views.
- Almost all internal views were from a desktop computer; for external views, 55% were from a desktop computer, 38% from a mobile device and 7% from a tablet.
- Forty-five percent of all views were directed from a Google search, 26% were from a direct link and 7% were from the government search engine; 18% of external views came from a Facebook link.
Flexibility
Overall, the whole system is highly flexible. This is because the indicator groups operate independently, so changing one will have no effect on others (i.e. one indicator is not dependent on the presence of another). Also, indicator change decisions are informal and made through a limited group of stakeholders, which makes the process timely and flexible. However, this structure may pose threats, such as inconsistencies in data over time due to changes, in the absence of good documentation.
When hypothetically adding a new indicator about cannabis poisoning among children from existing poisoning data sources, flexibility differed depending on the data source. For example, for hospitalizations, because an ICD-10-CA code already exists for cannabis poisoning and there is direct access to the data source (including custom age queries), it is relatively simple to get this information. However, other queries outside of the current ICD-10-CA structure would require much more effort and time to modify coding. For other data sources, high level indicators were available but there was low flexibility for more specific information; challenges in current data structures, resources and data sharing agreements were identified. A common theme was that several data quality improvement initiatives were currently underway or planned in the near future, highlighting the importance of continued relationship building with data providers.
Simplicity
The overall system itself is complex due to the many data sources (ten data sources provided by eight organizations), and types of data included (survey data, administrative data and program data; Figure 1). In terms of resources, the system development and reporting took one full-time employee (FTE) approximately four months to complete, with additional support from a senior epidemiologist (about 0.33 FTE), and publication support for an additional 2.5 months.
Figure 1. Structure of Manitoba cannabis surveillance system: data flow
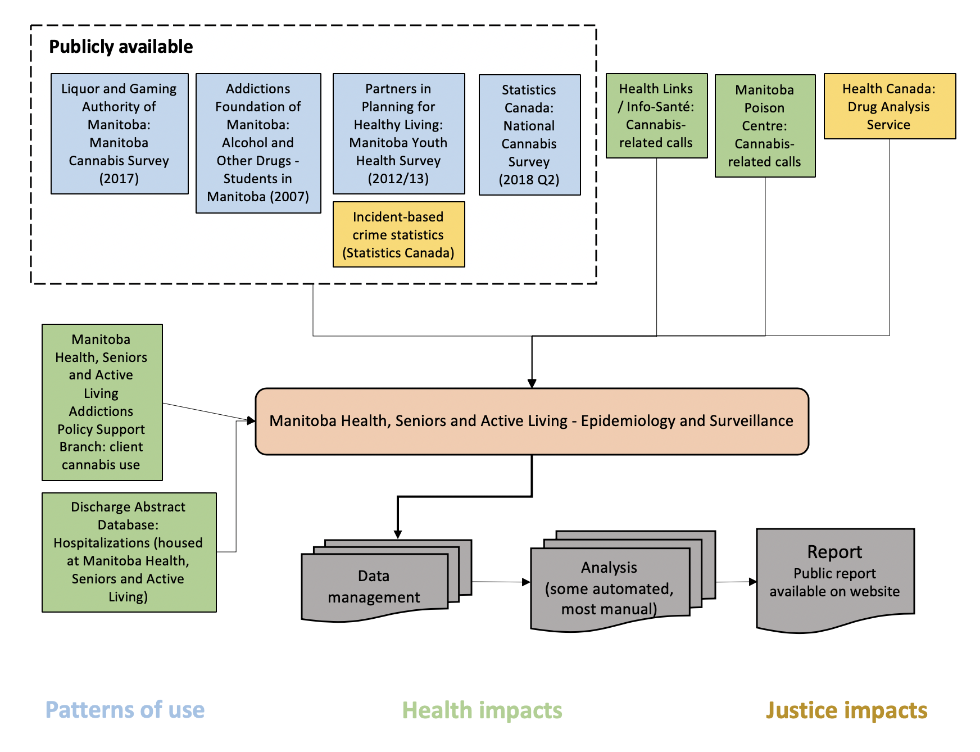
Text description: Figure 1
Figure 1. Structure of Manitoba cannabis surveillance system: data flow
| Level (Top to Bottom) |
Position (Left to Right) | Arrow to | Category | Text |
|---|---|---|---|---|
| 1 | 1 | 3, 2-6 | Patterns of use (Publicly available) | Liquor and Gaming Authority of Manitoba: Manitoba Cannabis Survey (2017) |
| 1 | 2 | 3, 2-6 | Patterns of use (Publicly available) | Addictions Foundation of Manitoba: Alcohol and Other Drugs – Students in Manitoba (2007) |
| 1 | 3 | 3, 2-6 | Patterns of use (Publicly available) | Partners in Planning for Healthy Living: Manitoba Youth Health Survey (2012/13) |
| 2 | 1 | 3, 2-6 | Justice Impacts (Publicly available) | Incident-based crime statistics (Statistics Canada) |
| 1 | 4 | 3, 2-6 | Patterns of use (Publicly available) | Statistics Canada: National Cannabis Survey (2018 Q2) |
| 1 | 5 | 3, 2-6 | Health impacts | Health Links / Info-Santé: Cannabis-related calls |
| 1 | 6 | 3, 2-6 | Health impacts | Manitoba Poison Centre: Cannabis-related calls |
| 1 | 7 | 3, 2-6 | Justice impacts | Health Canada: Drug Analysis Service |
| 3 | 1 | 3, 2-6 | Health impacts | Manitoba Health, Seniors and Active Living Addictions Policy Support Branch: client cannabis use |
| 3 | 2-6 | 4, 3 | N/A | Manitoba Health, Seniors and Active Living – Epidemiology and Surveillance |
| 4 | 1 | 3, 2-6 | Health impacts | Discharge Abstract Database: Hospitalization (housed at Manitoba Health, Seniors and Active Living) |
| 4 | 3 | 4, 4 | N/A | Data management |
| 4 | 4 | 4, 5 | N/A | Analysis (some automated, most manual) |
| 4 | 5 | END | N/A | Report (public report available on website) |
For each data source, data collection ranges from downloading publicly available content, to making specific data requests, to accessing departmental data directly. Several file types are involved, including PDFs, Excel and CSV files and SAS code/extracts. In terms of management, these data are stored in different folders on a shared drive. As the number of reports increases, there is a risk that the volume of data will become difficult to manage and document in the current structure. However, the actual analysis of the data is simple; most data sources are already aggregated and analyzed, and a few only require manipulation for data visualization. One data source has an automated process (hospital discharge abstract database).
Recommendations
- Create a detailed communications plan prior to surveillance product release; consider new media accessing the products (e.g. mobile devices) and platforms (e.g. Facebook).
- Release surveillance products once or twice per year; include a shorter, infographic-style product, and set cannabis surveillance in the context of other substances.
- Review stakeholder indicator survey feedback and explore ways to measure suggested concepts.
- Document methodologies used by each data provider to maintain comparability across surveillance products in future.
- Maintain strong relationships with data providers in order to leverage future opportunities for improvements in data quality.
- Leverage opioid data management and analysis structure to standardize data management, reduce filing inconsistencies and increase automation.
Conclusion
Overall, this initial evaluation of Manitoba’s cannabis surveillance system identified strengths, weaknesses and opportunities for its enhancement. Stakeholders identified useful indicators from all three objectives of the system, and provided feedback for content areas of interest. The system was found to be generally flexible, and to be relatively complex in terms of data volume and management. Key challenges were identified as the limited reach of the baseline report, and the risk of data management inconsistencies for the future.
Our experience shows the importance of regular surveillance system evaluation. During the surveillance cycle, this is a step that is often overlooked but really should be a key consideration during design and planning of a surveillance system. It is important that the effort put into maintaining surveillance systems and the processes of sharing information be efficient and serve the information needs of users. Evaluation allows us to understand these needs better and informs how we can adapt and improve processes and surveillance products going forward.
Acknowledgements
Thank you to Laura McDougall, Carla Loeppky, François-William Tremblay and Philippe Belanger, who provided thoughtful insight and revisions during the evaluation design process. Thank you to Ciara Shattuck for content expertise, and to Michael Paille for work in the design of the Manitoba cannabis surveillance system.
Conflicts of interest
The authors have no conflicts of interest to declare.
Authors’ contributions and statement
AB conceptualized and designed the evaluation, analyzed and interpreted the data and drafted the manuscript. SBE reviewed the evaluation and contributed to the drafting of the manuscript.
The content and views expressed in this article are those of the authors and do not necessarily reflect those of the Government of Manitoba or of the Government of Canada.