
Original quantitative research – Nicotine content, labelling and flavours of e-liquids in Canada in 2020: a scan of the online retail market

HPCDP Journal Home
Published by: The Public Health Agency of Canada
Date published: January 2022
ISSN: 2368-738X
Submit a manuscript
About HPCDP
Browse
Previous | Table of Contents | Next
Kimberly D’Mello, BScAuthor reference footnote 1; David Hammond, PhDAuthor reference footnote 1; Syed Mahamad, BScAuthor reference footnote 1; Danielle Wiggers, MScAuthor reference footnote 1; Katherine East, PhDAuthor reference footnote 1Author reference footnote 2
https://doi.org/10.24095/hpcdp.42.1.02
This article has been peer reviewed.
Author references
Correspondence
Katherine East, National Addiction Centre, 4 Windsor Walk, London, UK SE5 8BB; Email: katherine.east@kcl.ac.uk
Suggested citation
D’Mello K, Hammond D, Mahamad S, Wiggers D, East K. Nicotine content, labelling and flavours of e-liquids in Canada in 2020: a scan of the online retail market. Health Promot Chronic Dis Prev Can. 2022;42(1):4-11. https://doi.org/10.24095/hpcdp.42.1.02
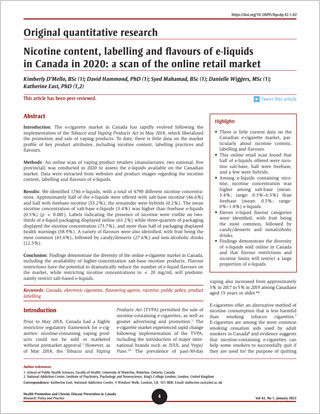
Abstract
Introduction: The e-cigarette market in Canada has rapidly evolved following the implementation of the Tobacco and Vaping Products Act in May 2018, which liberalized the promotion and sale of vaping products. To date, there is little data on the market profile of key product attributes, including nicotine content, labelling practices and flavours.
Methods: An online scan of vaping product retailers (manufacturer, two national, five provincial) was conducted in 2020 to assess the e-liquids available on the Canadian market. Data were extracted from websites and product images regarding the nicotine content, labelling and flavours of e-liquids.
Results: We identified 1746 e-liquids, with a total of 4790 different nicotine concentrations. Approximately half of the e-liquids were offered with salt-base nicotine (46.6%) and half with freebase nicotine (53.2%); the remainder were hybrids (0.2%). The mean nicotine concentration of salt-base e-liquids (3.4%) was higher than freebase e-liquids (0.5%) (p < 0.001). Labels indicating the presence of nicotine were visible on two-thirds of e-liquid packaging displayed online (63.2%) while three-quarters of packaging displayed the nicotine concentration (73.7%), and more than half of packaging displayed health warnings (58.9%). A variety of flavours were also identified, with fruit being the most common (43.6%), followed by candy/desserts (27.6%) and non-alcoholic drinks (12.5%).
Conclusion: Findings demonstrate the diversity of the online e-cigarette market in Canada, including the availability of higher-concentration salt-base nicotine products. Flavour restrictions have the potential to dramatically reduce the number of e-liquid flavours on the market, while restricting nicotine concentrations to < 20 mg/mL will predominantly restrict salt-based e-liquids.
Keywords: Canada, electronic cigarettes, flavouring agents, nicotine, public policy, product labelling
Highlights
- There is little current data on the Canadian e-cigarette market, particularly about nicotine content, labelling and flavours.
- This online retail scan found that half of e-liquids offered were nicotine salt-base, half were freebase, and a few were hybrids.
- Among e-liquids containing nicotine, nicotine concentration was higher among salt-base (mean: 3.4%; range: 0.3%–6.5%) than freebase (mean: 0.5%; range: 0%–1.8%) e-liquids.
- Eleven e-liquid flavour categories were identified, with fruit being the most common, followed by candy/desserts and nonalcoholic drinks.
- Findings demonstrate the diversity of e-liquids sold online in Canada and that flavour restrictions and nicotine limits will restrict a large proportion of e-liquids.
Introduction
Prior to May 2018, Canada had a highly restrictive regulatory framework for e-cigarettes: nicotine-containing vaping products could not be sold or marketed without premarket approval.Footnote 1 However, as of May 2018, the Tobacco and Vaping Products Act (TVPA) permitted the sale of nicotine-containing e-cigarettes, as well as greater advertising and promotion.Footnote 1 The e-cigarette market experienced rapid change following implementation of the TVPA, including the introduction of major international brands such as JUUL and Vype/Vuse.Footnote 2Footnote 3 The prevalence of past-30-day vaping also increased from approximately 3% in 2017 to 5% in 2019 among Canadians aged 15 years or older.Footnote 4Footnote 5Footnote 6
E-cigarettes offer an alternative method of nicotine consumption that is less harmful than smoking tobacco cigarettes.Footnote 7 E-cigarettes are among the most common smoking cessation aids used by adult smokers in CanadaFootnote 8 and evidence suggests that nicotine-containing e-cigarettes can help some smokers to successfully quit if they are used for the purpose of quitting and on a daily basis.Footnote 7Footnote 9Footnote 10Footnote 11 However, there are concerns about the use of e-cigarettes among youth and nonsmokers; in Canada, 11.6% of high school students reported vaping on a daily basis in 2019, among the highest rates in the world.Footnote 12
A range of policy measures are being proposed or implemented at both the provincial and federal levels in Canada, with the aim of minimizing vaping among young people (Figure 1).Footnote 1Footnote 13Footnote 14 Several of these policies seek to reduce the appeal of vaping products by modifying product attributes, including restricting flavours of e-liquids, limiting nicotine concentration to 20 mg/mL (in line with the European Union)Footnote 15 and mandating health warnings and nicotine labelling.
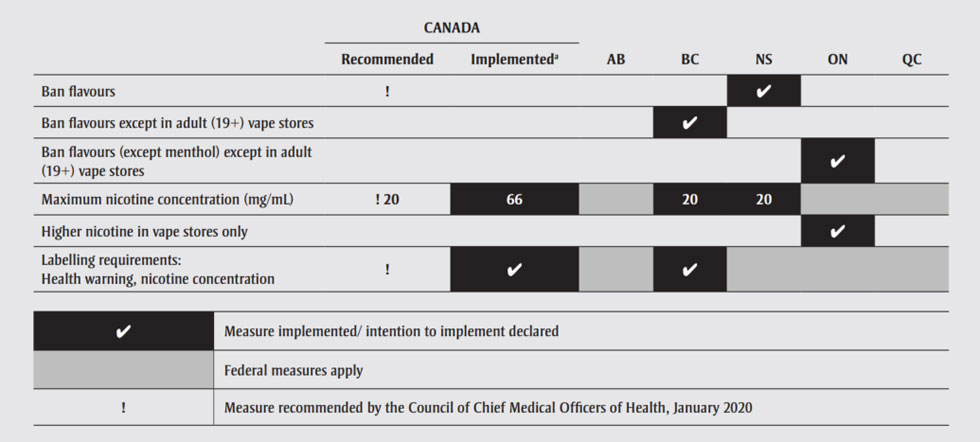
Abbreviations: AB, Alberta; BC, British Columbia; NS, Nova Scotia; ON, Ontario; QC, Quebec.
Note: Only the provinces from which data were collected are included in Figure 1.
a At the time of this study (2020) the maximum nicotine concentration was 66 mg/mL.
Figure 1 - Text description
| Regulation | Canada | Alberta | British Columbia | Nova Scotia | Ontario | Quebec | |
|---|---|---|---|---|---|---|---|
| Recommended (by the council of Chief Medical Officers of Health, January 2020) | ImplementedFootnote a (at the time of this study (2020) the maximum nicotine concentration was 66 mg/mL) | ||||||
| Ban flavours | Yes | No | No | No | Yes | No | No |
| Ban flavours except in adult (19+) vape stores | No | No | No | Yes | No | No | No |
| Ban flavours (except menthol) except in adult (19+) vape stores | No | No | No | No | No | Yes | No |
| Maximum nicotine concentration (mg/mL) | 20 mg/mL is recommended | 66 mg/mL | Federal measures apply | 20 mg/mL | 20 mg/mL | Federal measures apply | Federal measures apply |
| Higher nicotine in vape stores only | No | No | No | No | No | Yes | No |
| Labelling requirements: Health warning, nicotine concentration |
Yes | Yes | Federal measures apply | Yes | Federal measures apply | Federal measures apply | Federal measures apply |
Abbreviations: AB, Alberta; BC, British Columbia; NS, Nova Scotia; ON, Ontario; QC, Quebec.
|
|||||||
Flavours play an important role in vaping among youth and young adults, as well as among adult smokers who are trying to quit. Availability and liking of flavours are among the main reasons for vaping among youth in the USFootnote 16 and England.Footnote 7 Research has also demonstrated that flavours can facilitate smoking cessation.Footnote 17Footnote 18 Fruit flavours are the most popular among both youth and adult vapers,Footnote 5Footnote 7Footnote 19Footnote 20Footnote 21 although, in Canada, tobacco flavours are more commonly used by adults than youth.Footnote 4Footnote 5 Studies have identified thousands of different e-liquid flavours in the USFootnote 22 as well as numerous flavour categories;Footnote 23 however, we are unaware of any comprehensive study of the flavour profile of the Canadian e-liquid market.
Several Canadian provinces have implemented restrictions on the nicotine concentration of e-liquids, and, at the time of this study, Health Canada had proposed a limit of 20 mg of nicotine per mL of e-liquid (Figure 1), similar to existing regulations in the European Union.Footnote 15 In Canada, prior to the implementation of the TVPA in May 2018,Footnote 1 although no nicotine-containing products were approved for sale, the vast majority of e-liquids did contain less than 2% (or 20 mg/mL) of nicotine.Footnote 24 However, since the implementation of the TVPA, an increasing number of brands, such as JUUL, have been introduced to the Canadian market. The most popular variety of JUUL contains 5% nicotine (59 mg/mL) and uses salt-base nicotine e-liquid with a lower pH than freebase e-liquids to enhance the palatability of higher nicotine concentrates.Footnote 25Footnote 26Footnote 27Footnote 28 The high-concentration salt-base nicotine e-liquid pioneered by JUUL has since been adopted by most other nicotine salt brands; however, the extent to which the Canadian market has shifted toward higher-concentration nicotine salt e-cigarettes has yet to be examined.
There is also little data on the packaging and labelling practices of products in Canada, including the extent to which nicotine levels are consistently and clearly labelled on product packaging or at the point of sale (including online). A retail scan conducted in Ontario in 2018 found that a substantial proportion of e-cigarettes for sale in Canada were not labelled as having nicotine and that the accuracy of nicotine labelling was inconsistent when tested for actual nicotine concentration in the products.Footnote 24 Another scan conducted in 2014 found that many e-cigarette products did not include health claims, but instead listed general disclaimers and ingredient information.Footnote 29 The display of “voluntary” health warnings on packaging has also been inconsistent across e-cigarette markets in the United States (US), often changing in response to regulatory proposals by the US Food and Drug Administration (FDA).Footnote 30Footnote 31 In Canada, new federal requirements were implemented in July 2020 mandating maximum nicotine content restrictions and distinct health warnings on product packaging per the Vaping Products Labelling and Packaging RegulationsFootnote 32 although we are unaware of any current studies documenting labelling practices on Canadian vaping products.
Overall, despite the rapidly evolving e-cigarette product market, there is little publicly available data on key product attributes, including the nicotine content, flavours and labelling of e-cigarettes. This information is critically important for understanding how these products are promoted and used by consumers, as well as for understanding the impact of provincial and federal restrictions. Since many consumers purchase vaping products through online retailers,Footnote 33 an understanding of the online market environment is of particular importance.Footnote 34 In our study, we therefore sought to examine the e-liquids available on the online retail market in Canada, with a focus on nicotine concentration, flavours and labelling.
Methods
Data collection
Data were collected through an online scan of vaping product retailers from January to September 2020 (manufacturer, two national, five provincial). This scan was conducted in three steps to ensure a diverse set of vaping products were identified to adequately characterize the Canadian market.
First, a list of 25 leading brands was constructed from the 2019 International Tobacco Control (ITC) Youth and Tobacco and Vaping Survey: Aspire, blu, Eleaf, FreeMax, Geekvape, IJOY, Innokin, Joyetech, JUSTFOG, JUUL, KangerTech, Lost Vape, Mi-Pod, MYLÉ, SMOK, Smoke NV, Snowwolf, STLTH, Suorin, TeslaCigs, UWELL, V2, Vaporesso, VOOPOO, Vype/Vuse. Collectively, these brands represent more than 90% of brand market share among young people who vape in the ITC survey.Footnote 34 Information on all available vaping products for the 25 brands was identified by searching three online sources, in the following order: (1) Canadian website of manufacturer; (2) non-Canadian website of manufacturer (only if Canadian website of manufacturer was not available); and (3) two large, national online retailers. The two national online retailers were selected based on a Google search of terms “vape” and “Canada”. The top ten links to online retailers were identified. The two websites that had the greatest coverage of the leading 25 brands were selected for this study. Each of the 25 leading brands except one (V2) were available for sale in Canada.
Second, additional vaping products (i.e. additional to the 25 leading brands) were identified by scanning the same two large, national online retailers described above. Data on all vaping devices and e-liquids were collected.
Third, one local online retailer per each of five Canadian provinces in our study (British Columbia, Alberta, Ontario, Quebec and Nova Scotia) was also selected to identify additional products. Again, retailers were identified through a Google search of “vape shop” followed by the major city in each province (e.g. “vape shop Toronto”) and one vape store was randomly selected in each province.Vape shops were only eligible if product information was posted online.
Data extraction and coding
Data were extracted from the information available on the websites (text and images). E-liquid product images including packaging were captured using screenshots from online websites. Variables included e-liquid nicotine type (salt-base, freebase, hybrid [a combination of salt and freebase]), nicotine strength (percent and/or mg/mL), flavour category (fruit, candy/dessert, nonalcoholic drink, alcoholic beverage, tobacco, menthol/mint, coffee, spice, unflavoured, tobacco and menthol, other), as well as an indication of a health warning, the presence of nicotine and nicotine strength (percent and/or mg/mL) on e-liquid packaging.
Nicotine concentrations were presented on websites (text and images) either as mg/mL or as a percentage. For consistency, all nicotine concentrations were converted to percentages for the analysis in this study using the formula 1.0 mg/mL = 0.1%. The components of e-liquid packaging were assessed based on the clarity and visibility of the product’s online image. The presence of a health warning, the presence of nicotine and nicotine strength were each recorded as Yes, No or Undiscernible. To establish the reliability of the coding protocol, three researchers independently coded 10% of all product images and reached an agreement on 95.4% of the data.
Data analysis
First, descriptive statistics were calculated on the frequency and proportion of (1) e-liquid products sold in the form of salt, freebase or a hybrid; and (2) e-liquid products within each of the following flavour categories: fruit, candy/dessert, nonalcoholic drink, alcoholic beverage, coffee, spice, tobacco, menthol or mint, tobacco and menthol, unflavoured, or other. Second, mean differences of nicotine concentration were tested between salt and freebase e-liquids (statistical tests were not run for hybrid e-liquids due to low sample size) using an independent samples t test. Third, mean differences of nicotine concentration were tested between e-liquid flavour categories using a one-way analysis of variance (ANOVA) and a Games-Howell post hoc test. Fourth, we calculated the frequency and proportion of e-liquid products with packaging visible on the website that indicated the presence of nicotine, stated the nicotine concentration and had health warnings (text and/or pictorial) followed by a chi-square test to examine associations with e-liquid type (salt vs. freebase).
Results
A total of 1746 e-liquids were identified and analyzed. Overall, 53.2% of the e-liquids identified were labelled or defined on the website as freebase or “regular” (n = 929), while 46.6% were salt-base (n = 814) and 0.2% were hybrid (n = 3). Among the 1746 e-liquids, a total of 4790 different nicotine concentrations were available. In other words, each e-liquid was offered in an average of two or three different nicotine concentrations (Table 1).
| Nicotine concentrations | Salt-base n = 2013 |
Freebase n = 2768 |
Hybrid n = 9 |
Overall n = 4790 |
|---|---|---|---|---|
| Nicotine concentration—categorical [% (n)] | ||||
| 0% | 0 (0) | 26.8 (741) | 0 (0) | 15.5 (741) |
| 0.1%–2.0% | 28.6 (576) | 73.2 (2027) | 100 (9) | 54.5 (2612) |
| 2.1%–5.0% | 68.6 (1380) | 0 (0) | 0 (0) | 28.8 (1380) |
| > 5.0% | 2.8 (57) | 0 (0) | 0 (0) | 1.2 (57) |
| Nicotine concentration (in %)—continuous | ||||
| All e-liquids (n = 4790) | ||||
| Mean (SD) | 3.4 (1.4) | 0.5 (0.4) | 1.2 (0.7) | 1.7 (1.7) |
| Range | 0.3–6.5 | 0.0–1.8 | 0.5–2.0 | 0.0–6.5 |
| E-liquids containing nicotine only (> 0% nicotine; n = 4049) | ||||
| Mean (SD) | 3.4 (1.4) | 0.6 (0.4) | 1.2 (0.7) | 2.0 (1.7) |
| Range | 0.3–6.5 | 0.2–1.8 | 0.5–2.0 | 0.2–6.5 |
Abbreviation: SD, standard deviation.
|
||||
The vast majority of e-liquids sold contained nicotine (84.5%). Only 30% of all e-liquids had nicotine concentrations over 2%, although this proportion was much higher among salt-based e-liquids (71.4%). Freebase e-liquid nicotine concentrations ranged from 0% to 1.8%, although when restricted to nicotine-containing products only, concentrations ranged from 0.2% to 1.8% (Table 1). Salt-based e-liquids ranged from 0.3% to 6.5%, although most had nicotine concentrations of 2.1% to 5.0% and fewer had nicotine concentrations over 5%. Among all products (including 0% nicotine), the mean nicotine concentration was higher among salt-base e-liquids (3.4%) than freebase e-liquids (0.5%; t2278 = 88.5, p < 0.001). Among nicotine-containing products only (> 0%), the mean nicotine concentration was also higher among salt-base e-liquids (3.4%) than freebase e-liquids (0.6%; t2310 = 83.2, p < 0.001; Table 1).
Based on the principal display area of the e-liquid product packaging that was visible online, an indication that the product contained nicotine was available on 63% of all e-liquids, the nicotine concentration was visible on 74% and a health warning was visible on 59% (Table 2). The proportion of products with labels was greater when analyses were restricted to nicotine-containing e-liquids only, such that an indication that the product contained nicotine was available on 66% of all e-liquids, the nicotine concentration was visible on 74% and a health warning was visible on 61%. Between e-liquid types, all labelling was more common among nicotine salt compared to freebase products (Table 2): indication that the product contained nicotine (all products: χFootnote 22 = 600.4, p < 0.001; > 0% nicotine-containing only: χFootnote 22 = 308.0, p < 0.001), nicotine content (all products: χFootnote 22 = 253.8, p < 0.001; > 0% nicotine-containing only: χFootnote 22 = 188.4, p < 0.001), health warning (all products: χFootnote 22 = 773.9, p < 0.001; > 0% nicotine-containing only: χFootnote 22 = 499.8, p < 0.001).
| E-liquid products | Visible on e-liquid packaging | ||
|---|---|---|---|
| Indication of the presence of nicotine % (n) | Nicotine concentration % (n) | Health warnings % (n) | |
| All e-liquids (n = 1746) | 63.2 (1103) | 73.7 (1284) | 58.9 (1025) |
| Salt (n = 814) | 76.5 (623) | 81.4 (663) | 74.2 (604) |
| Freebase (n = 929) | 51.3 (477) | 66.5 (618) | 45.0 (418) |
| Hybrid (n = 3) | 100.0 (3) | 100.0 (3) | 100.0 (3) |
| E-liquids containing nicotine only (> 0% nicotine, n = 4049)Footnote a | 66.0 (2674) | 74.4 (3014) | 60.9 (2464) |
| Salt (n = 2013) | 79.0 (1590) | 83.8 (1686) | 77.9 (1568) |
| Freebase (n = 2027) | 53.0 (1075) | 65.1 (1319) | 43.8 (887) |
| Hybrid (n = 9) | 100.0 (9) | 100.0 (9) | 100.0 (9) |
|
|||
E-liquid products were available in a variety of different flavours, with the three most common categories being fruit (43.6%), candy/desserts (27.6%) and nonalcoholic drinks (12.5%; Figure 2). The mean nicotine concentration differed between flavour categories (all products: F10 192.84 = 7.1, p < 0.001; > 0% nicotine only: F10 168.8 = 6.6, p < 0.001) such that flavours in the category “other” had the highest mean nicotine concentration, more than candy or coffee, while menthol/mint was higher than candy or tobacco, and fruit was higher than tobacco or candy (all p < 0.05; Table 3).
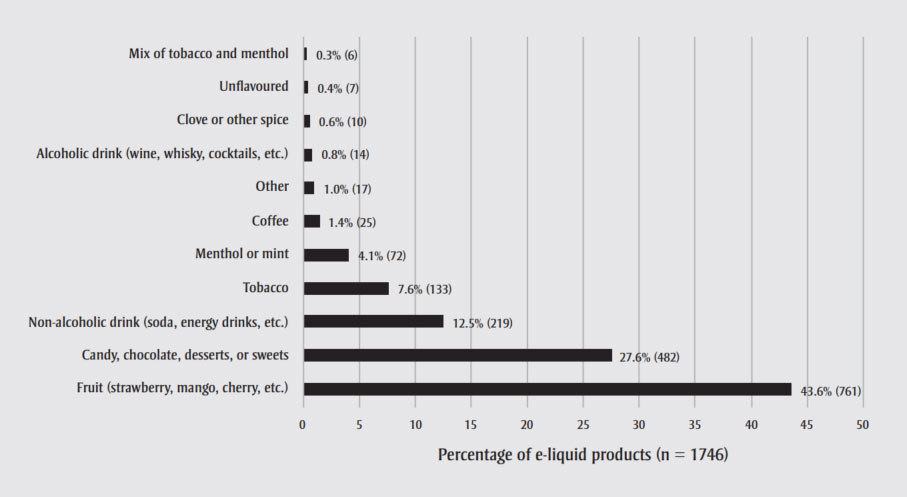
Figure 2 - Text description
| Flavour category | Percentage of e-liquid products (n=1746) |
|---|---|
| Fruit (strawberry, mango, cherry, etc.) | 43.6% (761) |
| Candy, chocolate, desserts, or sweets | 27.6% (482) |
| Non-alcoholic drink (soda, energy drinks, etc.) | 12.5% (219) |
| Tobacco | 7.6% (133) |
| Menthol or mint | 4.1% (72) |
| Coffee | 1.4% (25) |
| Other | 1.0% (17) |
| Alcoholic drink (wine, whisky, cocktails, etc.) | 0.8% (14) |
| Clove or other spice | 0.6% (10) |
| Unflavoured | 0.4% (7) |
| Mix of tobacco and menthol | 0.3% (6) |
| Flavour category | Nicotine % continuous | Nicotine concentration % categories | ||||
|---|---|---|---|---|---|---|
| All e-liquids (n = 4790) (SD) | E-liquids containing nicotine only (n = 4049) (SD) | 0% (n) | 0.1%–2.0% (n) | 2.1%–5.0% (n) | > 5.0% (n) | |
| OtherFootnote aFootnote b | 2.7 (2.0) | 3.0 (1.9) | 8.8 (3) | 41.2 (14) | 41.2 (14) | 8.8 (3) |
| Menthol or mintFootnote cFootnote d | 2.0 (1.8) | 2.3 (1.7) | 12.2 (24) | 53.3 (105) | 32.5 (64) | 2.0 (4) |
| Fruit (strawberry, mango, cherry, etc.)Footnote eFootnote f | 1.8 (1.8) | 2.2 (1.8) | 14.8 (305) | 50.8 (1050) | 32.7 (677) | 1.7 (36) |
| Alcoholic drink (wine, whisky, cocktails, etc.) | 1.8 (1.9) | 2.2 (1.9) | 18.2 (6) | 45.5 (15) | 33.3 (11) | 3.0 (1) |
| Mix of tobacco and menthol | 1.6 (1.3) | 1.7 (1.3) | 5.3 (1) | 68.4 (13) | 26.3 (5) | 0 (0) |
| Clove or other spice | 1.7 (1.5) | 2.0 (1.5) | 12.5 (4) | 59.4 (19) | 28.1 (9) | 0 (0) |
| Nonalcoholic drink (soda, energy drinks, etc.) | 1.6 (1.7) | 2.0 (1.7) | 16.2 (104) | 55.8 (359) | 27.5 (177) | 0.5 (3) |
| TobaccoFootnote dFootnote e | 1.6 (1.5) | 1.8 (1.5) | 14.1 (60) | 63.5 (271) | 22.3 (95) | 0.2 (1) |
| Candy, chocolate, desserts or sweetsFootnote aFootnote cFootnote f | 1.4 (1.7) | 1.7 (1.7) | 17.5 (215) | 56.7 (698) | 25.2 (311) | 0.7 (8) |
| Unflavoured | 1.8 (1.4) | 1.6 (1.4) | 15.4 (4) | 69.2 (18) | 15.4 (4) | 0 (0) |
| CoffeeFootnote b | 1.4 (1.4) | 1.6 (1.6) | 19.0 (15) | 63.3 (50) | 16.5 (13) | 1.3 (1) |
| Total | 1.7 (1.7) | 2.0 (1.7) | 15.5 (741) | 54.5 (2612) | 28.8 (1380) | 1.2 (57) |
Abbreviation: SD, standard deviation.
|
||||||
Discussion
In 2020, e-liquids were available in a wide variety of nicotine concentrations and flavours, demonstrating the diversity of the vaping product market in Canada. There were three key findings from this study, discussed in turn below.
First, the e-liquids available on the market were evenly split between salt-base and freebase products, although nicotine concentration was higher and more variable among the salt-base products. In contrast to the salt-base products, which had nicotine concentrations between 0.3% and 6.5%, all freebase products identified in our study had nicotine concentrations at or below 2% (20 mg/mL).Footnote 35 This is consistent with the theory that salt-base formulations are critical for enhancing the palatability of higher nicotine concentrates.Footnote 35 As of 2020, it was estimated that approximately 30% of all e-liquids in Canada contained freebase nicotine, compared with 70% containing salt-base nicotine; virtually all of the latter contained more than 20 mg/mL.Footnote 36 Products without nicotine are rare: for example, one report in 2019 suggested that less than 1% of sales of vaping products at gas and convenience stores in the US were for non–nicotine containing products.Footnote 2 Our Canadian data are also consistent with the shift toward higher-nicotine salt-base products seen in the US market.Footnote 37
Interestingly, three products were labelled as hybrid e-liquids, with both salt-base and freebase nicotine. Some consumer blogs and social media indicate that some consumers have been mixing salt-base and freebase nicotine e-liquids to achieve their desired sensory effects; however, hybrid products remain rare and have received little attention in the published literature.
Second, this study found that nicotine labelling and health warnings were not always visible on the packaging on retailers’ online images. Slightly more than half of the e-liquid product images available on the websites displayed an indication of the presence of nicotine, nicotine concentration and health warnings. This contrasts with very few e-cigarette products containing health warnings in 2014.Footnote 29 Salt-base nicotine products were more likely to include labelling of nicotine and health warnings compared to freebase products, although comparisons must be interpreted with caution given that not all packaging was visible for data collection. In July 2020 (during this study), federal legislation in Canada mandated exterior packaging labels displaying nicotine concentration and health warnings on vaping products.Footnote 32Footnote 38 Given that many consumers purchase vaping products through online retailers,Footnote 33 clear and consistent labelling practices including labelling displays online are important to ensure that consumers have adequate information at the point of purchase.
Third, this study identified a wide ride range of e-liquid flavours on the Canadian market. The most common flavour category was fruit, consistent with survey data suggesting that fruit is the most popular flavour among both youth and adult vapers,Footnote 4Footnote 5Footnote 19-21 Despite this, “other” flavours had the highest nicotine concentrations. Data suggest an expansion in the availability of flavours since 2014, when the only flavour categories identified were fruit, candy/desserts, drinks and tobacco,Footnote 29 compared with the 11 flavour categories identified in this 2020 scan. In the US and England, the availability and liking of e-liquid flavours have been a primary reason for e-cigarette use among youth,Footnote 7Footnote 16Footnote 39 although flavours can also help adult smokers to quit smoking.Footnote 17Footnote 18 An increasing number of Canadian provinces are restricting e-liquid flavours, including Nova Scotia and Prince Edward Island;Footnote 14 however, the impact of flavour restrictions on vaping among both adult smokers and youth remains unclear.
The e-cigarette market continues to evolve, and new provincial restrictions have come into force since completion of this study. For example, Nova Scotia has banned the sale of all nontobacco flavours, British Columbia has restricted the sale of nontobacco flavours in stores that permit minors, and similar restrictions have been implemented in Ontario for nontobacco and nonmenthol flavours.Footnote 14 Future studies should examine how the industry adapts its products to comply with these restrictions, as well as the impact on consumer patterns of use.
Strengths and limitations
This study has important strengths. We provide the most comprehensive online scan of the e-cigarette market in Canada to date, considering 25 popular e-cigarette brands and using two large national retailers as well as five provincial vape stores and manufacturer websites. Data were collected online, where many consumers purchase their vaping products, thus enhancing ecological validity. The interrater reliability of the coding protocol was also high.
However, our findings must be considered in the light of several limitations. First, data collection was limited to products accessible through online retailers (including manufacturers), and so the results may not generalize to the broader Canadian market (e.g. brick-and-mortar stores). However, our findings align with national estimates of sales data on attributes such as flavour profile and nicotine concentration.Footnote 2Footnote 3 Second, data were restricted to the information available from websites and product images and, in some cases, only a partial view of the e-liquid’s packaging was available. Many e-liquids are sold with additional exterior packaging that may have included details relevant to the study, but were not shown on the website. Thus, we are unable to establish the extent to which e-liquids complied with regulations. Third, nicotine concentrations expressed in mg/mL were assumed to be equivalent to nicotine concentrations expressed as percentages (e.g. 20 mg/mL = 2.0%). However, in practice, these numbers are not always equivalent; for example, JUUL’s leading formulation of 59 mg/mL is labelled as 5.0% nicotine. Fourth, reliability checks were only performed on 10% of the data.
Conclusion
Our findings demonstrate the diversity of e-liquids available in the Canadian market including the availability of higher-concentration salt-base nicotine products. Findings also suggest that regulations restricting flavours will restrict the vast majority of products sold online in Canada, while Health Canada’s proposed restrictions limiting nicotine concentrations to 20 mg/mL or less would predominantly restrict salt-based e-liquids. Future research should evaluate the impact of these restrictions on the product market as well as patterns of consumer use.
Acknowledgements
Thanks are given to Chris Hammond, Daniel Hong and Madison Leggatt for their assistance with data collection and extraction.
Conflicts of interest
DH has served as a paid expert witness in legal challenges against tobacco and vaping companies. All other authors have no conflicts of interest to declare.
Authors’ contributions and statement
KDM: analysis and interpretation of the data; drafting and revising the paper; approval of the final manuscript for submission.
DH: design; conceptualization; acquisition, analysis and interpretation of the data; drafting and revising the paper; approval of the final manuscript for submission.
SM: acquisition of the data; revising the paper; approval of the final manuscript for submission.
DW: acquisition of the data; revising the paper; approval of the final manuscript for submission.
KE: acquisition, analysis and interpretation of the data; drafting and revising the paper; approval of the final manuscript for submission.
The content and views expressed in this article are those of the authors and do not necessarily reflect those of the Government of Canada.