
Original quantitative research – An evaluation of the amount, type, and use of shade at public playgrounds in Guelph, Ontario, Canada

HPCDP Journal Home
Published by: The Public Health Agency of Canada
Date published: May 2022
ISSN: 2368-738X
Submit a manuscript
About HPCDP
Browse
Previous | Table of Contents | Next
Andrea Cimino, MSc; Jennifer E. McWhirter, PhD; Andrew Papadopoulos, PhD
https://doi.org/10.24095/hpcdp.42.5.04
This article has been peer reviewed.
Author references
Department of Population Medicine, University of Guelph, Guelph, Ontario, Canada
Correspondence
Jennifer E. McWhirter, Department of Population Medicine, University of Guelph, 50 Stone Road E., Guelph, ON N1G 2W1; Telephone: 519-824-4120 ext. 58951; Email: j.mcwhirter@uoguelph.ca
Suggested citation
Cimino A, McWhirter JE, Papadopoulos A. An evaluation of the amount, type and use of shade at public playgrounds in Guelph, Ontario, Canada. Health Promot Chronic Dis Prev Can. 2022;42(5):209-17. https://doi.org/10.24095/hpcdp.42.5.04
Abstract
Introduction: The provision of shade at outdoor recreation sites such as playgrounds confers a variety of public health benefits. It can prevent overexposure to solar ultraviolet radiation, and, in turn, protect against skin cancer. Further, shade mitigates heat and may promote physical activity. In this study, we evaluate and describe the amount, type and use of shade at public playgrounds.
Methods: Using a modified shade audit tool, shade audits were conducted to visually evaluate shade coverage at 85 city-operated playgrounds in Guelph, Ontario, Canada, in summer 2019.
Results: The main play area of most playgrounds (68%) had no shade available. Although the areas surrounding playgrounds had more shade coverage than the main play areas, we also found minimal shade coverage (> 0% to 30%) in this area for many playgrounds (48%). All shade over main play areas was provided by trees (i.e. natural shade). Permanent, built shade structures were observed in the surrounding area of 13% of playgrounds. Shade coverage in the areas surrounding playgrounds was positively correlated with the number of individuals (rs = 0.259; p = 0.017), children (rs = 0.270; p = 0.012), and active individuals (rs = 0.253; p = 0.020) using the surrounding area. This suggests that individuals seek shade at playgrounds and may be more active in shaded areas.
Conclusion: Children have limited protective shade available to them at playgrounds. Future research is needed to determine how to best increase shade provision and to further explore the impact it has on playground usage, activity levels, temperature and UVR exposure.
Keywords: public health, environmental health, child health, prevention and control, play and playthings, health equity
Highlights
- Most playgrounds in our study offered little to no shade; when present, shade was provided mainly by trees.
- More individuals were observed using the main play areas of playgrounds relative to surrounding areas, even though these areas had significantly less shade.
- Shade coverage in the surrounding areas of playgrounds was positively correlated with the number of individuals using these areas.
- Poorer neighbourhoods had fewer playgrounds, but no association between shade coverage and neighbourhood socioeconomic status of playgrounds was observed.
Introduction
Shade at outdoor spaces imparts a variety of public health benefits. In particular, shaded environments expose people to less ultraviolet radiation (UVR) than sunny ones.Footnote 1 This is important, considering UVR from the sun is recognized as one of the major causes of skin cancer.Footnote 2 Skin cancer represents a significant public health concern in Canada; it is the most common form of cancer among Canadians, and incidence rates for melanoma, the deadliest form of skin cancer, have increased significantly over the past several years.Footnote 3 Children are especially vulnerable to the damaging effects of UVR.Footnote 4Footnote 5 Sun safety messages recommend that individuals seek shade as a way to protect themselves.Footnote 6 To encourage shade-seeking behaviours, modifications can be made to physical environments; thus, the provision of shade is an important environmental cancer prevention strategy.Footnote 7 Modifying environments to include more shade makes sun safe behaviours more accessible to all community members and contributes to the creation of more socially sustainable environments.Footnote 8
Shade also plays a role in promoting physical activity. Researchers in Australia have observed a positive association between adolescent girls’ moderate to vigorous physical activity levels and the presence of trees providing shade.Footnote 9 Relatedly, research from the United States and Australia indicates that as the provision of shade at public parks increases, so does the likelihood of people using those shaded areas.Footnote 10 This is noteworthy, considering parks can be an essential area for people to engage in outdoor play.Footnote 11 Trees, which provide natural shade, also play a role in ameliorating heat in urban areas,Footnote 12 improving thermal comfort and the safety of outdoor activities. As an added benefit, exposure to trees and greenery can positively impact mental health by lowering the odds of psychological distress.Footnote 13
Public playgrounds are a key area for shade provision due to the potential in these places for adults and children to spend significant amounts of time in the sun. The desirability of shade as refuge from the sun at playgrounds has been made evident in previous research. For example, parents have expressed a desire for shade at playgrounds and report avoiding playgrounds with their children at certain times of the day if shade is unavailable.Footnote 14 Further, Canadian research shows that both adults and children seek and use shade when spending time in the sun.Footnote 15Footnote 16
Despite the desirability and benefits of shade, research evaluating shade available at public playgrounds is limited. The available studies in this area have noted that shade coverage at these playgrounds is typically low.Footnote 17Footnote 18Footnote 19Footnote 20Footnote 21 For example, in one study from New Zealand, mean shade coverage of playground areas was 11%;Footnote 18 in another from Australia, mean shade coverage was 37%.Footnote 17 Thus, in both studies, the majority of playground areas were unshaded. A study conducted in Germany found that on average, 41% of the total playground area was in the shade, yet shade was only available in 22% of the main play areas.Footnote 21 This suggests that children are exposed to more sun while using play equipment than their parents or caregivers, who may be spectating on the side.Footnote 21 Some studies also suggest that playgrounds in areas of lower socioeconomic status (SES) are less likely to have shade,Footnote 17Footnote 20 highlighting shade as an important health equity concern.
There are currently no published studies evaluating shade coverage at public playgrounds in Canada. Given the protective health benefits of shade, including those for children, it is important to address this research gap. Our study objectives were: (1) to estimate and describe the extent and type of shade available at publicly accessible, city-operated playgrounds in Guelph, Ontario, Canada, via shade audits; (2) to determine whether shade coverage is significantly different across playground activity areas (i.e. main play area vs. surrounding area); and (3) to investigate potential correlates of shade coverage, including neighbourhood SES of playgrounds and the number and activity level of playground users. It is important to evaluate the provision of shade at outdoor spaces in order to determine if more is needed and to help inform future shade planning and design for outdoor public spaces.
Methods
Selection of playground sites
Guelph is a city of approximately 135 000 people located in the southwest portion of Ontario, situated about 100 km west of Toronto. There are approximately 3 million trees in Guelph, constituting an urban canopy coverage of 23.3%.Footnote 22 The City of Guelph website maintains a list of playgrounds (n = 87) located within city limits. After removing duplicates from this list (n = 2), we identified 85 playground sites to be included in the shade audit study. Playgrounds were defined as areas within a park space containing play equipment. All playgrounds were publicly available and free to use.
Shade audit procedure
The primary researcher (AC) visited all 85 City of Guelph playgrounds in July 2019. These visits took place on mostly sunny days, between the hours of 11 a.m. and 3 p.m., when UVR is highest.Footnote 23 AC used a previously described shade audit tool,Footnote 24 modified to fit the objectives of this study, to visually observe the amount and type of shade available at each playground. Shade audit tools are designed to assess the amount of existing shade at outdoor spaces.Footnote 24Footnote 25 Conducting visual shade audits for this purpose is well-established in the literature.Footnote 17Footnote 18Footnote 26Footnote 27
Playgrounds were divided into two areas for assessment: the main play area, where the play equipment was found, and the surrounding area, which was defined as 10 m from the edge of the play area. AC visually estimated the percentage of each area that was covered by shade. Estimates were in 10% intervals and ranged from 0% to 100%. Shade coverage for each playground area (i.e. main play area and surrounding area) was also categorized as none (0%), minimal (> 0% to 30%), some (> 30% to 50%), most (> 50% to < 100%), or complete (100%). For the main play area, AC also noted which playground areas were covered by shade, including open space, main play equipment and stand-alone equipment pieces.
To validate AC’s shade coverage estimates and subsequent categorization of shade (i.e. none, minimal, some, most or complete), a research assistant accompanied AC to 10 playgrounds, where each estimated shade coverage independently. These 10 playgrounds were selected because they offered significant shade, and thus presented an opportunity to assess validity. Playgrounds with no shade coverage were not eligible because full agreement was expected.
When estimating the amount of shade coverage in 10% intervals, researchers were in agreement for 60% of playground areas (n = 12 of 20). Interrater reliability of these estimates was assessed by calculating Cohen’s kappa (κ), revealing a moderate agreement between the two researchers (κ = 0.552; 95% confidence interval [CI]: 0.313–0.791; p < 0.001). When categorizing shade coverage, researchers were in agreement for 85% of playground areas (n = 17 of 20), with Cohen’s kappa revealing substantial agreement between the researchers (κ = 0.792; 95% CI: 0.574–1.010; p < 0.001). For all discrepancies, estimates were within 10% (for 10% interval estimates) or one category (for shade categorization). After discussing these discrepancies, researchers reached 100% agreement for all shade coverage estimates and categorizations.
Shade type was classified as natural (i.e. shade provided by trees or vegetation), built (i.e. shade provided by roofed structures or shade sails or shadows from nearby buildings), or portable (i.e. shade provided by personal umbrellas). For natural shade, the density of the tree foliage was classified as heavy or medium based on a canopy density guide by Greenwood et al.Footnote 25 Based on this guide, trees classified as having light canopy were excluded because these trees do not adequately block UVR and, as such, are not recommended as a means of sun protection.Footnote 25
Using height as a guide, trees were further classified as being new or mature. The composition of built shade structures was classified as wood, metal, fabric, plastic, glass or other. Consistent with prior research,Footnote 18 natural shade that was less than 2 m wide or further than 10 m from the edge of the play area was excluded. Built shade structures that exceeded the 10 m boundary but offered a clear view of the playground were included because it is possible they would be used by those visiting the playground. Natural and built shade features considered unusable (i.e. playground not readily visible while in use) were excluded.
To assess UV reflectance, AC recorded the ground surface material (e.g. woodchips, pea gravel, grass) of the main play area and surrounding area, excluding the surface of pathways in the surrounding that did not enclose the entire play area. Playground use was evaluated by AC upon arrival to each playground (for total number of users) and before auditing each playground area (for the number of users stratified by playground area). AC counted the total number of people (adults and children combined), adults, and children present, along with their activity level (i.e. active or sedentary). We consider the number of playground users an estimate because individuals were moving and may have entered or left while AC counted. Active individuals were those who were standing, walking, playing or climbing in the playground areas, while sedentary individuals were those in seated positions. Ethics approval was not required because the research took place in a public setting, we only collected generic count information and no staged interaction between AC and playground users occurred.
Additional variables collected were start and finish times of shade audits, temperature, weather, UV index and the SES classification of the playground’s surrounding neighbourhood. Temperature and UV index values were obtained from The Weather Channel website and recorded at the beginning of each shade audit. SES information was extracted from previous research that calculated SES classification levels (low, low-medium, medium, medium-high, high) for Guelph census tracts (CTs) using principal component analysis on 11 variables representing income, family structure, unemployment rate, education, home value, monthly rent and occupation, obtained from 2011 Census Profile, 2011 National Household Survey Profile, and 2011 tax filer datasets.Footnote 28 We plotted playgrounds to their CT and recorded their SES classification level according to the SES level of the CT in which they were located.Footnote 28
Statistical analysis
Data were initially recorded on paper forms onsite, then entered into Excel version 16.28 (Microsoft Corp., Redmond, WA, USA) offsite. All analyses were conducted using SPSS Statistics version 26 (IBM Corp., Armonk, NY, USA). Basic descriptive analyses were performed to describe the extent and type of shade available at playgrounds, along with the number of people using the playgrounds. The Wilcoxon signed-rank test was used to determine if shade coverage was significantly different across playground areas (i.e. main play area vs. surrounding area). The Wilcoxon signed-rank test, which accounts for paired data, was necessary because two shade coverage estimates were recorded at each playground. To test for variables correlated with shade coverage, Spearman rank correlation coefficients were calculated, as the data were not normally distributed. Variables of interest included playground and activity areas, SES classification levels and the estimated number and activity level of playground users.
Results
Shade audits took an average of 16 minutes to complete per park. Average temperature during shade audits was 24.9°C and median temperature was 24.0°C. Average “feels like” temperature (i.e. taking into account air temperature, relative humidity and wind speed) during shade audits was 25.3°C and median “feels like” temperature was 24.0°C. Just over half of shade audits were conducted on clear, sunny days (n = 44/85, 52%), some were conducted on days that were considered mostly sunny (n = 20/85, 24%) and others were conducted on days with a mix of sun and clouds (n = 21/85, 25%). No audits were conducted on overcast or rainy days. The mean UV index value during shade audits was 7.56 and the median UV index value was 8, though values ranged from 5 to 9.
Guelph neighbourhood SES classification was as follows: seven low SES areas, four low-medium SES areas, five medium SES areas, eight medium-high SES areas and three high SES areas.Footnote 28 Neighbourhoods located in medium-high SES areas had the greatest number of playgrounds (n = 21/85, 25%), followed by medium SES areas with 20/85 playgrounds (24%), high SES areas with 17/85 playgrounds (20%), low-medium SES areas with 14/85 playgrounds (16%), and low SES areas with 13/85 playgrounds (15%).
Park use
Data in Table 1 describe how playgrounds were being used at the time of the audit. In total, 370 individuals were counted using playgrounds; 42 playgrounds had no one present. The main play areas had an average of 2.45 children and 0.61 adults present per playground, with most of these individuals being active (n = 249/260, 96%). The area surrounding the play area had an average of 0.86 children and 0.73 adults per playground, with most of these individuals being sedentary (n = 84/100, 84%).
| Playground users present | Total playground areaFootnote b (N = 370 people)Footnote c |
Main play area (N = 260)Footnote c |
Surrounding area (N = 135)Footnote c |
|||||||||
|---|---|---|---|---|---|---|---|---|---|---|---|---|
| Median | Mean | SD | Min, Max | Median | Mean | SD | Min, Max | Median | Mean | SD | Min, Max | |
| Total individuals | 1 | 4.35 | 9.98 | 0, 65 | 0 | 3.06 | 7.90 | 0, 50 | 0 | 1.59 | 4.28 | 0, 35 |
| Adults | 0 | 1.32 | 3.09 | 0, 25 | 0 | 0.61 | 1.48 | 0, 10 | 0 | 0.73 | 1.84 | 0, 15 |
| Children | 0 | 3.05 | 7.39 | 0, 48 | 0 | 2.45 | 6.61 | 0, 40 | 0 | 0.86 | 2.60 | 0, 20 |
Abbreviations: Max, maximum number of playground users at any one playground; Min, minimum number of playground users at any one playground; SD, standard deviation.
|
||||||||||||
| Activity level of playground users | Main play area (N = 260)Footnote c % (n/N) |
Surrounding area (N = 135)Footnote c % (n/N)Footnote d |
|---|---|---|
| Active | 96 (249/260) | 16 (16/100) |
| Sedentary | 4 (11/260) | 84 (84/100) |
|
||
Shade coverage
The main play area of most playgrounds (n = 58/85, 68%) had no shade coverage, rendering them completely exposed to the sun (Table 2). Nearly one-quarter of playgrounds (n = 21/85, 25%) had minimal shade coverage (> 0% to 30%) over the main play area, a few (n = 5/85, 6%) had some shade coverage (> 30% to 50%) and only one play area (n = 1/85, 1%) was mostly covered by shade (> 50% to < 100%). No playground areas had complete shade coverage.
| Playground characteristic | Main play area % (n/N)Footnote b |
Surrounding area % (n/N)Footnote b |
|---|---|---|
| Extent of shade coverage | ||
| None (0%) | 68 (58/85) | 1 (1/85) |
| Minimal (> 0% to 30%) | 25 (21/85) | 48 (41/85) |
| Some (> 30% to 50%) | 6 (5/85) | 31 (26/85) |
| Most (> 50% to < 100%) | 1 (1/85) | 20 (17/85) |
| All (100%) | 0 (0/85) | 0 (0/85) |
| Type of shade observed | ||
| Natural shade | 32 (27/85) | 96 (82/85) |
| Heavy density | 80 (63/79)Footnote c | 82 (530/648)Footnote c |
| Medium density | 20 (16/79)Footnote c | 18 (118/648)Footnote c |
| New trees | 0 (0/81)Footnote c | 14 (92/649)Footnote c |
| Mature trees | 100 (81/81)Footnote c | 86 (557/649)Footnote c |
| Permanent built shade | 0 (0) | 13 (11/85) |
| Metal | 0 (0) | 73 (8/11) |
| OtherFootnote d | 0 (0) | 27 (3/11) |
| Portable shade | 0 (0) | 0 (0) |
| Ground surface | ||
| Woodchips | 71 (60/85) | 0 (0/85) |
| Sand | 20 (17/85) | 0 (0/85) |
| Pea gravel | 6 (5/85) | 0 (0/85) |
| Rubber | 2 (2/85) | 0 (0/85) |
| Woodchips and rubber | 1 (1/85) | 0 (0/85) |
| Grass | 0 (0/85) | 44 (37/85) |
| Grass and cement | 0 (0/85) | 29 (25/85) |
| Grass and gravel | 0 (0/85) | 2 (2/85) |
| Grass and asphalt | 0 (0/85) | 6 (5/85) |
| Grass, cement and gravel | 0 (0/85) | 1 (1/85) |
| Grass, cement and asphalt | 0 (0/85) | 18 (15/85) |
|
||
In contrast, shade coverage was more prevalent in the area surrounding the main play area: 48% (n = 41/85) of playgrounds had minimal shade coverage (> 0% to 30%) over this area, 31% (n = 26/85) had some shade coverage (> 30% to 50%), 20% (n = 17/85) were mostly covered by shade (> 50% to < 100%), and only 1% (n = 1/85) had no shade. A well shaded playground is shown in Figure 1; a poorly shaded playground is shown in Figure 2. The Wilcoxon signed-rank test indicated that the shade coverage of areas surrounding playgrounds was statistically significantly greater than the shade coverage of main play areas (z = −7.806, p < 0.001; Figure 3).
Figure 1 - Text description
This figure is a photo showing that on a sunny day, the play structure and swing set are covered by shade coming from large trees near the play area.
Photo credit: Andrea Cimino.
Figure 2 - Text description
This figure is a photo showing that on a sunny day, the sun beats down on the entire play area, including the play structures. The only shade is under the play structures, due to the components of the structure itself. There are no trees around, therefore no opportunity for shade.
Photo credit: Andrea Cimino.
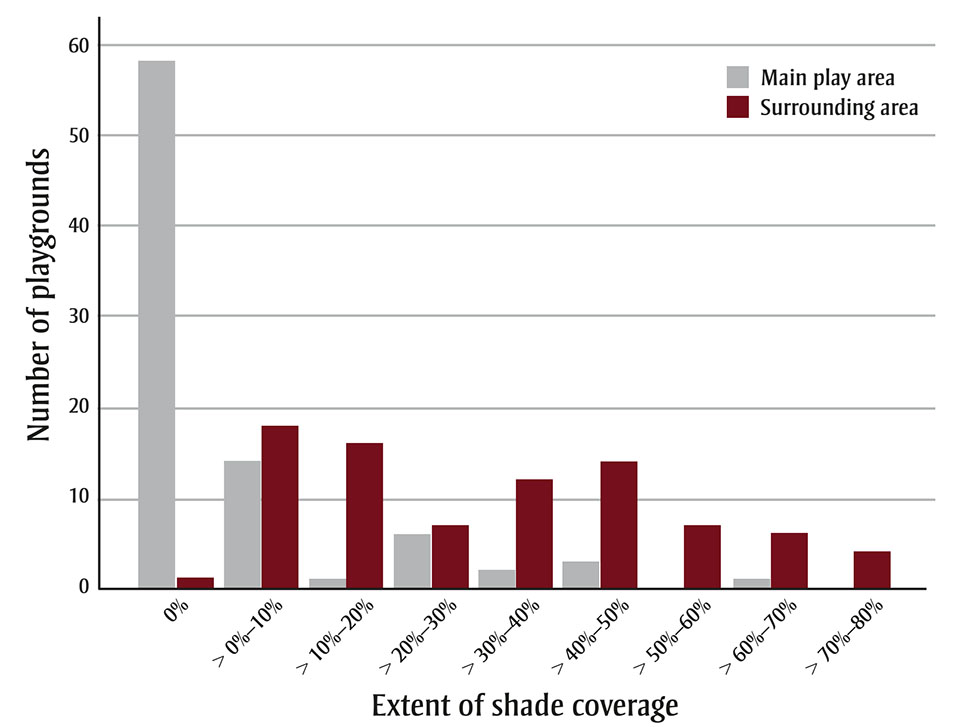
Figure 3 - Text description
| Extent of shade coverage | Number of playgrounds | |
|---|---|---|
| Main play area | Surrounding area | |
| 0% | 58/85 | 1/85 |
| > 0%–10% | 14/85 | 18/85 |
| > 10%–20% | 1/85 | 16/85 |
| > 20%–30% | 6/85 | 7/85 |
| > 30%–40% | 2/85 | 12/85 |
| > 40%–50% | 3/85 | 14/85 |
| > 50%–60% | 0/85 | 7/85 |
| > 60%–70% | 1/85 | 6/85 |
| > 70%–80% | 0/85 | 4/85 |
- Footnote a
-
Playgrounds were divided into two distinct areas: the main play area, where the play equipment was found, and the surrounding area, defined as 10 m from the edge of the play area.
Shade type
Shade over the main play area of playgrounds was provided solely by natural shade (Table 2). This shade covered the open space at 24% (n = 20/82) of play areas, stand-alone equipment pieces at 13% (n = 11/82) of play areas, the main play equipment at 11% (n = 9/82) of play areas, swings at 6% (n = 5/82) of play areas, and the sandbox at 1% (n = 1/82) of play areas. There were no permanent built shade structures (e.g. shade sails) providing shade over the main play area of playgrounds, though 49% (n = 42/85) of playgrounds had small roof-like structures on play equipment. In areas surrounding playgrounds, natural shade was also very common, with 96% (n = 82/85) of playgrounds having this type of shade. Permanent built structures were observed in the surrounding area at 13% of playgrounds (n = 11/85). No playground users were observed using portable shade.
Correlation analyses
Shade coverage over the main play areas and shade coverage over the surrounding areas were positively correlated (rs = 0.681, p < 0.001; Table 3). Coverage over the surrounding area of playgrounds was positively correlated with the number of people using the surrounding area (rs = 0.259, p = 0.017), the number of children using the surrounding areas (rs = 0.270, p = 0.012) and the number of active people in the surrounding areas (rs = 0.253, p = 0.020). No significant correlations were observed between shade coverage of playground areas and neighbourhood SES.
| Element | Shade covering main play areaFootnote a | Shade covering surrounding areaFootnote a | ||
|---|---|---|---|---|
| rs | p-value | rs | p-value | |
| Playground area | ||||
| Shade covering main play area | 1.000 | N/A | 0.681Footnote ** | < 0.001 |
| Shade covering surrounding area | 0.681Footnote ** | < 0.001 | 1.000 | N/A |
| Shade covering equipment in main play area | 0.824Footnote ** | < 0.001 | 0.552Footnote ** | < 0.001 |
| Shade covering open space in main play area | 0.860Footnote ** | < 0.001 | 0.618Footnote ** | < 0.001 |
| Neighbourhood characteristics | ||||
| Socioeconomic status classification level | −0.201 | 0.065 | −0.197 | 0.071 |
| Playground users present | ||||
| Users in main play area | ||||
| Number of individuals | −0.178 | 0.104 | −0.026 | 0.816 |
| Number of adults | −0.074 | 0.502 | 0.020 | 0.857 |
| Number of children | −0.172 | 0.114 | −0.018 | 0.870 |
| Users in surrounding area | ||||
| Number of individuals | 0.151 | 0.167 | 0.259Footnote * | 0.017 |
| Number of adults | 0.184 | 0.092 | 0.210 | 0.054 |
| Number of children | 0.162 | 0.138 | 0.270Footnote * | 0.012 |
| Activity levels of playground users | ||||
| Activity of users in main play area | ||||
| Number of active individuals | −0.173 | 0.114 | −0.014 | 0.899 |
| Number of sedentary individuals | −0.032 | 0.771 | 0.010 | 0.928 |
| Activity of users in surrounding area | ||||
| Number of active individuals | 0.191 | 0.082 | 0.253Footnote * | 0.020 |
| Number of sedentary individuals | 0.103 | 0.350 | 0.199 | 0.069 |
|
||||
Discussion
Our findings indicate there is limited shade available at most playgrounds in Guelph. Consistent with previous research,Footnote 17Footnote 18Footnote 19Footnote 20Footnote 21Footnote 27 we found that most playground areas had limited to no shade, meaning individuals using these areas were exposed to high levels of direct sunlight and therefore solar UVR. To take advantage of the numerous community-wide health benefits of shade, environments must be designed with adequate amounts of shade. Future research into why shade coverage at playgrounds is low is needed to develop an evidence base upon which effective solutions can be built.
Our finding that the main play areas of playgrounds, where children are more likely to play, had significantly less shade than the areas surrounding playgrounds, where one might spectate, sit or eat, is consistent with previous research.Footnote 17Footnote 18Footnote 20Footnote 21 For example, the areas surrounding the main play areas of German playgrounds had about twice as much shade as playground equipment areas.Footnote 21 Furthermore, we found that the ground surface of the main play areas was most commonly woodchips or sand, which reflect more UVR than grass,Footnote 29 thereby increasing UVR exposure in already unshaded areas. Children’s skin is particularly vulnerable to solar UVR,Footnote 4 so these findings are especially concerning. Ensuring adequate shade and minimizing reflected UVR in areas where children are most expected to play are important elements in the design and redesign of parks.
Though shade was lacking over the main play areas of playgrounds, children observed during our shade audits continued to use these areas. We also found a significant positive correlation between shade coverage in the surrounding areas of playgrounds and the number of children observed using those areas. Together, this suggests that though children readily play in unshaded areas exposed to direct sunlight, they may seek refuge from the sun by migrating to areas with more shade. In studies where the provision of shade was increased via built shade structures, adults and adolescents tended to use rather than avoid newly shaded areas.Footnote 10Footnote 30 Indeed, shade at playgrounds is an attractive feature to many parents.Footnote 14 Thus, increasing the provision of shade at playgrounds may encourage more people to use them.
Playgrounds are important for physical activity. We found a significant positive association between shade coverage in the surrounding areas of playgrounds and the number of active people, suggesting shade supports physical activity. Results from previous research have been mixed. In one study, the presence of trees providing shade to public open spaces was positively associated with girls’ moderate to vigorous physical activity levels.Footnote 9 However, another study found more sedentary people in park areas with more shade.Footnote 31 These studies are not entirely comparable, and neither investigated the effect of shade location or type. Regardless, children view trees and vegetation surrounding playgrounds as an extension of the play equipment.Footnote 32 Trees can help to facilitate physical activity at playgrounds, and as they grow yield increased natural shade. Future research should further explore the relationship between shade at playgrounds and physical activity, taking into account shade type and location.Footnote 31
To increase shade coverage at playgrounds, two types of shade can be used: built shade structures and natural shade. In our study, natural shade was more prevalent than built shade structures, and this has been seen previously in the literature.Footnote 19Footnote 20Footnote 21 We observed shade over main play areas to be provided exclusively by natural shade, with only a small percentage of playgrounds having built shade structures in the surrounding areas. While both natural shade and built shade are useful for UVR protection, natural shade also plays a role in reducing temperatures in urban areas.Footnote 12 This can make playing outdoors on playgrounds a more comfortable experience, allowing people to use playgrounds and remain active for longer periods of time. It is important to consider the time it takes for trees to grow and mature enough to provide substantial natural shade. Policy actions targeting shade can help ensure the provision of shade at outdoor spaces is adequate not only in terms of quantity, but also quality.Footnote 33
We found no association between shade coverage and SES of playground neighbourhoods, which is consistent with research by Schneider et al.Footnote 21 Conversely, two studies have found playgrounds in lower SES areas have less shade relative to playgrounds in higher SES areasFootnote 17Footnote 20 and lower SES neighbourhoods are less likely to have trees that provide shade and other features that promote physical activity amongst children.Footnote 34 Understanding the association between shade coverage at playgrounds and the SES of neighbourhoods is important for health equity. Further research should continue examining this relationship to understand why there are mixed findings.
Strengths and limitations
This research is the first to provide evidence of the availability of shade at public playgrounds in Canada, using an Ontario city as an example. Our results shed light on the need for significant improvements to shade provision at public playgrounds.
Shade coverage estimates were somewhat subject to the judgment of the researchers, though shade audit guidelines were followed and estimates were verified by a second researcher. Future shade audit research may benefit from the use of technology (i.e. drones) to obtain a more objective measurement of shade coverage. Each playground was only visited once, making shade coverage estimates and the estimated number of playground users valid for those specific timepoints. People may have visited parks outside the time we conducted shade audits. Shade audits were not conducted on days that were perfectly comparable in terms of weather (i.e. some days were cloudier or hotter than others), though this was minimized by collecting all data within one summer month and on days that had at least some sun. We examined physical activity overall, but not for adults versus children; this should be explored in future research. Lastly, data were analyzed using correlation analyses; thus, only the degree of association between variables could be measured.
Conclusion
Most playgrounds in Guelph had little to no shade over the main play area and minimal shade over the surrounding area of playgrounds. Our findings can inform the design of both playgrounds and shade policy. Municipalities and local governments should prioritize shade to reduce UVR exposure for skin cancer prevention, promote park use for physical activity and mitigate heat for thermal comfort and safety. Focussed efforts on improving shade provision will contribute to more sustainable environments as the health benefits of shade become more accessible. More research is needed, and policy approaches should be explored, to help ensure playgrounds and other outdoor recreation sites have sufficient shade to promote health and prevent disease.
Acknowledgements
Andrea Cimino was supported by the Canadian Institutes of Health Research Canada Graduate Scholarship – Master’s Award and the Art Rouse Memorial Scholarship in Veterinary and Comparative Cancer Studies.
Conflicts of interest
The authors have no conflicts of interest to disclose.
Authors’ contributions and statement
All authors contributed to the study conception and design. AC performed the data acquisition and analysis, as well as wrote the initial draft of the manuscript with support from JM and AP. All authors commented on and revised previous versions of the manuscript. All authors read and approved the final manuscript.
The content and views expressed in this article are those of the authors and do not necessarily reflect those of the Government of Canada.