
FoodNet Canada annual report 2017
Download the entire report
(PDF format, 1.43 MB, 49 pages)
Organization: Public Health Agency of Canada
Type: Guidance
Published: November 2018
Cat.: HP37-17/1E-PDF
ISBN: 2292-8073
Pub.: 180341
Table of contents
- Foreword
- Acknowledgements
- Executive summary
- Information to the reader
- Campylobacter
- Salmonella
- Shigatoxigenic escherichia coli (STEC)
- Listeria monocytogenes
- Yersinia
- Shigella
- Parasites and viruses
- Retail sampling summary
- Public health impact
- Appendices
Foreword
The Public Health Agency of Canada’s FoodNet Canada surveillance system is pleased to present the latest annual report which outlines the results of our surveillance activities conducted in 2017.
The report highlights FoodNet Canada findings from its sentinel sites in British Columbia, Alberta and Ontario. It focuses on trends in enteric pathogen disease rates, as well as trends in the prevalence of these pathogens found on potential disease sources: retail meats, food-animal manure and water. We also highlight the impact of enteric pathogen trends on public health.
It is our hope that this report will be used to inform and shape discussions on food safety issues regarding enteric diseases and their sources.
Acknowledgements
FoodNet Canada acknowledges the significant investments made by our partners in the three sentinel sites, our provincial and federal government agency colleagues, and academic and industry collaborators who help to make this program a continued success.
Executive summary
The endemic incidence rate of campylobacteriosis in FoodNet Canada’s three sentinel sites was not significantly different from 2016 to 2017. Campylobacter was frequently detected in 2017 on retail chicken breasts, and on farm, it was found on broiler chicken, swine, turkey and feedlot beef manure. Campylobacter jejuni was the primary subtype identified in human cases, retail chicken samples, broiler chicken farms and turkey farms across all sentinel sites in the FoodNet Canada surveillance system. Among human cases, Campylobacter coli is less commonly associated with disease. Previous work to identify potential sources of campylobacteriosis by FoodNet Canada has implicated chicken meat, and to a lesser degree, contact with cattle.
Surveillance data collected in 2017 continues to show regional differences in Salmonella prevalence across all the surveillance components. Among human endemic cases, higher incidence rates of Salmonella Enteritidis (SE) infections were observed in the British Columbia (BC) and Alberta (AB) sites, while the lowest incidence rate was reported in the Ontario (ON) site. In 2017, a large increase in the proportion of chicken manure samples positive for SE was observed in the Alberta site compared with the previous year, while the human incidence and proportion of SE among chicken breast samples remained relatively the same. It was also identified that ground veal products pose little risk of salmonellosis to Canadians, as only four Salmonella Dublin isolates were recovered from the 344 samples collected across all three sentinel sites.
The ability of FoodNet Canada to contribute to the better understanding of Salmonella transmission from farm to fork increased in 2017 with the implementation of whole genome sequencing (WGS). The majority of human clusters at the national level that contained a non-clinical isolate were for SE strains. During 2017 there were two clusters containing FoodNet Canada samples of frozen raw breaded chicken products (FRBCP) which led to national recalls. This has provided evidence to address this issue with regulators and industry and to work towards reducing this burden over time.
The majority of clinical cases of Shigatoxigenic Escherichia coli (STEC) were O157 serogroup. However, less E. coli O157 was reported among clinical cases in 2017 compared to 2016, and more E. coli non-O157 was reported in 2017. Six serogroups have been prioritized with regards to human health: O26, O45, O103, O111, O121 and O145. Serogroups O26, O103 and O121 were identified among both human cases and irrigation water, representing potential environmental exposure sources. There was also overlap with subtype O157 among human isolates and feedlot beef manure and retail veal samples. Retail veal was twice as contaminated with STEC than ground beef. The majority of positive veal samples were non-O157; however, one sample was positive for serogroup O111. As well, a veal sample tested positive for E. coli O157:H7 which prompted a recall of the product.
There was a significant increase in the proportion of FRBCP testing positive for L. monocytogenes in 2017 compared with 2016. The proportion of both ground beef and veal samples testing positive for L. monocytogenes was found to be significantly higher among samples collected from independent stores compared to chain grocery stores. The proportion of ground beef samples testing positive for L. monocytogenes continues to be high in 2017, as was the case in 2016. As members of the general public may not be aware that ground beef is a high risk product for Listeria contamination, this presents an opportunity for targeted consumer education efforts, particularly towards high risk populations such as pregnant women and their unborn children, the elderly, and those who are immunocompromised.
As in the previous year, travel-acquired infections constituted the majority of Cyclospora cases in 2017. Among these travel cases, 63% reported travel to the Americas (Central, South and Caribbean) region. Mexico was the most common destination reported (80%) among these cases. All cases travelled to Mexico between May and July, with 75% of these cases reporting travel to Mexico’s east coast. Since an elevated risk of Cyclospora infection has been demonstrated in Canadian travellers returning from endemic countries, education on this topic is important to help keep Canadians safe while travelling to Cyclospora-endemic regions.
Information to the reader
FoodNet Canada is a multi-partner sentinel site surveillance system led by the Public Health Agency of Canada (PHAC) that monitors changes in enteric pathogens in Canada.
In collaboration with public health jurisdictions and provincial laboratories, FoodNet Canada conducts continuous and episodic surveillance activities in three sentinel sites collecting information across four components: human, retail (meat and produce), on-farm (farm animals), and water. Continuous surveillance occurs throughout the year to identify trends in human disease occurrence, exposure sources, and attributes illnesses to sources and settings for targeted enteric pathogens. Information on the sources of greatest risk to human health helps direct food and water safety actions and programming as well as public health interventions, and to evaluate their effectiveness. Specifically, FoodNet Canada’s core objectives are to:
- determine what food and other sources are making Canadians ill;
- determine significant risk factors for enteric illness;
- accurately track enteric disease rates and risks over time; and
- provide practical prevention information to assist local and provincial public health officials to:
- prioritize risks;
- compare interventions, direct actions and advance policy; and
- assess effectiveness of food safety activities / public health interventions and measure performance.
This report draws on knowledge from a variety of sources to present a comprehensive and meaningful interpretation of trends and issues identified through FoodNet Canada data, as well as from collaborating programs within PHAC. Examples include the Canadian Integrated Program for Antimicrobial Resistance Surveillance (CIPARS), the National Enteric Surveillance Program (NESP), the Enhanced National Listeriosis Surveillance Program, the Outbreak Management Division (OMD), and the National Microbiology Laboratory (NML). Information from these programs is used to support and enhance findings through the integration and assessment of relationships observed over time between human illness, contamination levels in retail foods, food-animal farm manure and water. Known interventions implemented within the food industry were also considered when interpreting surveillance trends.
Data collection and reporting
Each FoodNet Canada sentinel site relies on a unique partnership with the local public health authority, private laboratories, water and agri-food sectors as well as the provincial and federal institutions responsible for public health, food safety, and water safety. The sites include Ontario (Middlesex-London Health Unit), British Columbia (Fraser Health Authority) and Alberta (Calgary and Central Zones of Alberta Health Services). The Ontario (ON) site data collection began in August of 2014; however, for the purpose of yearly comparisons in this Report, data from the ON pilot sentinel site (Region of Waterloo) (2011-Mar 2014) have been included for select analyses. The British Columbia (BC) site was officially established in April 2010 and includes the communities of Burnaby, Abbotsford, and Chilliwack. The province of Alberta (AB) contains the third site and data collection began in June of 2014.
Results are reported for all three sites unless otherwise stated. Readers should be cautious when extrapolating these results to areas beyond the sentinel communities. As additional sentinel sites are established, comprehensive information from laboratory and epidemiological analyses from all sites will provide more representative national trends in enteric disease incidence and exposure sources to inform accurate estimates for all of Canada.
In 2017, the farm and retail components were implemented across all sentinel sites in ON, AB, and BC whereas the water component was only implemented in AB and BC. The non-human surveillance data collected by FoodNet Canada represents possible exposure sources for human enteric illnesses within each sentinel site. The data are meant to be interpreted aggregately and cannot to be used to directly attribute a specific human case reported to FoodNet Canada to a positive isolate obtained from an exposure source. In this report, the non-human and human data are integrated using descriptive methods. The term “significant” is reserved in this report for describing trends that are statistically significant.
FoodNet Canada retail and farm sampling is integrated with CIPARS. This has included the streamlining and sharing of sampling and sampling sites, retrospective and prospective testing of antimicrobial resistance in selected bacteria isolated from FoodNet Canada samples, and improving data management mechanisms to maximize data linkages. CIPARS monitors trends and the relationship between antimicrobial use and antimicrobial resistance in selected bacterial organisms from human, animal, and food sources across Canada to inform evidence-based policy decision making to contain the emergence and spread of resistant bacteria. For further information about CIPARS, please refer to the program's website.
Surveillance strategy
Human surveillance
Public health professionals in each site use FoodNet Canada’s enhanced standardized questionnaire to interview reported enteric disease cases (or proxy respondents). Information on potential exposures collected from the questionnaires is used to determine case classification (e.g. international travel, endemic) and compare exposures between cases. In addition, advanced subtyping analyses on isolates from case specimens are conducted for further integration with non-human source information.
Retail surveillance
The retail stage of food production represents the point closest to consumers through which they can be exposed to enteric pathogens through contaminated food. Both retail meat and produce samples are collected on a weekly basis from randomly selected grocery stores within each site. FoodNet Canada collects samples of raw unfrozen skinless chicken breasts and ground beef on a weekly basis. Each year, FoodNet Canada and its partners assess knowledge gaps and from this process, select targeted retail products to sample for a given year (see Appendix A for 2017 details). In past years targeted meats have included but were not limited to pork chops, ground chicken and turkey, and uncooked frozen breaded chicken products, such as nuggets and strips. In 2017 FoodNet Canada opted to continue the targeted investigation of frozen breaded chicken products that began in 2011 as well as incorporated retail veal. Testing continued in 2017 as in previous years with Campylobacter and Salmonella being tested for among all chicken products and veal, Listeria spp. for all retail meat products, and Shigatoxigenic Escherichia coli (STEC) for ground beef samples and veal. In addition, frozen berries were tested for the presence of Listeria, Hepatitis A, Hepatitis E, Norovirus, and Rotavirus.
On-farm surveillance
The presence of enteric pathogens on farms (in animal manure) is a potential source of environmental exposure of enteric pathogens, and also represents an important source in the farm-to-fork transmission chain. In 2017, the farm component was active across all three sentinel sites, although commodities varied by site (Appendix A). Manure samples were collected from beef cattle, swine, broiler chicken, and turkey farms in order to estimate the pathogen levels on farms. Approximately 30 farms of each type of participating farm commodities were visited in each site. A short management survey, and up to six manure samples (usually fresh pooled samples) were obtained at each farm visit. All samples were tested for Campylobacter and Salmonella with the beef samples additionally being tested for E. coli O157 and STEC. Throughout the report, farm results are reported at both the sample-level and farm-level to account for clustering within farms. Sample-level results include all manure samples collected on each farm, while farm-level results are based on a threshold of one positive manure sample per farm to report a farm as positive.
Water surveillance
Water is another environmental source of enteric pathogens collected in the FoodNet Canada surveillance program. In 2017 irrigation water was sampled in both the BC and AB sentinel sites and tested for Campylobacter, Salmonella, and STEC (Appendix A). Sampling in BC occurred bi-weekly from April to October, and monthly in AB from June to September.
Definitions
- Endemic case of disease:
- Affected individual who had an infection that was considered sporadic and domestically acquired (i.e. within Canada).
- Exposure source:
- Point along the water-borne, food-borne, animal-to-person, or person-to-person transmission route at which people were suspected to have been exposed to a given pathogen.
- International travel-related case of disease:
- Affected individual who travelled outside of Canada, and where the travel dates overlap with the expected disease incubation period (varies depending on the pathogen).
- Lost to follow-up:
- Includes cases that could not be followed up with an interview by public health.
- Non-endemic:
- Includes immigration-related cases where illness was acquired outside of Canada.
- Outbreak-related case of disease:
- One of a number of affected individuals associated with an increased occurrence of the same infectious disease, whose illness is confirmed through a public health partner (ON, AB, and BC sentinel sites) on the basis of laboratory and/or epidemiological evidence.
- Shigatoxigenic Escherichia coli (STEC):
- Escherichia coli are normal intestinal inhabitants in humans and animals, and most strains do not cause enteric disease. However, the group of shigatoxigenic E. coli includes certain toxin-producing strains that can cause severe diarrhea and, in some people (particularly young children), a form of acute kidney failure called hemolytic uremic syndrome. In terms of nomenclature, shigatoxin (ST) -producing E. coli can also be referred to as Shiga-toxin-producing E. coliFootnote 1
- Significant:
- The term “significant” in this report has been reserved for statistically significant findings (i.e. p < 0.05).
Campylobacter
Human surveillance summary
| Ontario site | Alberta site | British Columbia site |
All sites | |||||
|---|---|---|---|---|---|---|---|---|
| 2016 | 2017 | 2016 | 2017 | 2016 | 2017 | 2016 | 2017 | |
| Endemic | 15.98 | 15.69 | 18.00 | 19.36 | 21.38 | 24.29 | 18.33 | 19.67 |
| Travel | 4.57 | 5.37 | 4.48 | 5.85 | 9.34 | 9.68 | 5.67 | 6.66 |
| Outbreak | 0.00 | 0.00 | 0.00 | 0.00 | 0.00 | 0.00 | 0.00 | 0.00 |
| Non-endemic | 0.00 | 0.00 | 0.00 | 0.19 | 0.00 | 0.00 | 0.00 | 0.10 |
| Lost to follow-up | 7.27 | 4.96 | 3.11 | 2.97 | 3.94 | 4.32 | 4.32 | 3.77 |
| Total | 27.82 | 26.01 | 25.59 | 28.37 | 34.66 | 38.29 | 28.32 | 30.20 |
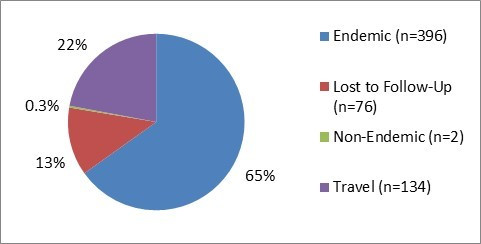
Figure 1.1 - Text description
Figure 1.1 shows a pie chart of the relative proportion of Campylobacter cases in the FoodNet Canada surveillance system by case classification (endemic, lost to follow-up, non-endemic and travel) for 2017. The chart includes the case classification, the number of cases and the relative proportion.
| Case Classification | Number of cases | Relative proportion |
|---|---|---|
| Endemic | 396 | 65% |
| Lost to follow-Up | 76 | 13% |
| Non-endemic | 2 | 0.3% |
| Travel | 134 | 22% |
Isolates with species information: 544/608 (89%)
- jejuni: 90%
- coli: 8%
- upsaliensis: <1%
- fetus: <1%
- lari: <1%
- hyointestinalis: <1%
Significant changes in endemic, travel, and total incidence rates:
- There were no significant changes from 2016 to 2017.
Clinical profile (endemic cases only):
- Most commonly reported symptoms:
- Diarrhea: 99%
- Abdominal pain: 82%
- Fever: 65%
- Fatigue: 65%
- Anorexia: 61%
- Indicators of severity:
- Bloody diarrhea: 37%
- Emergency room visits:51%
- Hospitalizations: 9%
- Antimicrobial prescriptions: 58%
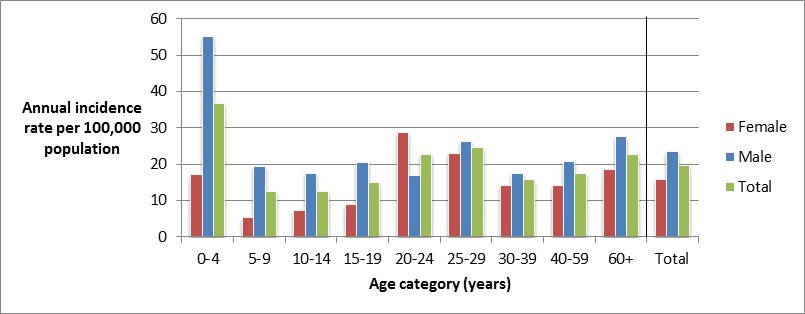
Figure 1.2 - Text description
Figure 1.2 shows a bar chart of the annual incidence rate of Campylobacter per 100,000 population by overall total age category and by each age category and gender for 2017. The y-axis presents the incidence rate per 100,000 population and the x-axis presents the age categories. The bars represent the total incidence for all genders by age group as well as the total incidence of male and female separately by age category.
| Age category | Female | Male | Overall total (all genders combined) |
|---|---|---|---|
| 0 to 4 | 17.18 | 55.04 | 36.67 |
| 5 to 9 | 5.21 | 19.50 | 12.60 |
| 10 to 14 | 7.39 | 17.37 | 12.54 |
| 15 to 19 | 8.97 | 20.38 | 14.83 |
| 20 to 24 | 28.83 | 16.78 | 22.56 |
| 25 to 29 | 22.84 | 26.19 | 24.54 |
| 30 to 39 | 14.26 | 17.50 | 15.88 |
| 40 to 59 | 14.22 | 20.74 | 17.52 |
| 60+ | 18.46 | 27.55 | 22.74 |
| Overall total (all ages combined) |
15.74 | 23.48 | 19.62 |
Food, animal and environmental surveillance summary
| Sample type | Ontario site | Alberta site | British Columbia site | All sites | |
|---|---|---|---|---|---|
| Chicken breast | 28% (36/129) | 49% (65/132) | 43% (54/126) | 40% (155/387) | |
| Veal (fresh only) | 0% (0/115) | 0% (0/131) | 0% (0/131) | 0% (0/377) | |
| Broiler chicken manure | Sample-level | 38% (26/68)↑ | 23% (28/120) | 37% (44/120)↑ | 32% (98/308)↑ |
| Farm-level | 47% (8/17)↑ | 23% (7/30) | 37% (11/30) | 34% (26/77)↑ | |
| Turkey manure | Sample-level | 52% (50/96) | NT | 75% (81/108) | 64% (131/204) |
| Farm-level | 58% (14/24) | NT | 85% (23/27) | 73% (37/51) | |
| Swine manure | Sample-level | 73% (101/138) | 78% (80/102) | NT | 75% (181/240) |
| Farm-level | 91% (21/23) | 88% (15/17) | NT | 90% (36/40) | |
| Feedlot beef manure | Sample-level | NT | 57% (43/76) | NT | 57% (43/76) |
| Farm-level | NT | 73% (8/11) | NT | 73% (8/11) | |
| Irrigation water | NT | 0% (0/32)↓ | 1% (1/70)↓ | 1% (1/102)↓ | |
NT - not tested
↑/↓Indicates a significant increase/decrease in prevalence compared to 2016
Significant differences in prevalence since 2016:
- Broiler chicken manure (sample-level): ON increased to 38% in 2017 from 5% in 2016. BC increased to 37% in 2017 from 24% in 2016. All sites combined increased to 32% in 2017 from 18% in 2016.
- Broiler chicken manure (farm-level): ON increased to 47% in 2017 from 28% in 2016. All sites combined increased to 34% from 19% in 2016.
- Irrigation water: AB decreased to 0% in 2017 from 22% in 2016. BC decreased to 1% in 2017 from 20% in 2016. All sites combined decreased to 1% in 2017 from 20% in 2016.
Regional differences:
- Chicken breast in ON had significantly lower Campylobacter prevalence compared to AB and BC.
- Broiler chicken manure in AB had significantly lower Campylobacter prevalence compared to ON and BC.
- Turkey manure in ON had significantly lower Campylobacter prevalence compared to BC.
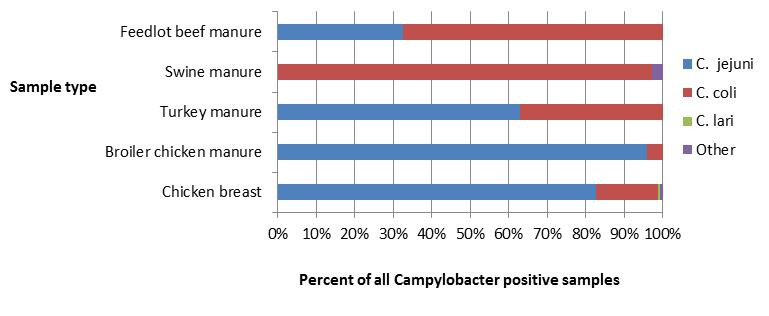
Figure 1.3 - Text description
Figure 1.3 shows a stacked horizontal bar chart that represents the distribution of Campylobacter jejuni, Campylobacter coli, Campylobacter lari and other Campylobacter positive samples by sample type (Feedlot beef manure,swine manure, turkey manure, broiler chicken manure and chicken breast) for 2017. The y-axis represents the sample type and the x-axis represents the percent of all Campylobacter positive samples. The stacked bars represent the percentage of Campylobacter for each subtype (Campylobacter jejuni, Campylobacter coli, Campylobacter lari and other Campylobacter) by sample type.
| Sample type - Feedlot beef manure |
Sample type - Swine manure |
Sample type - Turkey manure |
Sample type - Broiler Chicken manure |
Sample type - Chicken breast |
|
|---|---|---|---|---|---|
| Campylobacter jejuni |
32.56 | 0.00 | 61.83 | 95.92 | 83.23 |
| Campylobacter coli |
67.44 | 97.24 | 36.64 | 4.08 | 16.13 |
| Campylobacter lari |
0.00 | 0.00 | 0.00 | 0.00 | 0.65 |
| Other Campylobacter |
0.65 | 0.00 | 0.00 | 2.76 | 0.00 |
Public health impact
Increased incidence of Campylobacter spp. cases in the summer months (June to August) and in the proportion of retail chicken products testing positive for this pathogen were observed in 2017, with higher rates and proportions reported in the months of June and July (Figure 1.4). While there was a marked decrease in the incidence of human campylobacteriosis at the end of the summer, the proportion of retail chicken samples positive for Campylobacter remained stable and at higher levels compared to the winter and spring seasons.
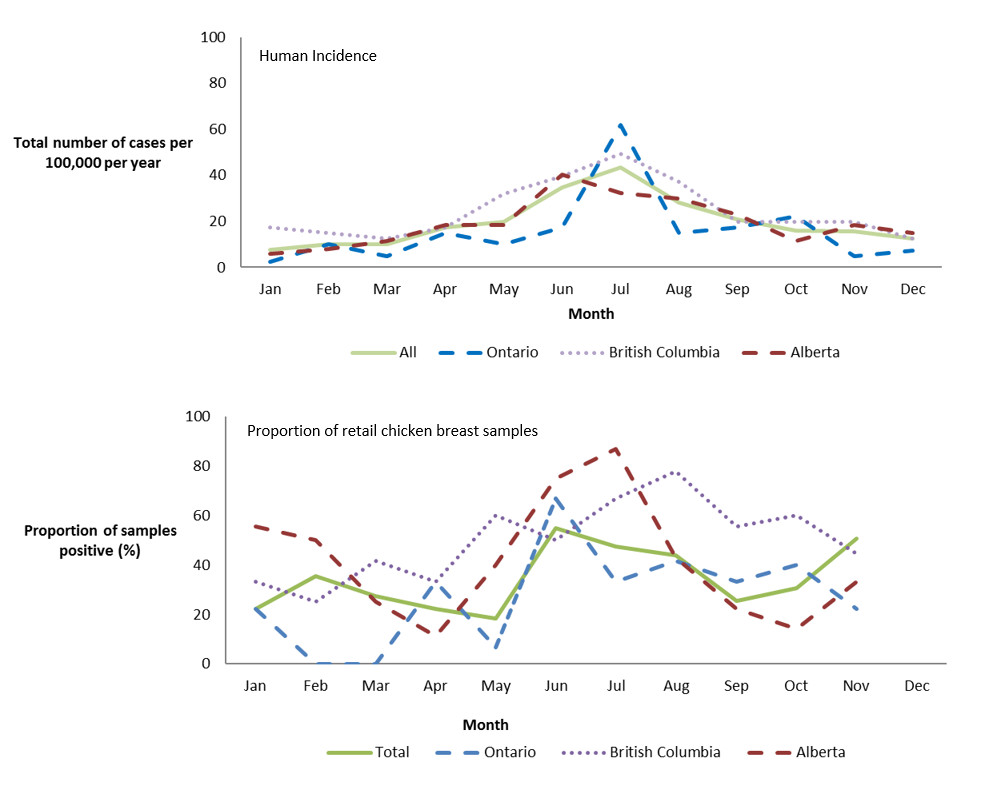
Figure 1.4 - Text description
Figure 1.4 shows two line graphs. The top line graph is the monthly incidence rate of Campylobacter per 100,000 (y-axis) by month (x-axis) for the total combined sentinel sites (Ontario, British Columbia and Alberta) and each of the individual sentinel sites Ontario, British Columbia and Alberta in 2017. The bottom line graph is the proportion of retail chicken breast samples that are positive (y-axis) by month (x-axis) for the total combined sentinel sites (Ontario, British Columbia and Alberta) and each of the individual sentinel sites Ontario, British Columbia and Alberta in 2017.
| All Sites | Ontario | British Columbia | Alberta | |
|---|---|---|---|---|
| Jan | 7.75 | 2.48 | 17.29 | 5.75 |
| Feb | 10.13 | 9.91 | 14.82 | 8.05 |
| Mar | 10.13 | 4.96 | 12.35 | 11.50 |
| Apr | 17.28 | 14.87 | 17.29 | 18.40 |
| May | 19.67 | 9.91 | 32.12 | 18.40 |
| Jun | 34.57 | 17.34 | 39.53 | 40.26 |
| Jul | 43.51 | 61.94 | 49.41 | 32.21 |
| Aug | 28.01 | 14.87 | 37.06 | 29.91 |
| Sep | 20.86 | 17.34 | 19.76 | 23.01 |
| Oct | 16.09 | 22.30 | 19.76 | 11.50 |
| Nov | 15.50 | 4.96 | 19.76 | 18.40 |
| Dec | 12.52 | 7.43 | 12.35 | 14.95 |
| All Sites | Ontario | British Columbia | Alberta | |
|---|---|---|---|---|
| Jan | 22.1 | 22.2 | 33.3 | 55.6 |
| Feb | 35.3 | 0.0 | 25.0 | 50.0 |
| Mar | 27.5 | 0.0 | 41.7 | 25.0 |
| Apr | 22.4 | 33.3 | 33.3 | 11.1 |
| May | 18.3 | 6.7 | 60.0 | 40.0 |
| Jun | 54.9 | 66.7 | 50.0 | 75.0 |
| Jul | 47.5 | 33.3 | 66.7 | 86.7 |
| Aug | 43.8 | 41.7 | 77.8 | 42.9 |
| Sep | 25.4 | 33.3 | 55.6 | 22.2 |
| Oct | 30.6 | 40.0 | 60.0 | 14.3 |
| Nov | 50.7 | 22.2 | 44.4 | 33.3 |
| Dec |
Campylobacter jejuni was the primary subtype identified in human cases, retail chicken samples, broiler chicken farms and turkey farms across all sentinel sites (Figure 1.3). Among human cases, Campylobacter coli is less commonly associated with disease, representing 8% of all subtyped human infections. By contrast, C. coli represented 97% of Campylobacter isolated from swine manure samples, 67% from feedlot beef manure samples and 37% from turkey manure samples. A study by FoodNet Canada attributed Campylobacter cases to potential sources, identifying chicken meat as a primary source of human campylobacteriosis with 65-69% of cases being attributed to chicken meat, followed by exposure to cattle manure (14-19%)Footnote 1. Chicken and pig manure, as well as pork, beef and turkey meat and water were found to be minor sources for human campylobacteriosis.
A second study using expert opinion found that food products were the most likely source of infection in humans followed by animal contactFootnote 2. At the retail level, Campylobacter was frequently detected on chicken breasts (40%, 155/387). There were multiple sources of exposure at the farm level, and the proportion of Campylobacter identified by farm type is presented in Figure 1.5.
In 2017, in the BC site, irrigation water sampling in the Matsqui irrigation canal was relocated to the Serpentine irrigation canal. In addition, sampling changed to occur only during the spring through fall months (April to October) from the previously conducted full year sampling, as these months represent the time period when irrigation water is used for agriculture. This could have impacted the irrigation water results in BC as no Campylobacter was found in 2017 compared to 2016. It was observed through FoodNet Canada’s ongoing water surveillance activities that sampling throughout a calendar year found higher prevalence of Campylobacter in the winter months, when irrigation water is not being used on fresh produce, compared to the summer months. For Alberta, very low levels of Campylobacter have been recovered over time with the exception of 2016 when a significantly higher Campylobacter prevalence was observed compared to than other surveillance year. Therefore the low prevalence of Campylobacter observed in 2017 is within expected levels for the Alberta site (Table 1.2).
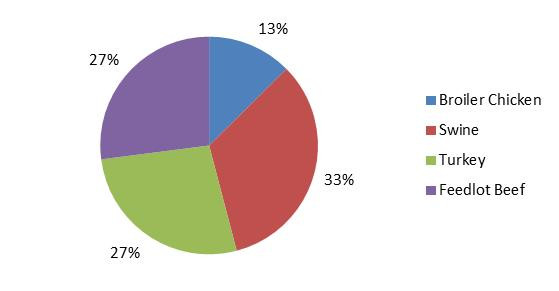
Figure 1.5 - Text description
Figure 1.5 shows a pie chart of the proportion of all positive Campylobacter manure samples by farm type (broiler chicken, swine, turkey and feedlot beef) in 2017.
| Farm type | Proportion of all positive manure samples |
|---|---|
| Broiler Chicken | 13% |
| Swine | 33% |
| Turkey | 27% |
| Feedlot Beef | 27% |
Overall, when comparing the human and food trend information it is clear that there are other potential sources of exposure resulting in human illness beyond retail chicken products. Continuing surveillance of other potential food and environmental sources, further analyses of risk factor data from human Campylobacter cases and integrated analyses of molecular data (e.g. CGF and WGS) will allow us to better identify and understand the contribution of multiple sources to Canadian illnesses as well as to guide future surveillance activities.
Salmonella
Human surveillance summary
| Ontario site | Alberta site | British Columbia site |
All sites | |||||
|---|---|---|---|---|---|---|---|---|
| 2016 | 2017 | 2016 | 2017 | 2016 | 2017 | 2016 | 2017 | |
| Endemic | 12.66 | 6.61↓ | 14.69 | 16.01 | 17.85 | 17.70 | 14.96 | 14.16 |
| Travel | 4.98 | 4.75 | 5.35 | 6.04 | 7.68 | 9.47 | 5.83 | 6.56 |
| Outbreak | 6.44 | 0.41 | 1.17 | 0.29 | 4.77 | 0.62 | 3.31 | 0.40 |
| Non-endemic | 0.00 | 0.00 | 0.00 | 0.00 | 0.21 | 0.41 | 0.05 | 0.10 |
| Lost to follow-up | 0.42 | 0.62 | 1.56 | 2.59 | 1.25 | 2.26 | 1.21 | 2.04 |
| Total | 24.49 | 12.39↓ | 22.77 | 24.92 | 31.76 | 30.47 | 25.36 | 23.25 |
a Typhi and Paratyphi (except Paratyphi B var Java) are not reported by AB site
↓ indicates a significant decrease in incidence since 2016
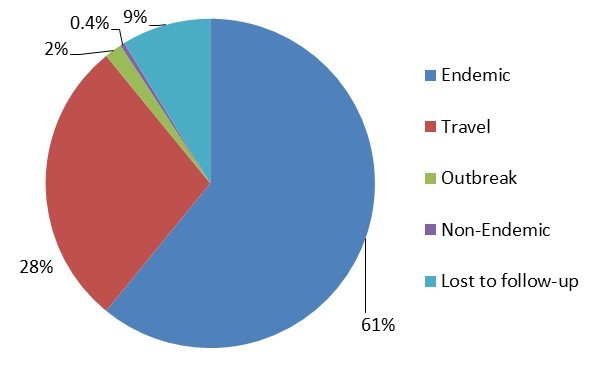
Figure 2.1 - Text description
Figure 2.1 shows a pie chart of the relative proportion of Salmonella cases in the FoodNet Canada surveillance system by case classification of endemic, lost to follow-up, non-endemic, outbreak and travel for 2017. The pie chart includes the case classification and the relative proportion.
| Case Classification | Number of cases | Relative proportion |
|---|---|---|
| Endemic | 285 | 61% |
| Lost to follow-Up | 42 | 9% |
| Non-endemic | 1 | 0.4% |
| Travel | 131 | 28% |
| Outbreak | 9 | 2% |
Isolates with serovar information: 467/468 (99.8%)
Top 5 Salmonella serovars:
- Enteritidis: 56%
- Typhimurium: 7%
- Heidelberg: 3%
- ssp. 4,[5],12:i:-: 3%
- Infantis: 3%
Significant changes in endemic, travel, and total incidence rates:
- There were significant decreases in the ON site endemic and total incidence rates between 2016 and 2017.
Clinical profile (endemic cases only):
- Most commonly reported symptoms:
- Diarrhea: 94%
- Abdominal pain: 82%
- Fatigue: 71%
- Fever: 67%
- Anorexia: 65%
- Indicators of severity:
- Bloody diarrhea: 31%
- Emergency room visits: 57%
- Hospitalizations: 15%
- Antimicrobial prescriptions: 44%

Figure 2.2 - Text description
Figure 2.2 shows a bar chart of the annual incidence rate for Salmonella human infections per 100,000 population by age group and gender for 2017. The y-axis presents the annual incidence rate per 100,000 population, while the x-axis presents the different age categories and total for all age groups combined. The bars represent the total incidence for all genders, total incidence for male and total incidence for female cases.
| Age category | Female | Male | Overall total (all genders combined) |
|---|---|---|---|
| 0 to 4 | 15.46 | 38.86 | 27.50 |
| 5 to 9 | 24.33 | 21.13 | 22.67 |
| 10 to 14 | 3.70 | 6.95 | 5.37 |
| 15 to 19 | 12.56 | 20.38 | 16.58 |
| 20 to 24 | 21.25 | 5.59 | 13.10 |
| 25 to 29 | 13.44 | 13.10 | 13.26 |
| 30 to 39 | 14.91 | 11.02 | 12.96 |
| 40 to 59 | 13.4 | 7.64 | 10.70 |
| 60+ | 15.23 | 16.11 | 15.65 |
| Overall total (all ages combined) |
14.84 | 13.48 | 14.16 |
Food, animal and environmental surveillance summary
| Sample type | Ontario site | Alberta site | British Columbia site |
All sites | |
|---|---|---|---|---|---|
| Chicken breast | 11% (14/132) | 19% (24/126) | 29% (38/132) | 19% (76/390) | |
| Frozen raw breaded chicken products | 25% (33/131) | 23% (29/128) | 26% (34/132) | 25% (96/391) | |
| Veal | 0% (0/115) | 3% (3/98) | 1% (1/131) | 1% (4/344) | |
| Broiler chicken manure | Sample-level | 34% (23/68) | 50% (60/120) | 54% (65/120) | 48% (148/308) |
| Farm-level | 47% (8/17) | 73% (22/30) | 70% (21/30) | 66% (51/77) | |
| Swine manure | Sample-level | 19% (26/138) | 8% (8/102) | NT | 14% (34/240) |
| Farm-level | 43% (10/23) | 29% (5/17) | NT | 38% (15/40) | |
| Turkey manure | Sample-level | 70% (67/96) | NT | 44% (47/108) | 56% (114/204) |
| Farm-level | 79% (19/24) | NT | 59% (16/27) | 69% (35/51) | |
| Feedlot beef manure | Sample-level | NT | 1% (1/76) | NT | 1% (1/76) |
| Farm-level | NT | 9% (1/11) | NT | 9% (1/11) | |
| Irrigation water | NT | 6% (2/32) | 16% (11/70) | 13% (13/102) | |
NT – not tested.
Significant differences in prevalence since 2016:
- There were no significant differences in prevalence between 2017 and 2016.
Regional differences:
- Salmonella prevalence in retail chicken breast was significantly higher in the BC site compared with the ON site.
- At the sample-level, Salmonella prevalence in broiler chicken manure was significantly higher in the AB and BC sites compared with the ON site.
- At the sample-level, Salmonella prevalence in swine manure was significantly higher in the ON site compared with the AB site.
- At the sample-level, Salmonella prevalence in turkey manure was significantly higher in the ON site compared with the BC site.
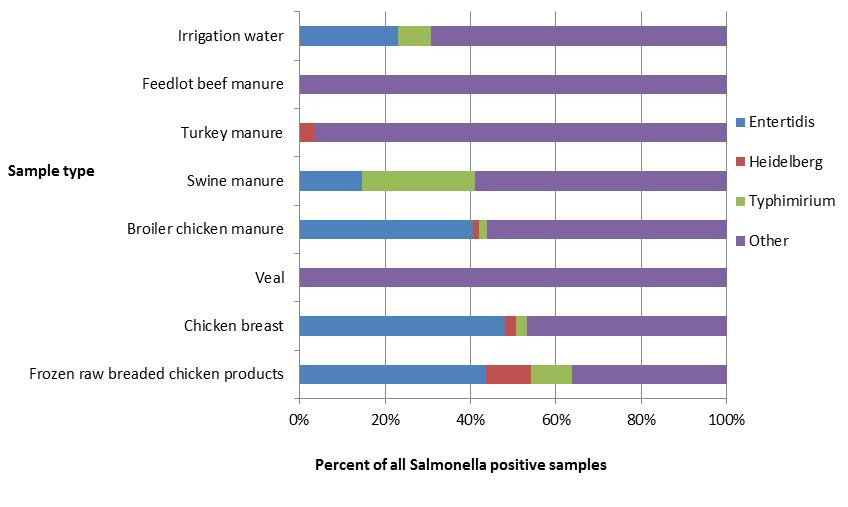
Figure 2.3 - Text description
Figure 2.3 shows a stacked horizontal bar chart representing the percentage of all positive samples for selected Salmonella serovars: Enteritidis, Heidelberg, Typhimurium and Other. On the y-axis are the type of samples collected through retail, farm and environmental samples and the x-axis shows the percent of all Salmonella positive samples.
| Sample type | ||||||||
|---|---|---|---|---|---|---|---|---|
| Irrigation water | Feedlot beef manure | Turkey manure | Swine manure | Broiler chicken manure | Veal | Chicken breast | Frozen raw breaded chicken product | |
| Salmonella Enteritidis | 23% | 0% | 0% | 15% | 41% | 0% | 48% | 44% |
| Salmonella Heidelberg | 0% | 0% | 4% | 0% | 1% | 0% | 3% | 11% |
| Salmonella Typhimurium | 8% | 0% | 0% | 26% | 2% | 0% | 3% | 10% |
| Other Salmonella serovars | 69% | 100% | 96% | 59% | 56% | 100% | 47% | 36% |
Salmonella Enteritidis
In 2017, S. Enteritidis (SE) was the top serovar identified among FoodNet Canada human endemic cases (Table 2.3). Although SE was the top serovar across all sentinel sites, differences in the proportion of endemic SE were observed by site ranging from 31% in the ON site to 56% and 76% in the AB and BC sites, respectively (Figure 2.4).
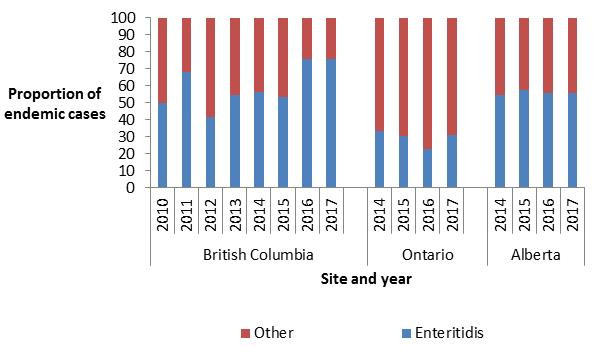
Figure 2.4 - Text description
Figure 2.4 shows a stacked vertical bar chart representing the proportion of human endemic Salmonella spp. cases reported by each site and year for Enteritidis or other Salmonella serovars. On the y-axis is the proportion of endemic cases and the x-axis presents the sentinel site and year during which these cases were reported.
| Serovar | British Columbia | Ontario | Alberta | |||||||||||||
|---|---|---|---|---|---|---|---|---|---|---|---|---|---|---|---|---|
| 2010 | 2011 | 2012 | 2013 | 2014 | 2015 | 2016 | 2017 | 2014 | 2015 | 2016 | 2017 | 2014 | 2015 | 2016 | 2017 | |
| Enteritidis | 50.00 | 67.95 | 41.82 | 54.84 | 56.12 | 53.66 | 75.58 | 75.58 | 33.33 | 30.61 | 22.95 | 31.25 | 54.76 | 57.32 | 56.00 | 55.69 |
| Other | 50.00 | 32.05 | 58.18 | 45.16 | 43.88 | 46.34 | 24.42 | 24.42 | 66.67 | 69.39 | 77.05 | 68.75 | 45.24 | 42.68 | 44.00 | 44.31 |
Among SE cases in 2017, 23% (60/263) were related to international travel. The majority of these cases reported travel to the Americas (Central, South and Caribbean), with Mexico (37%), Cuba (28%) and the Dominican Republic (26%) being the destinations most often reported within this region (Figure 2.5).
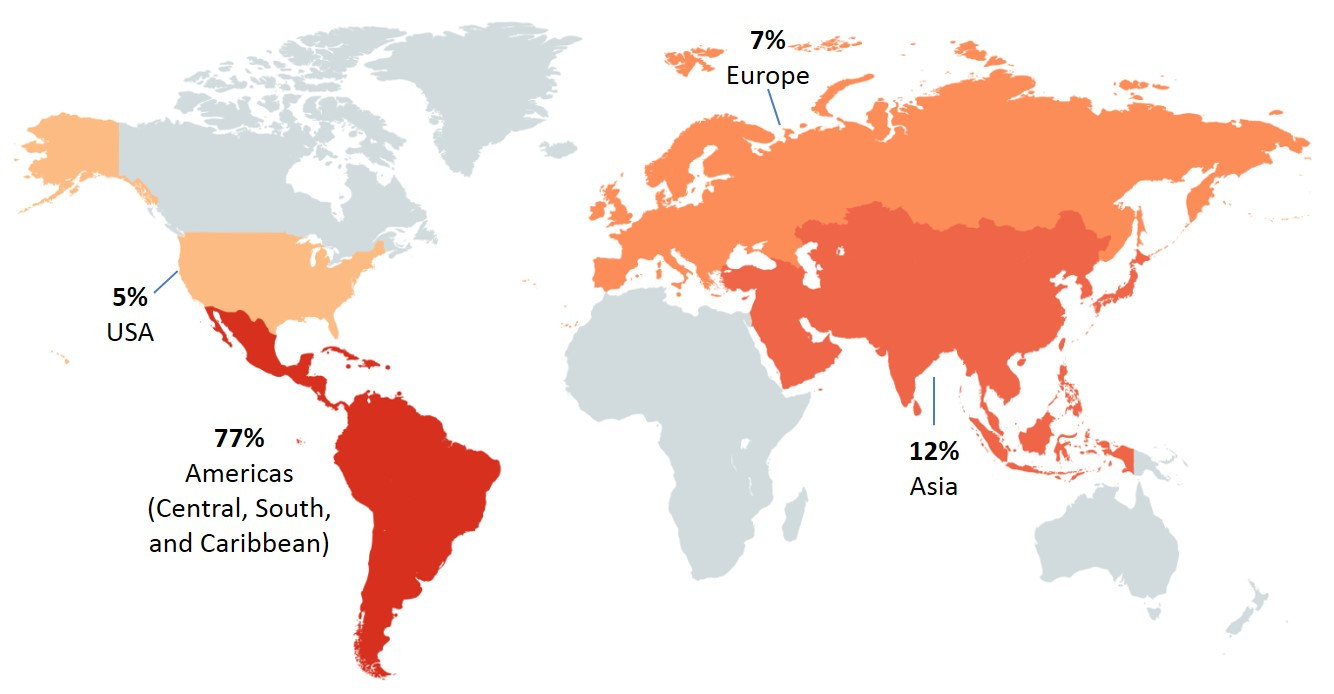
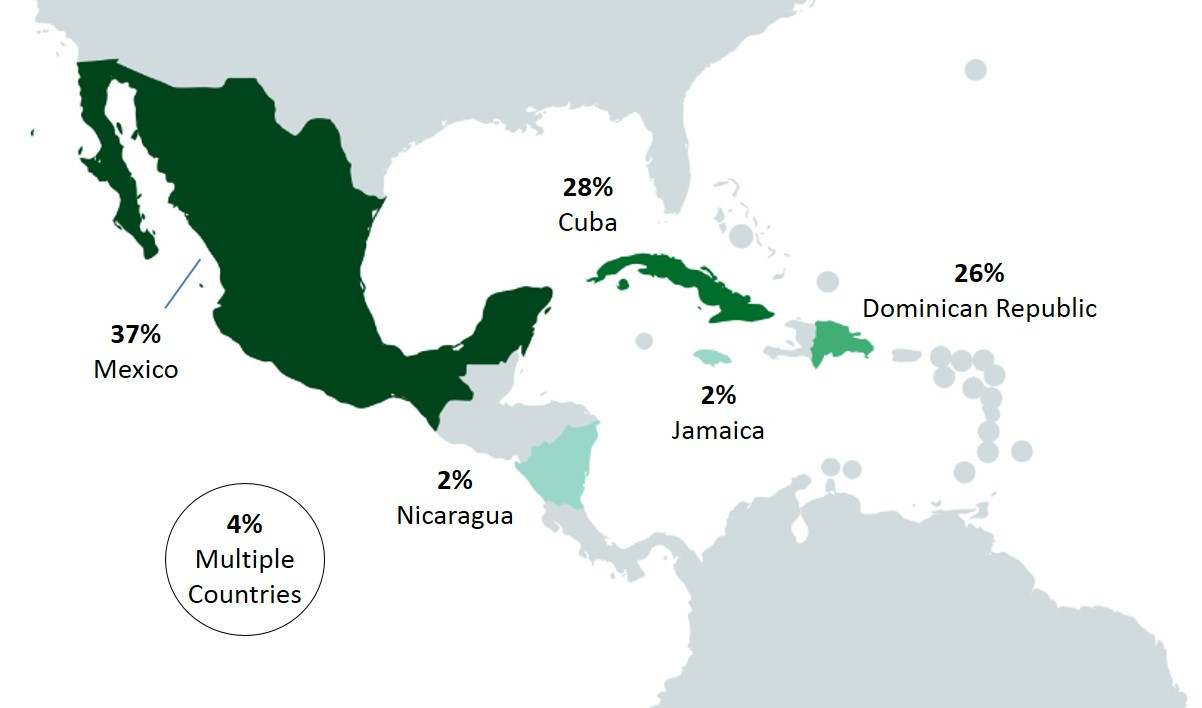
Figure 2.5 - Text description
This figure shows two pictures of the regions of the world with different perspectives. The first picture displays the global land mass and highlighted are the countries/regions that cases reported having traveled prior to their illness: United States of America, Americas (Central, South, and Caribbean), Europe and Asia. The second figure focuses on Mexico and Central American countries, with the following countries in color: Mexico, Nicaragua, Jamaica, Cuba and Dominican Republic. Each country/regions highlighted in these figures include the percentage of cases out of all the travel-related illnesses that reported having traveled to these countries/regions.
| United States of America | Americas (Central, South and Caribbean) | Europe | Asia | Mexico | Nicaragua | Jamaica | Cuba | Dominican Republic | Multiple countries | |
|---|---|---|---|---|---|---|---|---|---|---|
| Proportion of cases | 5% | 77% | 7% | 12% | 37% | 2% | 2% | 28% | 26% | 4% |
From 2014 to 2017, the annual incidence rate for endemic SE cases for the combined sentinel sites (ON, BC and AB) has remained stable between 8.6 and 8.3 cases per 100,000 population, respectively. However, regional differences continued to be observed across the sites. Higher annual incidence rates of endemic SE were observed in the BC and AB sites, while lower rates were observed in the ON site. This same trend was observed for retail chicken breast, with the combined site proportion of samples testing positive remaining stable from 2014 to 2017, but with regional differences. In the BC and AB sites, a higher proportion of retail chicken breast samples were positive for SE compared with the ON site. A similar regional trend was also observed for broiler chicken manure, with a higher proportion of samples positive for SE in the BC and AB sites compared with the ON site, where very few samples were found positive between 2014 and 2017. Of note, between 2016 and 2017, the proportion of broiler chicken manure samples positive for SE significantly increased in the AB site. However, this increase was not observed in the SE human incidence rate or in the proportion of retail chicken breast or frozen raw breaded chicken product samples positive for SE in the AB site (Figure 2.6).
Unlike retail chicken breast and broiler chicken manure, from 2014 to 2017, regional differences were not observed for retail frozen raw breaded chicken products. The proportion of these products positive for SE has remained similar across the sites. This is likely a reflection of product distribution as these products have been found to be produced and distributed widely across the country with distribution not typically limited to a single province. As in 2016, SE remained the top serovar identified across all three sentinel sites for these products in 2017. FoodNet Canada data have been used in discussions with industry and the Canadian Food Inspection Agency (CFIA) and have contributed to evidence regarding the potential risks of these products and human illness. Continued collection of these data by FoodNet Canada will allow for trends to be monitored over time and to evaluate any impact of industry interventions.
In 2017, SE was also identified in swine manure and irrigation water samples. Although only a small proportion of samples were positive for SE (2% for swine manure and 3% for irrigation water), these sources represent potential causes of human illness as demonstrated through whole genome sequencing (WGS) analysis (Table 2.4 and Table 2.5). Although in 2017 swine manure samples were not found to be related to human illnesses through WGS (Table 2.4), several water isolates were found to be genetically related to human, food and animal samples collected through FoodNet Canada (Table 2.4). Thus, continued monitoring of these and other sources by FoodNet Canada will help inform the role these commodities have on the incidence of SE infections in Canada.
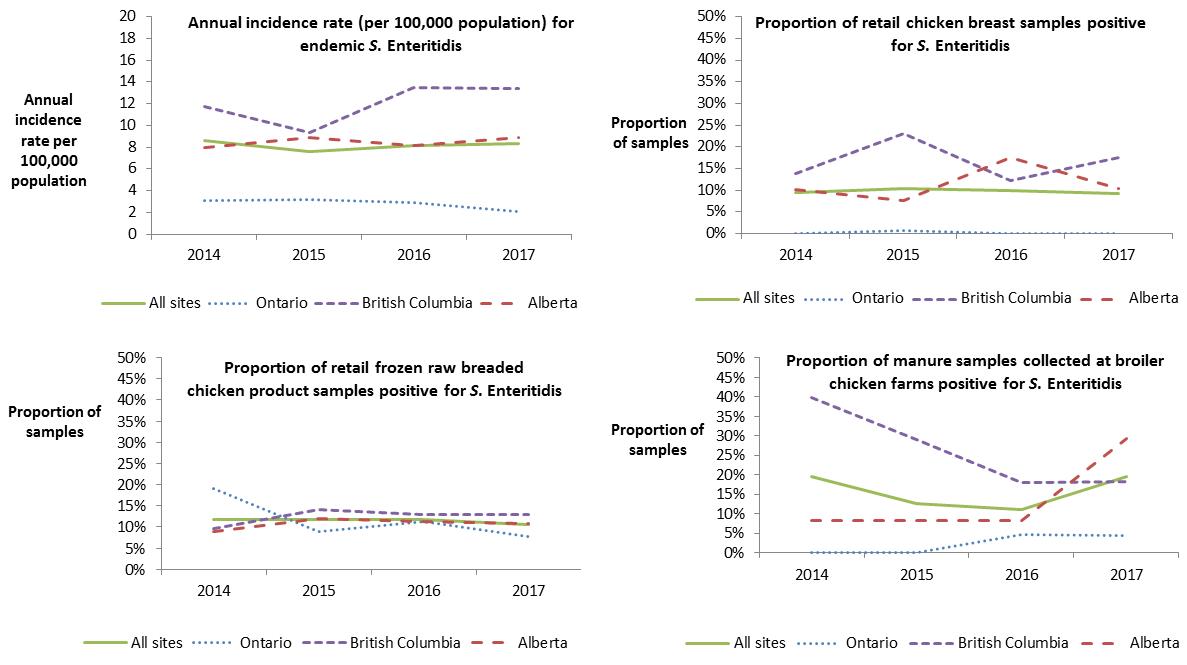
Figure 2.6 - Text description
This figure consists of multiple graphs, one graph for each surveillance component: retail chicken breast, retail frozen chicken products, broiler chicken farms and human incidence rates. Each graph presents the proportion of samples positive for S. Enteritidis or the human annual incidence rate per 100,000 population for all sites combined and for each individual site. Different styles of lines have been used to describe the proportions or incidence rate for each individual site and all sites combined. The left y-axis presents the human incidence rate per 100,000 population or the proportion of samples positive for S. Enteritidis and the x-axis presents the year when the samples were collected.
| Sentinel site | Chicken breast – proportion of all tested | Frozen chicken products – proportion of all tested | Broiler chickenfarms – proportion of all tested | Human incidence rates | ||||||||||||
|---|---|---|---|---|---|---|---|---|---|---|---|---|---|---|---|---|
| 2014 | 2015 | 2016 | 2017 | 2014 | 2015 | 2016 | 2017 | 2014 | 2015 | 2016 | 2017 | 2014 | 2015 | 2016 | 2017 | |
| All sites | 9% | 10% | 10% | 9% | 12% | 12% | 12% | 10% | 19% | 13% | 11% | 19% | 8.62 | 7.62 | 8.19 | 8.34 |
| Ontario | 0% | 1% | 0% | 0% | 19% | 9% | 11% | 8% | 0% | 0% | 5% | 4% | 3.05 | 3.15 | 2.91 | 2.06 |
| British Columbia | 14% | 23% | 12% | 17% | 10% | 14% | 13% | 13% | 40% | 29% | 18% | 18% | 11.76 | 9.36 | 13.49 | 13.38 |
| Alberta | 10% | 8% | 17% | 10% | 9% | 12% | 11% | 11% | 8% | 8% | 8% | 29% | 7.97 | 8.92 | 8.17 | 8.91 |
| Human endemic cases | Retail | Farm | Irrigation water | |||||
|---|---|---|---|---|---|---|---|---|
| Chicken breast | Frozen raw breaded chicken products | Veal | Broiler chicken | Swine | Beef cattle | Turkey | ||
| Ontario | ||||||||
| (n=32) | (n=14) | (n=31) | (n=23) | (n=26) | (n=67) | |||
| Enteritidis (31%) | Kentucky (43%) | Enteritidis (32%) | No positive samples were identified | Muenchen (17%) | Typhimurium (35%) | No sampling conducted for this commodity | Uganda (39%) | No sampling conducted |
| Heidelberg (19%) | Thompson (14%) | Typhimurium (16%) | Enteritidis, Kentucky, Liverpool, Mbandaka (13% each) | 4,[5],12:i:-, Infantis (15% each) | Muenchen (30%) | |||
| Typhimurium (13%) | Braenderup, Hadar, Heidelberg, IIIA:23:g,z51:-, Infantis, Typhimurium (7% each) | Infantis, Kentucky (13% each) | Heidelberg, Indiana, Typhimurium (9% each) | Derby, Entertidis (12%) | Montevideo (7%) | |||
| Thompson (9%) | IIIA:23:g,z51:-(10%) | Anatum, Kedougou, Rissen (4% each) | Heidelberg, Senftenberg (6% each) | |||||
| Agona, Bovismorbificans, Braenderup, Duisburg, 4,[5],12:i:-, Newport, Panama, Saintpaul, Typhi (3% each) | ||||||||
| British Columbia | ||||||||
| (n=86) | (n=37) | (n=34) | (n=1) | (n=65) | (n=47) | (n=11) | ||
| Enteritidis (76%) | Enteritidis (62%) | Enteritidis (50%) | Dublin (100%) | Kentucky (37%) | No sampling conducted for this commodity | No sampling conducted for this commodity | Hadar (32%) | Enteriditis, Hadar (27% each) |
| Typhimurium (3%) | Kentucky (27%) | Heidelberg, Kentucky (12% each) | Enteritidis (34%) | Senftenberg (17%) | Agona, Daytona, Infantis, Kentucky, Typhimurium (9% each) | |||
| Braenderup, 4,[5],12:i:- (2%) | Mbandaka (5%) | Mbandaka (9%) | Infantis (9% ) | Albany (15%) | ||||
| Anatum, Bareilly, Chailey, Hadar, Heidelberg,IIIB 48:L,V:Z, IIIB 50:K:Z,IIIB 61:L,V:1,5,7:[Z57], Infantis, Javiana, Mbandaka, Paratyphi A, Reading, Schwarzengrund (1% each) | Anatum, Infantis (3% each) | Infantis (6%) | Mbandanka (8%) | Agona (11%) | ||||
| Senftenberg (6%) | Anatum, Reading (9% each) | |||||||
| Alberta | ||||||||
| (n=167) | (n=24) | (n=29) | (n=3) | (n=60) | (n=8) | (n=1) | (n=2) | |
| Enteritidis (56%) | Enteritidis (54%) | Enteritidis (48%) | Dublin (100%) | Enteritidis (58%) | Brandenburg, Derby, Enteritidis (25% each) | Ohio (100%) | No sampling conducted for this commodity | Rubislaw (100%) |
| Typhimurium (8%) | Braenderup (21%) | Kentucky (17%) | Kentucky (17%) | |||||
| Heidelberg, Infantis (5% each) | Kentucky (17%) | Heidelberg (14%) | Mbandanka (8%) | |||||
| 4,[5],12:i:-, Paratyphi B var. Java, Saintpaul (2% each) | Heidelberg, Typhimurium (4% each) | Typhimurium (10%) | Infantis (7%) | Mbandaka, Worthington (13% each) | ||||
| Braenderup, Hadar, Haifa, 4,[5],12:b:-, Indiana, Newport, Reading, Weltevreden (1% each) | Braenderup (7%) | Braenderup (3%) | ||||||
Whole genome sequencing (WGS)
In May 2017, whole genome sequencing (WGS) was implemented across Canada as the primary molecular tool for further differentiating Salmonella strains causing human salmonellosis, including cases captured within FoodNet Canada’s sentinel sites. This was followed in June by the implementation of WGS for further subtyping of all Salmonella isolates recovered from samples collected through FoodNet Canada’s retail, farm and water components. The analysis of Salmonella WGS information from non-clinical isolates collected by FoodNet Canada is conducted on a weekly basis by PHAC’s National Microbiology Laboratory together with human isolates submitted by provincial laboratories across Canada to assist in surveillance and outbreak detection activities. This integration of data has presented new opportunities in understanding the movement of Salmonella from farm to fork.
In 2017 there were a total of 176, 301and 13 Salmonella isolates recovered from retail, animal manure (including egg layers data) and water samples, respectively, collected across all three sentinel sites (Table 2.4 and Table 2.5). Of these, 260 Salmonella isolates were sequenced and analyzed against human strains to determine their relatedness and inform the assessment of human clusters. A “cluster” consists of two or more isolates, whether human or non-human, found to be within 0 and 10 alleles of each other. Anything beyond 10 alleles is not considered a “cluster” and not further assessed for relatedness. Salmonella isolated from chicken manure, chicken products and turkey manure samples were found to be related to a total of 37 human clusters (Table 2.5), while no matches were observed with Salmonella recovered from swine and cattle manure samples (Table 2.4). Fourteen of the 37 multijurisdictional (cases from two or more provinces) Salmonella clusters contained isolates recovered from frozen raw breaded chicken products and human cases only, while five clusters included Salmonella isolates recovered from frozen raw breaded chicken products, skinless chicken breast, water and farm (chicken and turkey) manure samples (Table 2.4). The inclusion of retail products in human clusters informed hypothesis generating processes, allowing the investigations to be more focused on specific products and assisting in providing the information required for product recalls to be conducted.
As observed in Table 2.5, S. Enteritidis is the most common serovar isolated from chicken retail and manure samples, representing 43% of all salmonellae recovered from these sources. As such, it is not surprising that the majority of the SE isolates (91% of isolates) are found to be related to human SE clusters (Table 2.4) while other serovars recovered from these products are less likely (30% of isolates) to be identified within human clusters. Similarly, SE isolates recovered from the non-clinical samples of the FoodNet Canada surveillance system were identified to be part of 33 multijurisdictional clusters in 2017 compared to 20 clusters for isolates identified as other Salmonella serovars (Table 2.4). While no SE was recovered from manure samples collected from turkey farms, other serovars such as S. Muenchen, Hadar, Heidelberg and Reading were identified and found to be part of multijurisdictional clusters.
| Salmonella | Number of isolates recovered | Number of isolates sequenced | Number of isolates found to be related to a human isolate as part of a multijurisdictional* Salmonellacluster | Number of Salmonella multijurisdictional* clusters non-clinical Salmonella isolates were found to be related to in 2017 |
|---|---|---|---|---|
| Skinless chicken breast products | ||||
| Enteritidis | 36 | 34 | 34 | 12 |
| Other serovars | 39 | 36 | 14 | 7 |
| Frozen raw breaded chicken products | ||||
| Enteritidis | 41 | 37 | 27 | 17 |
| Other serovars | 53 | 47 | 11 | 6 |
| Ground veal meat products | ||||
| Enteritidis | 0 | 0 | 0 | 0 |
| Other serovars | 4 | 3 | 0 | 0 |
| Swine manure samples | ||||
| Enteritidis | 5 | 4 | 0 | 0 |
| Other serovars | 29 | 19 | 0 | 0 |
| Broiler chicken manure samples | ||||
| Enteritidis | 60 | 56 | 55 | 4 |
| Other serovars | 88 | 46 | 15 | 2 |
| Layer chicken manure samples | ||||
| Enteritidis | 0 | 0 | 0 | 0 |
| Other serovars | 5 | 4 | 0 | 0 |
| Turkey manure samples | ||||
| Enteritidis | 0 | 0 | 0 | 0 |
| Other serovars | 114 | 72 | 23 | 5 |
* Multijurisdictional cluster: a cluster consisting of cases from two or more provinces and/or territories.
| 37 Salmonella multijurisdictional clusters | |||||
|---|---|---|---|---|---|
| Number of Salmonella WGS clusters containing only the following samples | Frozen raw breaded chicken 14 clusters |
Skinless chicken breast 8 clusters |
Water samples 0 clusters |
Chicken manure samples 0 clusters |
Turkey manure samples 3 clusters |
| Number of Salmonella WGS clusters containing a combination of the following samples | Frozen raw breaded chicken & skinless chicken breast 1 cluster |
Skinless chicken breast & chicken manure 4 clusters |
Frozen raw breaded chicken & turkey manure 1 cluster |
Chicken and turkey manure 1 cluster |
Frozen raw breaded chicken, skinless chicken breast, water and chicken manure 5 clusters |
Public health impact
Regional differences are present in the prevalence of Salmonella across all surveillance components:
- Recovery of S. Enteritidis in chicken manure samples in the Alberta site increased significantly from 8% in 2016 to 29% in 2017.
Implementation of whole genome sequencing has highlighted the burden of illness associated with chicken products across Canada:
- Over 73% of SE isolates recovered from chicken products were found to be genetically related to human cases of SE nationally, compared to <40% of other serovars.
Surveillance data collected by FoodNet Canada in 2017 continues to show regional differences in Salmonella prevalence across the surveillance components. Among human endemic cases, higher incidence rates of SE infections were observed in the BC and AB sites, while the lowest incidence rate was reported in the ON site. Overlap between the common serovars identified in humans and across the food sector occurred within all these regions. In 2017, a large increase in the proportion of chicken manure samples positive for SE was observed in the Alberta site, where the proportion significantly increased from 8% in 2016 to 29%, while the human incidence and proportion of SE among chicken breast samples remained relatively the same.
Although not all of the Salmonella serovars have the same ability to cause human illness, it is important to conduct ongoing surveillance across the food chain to better understand trends over time and identify any emerging public health issues. Salmonella Kentucky continues to be among the top 3 serovars recovered from chicken retail and manure samples collected in 2017, while causing little to no human illness (Table 2.3). Similarly it was identified that ground veal products pose little risk of salmonellosis to Canadians, as only four Salmonella Dublin isolates were recovered from the 344 samples collected across all three sentinel sites.
The ability of FoodNet Canada to contribute to the better understanding of Salmonella transmission from farm to fork increased in 2017 with the implementation of WGS. The timely analysis of national human strains together with food, animal and environmental isolates obtained through FoodNet Canada allowed public health professionals to better assess possible sources of exposure for cases found to be closely related genetically and part of clusters. While there are a variety of Salmonella serovars isolated from poultry products, it is important to note that the majority of the clusters that contained a non-clinical isolate were for SE strains. Fifty-five out of the 56 SE isolates that were recovered and sequenced from broiler chicken farms were found to be related to a human isolate as part of a multijurisdictional Salmonella cluster, highlighting the importance of understanding transmission routes through the food chain for implementing future interventions. Similarly, all of the sequenced SE isolates from frozen raw breaded chicken products were found to be related to human cases identified as part of multijurisdictional clusters. During 2017 there were two clusters containing FoodNet Canada samples of frozen raw breaded chicken products which led to national recallsFootnote 3, Footnote 4. The integration of WGS data has allowed public health to better understand the burden posed by chicken products to the health of Canadians. This has also provided evidence to address this issue with regulators and industry to work collaboratively towards reducing this burden over time.
Shigatoxigenic Escherichia coli (STEC)
Human surveillance summary
| Ontario site | Alberta site | British Columbia site |
All sites | |||||
|---|---|---|---|---|---|---|---|---|
| 2016 | 2017 | 2016 | 2017 | 2016 | 2017 | 2016 | 2017 | |
| Endemic | 0.62 | 0.00 | 2.72 | 2.59 | 1.25 | 2.68 | 1.86 | 1.99 |
| Travel | 0.00 | 0.21 | 0.68 | 0.38 | 0.00 | 0.00 | 0.35 | 0.25 |
| Outbreak | 0.00 | 0.21 | 1.26 | 1.25 | 0.00 | 0.41 | 0.65 | 0.79 |
| Non-endemic | 0.00 | 0.00 | 0.00 | 0.00 | 0.00 | 0.00 | 0.00 | 0.00 |
| Lost to follow-up | 0.00 | 0.00 | 0.29 | 0.19 | 0.00 | 0.00 | 0.15 | 0.10 |
| Total | 0.62 | 0.41 | 4.96 | 4.41 | 1.25 | 3.09 | 3.01 | 3.13 |
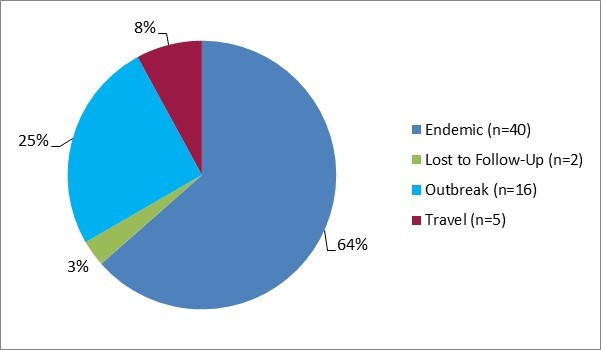
Figure 3.1 - Text description
Figure 3.1 shows a pie chart of the relative proportion of STEC cases in the FoodNet Canada surveillance system by case classification of endemic, lost to follow-up, outbreak and travel) for 2017. The chart includes the case classification, the number of cases and the relative proportion.
| Case classification | Number of cases | Relative proportion |
|---|---|---|
| Endemic | 40 | 64% |
| Lost to follow-Up | 2 | 3% |
| Outbreak | 16 | 25% |
| Travel | 5 | 8% |
Isolates with serotype information: 60/63 (95%)
STEC serotypes:
- O157:H7 (63%)
- O121:H19 (13%)
- O26:H11 (7%)
- O157:NM (5%)
- O103:H25 (2%)
- O186:H2 (2%)
- O26:NM (2%)
- O52:H45 (2%)
- O undetermined:H16 (2%)
- O117:H undetermined (2%)
- O121:H undetermined (2%)
Significant changes in endemic, travel, and total incidence rates:
- There were no significant changes from 2016 to 2017.
Clinical profile (endemic cases only):
- Most commonly reported symptoms:
- Diarrhea: 100%
- Abdominal pain: 80%
- Bloody diarrhea: 73%
- Fatigue: 65%
- Weakness: 60%
- Indicators of severity:
- Emergency room visits: 75%
- Hospitalizations: 33%
- Antimicrobial prescriptions: 13%
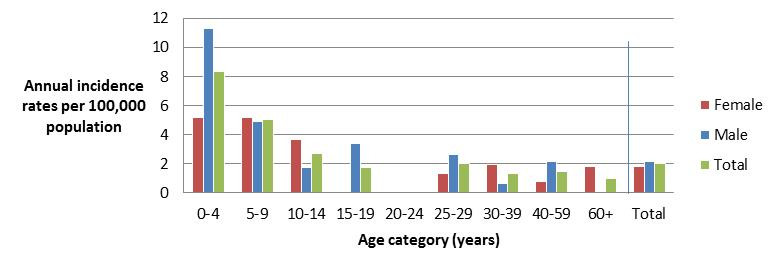
Figure 3.2 - Text description
Figure 3.2 shows a bar chart of the annual incidence rate of STEC per 100,000 population by overall total age category and by age category and gender for 2017. The y-axis presents the incidence rate per 100,000 population and the x-axis presents the age categories. The bars represent the total incidence for all genders by age group as well as the total incidence of male and female separately by age category.
| Age category | Female | Male | Overall total (all genders combined) |
|---|---|---|---|
| 0 to 4 | 5.153 | 11.332 | 8.334 |
| 5 to 9 | 5.213 | 4.875 | 5.039 |
| 10 to 14 | 3.696 | 1.737 | 2.686 |
| 15 to 19 | 0.000 | 3.397 | 1.745 |
| 20 to 24 | 0.000 | 0.000 | 0.000 |
| 25 to 29 | 1.344 | 2.619 | 1.990 |
| 30 to 39 | 1.945 | 0.648 | 1.296 |
| 40 to 59 | 0.748 | 2.183 | 1.476 |
| 60+ | 1.846 | 0.000 | 0.978 |
| Overall total (all ages combined) |
1.793 | 2.180 | 1.987 |
Food, animal and environmental surveillance summary
| Sample type | Ontario site | Alberta site | British Columbia site | All sites | |
|---|---|---|---|---|---|
| Ground beef | 3.8% (5/132) | 3.3% (4/121) | 0.8% (1/129) | 2.6% (10/382) | |
| Veal | 7.0% (8/115) | 5.5% (5/91) | 5.5% (7/128) | 6.0% (20/334) | |
| Feedlot beef manure | Sample-level | NT | 17.1% (13/76) | NT | - |
| Farm-level | NT | 54.6% (6/11) | NT | - | |
| Irrigation water | NT | 50.0% (16/32) | 26.2% (22/84) | 32.8% (38/116) | |
NT- not tested.
Retail Ground Beef:
- No samples tested positive for serotype O157:H7 or any of the seven priority types (O157, O26, O45, O103, O111, O121, O145) in 2017.
- Four samples tested positive for STEC in AB in 2017 compared to zero samples in 2016.
Retail Veal:
- One sample tested positive for serotype O157:H7 and one sample tested positive for 0111:NM. The remaining 18 STEC isolates had serotypes not identified as any of the seven priority types.
Feedlot Beef Manure:
- One sample tested positive for STEC O157:H7 and an additional sample tested positive for STEC serotype O157:NM.
- One additional sample was positive for STEC serotype O145:NM. The remaining STEC positive isolates had serotypes that were not part of the seven priority types.
- Irrigation Water:
- Seven STEC positive samples had serotypes identified as priority types, including O26, O45, O103, O121, and O145. The remaining positive isolates had serotypes that were not identified as a priority type.
Public health impact
Shigatoxigenic Escherichia coli (O157:H7 and non-O157:H7 serotypes) infections continue to be primarily domestically acquired, as demonstrated by the low number of travel-related cases (8%) in 2017. The majority of clinical cases were E. coli O157, however, less E. coli O157 was reported among clinical cases in 2017 (68%) compared to 2016 (77%), and more E. coli non-O157 (32%) was reported in 2017 compared to previous surveillance years (20% in 2016). Similar trends have been observed in NESP with reported annual rates of E. coli O157 decreasing in 2017 (0.95 per 100,000 population) compared to 2016 (1.14 per 100,000 population)Footnote 5. Although there are over 200 different non-O157 serotypes that have been associated with human illnessFootnote 6, six of these have been prioritized as they are most frequently implicated with STEC illness worldwide: serogroups O26, O45, O103, O111, O121 and O145 (2010 VTEC WG report)Footnote 7. In NESP, among non-O157 isolates, 44% of these were represented by 5 serotypes including E. coli O121, E. coli O26, E. coli O103, E. coli O111, and E. coli O145 in 2017Footnote 5. For FoodNet Canada, serotypes O26, O103 and O121 were identified among both human cases and irrigation water, while O145 was identified in both feedlot beef manure samples and irrigation water, representing potential environmental exposure sources. For the other non-O157 STEC serotypes, there was overlap between irrigation water and feedlot beef manure samples in the AB site, with O168:H8 and O132:NM identified in both sources which could suggest possible contamination from farm runoff sources. There was also overlap with subtype O157 among human isolates and feedlot beef manure and retail veal samples.
For the 2017 sampling year, veal was selected as the targeted meat product due to knowledge gaps regarding pathogen levels in Canadian veal and the increased availability of veal in grocery stores. Results from the testing identified veal as a potential source of STEC in Canada, showing a higher prevalence (6%) compared to ground beef (3%). The majority of positive veal samples were non-O157; however, only one sample was positive for serotype O111 which is considered a priority serotype. One veal sample tested positive for E. coli O157:H7 which prompted a recall by CFIA of ground lean veal from supermarket locations in OntarioFootnote 8. In addition to comparing carriage of STEC between veal and ground beef, the information collected will allow for the assessment of antimicrobial resistant organisms present in veal for which we currently have little information in Canada.
The lack of overlap in non-O157 STEC serotypes between food samples and clinical isolates could be due to under-detection of these pathogens as few clinical laboratories routinely test for non-O157 STEC. However, these products should still be considered as potential sources of illness in Canada and further subtyping of non-O157 STEC clinical isolates should be undertaken, whether they are identified through direct culture or culture independent diagnostic testing. Non-shigatoxin producing E. coli O157 was identified in feedlot and retail beef samples which is not uncommon but are known to be capable of becoming STEC O157Footnote 9. In addition, a recent multi-provincial outbreak in Canada associated with E. coli O121 was linked to various flour and flour products in 2017Footnote 10.
Listeria monocytogenes
| Ontario site | Alberta site | British Columbia site |
All sites | |||||
|---|---|---|---|---|---|---|---|---|
| 2016 | 2017 | 2016 | 2017 | 2016 | 2017 | 2016 | 2017 | |
| Endemic | 0.00 | 0.00 | 0.19 | 0.00 | 0.21 | 0.00 | 0.15 | 0.00 |
| Travel | 0.00 | 0.00 | 0.00 | 0.00 | 0.00 | 0.00 | 0.00 | 0.00 |
| Outbreak | 0.42 | 0.00 | 0.00 | 0.00 | 0.00 | 0.00 | 0.10 | 0.00 |
| Non-endemic | 0.00 | 0.00 | 0.00 | 0.00 | 0.00 | 0.00 | 0.00 | 0.00 |
| Lost to follow-up | 0.00 | 0.21 | 0.00 | 0.10 | 0.00 | 0.00 | 0.00 | 0.10 |
| Total | 0.42 | 0.21 | 0.19 | 0.10 | 0.21 | 0.00 | 0.25 | 0.10 |
Significant changes in endemic, travel, and total incidence rates:
- There were no significant changes from 2016 to 2017.
| Sample type | Ontario site | Alberta site | British Columbia site |
All sites |
|---|---|---|---|---|
| Chicken breast | 12% (16/132 | 19% (24/126) | 27% (35/132) | 19% (75/390) |
| Frozen raw breaded chicken products | 25% (33/131) | 27% (34/128) ↑ | 27% (36/132) ↑ | 26% (103/391) ↑ |
| Ground beef | 24% (32/132) | 17% (22/127) | 28% (37/132) | 23% (91/391) |
| Veal a | 8% (9/115) | 6% (6/98) | 3% (4/131) | 6% (19/344) |
| Frozen berries | 0% (0/199) | 0% (0/201) | 0% (0/205) | 0% (0/605) |
↑ Indicates a significant increase in prevalence since 2016.
a Types of veal sampled in 2017 were chops, cutlet, ground, liver, other cuts, scallopini, steak, and stew chunks.
Significant differences in prevalence since 2016:
- Frozen Raw Breaded Chicken Products:
- L. monocytogenes prevalence was significantly higher in frozen raw breaded chicken products sampled in all sites combined in 2017 (26%) compared to 2016 (14%).
- L. monocytogenes prevalence was significantly higher in the BC site in 2017 (27%) compared to 2016 (13%).
- L. monocytogenes prevalence was significantly higher in the AB site in 2017 (27%) compared to 2016 (14%).
Notable findings:
- No frozen berries sampled tested positive for L. monocytogenes in 2017. Presence of L. monocytogenes was tested previously on fresh cut fruit and fresh berries in 2014 and 2015, with a prevalence of 0.2% and 0%, respectively.
Regional differences:
- The BC site had a significantly higher prevalence of L. monocytogenes (27%) in chicken breast samples compared to the ON site (12%)
Public health impact
In 2017, retail sampling for Listeria monocytogenes consisted of raw meat products (chicken breast, ground beef, veal, and frozen raw breaded chicken products (FRBCP)) as well as frozen berries. While the proportion of FRBCP testing positive for L. monocytogenes remained stable from 2014 to 2016, a significant increase was observed between 2016 and 2017 (Figure 4.1). Both the BC and AB sentinel sites observed statistically significant increases in the proportion of FRBCP testing positive, while the increase in the proportion of positive samples in the ON site was not found to be statistically significant. Looking at trends in chicken breast samples tested for L. monocytogenes over time, a significant increase was found in the proportion of chicken breast samples testing positive for this commodity between 2015 and 2016, but this trend did not continue in 2017 (Figure 4.2).
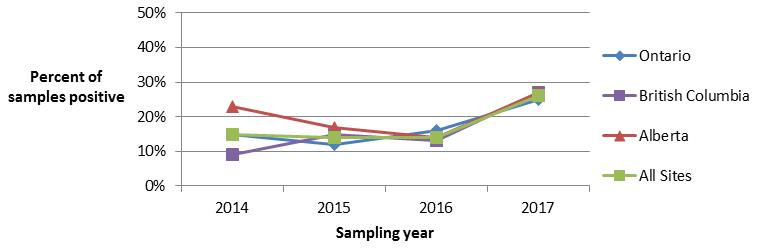
Figure 4.1 - Text description
Figure 4.1 shows a line graph with four lines. The line graph is the proportion of retail frozen raw breaded chicken product samples positive for Listeria monocytogenes (y-axis) by sampling year (x-axis) for each of the individual sentinel sites (Ontario, British Columbia, and Alberta) and for all three sentinel sites combined (referred to as ‘All Sites’), from 2014 to 2017.
Figure 4.1. Proportion d’échantillons de produits à base de poulet panés crus et congelés contaminés par Listeria monocytogenes
| All Sites | Ontario | British Columbia | Alberta | |
|---|---|---|---|---|
| 2014 | 0.15 | 0.15 | 0.09 | 0.23 |
| 2015 | 0.14 | 0.12 | 0.15 | 0.17 |
| 2016 | 0.14 | 0.16 | 0.13 | 0.14 |
| 2017 | 0.26 | 0.25 | 0.27 | 0.27 |
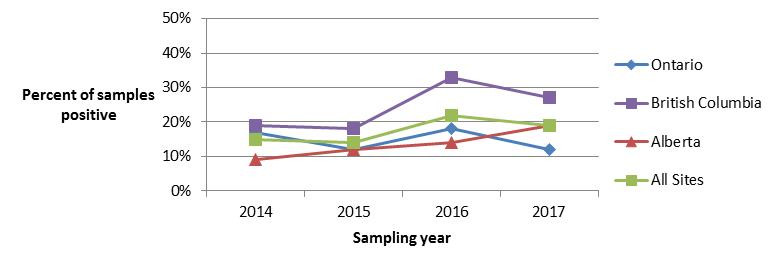
Figure 4.2 - Text description
Figure 4.2. Figure 4.2 shows a line graph with four lines. The line graph is the proportion of retail chicken breast samples positive for Listeria monocytogenes (y-axis) by sampling year (x-axis) for each of the individual sentinel sites (Ontario, British Columbia, and Alberta) and for all three sentinel sites combined (referred to as ‘All Sites’), from 2014 to 2017.
Figure 4.2. Proportion of retail chicken breast samples positive for Listeria monocytogenes in each FoodNet Canada sentinel site and across all sites from 2014 to 2017.
| All Sites | Ontario | British Columbia | Alberta | |
|---|---|---|---|---|
| 2014 | 0.15 | 0.14 | 0.19 | 0.09 |
| 2015 | 0.14 | 0.12 | 0.18 | 0.12 |
| 2016 | 0.22 | 0.18 | 0.33 | 0.14 |
| 2017 | 0.19 | 0.12 | 0.27 | 0.19 |
The proportion of ground beef samples positive for L. monocytogenes continues to be high, with 23% of samples testing positive across all sites in 2017, compared with 22% in 2016. Looking at previous years of testing, 29% of ground beef samples tested positive for L. monocytogenes in 2015, a significant increase from 12% in 2014 (Figure 4.3). As members of the general public may not be aware that ground beef is a high risk product for Listeria monocytogenes contamination, this represents an opportunity for targeted consumer education efforts, particularly towards high risk populations such as pregnant women and their unborn children, the elderly, and those who are immunocompromisedFootnote 11.
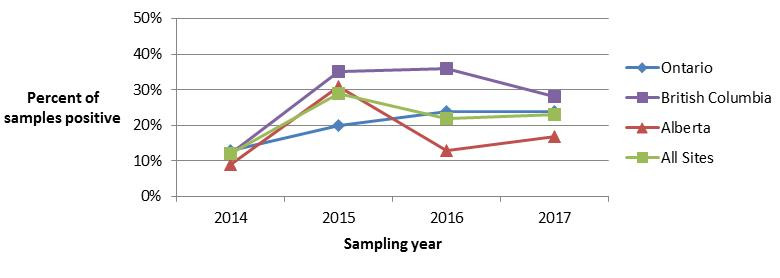
Figure 4.3 - Text description
Figure 4.3. Figure 4.3 shows a line graph with four lines. The line graph is the proportion of retail ground beef samples positive for Listeria monocytogenes (y-axis) by sampling year (x-axis) for each of the individual sentinel sites (Ontario, British Columbia, and Alberta) and for all three sentinel sites combined (referred to as ‘All Sites’), from 2014 to 2017.
Figure 4.3. Proportion of ground beef samples positive for Listeria monocytogenes in each FoodNet Canada sentinel site and across all sentinel sites from 2014 to 2017.
| All Sites | Ontario | British Columbia | Alberta | |
|---|---|---|---|---|
| 2014 | 0.12 | 0.13 | 0.12 | 0.09 |
| 2015 | 0.29 | 0.20 | 0.35 | 0.31 |
| 2016 | 0.22 | 0.24 | 0.36 | 0.13 |
| 2017 | 0.23 | 0.24 | 0.28 | 0.17 |
All retail products sampled in 2017 were collected from either independent stores, such as butcher shops, or chain grocery stores. The proportion of both ground beef and veal samples testing positive for L. monocytogenes was found to be significantly higher among samples collected from independent stores compared to chain grocery stores. No significant differences were found among chicken breast samples collected at independent stores compared with chain grocery stores in 2017 (Figure 4.4). Furthermore, no significant differences were found when comparing 2017 to 2016 results by commodity and store type (e.g. chicken breast samples collected from independent stores in 2017 compared with 2016). Among veal samples collected from both store types, samples that were from an establishment with an unknown inspection jurisdiction were significantly more likely to test positive for L. monocytogenes compared with samples from establishments known to be federally inspected.
Table 4.3Comparison of Listeria monocytogenes prevalence in samples collected at independent stores and chain grocery stores, FoodNet Canada 2017. .
| Independent stores | Chain grocery stores | |
|---|---|---|
| Chicken breast | 25% | 17% |
| Ground beef | 35% | 19% |
| Veal | 17% | 3% |
Yersinia
| Ontario site | Alberta site | British Columbia site |
All sites | |||||
|---|---|---|---|---|---|---|---|---|
| 2016 | 2017 | 2016 | 2017 | 2016 | 2017 | 2016 | 2017 | |
| Endemic | 0.62 | 0.41 | 1.95 | 1.25 | 9.34 | 14.21↑ | 3.41 | 4.17 |
| Travel | 0.00 | 0.41 | 0.68 | 0.48 | 1.66 | 2.26 | 0.75 | 0.89 |
| Outbreak | 0.00 | 0.00 | 0.00 | 0.00 | 0.00 | 0.00 | 0.00 | 0.00 |
| Non-endemic | 0.00 | 0.00 | 0.00 | 0.00 | 0.21 | 0.00 | 0.05 | 0.00 |
| Lost to follow-up | 0.42 | 0.21 | 0.39 | 0.10 | 2.70 | 2.06 | 0.95 | 0.60 |
| Total | 1.04 | 1.03 | 3.02 | 1.82 | 13.91 | 18.53 | 5.17 | 5.66 |
↑ Indicates a significant increase in prevalence since 2016.
a AB site does not include or follow-up Yersinia Intermedia cases
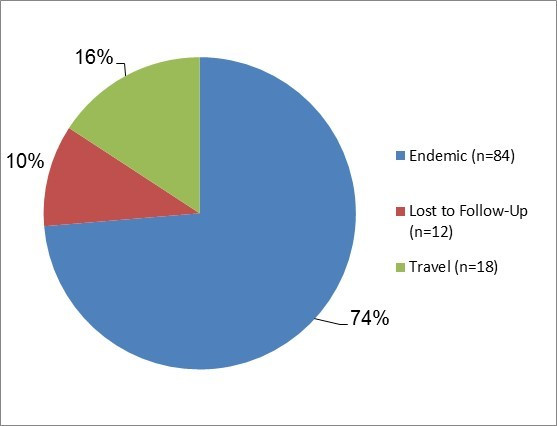
Figure 5.1 - Text description
Figure 5.1. Figure 5.1 shows a pie chart of the relative proportion of Yersinia cases in the FoodNet Canada surveillance system by case classification of endemic, lost to follow-up, outbreak and travel) for 2017. The chart includes the case classification, the number of cases and the relative proportion.
| Case Classification | Number of cases | Relative proportion |
|---|---|---|
| Endemic | 84 | 74% |
| Lost to Follow-Up | 12 | 10% |
| Travel | 18 | 16% |
Isolates with species information: 114/114 (100%)
Top Yersinia subtypes:
- Enterocolitica: (92%)
- Frederiksenii: (3%)
- Pseudotuberculosis: (3%)
- Intermedia: (2%)
- Kristensenii (1%)
Significant changes in endemic, travel, and total incidence rates:
- There was a significant increase in the BC site endemic incidence rate between 2016 and 2017.
Clinical profile (endemic cases only):
- Most commonly reported symptoms
- Diarrhea: 79%
- Abdominal pain: 68%
- Fatigue: 43%
- Anorexia: 38%
- Weakness: 36%
- Indicators of severity:
- Bloody diarrhea: 17%
- Emergency room visits: 14%
- Hospitalizations: 4%
- Antimicrobial prescriptions: 26%
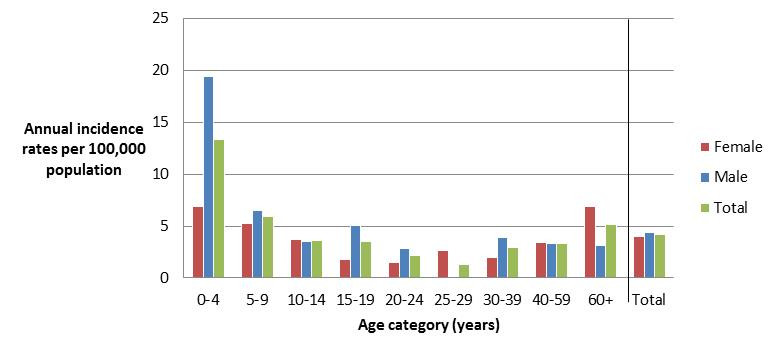
Figure 5.2 - Text description
Figure 5.2. Figure 5.2 shows a bar chart of the annual incidence rate of Yersinia per 100,000 population by overall total age category and by age category and gender for 2017. The y-axis presents the incidence rate per 100,000 population and the x-axis presents the age categories. The bars represent the total incidence for all genders by age group as well as the total incidence of male and female separately by age category.
| Age category | Female | Male | Overall total (all genders combined) |
|---|---|---|---|
| 0 to 4 | 6.871 | 19.427 | 13.335 |
| 5 to 9 | 5.213 | 6.501 | 5.878 |
| 10 to 14 | 3.696 | 3.475 | 3.582 |
| 15 to 19 | 1.794 | 5.096 | 3.490 |
| 20 to 24 | 1.518 | 2.797 | 2.183 |
| 25 to 29 | 2.687 | 0.000 | 1.326 |
| 30 to 39 | 1.945 | 3.888 | 2.916 |
| 40 to 59 | 3.367 | 3.274 | 3.320 |
| 60+ | 6.924 | 3.119 | 5.134 |
| Overall total (all ages combined) |
3.984 | 4.360 | 4.172 |
Public health impact
The BC site incidence rate for endemic cases of yersiniosis has significantly increased since 2016 due to laboratory methodology changes related to the use of cold enrichment testing introduced, together with the testing of all stool samples for Yersinia as of June 2016Footnote 12. Yersiniosis is not a nationally-notifiable disease, making a national incidence rate unavailable for comparison. However, based on FoodNet Canada’s results, yersiniosis appears to be predominantly a domestically-acquired infection, as demonstrated by the low proportion of travel-related cases (16%).
The contribution of food and animals to the incidence of human yersiniosis is unclear. Testing retail pork for Yersinia was discontinued in 2016 due to low prevalence of human-pathogenic strains recovered from pork. Similarly, in 2012, testing for Yersinia ceased across all commodities in the FoodNet Canada farm component as a result of the low prevalence detection. To determine likely sources of exposures it is important to continue collecting enhanced case level information on Yersinia cases, such as food and water exposures, to help determine and monitor which sources may be contributing to human infections in Canada.
Shigella
| Ontario site | Alberta site | British Columbia site |
All sites | |||||
|---|---|---|---|---|---|---|---|---|
| 2016 | 2017 | 2016 | 2017 | 2016 | 2017 | 2016 | 2017 | |
| Endemic | 0.83 | 0.21 | 0.88 | 0.77 | 0.62 | 1.85 | 0.80 | 0.89 |
| Travel | 0.62 | 1.03 | 0.78 | 0.38 | 1.25 | 1.85 | 0.85 | 0.89 |
| Outbreak | 0.00 | 0.00 | 0.00 | 0.00 | 0.00 | 0.00 | 0.00 | 0.00 |
| Non-endemic | 0.00 | 0.00 | 0.00 | 0.00 | 0.00 | 0.00 | 0.00 | 0.00 |
| Lost to follow-up | 0.00 | 0.00 | 0.00 | 0.10 | 0.00 | 0.00 | 0.00 | 0.05 |
| Total | 1.45 | 1.24 | 1.65 | 1.25 | 1.87 | 3.71 | 1.66 | 1.84 |
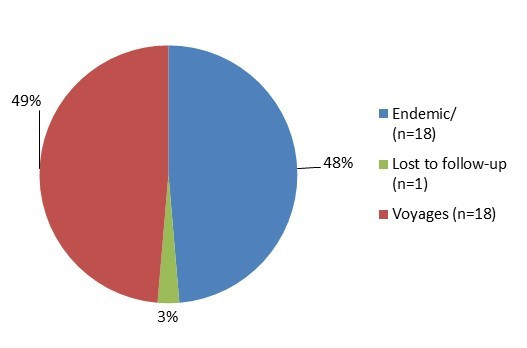
Figure 6.1 - Text description
Figure 6.1. Figure 6.1 shows a pie chart of the relative proportion of shigellosis cases in the FoodNet Canada surveillance system by case classification of endemic, lost to follow-up and travel for 2017. The chart includes the case classification, the number of cases and the relative proportion of cases.
| Case Classification | Number of Cases | Relative Proportion |
|---|---|---|
| Endemic | 18 | 48.7% |
| Lost to follow-up | 1 | 2.7% |
| Travel | 18 | 48.7% |
Isolates with Shigella spp. information: 36/37 (97%)
- sonnei (58%)
- flexneri (31%)
- boydii (6%)
- dysenteriae (6%)
Significant changes in endemic, travel, and total incidence rates:
- There were no significant changes from 2016 to 2017.
Clinical profile:
- Most commonly reported symptoms
- Diarrhea: 100%
- Fever: 89%
- Abdominal pain: 83%
- Fatigue: 67%
- Indicators of severity:
- Bloody diarrhea: 56%
- Emergency room visits: 61%
- Hospitalizations: 22%
- Antimicrobial prescriptions: 78%
2017 travel cases: 18/37 (49%)
- Cases by region travelled to:
- Asia: 44%
- Americas (Central, South
and Caribbean): 39% - USA: 11%
- Africa: 6%

Figure 6.2 - Text description
Figure 6.2. Figure 6.2 shows a bar chart of the annual incidence rates of endemic shigellosis (per 100,000 population) cases by overall total age category and both genders combined, as well as by each age category and gender within all FoodNet Canada sentinel sites combined for 2017. The y-axis presents the incidence rate per 100,000 population and x-axis presents the age categories. The bars represent the total incidence for all genders by age category as well as the total incidence of male and female separately by age category.
| Gender | |||
|---|---|---|---|
| Age category (years) | Female | Male | Overall total (both genders combined) |
| 0-4 | 0.00 | 3.24 | 1.67 |
| 5-9 | 0.00 | 3.25 | 1.68 |
| 10-14 | 0.00 | 0.00 | 0.00 |
| 15-19 | 0.00 | 0.00 | 0.00 |
| 20-24 | 0.00 | 1.40 | 0.73 |
| 25-29 | 0.00 | 2.62 | 1.33 |
| 30-39 | 0.65 | 3.89 | 2.27 |
| 40-59 | 0.00 | 1.46 | 0.74 |
| 60+ | 0.00 | 0.00 | 0.00 |
| Overall total (all ages combined) | 0.10 | 1.68 | 0.89 |
Public health impact
Travel continues to be an important factor for Shigella exposure among human cases in 2017, with Asia and the Americas (Central, South, Caribbean) being the most frequently reported travel destinations. However, endemic cases in 2017 made up 49% of all cases, demonstrating an even split between endemic and travel-related cases, similar to what was seen in 2016. Due to low pathogen isolation among retail produce samples tested for Shigella in the past, FoodNet Canada no longer conducts routine testing for Shigella in retail samples. However, the collection of risk factor information for endemic cases, including exposure to daycares and contaminated food and water is important to continue investigating the sources of human illness in Canada.
Parasites and viruses
Giardia
| Ontario site | Alberta site | British Columbia site |
All sites | |||||
|---|---|---|---|---|---|---|---|---|
| 2016 | 2017 | 2016 | 2017 | 2016 | 2017 | 2016 | 2017 | |
| Endemic | 3.74 | 2.06 | 6.42 | 4.03 ↓ | 4.15 | 3.91 | 5.22 | 3.53 ↓ |
| Travel | 1.45 | 1.86 | 3.11 | 3.64 | 3.32 | 3.91 | 2.76 | 3.28 |
| Outbreak | 0.00 | 0.00 | 0.00 | 0.00 | 0.00 | 0.00 | 0.00 | 0.00 |
| Non-endemic | 0.00 | 0.62 | 2.24 | 1.92 | 1.25 | 0.62 | 1.46 | 1.29 |
| Lost to follow-up | 2.91 | 2.06 | 1.46 | 0.86 | 1.87 | 0.82 | 1.91 | 1.14 |
| Total | 8.10 | 6.61 | 13.23 | 10.45 | 10.59 | 9.26 | 11.35 | 9.24 ↓ |
↓ indicates a significant decrease in incidence since 2016
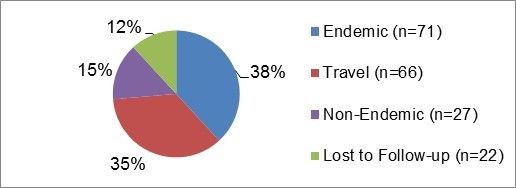
Figure 7.1 - Text description
Figure 7.1.Figure 7.1 shows a pie chart of the relative proportion of giardiasis cases in the FoodNet Canada surveillance system by case classification of endemic, lost to follow-up, non-endemic and travel for 2017. The chart shows the number of cases and the relative proportion in percent, by case classification.
| Case Classification | Number of cases | Relative proportion |
|---|---|---|
| Endemic | 71 | 38% |
| Lost to Follow-Up | 22 | 12% |
| Non-Endemic | 27 | 15% |
| Travel | 66 | 35% |
Significant changes in endemic, travel, and total incidence rates:
- There was a significant decrease in the AB site endemic rate from 2016 to 2017.
- There were significant decreases in the all sites endemic and total incidence rates from 2016 to 2017.
Clinical profile (endemic cases only):
- Most commonly reported symptoms
- Diarrhea: 82%
- Fatigue: 59%
- Abdominal pain: 58%
- Nausea: 52%
- Weakness: 51%
- Indicators of severity:
- Bloody diarrhea: 0%
- Emergency room visits: 14%
- Hospitalizations: 0%
- Antimicrobial prescriptions: 59%
2017 travel cases: 66/186 (35%)
- Cases by region travelled to:
- Asia: 52%
- Americas (Central, South
and Caribbean): 29% - USA: 6%
- Africa: 3%
- Multiple/Other: 3%
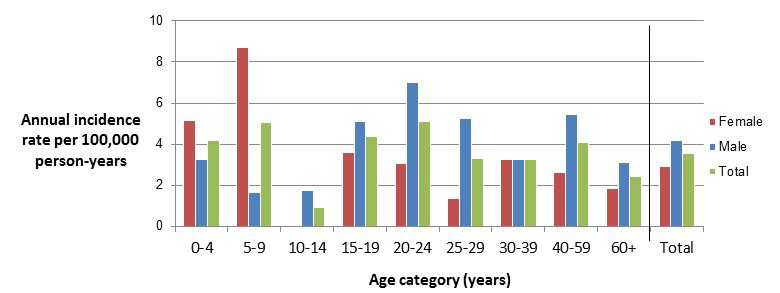
Figure 7.2 - Text description
Figure 7.2.Figure 7.2 shows a bar chart of the annual incidence rate of giardiasis per 100,000 by age category and gender for 2017. The y-axis presents the incidence rate per 100,000 population and the x-axis presents the age categories and gender combinations. There are three bars side-by-side for each age group: a bar representing females, a bar representing males and a bar representing the overall incidence of both genders combined. Age categories are defined by a range of years.
| Age category (years) | Female | Male | Overall total (all genders combined) |
|---|---|---|---|
| 0 to 4 | 5.15 | 3.24 | 4.17 |
| 5 to 9 | 8.69 | 1.63 | 5.04 |
| 10 to 14 | 0.00 | 1.74 | 0.90 |
| 15 to 19 | 3.59 | 5.10 | 4.36 |
| 20 to 24 | 3.04 | 6.99 | 5.09 |
| 25 to 29 | 1.34 | 5.24 | 3.32 |
| 30 to 39 | 3.24 | 3.24 | 3.24 |
| 40 to 59 | 2.62 | 5.46 | 4.06 |
| 60+ | 1.85 | 3.12 | 2.44 |
| Overall total (all ages combined) |
2.89 | 4.16 | 3.53 |
Cryptosporidium
| Ontario site | Alberta site | British Columbia site |
All sites | |||||
|---|---|---|---|---|---|---|---|---|
| 2016 | 2017 | 2016 | 2017 | 2016 | 2017 | 2016 | 2017 | |
| Endemic | 1.25 | 1.65 | 3.79 | 2.11 ↓ | 1.45 | 1.44 | 2.61 | 1.84 |
| Travel | 0.00 | 0.00 | 1.07 | 1.25 | 0.21 | 0.21 | 0.60 | 0.70 |
| Outbreak | 0.00 | 0.00 | 0.49 | 0.00 | 0.00 | 0.00 | 0.25 | 0.00 |
| Non-endemic | 0.00 | 0.00 | 0.10 | 0.00 | 0.00 | 0.00 | 0.05 | 0.00 |
| Lost to follow-up | 0.21 | 0.41 | 0.49 | 0.19 | 0.00 | 0.21 | 0.30 | 0.25 |
| Total | 1.45 | 2.06 | 5.93 | 3.55 ↓ | 1.66 | 1.85 | 3.82 | 2.78 |
↓ indicates a significant decrease in incidence since 2016
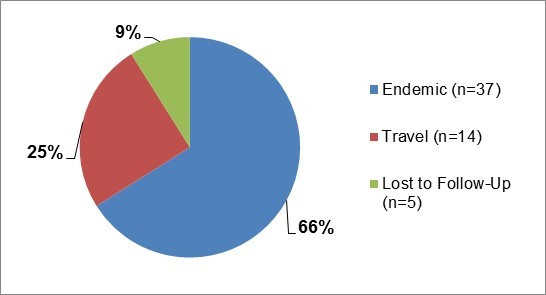
Figure 8.1 - Text description
Figure 8.1.Figure 8.1 shows a pie chart of the relative proportion of cryptosporidiosis cases in the FoodNet Canada surveillance system by case classification of endemic, lost to follow-up, and travel for 2017. The chart shows the number of cases and the relative proportion in percent, by case classification.
| Case Classification | Number of cases | Relative proportion |
|---|---|---|
| Endemic | 37 | 66% |
| Lost to Follow-Up | 5 | 9% |
| Travel | 14 | 25% |
Significant changes in endemic, travel, and total incidence rates:
- There were significant decreases in the AB site endemic and total incidence rates from 2016 to 2017.
2017 travel cases: 14/56 (25%)
- Cases by region travelled to:
- Americas (Central, South and Caribbean): 64%
- Asia: 21%
- Africa: 14%
Clinical profile (endemic cases only):
- Most commonly reported symptoms
- Diarrhea: 97%
- Abdominal pain: 65%
- Nausea: 65%
- Anorexia: 59%
- Indicators of severity:
- Bloody diarrhea: 8%
- Emergency room visits: 62%
- Hospitalizations: 11%
- Antimicrobial prescriptions: 19%
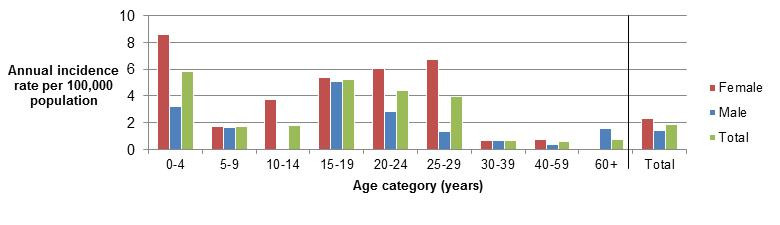
Figure 8.2 - Text description
Figure 8.2.Figure 8.2 shows a bar chart of the annual incidence rate of cryptosporidiosis per 100,000 by age category and gender for 2017. The y-axis presents the incidence rate per 100,000 population and the x-axis presents the age categories and gender combinations. There are three bars side-by-side for each age group: a bar representing females, a bar representing males and a bar representing the overall incidence of both genders combined. Age categories are defined by a range of years.
| Age category (years) | Female | Male | Overall total (all genders combined) |
|---|---|---|---|
| 0 to 4 | 8.59 | 3.24 | 5.83 |
| 5 to 9 | 1.74 | 1.63 | 1.68 |
| 10 to 14 | 3.70 | 0.00 | 1.79 |
| 15 to 19 | 5.38 | 5.10 | 5.24 |
| 20 to 24 | 6.07 | 2.80 | 4.37 |
| 25 to 29 | 6.72 | 1.31 | 3.98 |
| 30 to 39 | 0.65 | 0.65 | 0.65 |
| 40 to 59 | 0.75 | 0.36 | 0.55 |
| 60+ | 0.00 | 1.56 | 0.73 |
| Overall total (all ages combined) |
2.29 | 1.39 | 1.84 |
Cyclospora
| Ontario site | Alberta site | British Columbia site |
All sites | |||||
|---|---|---|---|---|---|---|---|---|
| 2016 | 2017 | 2016 | 2017 | 2016 | 2017 | 2016 | 2017 | |
| Endemic | 0.21 | 0.83 | 0.00 | 0.00 | 0.21 | 0.00 | 0.10 | 0.20 |
| Travel | 0.62 | 0.00 | 0.29 | 0.10 | 1.45 | 1.44 | 0.65 | 0.40 |
| Outbreak | 0.42 | 0.00 | 0.00 | 0.00 | 0.00 | 0.00 | 0.10 | 0.00 |
| Non-endemic | 0.00 | 0.00 | 0.00 | 0.00 | 0.00 | 0.00 | 0.00 | 0.00 |
| Lost to follow-up | 0.21 | 0.00 | 0.00 | 0.00 | 0.00 | 0.21 | 0.05 | 0.05 |
| Total | 1.45 | 0.83 | 0.29 | 0.10 | 1.66 | 1.65 | 0.90 | 0.65 |
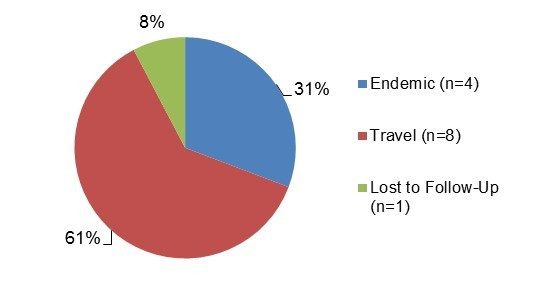
Figure 9.1 - Text description
Figure 9.1.Figure 9.1 shows a pie chart of the relative proportion of cyclosporiasis cases in the FoodNet Canada surveillance system by case classification of endemic, lost to follow-up, and travel for 2017. The chart shows the number of cases and the relative proportion in percent, by case classification.
| Case classification | Number of cases | Relative proportion |
|---|---|---|
| Endemic | 4 | 31% |
| Lost to follow-Up | 1 | 8% |
| Travel | 8 | 61% |
Significant changes in endemic, travel, and total incidence rates:
- There were no significant changes from 2016 to 2017.
2017 travel cases: 8/13 (62%)
- Cases by region travelled to:
- Americas (Central, South and Caribbean): 63%
- Asia: 25%
- Other: 13%
- Cases by country in the Americas region:
- Mexico: 80%
- Guatemala: 20%
Retail sampling summary
Viruses
Among the retail frozen berries sampled for viruses in 2017 by FoodNet Canada, norovirus was detected on one (1/603) sample. The sample was collected in the summer and the labelled country of origin was Peru. None of the retail frozen berries sampled were positive for Hepatitis A, rotavirus or Hepatitis E. Data on human viral cases is not currently collected by FoodNet Canada.
Public health impact
Among these travel cases, 63% reported travel to the Americas (Central, South and Caribbean) region. Mexico was the most common destination reported (80%) among these cases. All cases travelled to Mexico between May and July, with 75% of these cases reporting travel to Mexico’s east coast. These observations are consistent with the patterns noted in 2016 during this time period. The same observations have been made by Public Health England and have led to the issuance of guidance to travelers regarding CyclosporaFootnote 13,Footnote 14. Since an elevated risk of Cyclospora infection has been demonstrated in Canadian travelers returning from endemic countries, education on this topic is important to help keep Canadians safe while travelling to Cyclospora-endemic regions.
Appendices
Appendix A — non-human sample types tested in 2017
| Site | Retail | Farm | Water |
|---|---|---|---|
| British Columbia | Ground beef, skinless chicken breast, frozen raw breaded chicken products, veal, frozen berries | Broiler chickens & turkeys | Five sampling locations in the Sumas & Matsqui irrigation canals |
| Alberta | Ground beef, skinless chicken breast, frozen raw breaded chicken products, veal, frozen berries | Broiler chickens, swine, & feedlot beef | Eight sampling locations in the Western Irrigation District |
| Ontario | Ground beef, skinless chicken breast, frozen raw breaded chicken products, veal, frozen berries | Broiler chickens, swine, & turkeys |
Appendix B – abbreviations and references
Abbreviations
- AB
- Alberta
- BC
- British Columbia
- CFIA
- Canadian Food Inspection Agency
- CIPARS
- Canadian Integrated Program for Antimicrobial Resistance Surveillance
- ER
- Emergency Room
- FRBCP
- Frozen Raw Breaded Chicken Products
- NESP
- National Enteric Surveillance Program
- NML
- National Microbiology Laboratory
- NT
- Not Tested
- OMD
- Outbreak Management Division
- ON
- Ontario
- PHAC
- Public Health Agency of Canada
- SE
- Salmonella Enteritidis
- STEC
- Shigatoxigenic Escherichia coli
- WGS
- Whole Genome Sequencing
- USA
- United States of America
References
- Reference 1
-
Ravel A, Hurst M, Petrica N, David J, Mutschall SK, Pintar K, et al. Source attribution of human campylobacteriosis at the point of exposure by combining comparative exposure assessment and subtype comparison based on comparative genomic fingerprinting. PLoS ONE. 2017; 12(8): e0183790.
- Reference 2
-
Butler AJ, Thomas MK, Pintar KDM. Expert elicitation as a means to attribute 28 enteric pathogens to foodborne, waterborne, animal contact, and person-to-person transmission routes in Canada. Foodborne Pathogens and Disease. 2015; 12(4): 335-344.
- Reference 3
-
Government of Canada. Canada Food Inspection Agency Notice - Food Recall Warning - President's Choice brand Pub Recipe Chicken Nuggets recalled due to Salmonella. Available at: http://www.inspection.gc.ca/about-the-cfia/newsroom/food-recall-warnings/complete-listing/2017-07-12/eng/1499907815092/1499907818947. Accessed September 11, 2018.
- Reference 4
-
Government of Canada. Canada Food Inspection Agency Notice - Food Recall Warning - President's Choice brand Pub Recipe Chicken Nuggets recalled due to Salmonella. Available at: http://www.inspection.gc.ca/about-the-cfia/newsroom/food-recall-warnings/complete-listing/2017-07-12/eng/1499907815092/1499907818947. Accessed September 11, 2018.
- Reference 5
-
Government of Canada. National Enteric Surveillance Program Annual Summary 2017: Public Health Agency of Canada, Guelph, 2018.
- Reference 6
-
Catford A, Kouamé V, Martinez-Perez A, et al. Risk profile of non-O157 verotoxin producing Escherichia coli in produce, beef, milk and dairy products in Canada. International Food Risk Analysis Journal. 2014; 4:21. DOI: 10.5772/59208.
- Reference 7
-
Government of Canada. Report on the verotoxigenic E. coli risk identification and risk management workshop. November 1 & 2, 2010, Gatineau, Quebec. Prepared by the Federal VTEC Working Group, 2011.
- Reference 8
-
Government of Canada. Canada Food Inspection Agency Notice - Food Recall Warning - Ground Lean Veal recalled due to E. coli O157:H7. Available at: http://www.inspection.gc.ca/about-the-cfia/newsroom/food-recall-warnings/complete-listing/2017-11-08/eng/1510202540856/1510202544200?print=1. Accessed August 24, 2018.
- Reference 9
-
Wetzel AN, Lejeune JT. Isolation of Escherichia coli O157:H7 strains that do not produce Shiga toxin from bovine, avian and environmental sources. Letters in Applied Microbiology. 2007 Nov; 45(5):504-7.
- Reference 10
-
Government of Canada. Public Health Notice – Outbreak of E. coli infections linked to various flour and flour products. Final Update: June 2, 2017. Available at: https://www.canada.ca/en/public-health/services/public-health-notices/2017/public-health-notice-outbreak-e-coli-infections-linked-various-flours-flour-products.html. Accessed August 24, 2018.
- Reference 11
-
World Health Organization and Food and Agriculture Organization of the United Nations. Risk assessment of Listeria monocytogenes in ready-to-eat foods: microbiological risk assessment series 5. Geneva and Rome: WHO/FAO, 2004.Available at: http://www.fao.org/3/a-y5394e.pdf (PDF: 1.2 KB, 100 pages). Accessed August 27, 2018.
- Reference 12
-
Government of Canada. FoodNet Canada Annual Report 2016: Public Health Agency of Canada, Guelph, 2018.
- Reference 13
-
Government of the UK. Cyclospora: clinical and travel guidance. Available at: https://www.gov.uk/guidance/cyclospora-clinical-and-travel-guidance. Accessed April 16, 2018.
- Reference 14
-
Government of the UK. Cyclospora outbreak related to travel to Mexico (2017). Health Protection Report 2017: 11 (26). Available at: https://www.gov.uk/government/publications/health-protection-report-volume-11-2017/hpr-volume-11-issue-26-news-28-july#cyclospora-outbreak-related-to-travel-to-mexico-2017. Accessed August 27, 2018.