
FoodNet Canada annual report 2018
Download the entire report
(PDF format, 1.90 MB, 55 pages)
Organization: Public Health Agency of Canada
Type: Guidance
Published: December 2019
Cat.: HP37-17/1E-PDF
ISBN: 2292-8073
Pub.: 190367
Table of contents
- Foreword
- Acknowledgements
- Executive summary
- Information to the reader
- Campylobacter
- Salmonella
- Shigatoxigenic escherichia coli (STEC)
- Listeria monocytogenes
- Yersinia
- Shigella
- Parasites
- Targeted study: raw bivalve molluscs at retail
- Appendix A - Data collection and reporting
- Appendix B - Foodnet Canada sentinel site boundaries
- Appendix C - Non-human sample types tested in 2018
- Appendix D - Abbreviations and references
Foreword
The Public Health Agency of Canada's (PHAC) FoodNet Canada surveillance system is pleased to present the latest annual report which outlines the results of our surveillance activities conducted in 2018.
The report highlights FoodNet Canada findings from its sentinel sites in British Columbia, Alberta and Ontario. It focuses on trends in enteric pathogen disease rates, as well as trends in the prevalence of these pathogens found on potential disease sources: retail meats, manure from food producing animals and water. We also highlight the impact of enteric pathogen trends on public health.
It is our hope that this report will be used to inform and shape discussions on food safety issues regarding enteric diseases and their sources.
Acknowledgements
PHAC acknowledges the significant investments made by FoodNet Canada partners in the three sentinel sites, our provincial and federal government agency colleagues, and academic and industry collaborators who help to make this program a continued success.
Executive summary
The endemic incidence rate of campylobacteriosis in FoodNet Canada's three sentinel sites was not significantly different from 2017 to 2018. Campylobacter was frequently detected in 2018 on retail chicken breasts, and on farm it was found on broiler chicken, swine, turkey and feedlot beef manure. Campylobacter jejuni was the primary subtype identified in human cases, retail chicken samples, broiler chicken farms and turkey farms across all sentinel sites. Among human cases, Campylobacter coli is less commonly associated with disease. In 2018, it was also identified that pork sausage products pose little risk of campylobacteriosis to Canadians.
The overall endemic Salmonella incidence rate decreased in 2018. The incidence of Salmonella Enteritidis (SE), which is the most common Salmonella serovar reported in humans in Canada, also decreased in 2018 to the lowest overall incidence observed since 2015. This decrease seems to be driven by a significant decrease in the incidence of human SE illness in the British Columbia sentinel site. Regional differences in SE prevalence across all the surveillance components continued to be observed in 2018. Among human endemic cases, higher incidence rates of SE infections were observed in the British Columbia and Alberta sites, however, both rates decreased in 2018. The lowest incidence rate was reported in the Ontario site, which increased slightly since 2017. In the Ontario site, the prevalence of SE from chicken breast samples significantly increased since 2017, while the prevalence of SE in broiler chicken manure significantly increased between 2015 and 2018. As in 2017, the majority of human clusters identified through whole genome sequencing (WGS) that contained a non-clinical isolate were for SE strains. While the number of clusters containing turkey manure increased since 2017, the majority of clusters continued to be those including a combination of human isolates and frozen raw breaded chicken products. We will continue to track the burden of illness associated with frozen raw breaded chicken products in 2019, with new requirements in place to ensure Salmonella is not detectable in these products.
The majority of clinical cases of shigatoxigenic Escherichia coli (STEC) were domestically acquired in 2018, with a significant increase in both travel and endemic incidence rates. The increase in incidence was primarily driven by the Alberta sentinel site, which began testing all STEC-confirmed stool samples for non-O157 serogroups starting June 11, 2018 in addition to continuing O157 testing. Six serogroups have been prioritized with regards to human health: O26, O45, O103, O111, O121 and O145. Serogroups O26 and O121 were identified among both human cases and irrigation water, representing potential environmental exposure sources. There was also overlap with subtype O157 among human isolates and feedlot beef manure, and an O157:H7 positive ground beef sample collected from a farmers' market. Retail pork sausage had significantly higher prevalence of STEC as compared with ground beef. Retail meat samples collected from farmers' markets had higher STEC as compared with samples collected from independent and chain grocery stores.
Despite the significant increase in L. monocytogenes detected in frozen raw breaded chicken products between 2016 and 2017, the proportion in 2018 remained consistent with the previous year. However, the proportion of ground beef samples testing positive for L. monocytogenes continued to be high in 2018. Targeted consumer education efforts, particularly towards high risk populations (i.e. pregnant women, the elderly, and those who are immunocompromised) to increase awareness of raw or undercooked ground beef as a potential source of listeriosis, are warranted. Of the routinely sampled retail products (i.e. from independent or chain grocery stores), the proportion of both ground beef and pork sausage samples testing positive for L. monocytogenes was found to be significantly higher among samples collected from independent stores compared to chain grocery stores.
As in the previous year, travel-acquired infections constituted the majority of Cyclospora cases in 2018. Among these travel cases, 67% reported travel to the Americas (Central, South and Caribbean) region. Mexico was the most common destination reported (83%) among these cases. Education regarding safe food practices continues to be the best strategy to reduce the risk of Cyclospora infections in Canadian travelers.
Information to the reader
FoodNet Canada is a multi-partner sentinel site surveillance system led by the Public Health Agency of Canada (PHAC) that monitors trends in enteric pathogens in Canada.
In collaboration with public health jurisdictions and provincial public health laboratories, FoodNet Canada conducts continuous and episodic surveillance activities in three sentinel sites collecting information across four components: human, retail (meat and produce), on-farm (farm animals), and water. Continuous surveillance occurs throughout the year to identify trends in human disease occurrence, exposure sources, and attributes illnesses to sources and settings for targeted enteric pathogens. Information on the potential sources of risk to human health helps direct food and water safety actions and programming as well as public health interventions, and to evaluate their effectiveness. Specifically, FoodNet Canada's core objectives are to:
- determine what food and other sources are making Canadians ill;
- determine significant risk factors for enteric illness;
- accurately track enteric disease rates and risks over time; and
- provide practical prevention information to assist local and provincial public health officials to:
- prioritize risks;
- compare interventions, direct actions and advance policy; and
- assess effectiveness of food safety activities / public health interventions and measure performance.
This report draws on knowledge from a variety of sources to present a comprehensive and meaningful interpretation of trends and issues identified through FoodNet Canada data, as well as from collaborating programs within PHAC. Examples include:
- Centre for Foodborne, Environmental and Zoonotic Infectious Diseases (CFEZID):
- Foodborne Disease and Antimicrobial Resistance Surveillance Division (FDASD):
- Canadian Integrated Program for Antimicrobial Resistance Surveillance (CIPARS)
- National Enteric Surveillance Program (NESP),
- Enhanced National Listeriosis Surveillance Program
- Outbreak Management Division (OMD)
- Foodborne Disease and Antimicrobial Resistance Surveillance Division (FDASD):
- National Microbiology Laboratory (NML)
Information from these programs is used to support and enhance findings through the integration and assessment of relationships observed over time between human illness, contamination levels in retail foods, food-animal farm manure and water. Known interventions implemented within the food industry were also considered when interpreting surveillance trends.
For information on data collection and reporting and surveillance strategy please see Appendix A.
Definitions
- Endemic:
- Endemic case of disease are affected individuals who had an infection that was considered sporadic and domestically acquired (i.e. within Canada).
- Exposure:
- Point along the water-borne, food-borne, animal-to-person, or person-to-person transmission route at which people were suspected to have been exposed to a given pathogen.
- Travel:
- Travel-related cases of disease (excludes non-endemic cases) are individuals who travelled outside of Canada, and where the travel dates overlap with the expected disease incubation period (varies depending on the pathogen).
- Lost to follow-up:
- Includes cases that could not be followed up with an interview by public health.
- Non-endemic:
- Includes immigration-related cases where illness was acquired outside of Canada.
- Outbreak:
- Outbreak-related cases of disease are one of a number of affected individuals associated with an increased occurrence of the same infectious disease, whose illness is confirmed through a public health partner (ON, AB, and BC sentinel sites) on the basis of laboratory and/or epidemiological evidence.
- Shigatoxigenic Escherichia coli (STEC):
- Escherichia coli are normal intestinal inhabitants in humans and animals, and most strains do not cause enteric disease. However, the group of shigatoxigenic E. coli includes certain toxin-producing strains that can cause severe diarrhea and, in some people (particularly young children), a form of acute kidney failure called hemolytic uremic syndrome.
- Significant:
- The term "significant" in this report has been reserved for statistically significant findings (i.e. p < 0.05).
Campylobacter
Human surveillance summary
| N/A | Ontario site | Alberta site | British Columbia site | All sites | ||||
|---|---|---|---|---|---|---|---|---|
| 2017 | 2018 | 2017 | 2018 | 2017 | 2018 | 2017 | 2018 | |
| Endemic | 15.69 | 12.98 | 19.36 | 22.81 | 24.29 | 19.13 | 19.67 | 19.57 |
| Travel | 5.37 | 4.87 | 5.85 | 5.12 | 9.68 | 10.16 | 6.66 | 6.28 |
| Outbreak | 0 | 0 | 0 | 0.47 | 0 | 0 | 0 | 0.24 |
| Non-endemic | 0 | 0 | 0.19 | 0 | 0 | 0 | 0.1 | 0 |
| Lost to follow-up | 4.96 | 3.65 | 2.97 | 2.98 | 4.32 | 2.59 | 3.77 | 3.04 |
| Total | 26.01 | 21.49 | 28.37 | 31.37 | 38.29 | 31.88 | 30.2 | 29.14 |
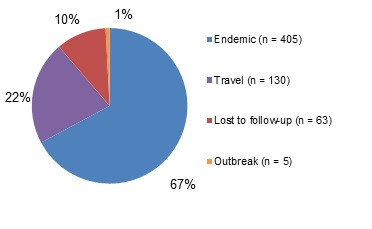
Figure 1.1 - Text description
Figure 1.1 shows a pie chart of the relative proportion of Campylobacter cases in the FoodNet Canada surveillance system by case classification (endemic, lost to follow-up, outbreak and travel) for 2018. The chart includes the case classification, the number of cases and the relative proportion.
| Case Classification | Number of cases | Relative proportion |
|---|---|---|
| Endemic | 405 | 67% |
| Lost to follow-Up | 63 | 10% |
| Outbreak | 5 | 1% |
| Travel | 130 | 22% |
Isolates with species information: 534/603 (88.6%)
Top Campylobacter subtypes:
- jejuni: 88%
- coli: 7%
- upsaliensis: 3%
- lari: <1%
- fetus: <1%
- rectus/curvus: <1%
Clinical profile (endemic cases only):
- Most commonly reported symptoms:
- Diarrhea: 99%
- Abdominal pain: 83%
- Fatigue and weakness: 78%
- Fever: 66%
- Anorexia: 60%
- Indicators of severity:
- Bloody diarrhea: 43%
- Emergency room visits: 61%
- Hospitalizations: 9%
- Antimicrobial prescriptions: 54%
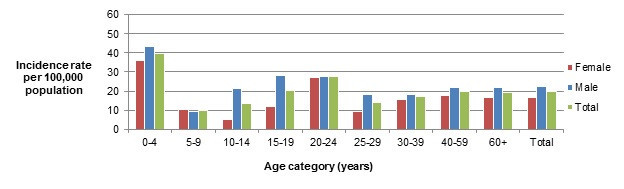
Figure 1.2 - Text description
Figure 1.2 shows a bar chart of the annual incidence rate of Campylobacter per 100,000 population by overall total age category and by each age category and gender for 2018. The y-axis presents the incidence rate per 100,000 population and the x-axis presents the age categories. The bars represent the total incidence for all genders by age group as well as the total incidence of male and female separately by age category.
| Age category | Female | Male | Overall total (all genders combined) |
|---|---|---|---|
| 0 to 4 | 35.91 | 43.55 | 39.84 |
| 5 to 9 | 10.16 | 9.46 | 9.79 |
| 10 to 14 | 5.26 | 21.62 | 13.66 |
| 15 to 19 | 12.13 | 28.03 | 20.27 |
| 20 to 24 | 27.29 | 27.73 | 27.52 |
| 25 to 29 | 9.32 | 18.19 | 13.81 |
| 30 to 39 | 15.77 | 18.34 | 17.06 |
| 40 to 59 | 17.92 | 21.65 | 19.8 |
| 60+ | 16.53 | 22.12 | 19.15 |
| Overall total (all ages combined) | 16.81 | 22.34 | 19.57 |
Food, animal and environmental surveillance summary
| Sample type | Ontario site | Alberta site | British Columbia site | All sites | |
|---|---|---|---|---|---|
| Chicken breast | - | 26.19% (33/126) | 41.11% (53/129) | 53.79% (71/132) | 40.57% (157/387) |
| Pork sausage | - | 0% (0/125) | 0% (0/107) | 1.03% (1/97) | 0.3% (1/329) |
| Broiler chicken manure | Sample-level | 5.26% (4/76) ↓ | 34.17% (41/120) | 38.33% (46/120) | 28.79% (91/316) |
| Farm-level | 5.26% (1/19) ↓ | 36.67% (11/30) | 40% (12/30) | 30.38% (24/79) | |
| Swine manure | Sample-level | 80.65% (150/186) | 73.02% (92/126) | NT | 77.56% (242/312) |
| Farm-level | 96.77% (30/31) | 95.24% (20/21) | NT | 96.15% (50/52) | |
| Turkey manure | Sample-level | 51.79% (58/112) | 35.00% (14/40) | 78.99% (94/119) | 61.25% (166/271) |
| Farm-level | 53.57% (15/28) | 40% (4/10) | 80% (24/30) | 63.24% (43/68) | |
| Feedlot beef manure | Sample-level | NT | 77.05% (94/122) ↑ | NT | NT |
| Farm-level | NT | 95.24% (20/21) | NT | NT | |
| Irrigation water | - | NT | 15.63% (5/32) | 2.22% (1/45) | 7.79% (6/77) |
NT - not tested
↑/↓Indicates a significant increase/decrease in prevalence compared to 2016
Significant differences in prevalence since 2017:
- Broiler chicken manure (sample-level): ON significantly decreased to 5.26% in 2018 from 38% in 2017.
- Broiler chicken manure (farm-level): ON significantly decreased to 5.26% in 2018 from 47% in 2017.
- Feedlot beef manure (sample-level): significantly increased to 77.05% in 2018 from 57% in 2017 in AB.
- Irrigation water: AB increased to 15.63% in 2018 from 0% in 2017. BC increased to
- 7.79% in 2018 from 1.4% in 2017. Although these were not significant.
Regional differences:
- Chicken breast in ON had significantly lower Campylobacter prevalence compared to AB and BC.
- Broiler chicken manure in ON had significantly lower Campylobacter prevalence compared to BC and AB.
- Turkey manure (sample-level) in ON and AB had significantly lower Campylobacter than BC.
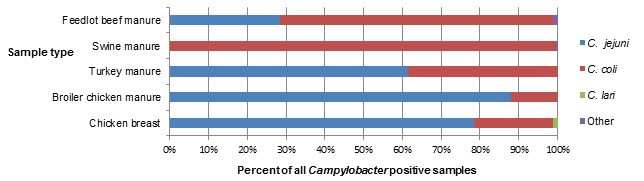
Figure 1.3 - Text description
Figure 1.3 shows a stacked horizontal bar chart that represents the distribution of Campylobacter jejuni, Campylobacter coli, Campylobacter lari and other Campylobacter positive samples by sample type (Feedlot beef manure,swine manure, turkey manure, broiler chicken manure and chicken breast) for 2018. The y-axis represents the sample type and the x-axis represents the percent of all Campylobacter positive samples. The stacked bars represent the percentage of Campylobacter for each subtype (Campylobacter jejuni, Campylobacter coli, Campylobacter lari and other Campylobacter) by sample type.
| N/A | Sample type | ||||
|---|---|---|---|---|---|
| Feedlot beef manure | Swine manure | Turkey manure | Broiler chicken manure | Chicken Breast | |
| Campylobacter jejuni |
32.56 | 0 | 61.83 | 95.92 | 83.23 |
| Campylobacter coli |
67.44 | 97.24 | 36.64 | 4.08 | 16.13 |
| Campylobacter lari |
0 | 0 | 0 | 0 | 0.65 |
| Other Campylobacter |
0.65 | 0 | 0 | 2.76 | 0.00 |
Integrated findings
The overall annual incidence rate and the endemic incidence rate of Campylobacter has remained consistent since 2010 and there were no significant changes from 2017 to 2018 in any of the sentinel sites. Campylobacter jejuni was the primary subtype identified in human cases, retail chicken breast samples, broiler chicken farms and turkey farms across all sentinel sites (Figure 1.3). Among human cases, Campylobacter coli is less commonly associated with disease, representing 7.1% of all subtyped human infections. By contrast, C. coli represented 99.6% of Campylobacter isolated from swine manure samples, 70.5% from feedlot beef manure samples and 38.6% from turkey manure samples. A study by FoodNet Canada looked at source attribution of Campylobacter cases and identified chicken meat as a primary source of human campylobacteriosis with 65–69% of cases being attributed to chicken meat, followed by cattle manure (14-19%)Footnote 1.
There are multiple sources of exposure at the farm level and the proportion of Campylobacter identified by farm type is presented in Figure 1.4. Prevalence rates of feedlot beef increased significantly in 2018 compared to 2017, although this prevalence is similar to that seen in 2016. The feedlot beef sampling in 2018 was clustered during the fall and winter season, which could explain the higher prevalence. A significant decrease in Campylobacter in broiler chicken manure was seen in 2018 compared to 2017 in the ON site. Many factors can affect the prevalence of Campylobacter from year to year, including disinfection practices, production type, or the age of the flockFootnote 2. There was also a significant difference in Campylobacter prevalence identified between each site for chicken breast, broiler chicken manure and turkey manure samples. This may be related to varying on-farm practices by region, such as vertical transmission, animal and human movement factors, in addition to environmental and water sources of contaminationFootnote 3.
The incidence of Campylobacteriosis among FoodNet Canada cases in 2018 was not significantly different from 2017:
- Campylobacter jejuni was the primary species affecting human cases (88% in 2018), which was also commonly found in retail chicken breast, broiler chicken manure and turkey manure samples in 2018.
Regional and seasonal differences were identified among human cases and food, animal and environmental samples:
- Regional differences were present among chicken breast, broiler chicken and turkey manure samples, which may reflect regional differences in on-farm management practices.
- An increased incidence of Campylobacter cases was seen in the summer months, while an increased prevalence was identified in both the summer and fall for retail chicken breast samples in ON and AB.
In 2018, no significant changes were observed in Campylobacter in irrigation canal sampling in the BC sentinel site. In Alberta, the overall Campylobacter prevalence increased to 15.63% in 2018 compared to 0% in 2017. Temperature and rainfall could be an important factor in the increase in Campylobacter in Alberta. A Canadian study in 2015 noted that temperature is an important factor for the survival of Campylobacter jejuni in water and that water temperature of 4–24°C allowed for better survival of the pathogenFootnote 3. When temperature was explored during the Alberta sentinel site sampling dates in 2018, it was noted that outdoor temperatures were below 25°C the day of sampling and two days prior to sampling which could potentially influence water temperature. Of note, both Campylobacter jejuni and lari were found in the water samples with 33% of samples being C. jejuni, 50% C. lari and 17% with both C. jejuni and C. lari.

Figure 1.4 - Text description
Figure 1.4 shows a pie chart of the proportion of all positive Campylobacter manure samples by farm type (broiler chicken, swine, turkey and feedlot beef) in 2018.
| Farm type | Proportion of all positive manure samples |
|---|---|
| Broiler chicken | 11% |
| Swine | 34% |
| Turkey | 22% |
| Feedlot beef | 33% |
In 2018, an increased incidence of Campylobacter cases was seen in the summer months (May to August). There was no seasonal pattern seen in chicken breast by month but there were two small peaks seen in the summer and fall for both Ontario and Alberta. British Columbia had a peak in May and the proportion of positive samples held constant for the rest of the year (Figure 1.5).

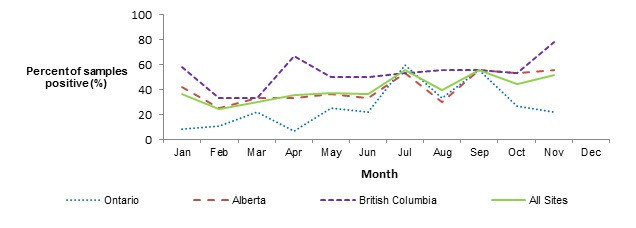
Figure 1.5 - Text description
Figure 1.5 shows two line graphs. The top line graph is the monthly incidence rate of Campylobacter per 100,000 (y-axis) by month (x-axis) for the total combined sentinel sites (Ontario, British Columbia and Alberta) and each of the individual sentinel sites Ontario, British Columbia and Alberta in 2018. The bottom line graph is the proportion of retail chicken breast samples that are positive (y-axis) by month (x-axis) for the total combined sentinel sites (Ontario, British Columbia and Alberta) and each of the individual sentinel sites Ontario, British Columbia and Alberta in 2018.
| Human monthly incidence rates | ||||
|---|---|---|---|---|
| Month | All Sites | Ontario | British Columbia | Alberta |
| Jan | 11.6 | 9.73 | 14.35 | 11.17 |
| Feb | 8.7 | 2.43 | 9.56 | 11.17 |
| Mar | 12.18 | 2.43 | 16.74 | 14.52 |
| Apr | 20.88 | 4.87 | 11.96 | 32.4 |
| May | 20.3 | 7.3 | 14.35 | 29.05 |
| Jun | 35.96 | 17.03 | 16.74 | 53.63 |
| Jul | 36.54 | 31.63 | 43.04 | 35.75 |
| Aug | 22.04 | 9.73 | 28.69 | 24.58 |
| Sep | 22.04 | 17.03 | 21.52 | 24.58 |
| Oct | 14.5 | 17.03 | 14.35 | 13.41 |
| Nov | 15.66 | 24.33 | 19.13 | 10.05 |
| Dec | 13.34 | 9.73 | 19.13 | 12.29 |
| Proportion of positive retail chicken samples | ||||
|---|---|---|---|---|
| Month | All Sites | Ontario | British Columbia | Alberta |
| Jan | 36.11 | 8.33 | 58.33 | 41.67 |
| Feb | 24.24 | 11.11 | 33.33 | 25 |
| Mar | 29.63 | 22.22 | 33.33 | 33.33 |
| Apr | 35.56 | 6.67 | 66.67 | 33.33 |
| May | 37.14 | 25 | 50 | 36.36 |
| Jun | 36.36 | 22.22 | 50 | 33.33 |
| Jul | 55.56 | 60 | 53.33 | 53.33 |
| Aug | 39.29 | 33.33 | 55.56 | 30 |
| Sep | 55.56 | 55.56 | 55.56 | 55.56 |
| Oct | 44.44 | 26.67 | 53.33 | 53.33 |
| Nov | 51.85 | 22.22 | 77.78 | 55.56 |
| Dec | N/A | N/A | N/A | N/A |
Public health impact
Overall, when comparing the human and food trend information, it is clear that there are other potential sources of exposure resulting in human illness beyond retail chicken products. If retail chicken were to be the only source of exposure, the trends in human illness would be expected to mirror those of retail chicken products and continue to be reported at higher levels after the summer season. However, human illness rates start to decrease after the summer months while retail chicken samples testing positive for Campylobacter continue to be elevated. Literature suggests that the summer peak can be due in part to improved survival and replication of some bacteria during warm weather and to seasonal changes in our eating behaviours (e.g. summer BBQs).Footnote 4
Continuing surveillance of other retail products, such as pork, farm animals and the environment for Campylobacter will allow us to better identify and understand the contribution of multiple sources to Canadian illnesses as well as to guide future surveillance activities.
Salmonella
Human surveillance summary
| N/A | Ontario site | Alberta sitea | British Columbia site | All sites | ||||
|---|---|---|---|---|---|---|---|---|
| 2017 | 2018 | 2017 | 2018 | 2017 | 2018 | 2017 | 2018 | |
| Endemic | 6.4 | 7.5 | 16.01 | 11.73↓ | 17.7 | 10.76↓ | 14.11 | 10.49↓ |
| Travel | 4.75 | 5.07 | 6.04 | 5.21 | 9.47 | 6.58 | 6.56 | 5.51 |
| Outbreak | 0.62 | 5.27 | 0.29 | 1.02 | 0.62 | 1.99 | 0.45 | 2.27 |
| Non-endemic | 0 | 0 | 0 | 0 | 0.41 | 0 | 0.1 | 0 |
| Lost to follow-up | 0.62 | 0.61 | 2.59 | 1.4 | 2.26 | 0.1 | 2.04 | 1.11 |
| Total | 12.39 | 18.45↑ | 24.92 | 19.36↓ | 30.47 | 20.32↓ | 23.25 | 19.38↓ |
a Typhi and Paratyphi not reported by AB site, except Paratyphi B var Java, which is reported by AB site.
↑/↓ indicates a significant increase/decrease in incidence since 2017
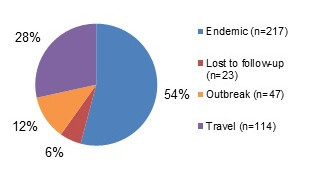
Figure 2.1 - Text description
Figure 2.1 shows a pie chart of the relative proportion of Salmonella cases in the FoodNet Canada surveillance system by case classification of endemic, lost to follow-up, outbreak and travel for 2018. The pie chart includes the case classification and the relative proportion.
| Case classification | Number of cases | Relative proportion |
|---|---|---|
| Endemic | 217 | 54.11% |
| Lost to follow-Up | 23 | 5.74% |
| Travel | 114 | 28.43% |
| Outbreak | 47 | 11.72% |
Isolates with serovar information: 401/401 (100.0%)
Top 5 Salmonella serovars:
- Enteritidis: 43%
- Heidelberg: 9%
- Typhimurium: 6%
- Newport: 3%
- Saintpaul: 3%
Significant changes in endemic, travel, and total incidence rates:
- There were significant decreases in the endemic and total incidence rates for all sites (combined) between 2017 and 2018, as well as in the BC and AB sites' endemic and total incidence rates. There was however a significant increase in the ON site's total incidence rate.
Clinical profile (endemic cases only):
- Most commonly reported symptoms:
- Diarrhea: 92%
- Abdominal pain: 80%
- Fatigue and weakness: 74%
- Anorexia: 69%
- Fever: 68%
- Indicators of severity:
- Bloody diarrhea: 36%
- Emergency room visits: 62%
- Hospitalizations: 19%
- Antimicrobial prescriptions: 45%
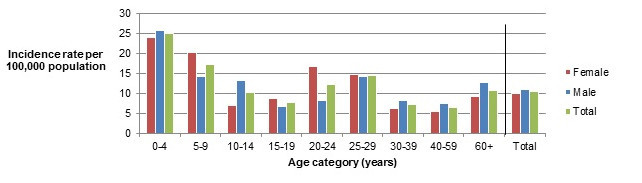
Figure 2.2 - Text description
Figure 2.2 shows a bar chart of the annual incidence rate for Salmonella human infections per 100,000 population by age group and gender for 2018. The y-axis presents the annual incidence rate per 100,000 population, while the x-axis presents the different age categories and total for all age groups combined. The bars represent the total incidence for all genders, total incidence for male and total incidence for female cases.
| Age category | Female | Male | Overall total (all genders combined) |
|---|---|---|---|
| 0 to 4 | 23.94 | 25.81 | 24.9 |
| 5 to 9 | 20.31 | 14.18 | 17.14 |
| 10 to 14 | 7.02 | 13.31 | 10.24 |
| 15 to 19 | 8.66 | 6.6 | 7.6 |
| 20 to 24 | 16.68 | 8.32 | 12.31 |
| 25 to 29 | 14.65 | 14.29 | 14.47 |
| 30 to 39 | 6.31 | 8.22 | 7.26 |
| 40 to 59 | 5.49 | 7.58 | 6.54 |
| 60+ | 9.13 | 12.78 | 10.85 |
| Overall total (all ages combined) | 9.95 | 11.03 | 10.49 |
Food, animal and environmental surveillance summary
| Sample type | Ontario site | Alberta site | British Columbia site | All sites | |
|---|---|---|---|---|---|
| Chicken breast | - | 13% (15/114) |
22% (26/118) |
23% (30/132) |
20% (76/387) |
| Frozen raw breaded chicken products | - | 21% (24/114) |
23% (27/120) |
37% (49/131) ↑ |
27% (100/365) |
| Pork sausage | - | 6% (7/114) |
3% (4/123) |
5% (6/132) |
5% (21/413) |
| Broiler chicken manure | Sample-level | 39% (30/74) |
64% (77/120)↑ |
50% (60/120) |
53% (167/316) |
| Farm-level | 47% (9/19) |
80% (24/30) |
67% (20/30) |
67% (53/79) |
|
| Swine manure | Sample-level | 26% (49/186) |
9% (11/126) |
NT | 19% (60/312) |
| Farm-level | 58% (18/31) |
24% (5/21) |
NT | 44% (23/52) |
|
| Turkey manure | Sample-level | 82% (92/112)↑ |
78% (31/40) |
56% (66/119) |
70% (189/271)↑ |
| Farm-level | 96% (27/28) |
90% (9/10) |
73% (22/30) |
85% (58/68)↑ |
|
| Feedlot beef manure | Sample-level | NT | 1% (2/122) |
NT | 1% (2/122) |
| Farm-level | NT | 5% (1/21) |
NT | 5% (1/21) |
|
| Irrigation water | Sample-level | NT | 13% (4/32) |
4% (2/45) |
8% (6/77) |
NT – not tested.
↑/↓Indicates a significant increase/decrease in prevalence compared to 2017.
Significant differences in prevalence since 2016:
- Salmonella prevalence in frozen raw breaded chicken products in the BC site increased significantly to 37% in 2018 from 27% in 2017.
- Salmonella prevalence in broiler chicken manure samples collected in the AB site increased significantly to 64% in 2018 from 50% in 2017.
- Salmonella prevalence in turkey manure samples collected in the ON site increased significantly to 82% in 2018 from 70% in 2017.
- Salmonella prevalence in turkey manure in all sites increased significantly
- At the sample level to 70% in 2018 from 56% in 2017.
- At the farm level to 85% in 2018 from 69% in 2017.
Regional differences:
- Salmonella prevalence in frozen raw breaded chicken products was significantly higher in the BC site compared with the ON and AB site.
- At the sample-level, Salmonella prevalence in broiler chicken manure was significantly higher in the AB site compared with the ON and BC sites.
- At the sample-level, Salmonella prevalence in swine manure was significantly higher in the ON site compared with the AB site.
- At the sample-level, Salmonella prevalence in turkey manure was significantly higher in the ON and AB sites compared with the BC site.
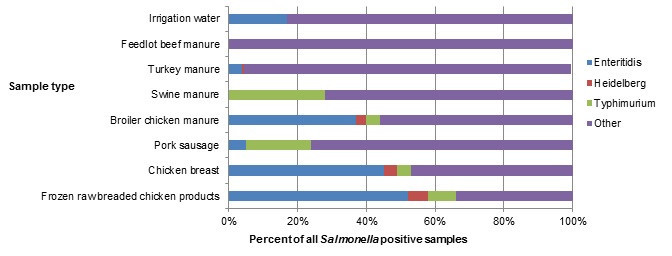
Figure 2.3 - Text description
Figure 2.3 shows a stacked horizontal bar chart representing the percentage of all positive samples for selected Salmonella serovars: Enteritidis, Heidelberg, Typhimurium and Other. On the y-axis are the type of samples collected through retail, farm and environmental samples and the x-axis shows the percent of all Salmonella positive samples.
| N/A | Sample type | |||||||
|---|---|---|---|---|---|---|---|---|
| Irrigation water | Feedlot beef manure | Turkey manure | Swine manure | Broiler chicken manure | Pork sausage | Chicken breast | Frozen raw breaded chicken product | |
| Salmonella Enteritidis | 17% | 0% | 4% | 0% | 37% | 5% | 45% | 52% |
| Salmonella Heidelberg | 0% | 0% | 1% | 0% | 3% | 0% | 4% | 6% |
| Salmonella Typhimurium | 0% | 0% | 0% | 28% | 4% | 19% | 4% | 8% |
| Other Salmonella serovars | 83% | 100% | 95% | 72% | 56% | 76% | 47% | 34% |
Salmonella Enteritidis
In 2018, S. Enteritidis (SE) remained the most commonly identified serovar among FoodNet Canada human endemic cases (Tables 2.3a, 2.3b, 2.3c). Although SE was the top serovar across all sentinel sites, differences in the proportion of endemic SE were observed by site, ranging from 32% in the ON site to 56% and 61% in the AB and BC sites, respectively (Figure 2.4).
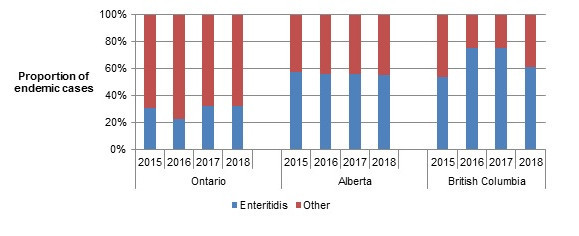
Figure 2.4 - Text description
Figure 2.4 shows a stacked vertical bar chart representing the proportion of human endemic Salmonella spp. cases reported by each site and year for Enteritidis or other Salmonella serovars. On the y-axis is the proportion of endemic cases and the x-axis presents the sentinel site and year during which these cases were reported.
| Serovar | Ontario | Alberta | British Columbia | |||||||||
|---|---|---|---|---|---|---|---|---|---|---|---|---|
| 2015 | 2016 | 2017 | 2018 | 2015 | 2016 | 2017 | 2018 | 2015 | 2016 | 2017 | 2018 | |
| Enteritidis | 30.61 | 22.95 | 32.26 | 32.43 | 57.32 | 56 | 55.69 | 55.55 | 53.66 | 75.58 | 75.58 | 61.11 |
| Other | 69.39 | 77.05 | 67.74 | 67.56 | 42.68 | 44 | 44.31 | 44.44 | 46.34 | 24.42 | 24.42 | 38.88 |
Among SE cases in 2018, 23% (40/172) were related to international travel. The majority of these cases reported travel to the Americas (Central, South and Caribbean), with Mexico (50%), Cuba (41%) and the Dominican Republic (9%) being the destinations most often reported within this region (Figure 2.5).
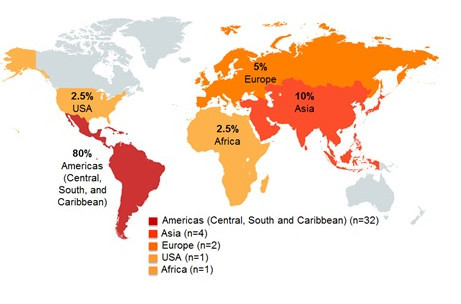
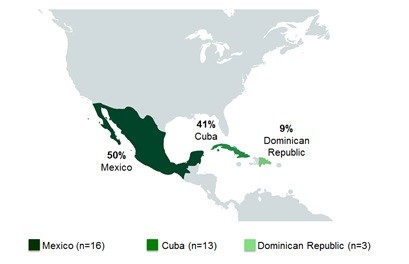
Figure 2.5 - Text description
This figure shows two pictures of the regions of the world with different perspectives. The first picture displays the global land mass and highlighted are the countries/regions that cases reported having traveled prior to their illness: United States of America, Americas (Central, South, and Caribbean), Europe, Asia, and Africa. The second figure focuses on Mexico and Central American countries, with the following countries in color: Mexico, Cuba and Dominican Republic. Each country/regions highlighted in these figures include the percentage of cases out of all the travel-related illnesses that reported having traveled to these countries/regions.
| N/A | United States of America | Americas (Central, South and Caribbean) | Europe | Asia | Africa | Mexico | Cuba | Dominican Republic |
|---|---|---|---|---|---|---|---|---|
| Proportion of cases | 2.50% | 80% | 5% | 10% | 2.50% | 50% | 41% | 9% |
After remaining relatively stable from 2015 to 2017, the annual incidence rate for endemic SE cases for the combined sites (ON, BC, and AB) dropped in 2018 to 5.6 cases per 100,000 population (Figure 2.6). However, regional differences continued to be observed across the sites. While higher annual incidence rates of endemic SE were again observed in the BC and AB sites, both rates decreased in 2018, in particular in the BC site where it dropped from 13.4 cases in 2017 to 6.6 cases per 100,000 population in 2018. The ON site continued to observe lower rates than the other two sites, however, the incidence rate of endemic SE increased slightly in 2018 compared to 2017.
For retail chicken breast, the combined site proportion of samples testing positive for SE remained stable from 2015 to 2018, although regional differences were observed (Figure 2.6). In the BC and AB sites, a higher proportion of retail chicken breast samples were positive for SE compared with the ON site. However, in 2018, a significant decrease in the proportion of raw chicken breast samples positive for SE was observed in the BC site, decreasing from 17% (23/132) in 2017 to 8% in 2018 (11/132). Whereas, a significant increase in the proportion of raw chicken breast samples positive for SE was observed in the ON site, increasing from 0% (0/132) in 2017 to 3% (4/114) in 2018 (Figure 2.6). Consistent regional trends were also observed for broiler chicken manure, with a higher proportion of samples positive for SE in the BC and AB sites compared with the ON site, where very few samples were found positive between 2015 and 2018. However, in the ON site, a steady increase in the proportion of samples positive for SE has occurred, with a significant increase observed in 2018 (7%; 5/76) when compared to 2015 (0%; 0/88). Unlike retail chicken breast and broiler chicken manure from 2015 to 2018, regional differences were not observed for retail frozen raw breaded chicken products. The proportion of these products positive for SE has slightly increased in 2018 across the sites when compared with 2017. Similar trends seen across the sites (for the frozen raw breaded chicken products) is likely a reflection of product distribution as these products have been found to be produced and distributed widely across the country with distribution not typically limited to a single province. As in 2017, SE remained the most commonly identified serovar across all three sites for these products in 2018.
According to the Canadian Food Inspection Agency (CFIA), as of April 1, 2019, all manufacturers of frozen raw breaded chicken products will be required to ensure that Salmonella is not detectable on these productsFootnote 5. In 2019, FoodNet Canada will continue to track the impact of this intervention.
In 2018, SE was also identified in turkey manure, irrigation water, and pork sausage samples. Although only a small proportion of samples were positive for SE (3% for turkey manure, 1% for irrigation water and 0.2% for pork sausage), these sources represent potential causes of human illness as demonstrated through whole genome sequencing analysis (Table 2.4 and Table 2.5).
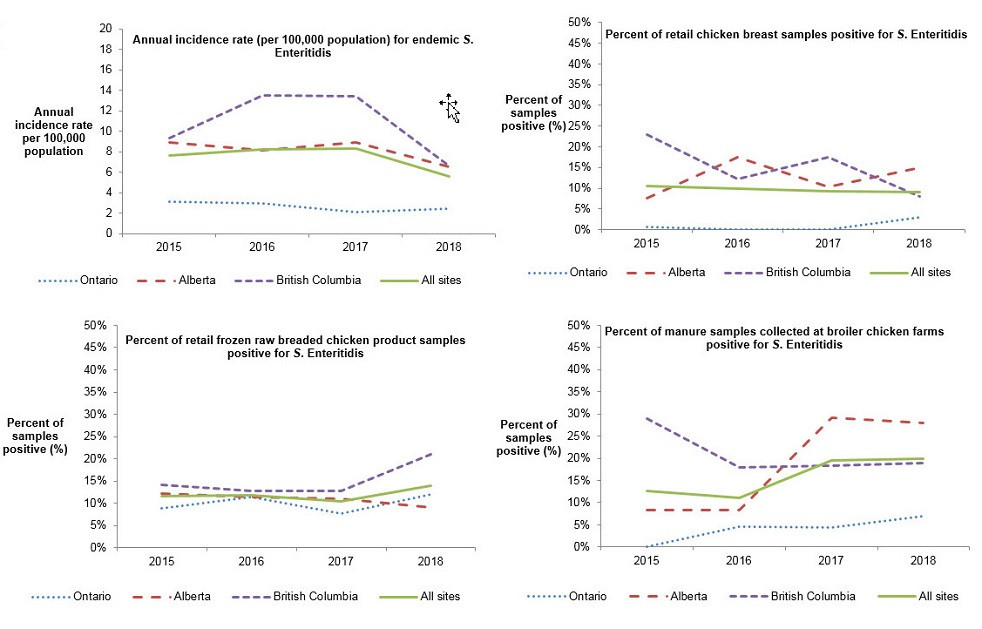
Figure 2.6 - Text description
This figure consists of multiple graphs, one graph for each surveillance component: retail chicken breast, retail frozen chicken products, broiler chicken farms and human incidence rates. Each graph presents the proportion of samples positive for S. Enteritidis or the human annual incidence rate per 100,000 population for all sites combined and for each individual site. Different styles of lines have been used to describe the proportions or incidence rate for each individual site and all sites combined. The left y-axis presents the human incidence rate per 100,000 population or the proportion of samples positive for S. Enteritidis and the x-axis presents the year when the samples were collected.
| Sentinel site | Chicken breast – proportion of all tested | Frozen chicken products – proportion of all tested | Broiler chickenfarms – proportion of all tested | Human incidence rates | ||||||||||||
|---|---|---|---|---|---|---|---|---|---|---|---|---|---|---|---|---|
| 2015 | 2016 | 2017 | 2018 | 2015 | 2016 | 2017 | 2018 | 2015 | 2016 | 2017 | 2018 | 2015 | 2016 | 2017 | 2018 | |
| All sites | 10 | 10 | 9 | 9 | 12 | 12 | 10 | 14 | 13 | 11 | 19 | 20 | 7.62 | 8.19 | 8.34 | 5.55 |
| Ontario | 1 | 0 | 0 | 3 | 9 | 11 | 8 | 12 | 0 | 5 | 4 | 7 | 3.15 | 2.91 | 2.06 | 2.43 |
| British Columbia | 23 | 12 | 17 | 7 | 14 | 13 | 13 | 21 | 29 | 18 | 18 | 19 | 9.36 | 13.49 | 13.38 | 6.58 |
| Alberta | 8 | 17 | 10 | 15 | 12 | 11 | 11 | 9 | 8 | 8 | 29 | 28 | 8.92 | 8.17 | 8.91 | 6.52 |
| Human endemic cases (n=37) |
Retail | Farm | Irrigation water | |||||
|---|---|---|---|---|---|---|---|---|
| Chicken breast (n=15) |
Frozen raw breaded chicken products (n=24) |
Pork sausage (n=7) |
Broiler chicken (n=30) |
Swine (n=49) |
Beef cattle | Turkey (n=92) |
||
| Enteritidis (32%) | Kentucky (40%) | Enteritidis (58%) | Derby, Infantis, Typhimurium (28%) | Litchfield (27%) | Typhimurium (35%) | No sampling conducted | Uganda (51%) | No sampling conducted |
| Typhimurium (14%) | Enteritidis (27%) | Infantis (13%) | Enteritidis, Hadar (17% each) | Infantis (16% each) | Muenchen, Schwarzengrund (14%) | |||
| Oranienburg and Saintpaul (8% each) | Heidelberg, Typhimurium (13% each) | Kentucky, Typhimurium (8% each) | Livingstone, Typhimurium, Uganda (10% each) | Derby, Worthington (12%) | Agona, Albany, Hadar (4%) | |||
| Agona and Heidelberg (5% each) | Anatum, Heidelberg, Livingstone (4%) | Brandenburg (14%) | Brandenburg (10% each) | Livingstone (3% each) | ||||
| Agbeni, Bareilly, Durban, Hvittingfoss, Infantis, Javiana, Kottbus, Mbandaka, Paratyphi B var Java, San Diego (3% each) | Newport (7%) | Infantis (3%) | I:4,[5],12:i:- (8%) | |||||
| Human endemic cases (n=126) |
Retail | Farm | Irrigation water (n=4) |
|||||
|---|---|---|---|---|---|---|---|---|
| Chicken breast (n=26) |
Frozen raw breaded chicken products (n=27) |
Pork sausage (n=4) |
Broiler chicken (n=77) |
Swine (n=11) |
Beef cattle (n=2) |
Turkey (n=31) |
||
| Enteritidis (56%) | Enteritidis (69%) | Enteritidis (41%) | Derby (50%) | Enteritidis (44%) | Livingstone (45%) | Schwarzengrund (100%) | Reading (45%) | Rubislaw (50%) |
| Typhimurium (10%) | Kentucky (19%) | Heidelberg (19%) | Kentucky (27%) | Uganda (39%) | ||||
| Heidelberg (6%) | Infantis (17%) | Infantis (15%) | Schwarzengrund (14%) | Brandenburg, Derby (18% each) | Schwarzengrund (10%) | |||
| Saintpaul (4%) | Schwarzengrund (4% each) | Kentucky (8%) | Typhimurium (5%) | IIIb:16:z10:e,n,x,z15 (33%) | ||||
| I 4,[5],12:b:-, I 4, [5],12:i:-, Newport (2% each) | Braenderup, I:4,[5],12:i:-, I:8,20:-:z6, Livingstone, Typhimurium (4% each) | Krefeld, Muenchen (25% each) | Heidelberg (4%) | I:4,[5],12:i:-, Mbandaka (9%) | Senftenberg (7%) | Give (17%) | ||
| Human endemic cases (n=54) |
Retail | Farm | Irrigation water (n=2) |
|||||
|---|---|---|---|---|---|---|---|---|
| Chicken breast (n=30) |
Frozen raw breaded chicken products (n=49) |
Pork sausage (n=6) |
Broiler chicken (n=60) |
Swine | Beef cattle | Turkey (n=66) |
||
| Enteritidis (61%) | Kentucky (40%) | Enteritidis (55%) | Alachua, Bovismorbificans, Enteritidis, Ohio, Typhimurium, Uganda (17% each) | Kentucky (50%) | No sampling conducted | No sampling conducted | Reading (28%) | Enteritidis, Daytona (50% each) |
| Heidelberg and I 4, [5], 12:i:- (6% each) |
Enteritidis (37%) | Infantis (16% each) | Enteritidis (38%) | Hadar (26%) | ||||
| Typhimurium (4%) | Anatum (7%) | Kentucky, Typhimurium (10%) | Infantis (5%) | Uganda (12%) | ||||
| Brandenburg, Daytona, Hadar, Hvittingfoss, I 4,5,12:H Nonmotile, Idikan, Infantis, Montevideo, Newport, Reading, Rissen, Stanley, Urbana (2% each) |
Hadar, Heidelberg, Infantis, Newport, Oranienburg (3%) | Thompson (4%) | Heidelberg, Senftenberg (3%) | Enteritidis (11%) | ||||
| Braenderup, Liverpool (2%) | Agona (8% each) | |||||||
Whole genome sequencing (WGS)
In 2018, Salmonella isolates recovered from retail, farm and water samples were sequenced and analysed against human strains from Salmonella cases both inside and outside of the FoodNet Canada sentinel sites in order to determine their relatedness and inform the assessment of human WGS clusters. Salmonella WGS clusters typically contain two or more isolates grouping together within 0 and 10 alleles, however, in some cases the allele range can be greater than 10 depending on the epidemiological data. Salmonella isolated from retail chicken products, pork sausage, chicken manure, turkey manure, and irrigation water samples were related to a total of 60 human clusters in 2018 (Table 2.4). As in 2017, no matches were observed with Salmonella recovered from swine and cattle manure samples (Table 2.5).
Similar to what occurred in 2017, the majority of Salmonella clusters containing FoodNet Canada isolates in 2018 included a combination of isolates recovered from frozen raw breaded chicken products and human cases only (34%) (Table 2.4). These clusters were primarily S. Enteritidis clusters, in addition to S, Typhimurium, S. Heidelberg, S. Infantis, and S. Thompson. The next most common combination of samples included turkey manure samples and human cases only (20%), which was an increase compared with the proportion identified in 2017 (8%) (Table 2.4). Clusters of this combination included serovars S. Reading, S. Hadar, S. Muenchen, S. Enteritidis, S. Uganda, and S. Schwarzengrund.
In 2018, S. Enteritidis was the most common serovar which represented 44% of the WGS clusters containing FoodNet Canada isolates. Other serovars which clustered with FoodNet Canada isolates in 2018 included S. Heidelberg (8%), S. Typhimurium (8%), and S. Hadar (7%). Of all clusters, S. Enteritidis and S. Reading contained the greatest number of genetically related human Salmonella isolates.
| 60 Salmonella WGS clusters | |||||
|---|---|---|---|---|---|
| Number of Salmonella WGS clusters containing only the following samples | Frozen raw breaded chicken | Skinless chicken breast | Pork sausage | Chicken manure | Turkey manure |
| 21 clusters | 11 clusters | 1 cluster | 6 clusters | 12 clusters | |
| Number of Salmonella WGS clusters containing a combination of the following samples | Frozen raw breaded chicken & skinless chicken breast | Skinless chicken breast & chicken manure | Frozen raw breaded chicken, skinless chicken breast, and chicken manure | Frozen raw breaded chicken, skinless chicken breast, chicken manure, and pork sausage | Skinless chicken breast, chicken manure, and irrigation water |
| 2 clusters | 3 clusters | 2 clusters | 1 cluster | 1 cluster | |
| Salmonella serovar | Number of isolates sequenced and analyzed in 2018 | Number of isolates found to be related to human isolates as part of a WGS cluster in 2018 | % of isolates related to human isolates as part of a WGS cluster | Number of WGS clusters which isolates were found to be related to in 2018 | |
|---|---|---|---|---|---|
| 2017 | 2018 | ||||
| Skinless chicken breast | |||||
| Enteritidis | 34 | 33 | 100% | 97% | 10 |
| Other | 42 | 9 | 39% | 21% | 9 |
| Frozen raw breaded chicken | |||||
| Enteritidis | 52 | 33 | 71% | 63% | 19 |
| Other | 48 | 10 | 27% | 21% | 8 |
| Pork sausage | |||||
| Enteritidis | 1 | 1 | NT | 100% | 1 |
| Other | 20 | 1 | NT | 5% | 0 |
| Swine manure | |||||
| Enteritidis | 0 | 0 | 0% | 0% | 0 |
| Other | 60 | 0 | 0% | 0% | 0 |
| Broiler chicken manure | |||||
| Enteritidis | 62 | 61 | 98% | 98% | 6 |
| Other | 105 | 33 | 33% | 31% | 10 |
| Beef cattle manure | |||||
| Enteritidis | 0 | 0 | 0% | 0% | 0 |
| Other | 2 | 0 | 0% | 0% | 0 |
| Turkey manure | |||||
| Enteritidis | 7 | 7 | 0% | 100% | 2 |
| Other | 182 | 99 | 31% | 54% | 12 |
| Irrigation water | |||||
| Enteritidis | 1 | 1 | 67% | 100% | 1 |
| Other | 5 | 0 | 0% | 0% | 0 |
NT - Not tested
Integrated findings
The overall endemic Salmonella incidence rate decreased in 2018, as well as in the BC and AB sites specifically (Figure 2.7). For SE, which is the most common Salmonella serovar reported in humans in Canada, surveillance data collected in 2018 has also shown a decrease in human illness to the lowest overall incidence of SE observed since 2015 (Figure 2.6). This decrease seems to be driven by a significant decrease in the incidence of human illness in the BC site. However, regional differences in SE prevalence and incidence across all the surveillance components are still being observed with a slight increase observed in the ON site in human illness incidence and prevalence of SE on raw chicken breast, in frozen raw breaded chicken products and in broiler chicken manure. Although the incidence rate of SE decreased in 2018 among human endemic cases, high incidence rates of SE infections continued to be observed in the BC and AB sites, while the lowest incidence rate was reported in the ON site. However, decreases in SE have been observed in the BC and AB sites for incidence of human illness as well as prevalence of SE in raw chicken breast in the BC site, and in frozen raw breaded chicken products in the AB site.
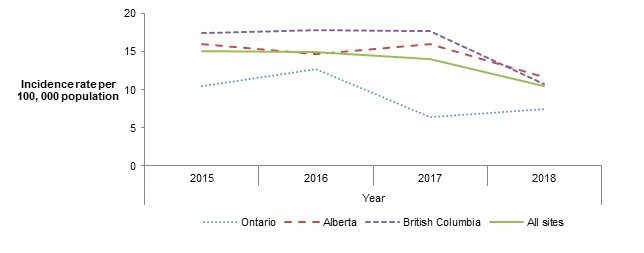
Figure 2.7 - Text description
This figure consists of a graph of human incidence rates. The graph presents the human annual incidence rate per 100,000 population of Salmonella spp. for all sites combined and for each individual site. Different styles of lines are used to describe the incidence rate for each individual site and all sites combined. The left y-axis presents the human incidence rate per 100,000 population of Salmonella spp. and the x-axis presents the year when the samples are collected.
| Sentinel site | Human incidence rates | |||
|---|---|---|---|---|
| 2015 | 2016 | 2017 | 2018 | |
| All sites | 10.49 | 12.66 | 6.40 | 7.50 |
| Ontario | 16.05 | 14.69 | 16.01 | 11.73 |
| British Columbia | 17.43 | 17.85 | 17.70 | 10.76 |
| Alberta | 15.03 | 14.96 | 14.11 | 10.49 |
Public health impact
Regional differences are present in the incidence of Salmonella across all surveillance components:
- The incidence of salmonellosis overall has significantly increased in ON in 2018, and significantly decreased in BC and AB, compared to 2017.
- S. Enteritidis incidence in humans and prevalence in chicken breast remains higher in BC and AB although significant decreases have been noted since 2017. A significant increase in the prevalence of SE in chicken breast in ON was also noted in 2018.
Whole genome sequencing data continue to highlight the burden of illness associated with poultry products across Canada.
- Over 85% of SE isolates recovered from chicken manure or chicken products were found to be genetically related to human cases of SE nationally, compared to <30% of other serovars.
- Routine monitoring of WGS data has contributed to the identification of emerging issues, such as S. Reading from turkey manure isolates, which were genetically related to human isolates in 2018.
Although not all of the Salmonella serovars have the same ability to cause human illness, it is important to conduct ongoing surveillance across the food chain to better understand trends over time and identify any emerging public health issues. Salmonella prevalence in turkey manure has increased between 2015 to 2018, however, less than 10% of serovars identified in turkey manure are among the top serovars causing illness in humans (Figure 2.3). Furthermore, Salmonella Kentucky continues to be among the top 3 serovars recovered from retail chicken and broiler chicken manure samples collected in 2018, much like 2017, while causing little to no human illness (Table 2.3).
Ongoing WGS for Salmonella isolates has further contributed to integrated and timely analysis of human, retail, farm, and water serovars, which has allowed for the detection of emerging issues and contributed to our understanding of pathogen transmission pathways. As in 2017, the majority of the farm and retail chicken isolates that were genetically related to human cases occured in S. Enteritidis clusters. In 2018, there was an increase in the number of farm turkey isolates genetically related to human cases, including farm turkey isolates that were related to a national outbreak of Salmonella Reading with 96 confirmed human casesFootnote 6.The remainder of clusters containing turkey isolates had 18 or fewer human cases. Continued analysis of WGS data in conjunction with other FoodNet Canada data sources, such as human case questionnaires and animal health data, will provide further evidence to inform action across regulators and industry groups.
Shigatoxigenic Escherichia coli (STEC)
Human surveillance summary
| N/A | Ontario site | Alberta sitea | British Columbia site | All sites | ||||
|---|---|---|---|---|---|---|---|---|
| 2017 | 2018 | 2017 | 2018 | 2017 | 2018 | 2017 | 2018 | |
| Endemic | 0 | 0.61 | 2.59 | 4.66 ↑ | 2.47 | 1.2 | 1.94 | 2.85 |
| Travel | 0.21 | 0 | 0.38 | 1.58 ↑ | 0 | 1 | 0.25 | 1.06 ↑ |
| Outbreak | 0.21 | 0 | 1.25 | 0.93 | 0.41 | 0 | 0.79 | 0.48 |
| Non-endemic | 0 | 0 | 0 | 0 | 0 | 0 | 0 | 0 |
| Lost to follow-up | 0 | 0 | 0.19 | 0 | 0 | 0 | 0.1 | 0 |
| Total | 0.41 | 0.61 | 4.41 | 7.17 ↑ | 2.88 | 2.19 | 3.08 | 4.40 ↑ |
↑/↓Indicates a significant increase/decrease in prevalence compared with 2017
a Starting June 11, 2018, the AB site began testing all STEC samples for non-O157, in addition to continuing O157 testing
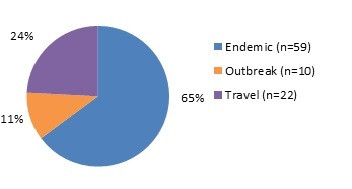
Figure 3.1 - Text description
Figure 3.1 shows a pie chart of the relative proportion of STEC cases in the FoodNet Canada surveillance system by case classification of endemic, outbreak and travel for 2018. The chart includes the case classification, the number of cases and the relative proportion.
| Case classification | Number of cases | Relative proportion |
|---|---|---|
| Endemic | 59 | 65% |
| Outbreak | 10 | 11% |
| Travel | 22 | 24% |
Isolates with serotype information: 86/91 (94.51%)
STEC serotypes:
- O157:H7 (34.48%)
- O26:H11 (11.49%)
- O111:NM (5.75%)
- O103:H25 (5.75%)
- O121:H19 (4.60%)
- O26:NM (4.60%)
- O103:H2 (3.45%)
- O145:NM (3.45%)
- O69:H11 (3.45%)
- O118:H16 (2.13%)
Significant changes in endemic, travel, and total incidence rates:
- The incidence rates of travel and total STEC in 2018 significantly increased since 2017 among all sites combined.
- The incidence rates of endemic, travel and total cases significantly increased in AB.
Clinical profile (endemic cases only):
- Most commonly reported symptoms:
- Diarrhea: 92%
- Abdominal pain: 85%
- Fatigue and weakness: 68%
- Anorexia: 64%
- Bloody diarrhea: 58%
- Indicators of severity:
- Emergency room visits: 68%
- Hospitalizations: 12%
- Antimicrobial prescriptions: 14%
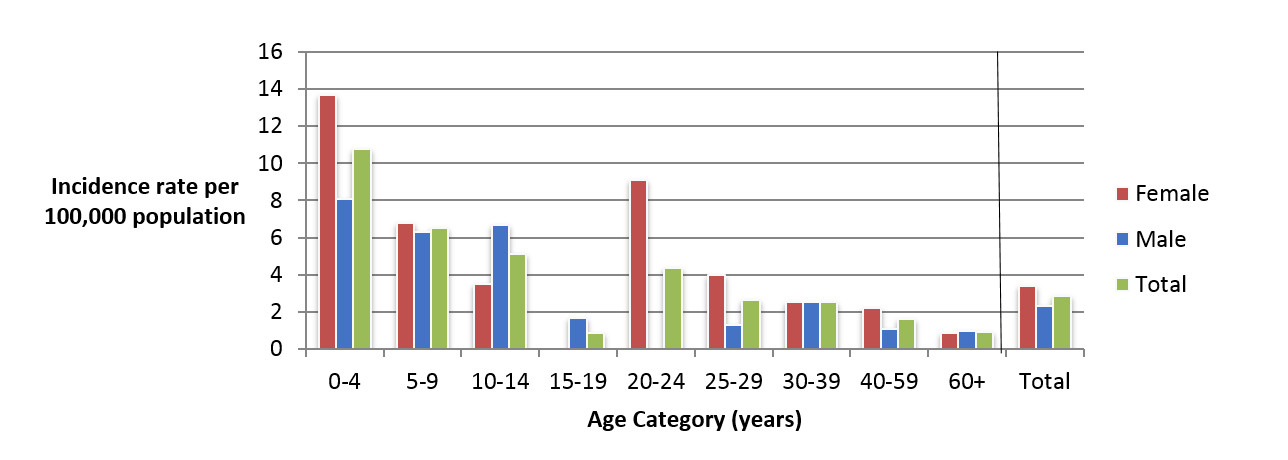
Figure 3.2 - Text description
Figure 3.2 shows a bar chart of the annual incidence rate of STEC per 100,000 population by overall total age category and by age category and gender for 2018. The y-axis presents the incidence rate per 100,000 population and the x-axis presents the age categories. The bars represent the total incidence for all genders by age group as well as the total incidence of male and female separately by age category.
| Age category | Female | Male | Overall total (all genders combined) |
|---|---|---|---|
| 0 to 4 | 13.68 | 8.07 | 10.79 |
| 5 to 9 | 6.77 | 6.30 | 6.553 |
| 10 to 14 | 3.51 | 6.65 | 5.12 |
| 15 to 19 | 0.00 | 1.65 | 0.85 |
| 20 to 24 | 9.10 | 0.00 | 4.35 |
| 25 to 29 | 4.00 | 1.30 | 2.63 |
| 30 to 39 | 3.79 | 2.53 | 3.16 |
| 40 to 59 | 2.19 | 1.08 | 1.64 |
| 60+ | 0.87 | 0.98 | 0.92 |
| Overall Total (all ages combined) | 3.57 | 2.32 | 2.95 |
Food, animal and environmental surveillance summary
| Sample type | Ontario site | Alberta site | British Columbia site | All sites | |
|---|---|---|---|---|---|
| Ground beef | N/A | 2.6% (3/114) | 0.8% (1/119) | 0.8% (1/129) | 1.4% (5/362) |
| Pork | N/A | 10.5% (12/114) | 1.7% (2/116) | 0.8% (1/129) | 4.1% (15/359) |
| Feedlot beef manure | Sample-level | NT | ↓ 7.4% (9/122) | NT | - |
| Farm-level | NT | 33.3% (7/21) | NT | - | |
| Irrigation water | N/A | NT | 53.1% (17/32) | ↓ 4.4% (2/45) | 24.7% (19/77) |
NT- not tested.
↑/↓Indicates a significant increase/decrease in the percent of samples positive for STEC compared with 2017
*Farmers' market sampling results are presented separately (see Farmers' Market Sampling textbox below)
Significant differences in prevalence since 2017:
- The prevalence of STEC in irrigation water in BC decreased significantly to 4% in 2018 from 26% in 2017.
- The prevalence of STEC in feedlot beef manure in AB decreased significantly to 7% in 2018 from 17% in 2017.
Regional differences:
- The prevalence of STEC in ON pork sausage was significantly higher than BC and AB in 2018.
- The prevalence of STEC in irrigation water in BC was significantly lower than AB in 2018.
Farmers' Market Sampling
From May–August of 2018, FoodNet Canada conducted farmers' market sampling at the retail level in the ON and AB sites, testing ground beef and pork sausage products for STEC:
- 17% (4/23) of ground beef samples were positive for STEC.
- 11% (5/44) of pork sausage samples were positive for STEC.
- One ground beef sample collected from a farmers' market in the ON site was positive for STEC O157:H7, containing the stx2 gene.
Integrated findings
There was a significant increase in the incidence of travel-associated shigatoxigenic Escherichia coli (STEC) in 2018, with travel cases primarily reporting Mexico as their travel destination (64%; 14/22), of which 86% (12/14) reported travelling to the west coast of Mexico. Despite this, the majority of infections in 2018 continued to be domestically-acquired across all sites. The incidence rate of endemic STEC infections in 2018 also increased significantly since 2017. However, this increase was primarily driven by the AB sentinel site, which began testing all STEC samples for non-O157 starting June 11, 2018, in addition to continuing O157 testing.
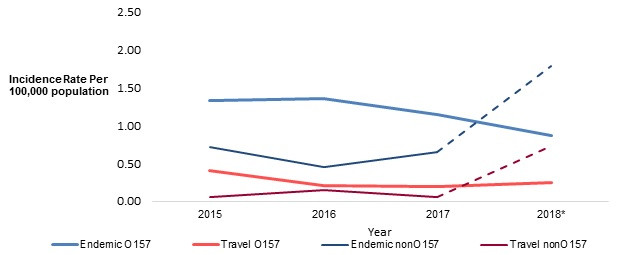
Figure 3.3 - Text description
Figure 3.3 shows a trend chart of the change in incidence of shigatoxigenic E. coli (STEC) O157 and non-O157 among all FoodNet Canada sentinel sites combined between 2015 to 2018. The y-axis presents the incidence rate per 100,000 population and the x-axis presents the year. Trends are displayed for four different categories: Endemic STEC O157; Travel STEC O157; Endemic STEC non-O157; Travel STEC non-O157.
| Year | Endemic O157 | Travel O157 | Endemic non-O157 | Travel non-O157 |
|---|---|---|---|---|
| 2015 | 1.33 | 0.41 | 0.72 | 0.05 |
| 2016 | 1.36 | 0.20 | 0.45 | 0.15 |
| 2017 | 1.14 | 0.20 | 0.65 | 0.05 |
| 2018 | 0.87 | 0.24 | 1.79* | 0.72* |
* Starting June 11, 2018, the AB site began testing all STEC samples for non-O157, in addition to continuing O157 testing (incidence is denoted in the table with a star after this time).
When assessing the trends among O157 endemic cases only, the incidence rate in FoodNet Canada sites has decreased significantly between 2016 and 2018 (Figure 3.3). Conversely, the national incidence of O157 reported by NESP increased from 0.95 per 100,000 in 2017 to 1.16 per 100,000 in 2018, which is similar to the national rate reported by NESP in 2016 (1.14 per 100,000)Footnote 7. This difference in incidence between FoodNet Canada and NESP could be related to the higher incidence of O157 seen in regions outside of the sentinel sites, such as the Northwest Territories, Saskatchewan, and other regions within the sentinel site provincesFootnote 7.
While there was no significant change in outbreak related O157 human cases from FoodNet Canada in 2018, an outbreak of E. coli O157 linked to romaine lettuce from California occurred in Canada and the US, with illnesses in Canada reported in Ontario, Québec, New Brunswick, Newfoundland, Alberta, Saskatchewan, and British Columbia. This outbreak began in December 2017 with reoccurring cases through to November of 2018Footnote 8.
All of the six non-O157 serogroups that have been prioritized with regards to human health risk, which are O26, O45, O103, O111, O121 and O145Footnote 9, were reported to FoodNet Canada in 2018, with the exception of subtype O45. In NESP in 2018, approximately 53% of E. coli isolates were non-O157 and had further subtype information, of which E. coli O26:H11, O121:H19, and O111:H non-motile were the top three serovars reported (NESP 2018 report). For FoodNet Canada, priority STEC subtypes O26:H11, O121:H19, and O26:H non-motile were isolated among both human cases and irrigation water. As for other non-O157 subtypes, O113:H21 was isolated in both human and irrigation water sources in the AB site, while O185:H7 was isolated from both ground beef and irrigation water, representing a potential source of retail and environmental contamination. There was also overlap with subtype O157 among human isolates and feedlot beef manure, including O157:H7 in addition to O157 with differing flagellar types. However, all O157 isolates from feedlot beef manure were identified as non-shigatoxin producing E. coli.
Top 7 STEC subtypes
Among the top 7 priority STEC subtypes, 3 were identified among both human cases and other FoodNet sample sources:
- O26 and O121 were identified among human cases and irrigation water samples.
- O157 was identified among human cases and a farmers' market ground beef sample.
All retail products routinely sampled in 2018 were collected from either independent stores, such as butcher shops, or chain grocery stores. Although there was limited overlap in STEC subtypes between human cases and pork sausage samples in 2018, the prevalence of STEC was significantly higher among pork sausage samples (4%) compared with ground beef (1%), which was driven by the ON and AB sites.
FoodNet Canada also began whole genome sequencing of all STEC from food, animal, and environmental sources in April 2018. This resulted in a cluster of genetically related STEC isolates with subtype O26:H non-motile, including 4 human cases and one irrigation water sample in the AB site.
Public health impact
The change in laboratory methods and recent implementation of WGS in 2018 has resulted in greater integration across FoodNet Canada components. An increase in the number of non-O157 STEC has increased the ability to identify overlapping subtypes in addition to an improved understanding of travel related STEC. Irrigation water and pork and beef products at the retail level continue to present a risk to public health through food consumption and environmental exposure. In addition, elevated levels of STEC identified among retail meat samples collected from farmers' markets as compared with those collected from supermarkets or independent grocers represents a potential emerging source of foodborne illness.Listeria monocytogenes
| N/A | Ontario site | Alberta site | British Columbia site | All sites | ||||
|---|---|---|---|---|---|---|---|---|
| 2017 | 2018 | 2017 | 2018 | 2017 | 2018 | 2017 | 2018 | |
| Endemic | 0.00 | 0.20 | 0.19 | 0.37 | 0.00 | 0.00 | 0.15 | 0.24 |
| Travel | 0.00 | 0.00 | 0.00 | 0.00 | 0.00 | 0.00 | 0.00 | 0.00 |
| Outbreak | 0.00 | 0.00 | 0.00 | 0.00 | 0.00 | 0.00 | 0.10 | 0.00 |
| Non-endemic | 0.00 | 0.00 | 0.00 | 0.00 | 0.00 | 0.00 | 0.00 | 0.00 |
| Lost to follow-up | 0.21 | 0.00 | 0.10 | 0.09 | 0.00 | 0.00 | 0.10 | 0.05 |
| Total | 0.21 | 0.20 | 0.10 | 0.47 | 0.00 | 0.00 | 0.10 | 0.29 |
* Of 6 total cases reported in 2018, 5 cases were endemic (4 in AB site, 1 in ON site), and 1 case was lost to follow-up (in AB site)
Significant changes in endemic, travel, and total incidence rates:
- There were no significant changes from 2017 to 2018.
| Sample type | Ontario site | Alberta site | British Columbia site | All sites |
|---|---|---|---|---|
| Chicken breast | 11% (13/114) | 12% (14/118) | 26% (34/132) | 17% (61/364) |
| Frozen raw breaded chicken products | 24% (27/114) | 29% (35/120) | 29% (38/131) | 27% (100/365) |
| Ground beef | 17% (19/114) | 21% (25/122) | 26% (34/132) | 21% (78/368) |
| Pork sausage | 20% (23/114) | 13% (16/123) | 17% (23/132) | 17% (62/369) |
* Farmers' market sampling results reported on separately (see Farmers' Market Sampling text box below)
Significant differences in prevalence since 2017:
- There were no significant changes in L. monocytogenes prevalence from 2017 to 2018.
Regional differences:
- L. monocytogenes prevalence in chicken breast in the BC site was significantly higher than in both ON and AB sites.
Whole genome sequencing (WGS)
Listeria isolates were sequenced and retrospectively analysed against human strains to determine their relatedness. In 2017 and 2018, there were a total of 287 and 340 Listeria isolates recovered from retail meats collected across all three FoodNet Canada sentinel sites, respectively. As with Salmonella, a "cluster" consists of two or more isolates, whether human or non-human isolates, found to be related by 0 to 10 allele differences. Isolates with larger allele ranges can be considered related depending on available epidemiologic information and at the discretion of the laboratory.
One cluster comprised of both human and retail meat isolates was identified in 2017. This cluster consisted of one human isolate from QC and a ground beef sample from the BC site. One new cluster comprised of human and retail meat isolates was also identified in 2018. This cluster consisted of one human isolate from BC, and 17 retail meat isolates; 13 chicken breast isolates from the BC site (12) and the AB site (1), and 1 chicken burger and 3 pork sausage isolates from the BC site.
Since the implementation of WGS for Listeria, this method has been found to provide a higher discriminatory power than PFGE for cluster identification (internal communication, PHAC, 2018), which may explain the small number of clusters identified with human isolates. In addition to the two clusters in which FoodNet retail isolates clustered with human isolates, there were instances where retail meat isolates of different types but from the same site, same type but from different sites, and of different types from different sites were also found to be related. These clusters could be explained by common establishments where meat samples were processed, through potential cross-contamination, or product distribution patterns.
Integrated findings
Although the proportion of chicken breast samples testing positive for L. monocytogenes significantly increased between 2015 and 2016 across all sites (combined), this trend has not continued (Figure 4.1). In frozen raw breaded chicken products, despite the significant increase in L. monocytogenes observed between 2016 and 2017, the proportion in 2018 remained consistent with the previous year (Figure 4.2).
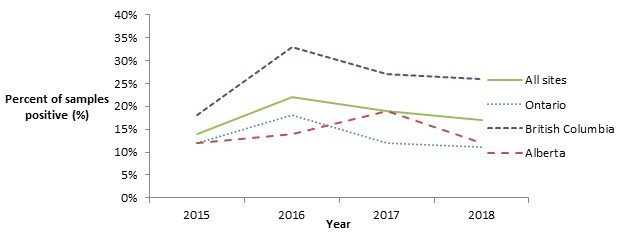
Figure 4.1 - Text description
Figure 4.1 shows a line graph with four lines. The line graph is the proportion of retail chicken breast samples positive for Listeria monocytogenes (y-axis) by sampling year (x-axis) for each of the individual sentinel sites (Ontario, British Columbia, and Alberta) and for all three sentinel sites combined (referred to as 'All Sites'), from 2015 to 2018.
| Proportion of retail chicken breast samples positive for Listeria monocytogenes | ||||
|---|---|---|---|---|
| Year | All Sites | Ontario | British Columbia | Alberta |
| 2015 | 14% | 12% | 18% | 12% |
| 2016 | 22% | 18% | 33% | 14% |
| 2017 | 19% | 12% | 27% | 19% |
| 2018 | 17% | 11% | 26% | 12% |
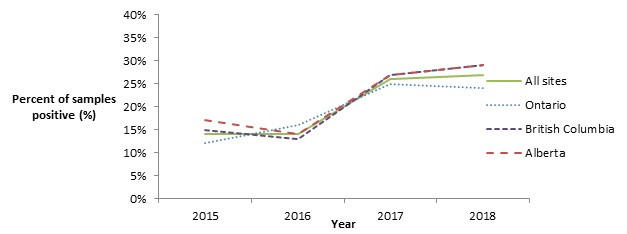
Figure 4.2 - Text description
Figure 4.2 shows a line graph with four lines. The line graph is the proportion of retail frozen raw breaded chicken product samples positive for Listeria monocytogenes (y-axis) by sampling year (x-axis) for each of the individual sentinel sites (Ontario, British Columbia, and Alberta) and for all three sentinel sites combined (referred to as 'All Sites'), from 2015 to 2018.
| Proportion of retail frozen raw breaded chicken product samples positive for Listeria monocytogenes | ||||
|---|---|---|---|---|
| Year | All sites | Ontario | British Columbia | Alberta |
| 2015 | 14% | 12% | 15% | 17% |
| 2016 | 14% | 16% | 13% | 14% |
| 2017 | 26% | 25% | 27% | 27% |
| 2018 | 27% | 24% | 29% | 29% |
The proportion of ground beef samples testing positive for L. monocytogenes continues to be high, with 21% of samples testing positive across all sites in 2018, compared to 23% of samples testing positive across all sites in 2017. Although the proportion detected in the ON and BC site's ground beef samples decreased slightly in 2018, in the AB site samples, the proportion testing positive continued to increase (Figure 4.3).
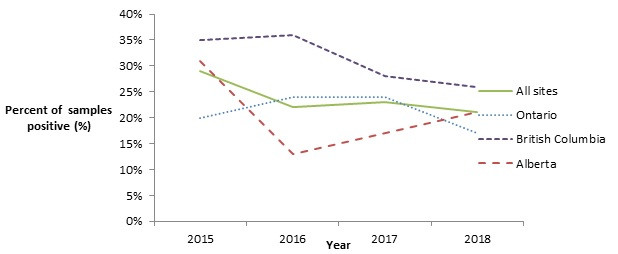
Figure 4.3 - Text description
Figure 4.3 shows a line graph with four lines. The line graph is the proportion of retail ground beef samples positive for Listeria monocytogenes (y-axis) by sampling year (x-axis) for each of the individual sentinel sites (Ontario, British Columbia, and Alberta) and for all three sentinel sites combined (referred to as 'All Sites'), from 2015 to 2018.
| Proportion of retail ground beef samples positive for Listeria monocytogenes | ||||
|---|---|---|---|---|
| Year | All Sites | Ontario | British Columbia | Alberta |
| 2015 | 29% | 20% | 35% | 31% |
| 2016 | 22% | 24% | 36% | 13% |
| 2017 | 23% | 24% | 28% | 17% |
| 2018 | 21% | 17% | 26% | 21% |
All retail products routinely sampled in 2018 were collected from either independent stores, such as butcher shops, or chain grocery stores. Farmers' market sampling results were not included in the overall analysis and are presented separately (see textbox below). Of the routinely sampled retail products (i.e. from independent or chain grocery stores), the proportion of both ground beef and pork sausage samples testing positive for L. monocytogenes was found to be significantly higher among samples collected from independent stores compared to chain grocery stores (for all sites combined) (Figure 4.4). The only significant difference found among chicken breast samples collected at independent stores compared with chain grocery stores in 2018 was in BC site samples, where the proportion testing positive was higher in independent stores. Among ground beef samples collected (for all sites combined), those that were from an establishment where the inspection jurisdiction was unknown (i.e. not specified) were significantly more likely to test positive for L. monocytogenes compared with samples from establishments known to be federally inspected.

Figure 4.4 - Text description
Figure 4.4 shows a side by side comparison of the prevalence of Listeria monocytogenes in retail samples of chicken breast, ground beef, and pork sausage collected from independent stores (such as butcher's shops) versus samples of the same commodities collected from chain grocery stores or supermarkets.
| N/A | Store type | |
|---|---|---|
| Independent stores | Chain grocery stores | |
| Chicken breast | 22% | 15% |
| Ground beef | 33% | 18% |
| Pork sausage | 36% | 13% |
Farmers' Market Sampling
From May–August of 2018, FoodNet Canada conducted farmers' market sampling of retail meats in the ON and AB sites, collecting and testing chicken breast, ground beef and pork sausage products for Listeria monocytogenes. The following tested positive for L. monocytogenes:
- 39% (9/23) of chicken breast samples.
- 35% (8/23) of ground beef samples.
- 43% (19/44) of pork sausage samples.
Public health impact
Consumer awareness of foods as potential sources for Listeria continues to be important. For example, as members of the general public may not be aware that raw or undercooked ground beef is a potential source for Listeria infection, this presents an opportunity for targeted consumer education efforts, particularly towards high risk populations (i.e. pregnant women, the elderly, and those who are immunocompromised)Footnote 10. According to Foodbook, 0.7% of Canadians eat ground beef raw or undercooked (e.g. steak tartar, undercooked hamburgers, etc.)Footnote 11.
The continued use of prospective whole genome sequencing will enable us to further explore relationships and better assess the transmission patterns for Listeria. In addition, the inclusion of retail products in human clusters will continue to inform the outbreak hypothesis generating processes, allowing investigations to be more focused on specific products, and assist in providing the information required for product recalls.
Yersinia
| N/A | Ontario site | Albertaa site | British Columbiab site | All sites | ||||
|---|---|---|---|---|---|---|---|---|
| 2017 | 2018 | 2017 | 2018 | 2017 | 2018 | 2017 | 2018 | |
| Endemic | 0.41 | 0.00 | 1.25 | 1.77 | 14.21 | 10.16 | 4.17 | 3.38 |
| Travel | 0.41 | 0.41 | 0.48 | 0.28 | 2.26 | 2.39 | 0.89 | 0.82 |
| Outbreak | 0.00 | 0.00 | 0.00 | 0.00 | 0.00 | 0.00 | 0.00 | 0.00 |
| Non-endemic | 0.00 | 0.00 | 0.00 | 0.00 | 0.00 | 0.00 | 0.00 | 0.00 |
| Lost to follow-up | 0.21 | 0.20 | 0.10 | 0.19 | 2.06 | 1.39 | 0.00 | 0.48 |
| Total | 1.03 | 0.61 | 1.82 | 2.23 | 18.53 | 13.95 | 5.66 | 4.69 |
a Starting in November 27, 2018 all Yersinia species became reportable to Alberta Health. The Alberta site does not follow-up with Yersinia intermedia cases.
b As of June 2016, private laboratories in the British Columbia site implemented the use of cold enrichment for the detection of Yersinia
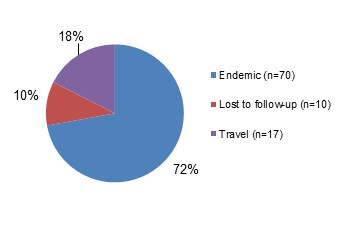
Figure 5.1 - Text description
Figure 5.1 shows a pie chart of the relative proportion of Yersinia cases in the FoodNet Canada surveillance system by case classification of endemic, lost to follow-up, outbreak and travel) for 2018. The chart includes the case classification, the number of cases and the relative proportion.
| Case Classification | Number of cases | Relative proportion |
|---|---|---|
| Endemic | 70 | 72% |
| Lost to Follow-Up | 10 | 10% |
| Travel | 17 | 18% |
Isolates with species information: 97/97 (100%)
Top Yersinia subtypes:
- enterocolitica: 96%
- frederiksenii: 2%
- intermedia: 1%
- pseudotuberculosis: 1%
Significant changes in endemic, travel, and total incidence rates:
- There were no significant changes from 2017 to 2018.
Clinical profile (endemic cases only):
- Most commonly reported symptoms
- Diarrhea: 83%
- Abdominal pain: 64%
- Fatigue and weakness: 46%
- Nausea: 34%
- Anorexia: 29%
- Indicators of severity:
- Bloody diarrhea: 19%
- Emergency room visits: 14%
- Hospitalizations: 6%
- Antimicrobial prescriptions: 33%
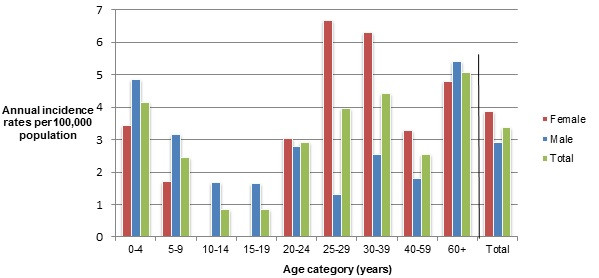
Figure 5.2 - Text description
Figure 5.2 shows a bar chart of the annual incidence rate of Yersinia per 100,000 population by overall total age category and by age category and gender for 2018. The y-axis presents the incidence rate per 100,000 population and the x-axis presents the age categories. The bars represent the total incidence for all genders by age group as well as the total incidence of male and female separately by age category.
| Age category | Female | Male | Overall total (all genders combined) |
|---|---|---|---|
| 0 to 4 | 3.42 | 4.84 | 4.15 |
| 5 to 9 | 1.69 | 3.15 | 2.45 |
| 10 to 14 | 0.00 | 1.66 | 0.85 |
| 15 to 19 | 0.00 | 1.65 | 0.84 |
| 20 to 24 | 3.03 | 2.77 | 2.90 |
| 25 to 29 | 6.66 | 1.30 | 3.95 |
| 30 to 39 | 6.31 | 2.53 | 4.42 |
| 40 to 59 | 3.29 | 1.80 | 2.54 |
| 60+ | 4.78 | 5.41 | 5.08 |
| Overall Total (all ages combined) | 3.86 | 2.90 | 3.38 |
Food, animal, and environmental surveillance summary
Testing retail pork for Yersinia was discontinued in 2016 due to the low number of human pathogenic strains recovered from pork. Similarly in 2012 testing for Yersinia ceased across all commodities in the FoodNet Canada farm component due to a low number of detections.
Public health impact
Since 2016, an increase in the incidence of yersiniosis has been noted in the BC site. The upsurge in case detections was a result of a change in testing protocol, specific to laboratories in BC. This included the use of cold enrichment techniques for the recovery of Yersinia enterocolitica from stools and a shift to routine testing of stools whereas previously testing was conducted only at the request of the attending physician. In 2018, of the cases for which a laboratory test was reported, 72% of detections were identified by cold enrichment and the remaining 28% by traditional culture methods. Yersinia enterocolitica strains of biotype 1A comprised 91% of cold enrichment detections, compared with 64% in the culture-based findings. Biotype 1A isolates are commonly regarded as avirulent. Some, however, may harbour enterotoxin-producing genes and have been implicated in foodborne outbreaksFootnote 12.
Upon review of the clinical and demographic characteristics of all cases across the sentinel sites, there were no differences in the age distribution of yersiniosis by testing method or the distribution of cases by case classification. However, symptomology suggests more severe disease among culture-based method cases and more chronic disease among those diagnosed by cold enrichment.
A study is currently underway to sequence and characterize historical Yersinia isolates collected in the BC sentinel site to better understand the potential differences in pathogenicity and contribution to disease of strains detected by primary culture versus cold enrichment.
Shigella
| N/A | Ontario site | Alberta site | British Columbia site | All sites | ||||
|---|---|---|---|---|---|---|---|---|
| 2017 | 2018 | 2017 | 2018 | 2017 | 2018 | 2017 | 2018 | |
| Endemic | 0.21 | 1.01 | 0.77 | 0.19 | 1.85 | 1.79 | 0.89 | 0.77 |
| Travel | 1.03 | 1.01 | 0.38 | 0.47 | 1.85 | 2.19 | 0.89 | 1.01 |
| Outbreak | 0.00 | 0.00 | 0.00 | 0.00 | 0.00 | 0.00 | 0.00 | 0.00 |
| Non-endemic | 0.00 | 0.00 | 0.00 | 0.00 | 0.00 | 0.00 | 0.00 | 0.00 |
| Lost to follow-up | 0.00 | 0.41 | 0.10 | 0.19 | 0.00 | 0.20 | 0.05 | 0.24 |
| Total | 1.24 | 2.43 | 1.25 | 0.84 | 3.71 | 4.18 | 1.84 | 2.03 |
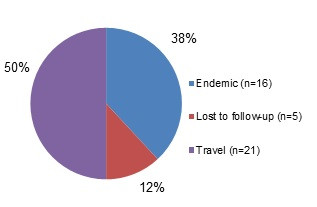
Figure 6.1 - Text description
Figure 6.1 shows a pie chart of the relative proportion of shigellosis cases in the FoodNet Canada surveillance system by case classification of endemic, lost to follow-up and travel for 2018. The chart includes the case classification, the number of cases and the relative proportion of cases.
| Case classification | Number of cases | Relative proportion |
|---|---|---|
| Endemic | 16 | 38% |
| Lost to follow-up | 5 | 12% |
| Travel | 21 | 50% |
Isolates with Shigella spp. information: 42/42 (100%)
- flexneri: 57%
- sonnei: 40%
- dysenteriae: 2%
Significant changes in endemic, travel, and total incidence rates:
- There were no significant changes from 2017 to 2018.
2018 travel cases: 21/42 (50%)
- Cases by region travelled to:
- Asia: 48%
- Americas (Central, South and Caribbean): 52%
Public health impact
Travel continues to be an important factor for Shigella exposure in 2018, accounting for 50% of all reported human cases. Of these, travel region reported was almost evenly split between the Americas (Central, South, Caribbean) which accounted for 52% of cases, and Asia, which accounted for 48%. Due to low pathogen isolation among retail produce samples tested for Shigella in the past, routine testing for Shigella is no longer conducted in retail samples. However, the collection of risk factor information for endemic cases, including exposure to daycares and contaminated food and water, is important and allows for continued investigation of sources of human illness in Canada.
Parasites
Giardia
| N/A | Ontario sitea | Alberta site | British Columbia site | All sites | ||||
|---|---|---|---|---|---|---|---|---|
| 2017 | 2018 | 2017 | 2018 | 2017 | 2018 | 2017 | 2018 | |
| Endemic | 2.06 | 3.24 | 4.03 ↓ | 4.84 | 3.91 | 3.39 | 3.53 ↓ | 4.11 |
| Travel | 1.86 | 1.62 | 3.64 | 3.91 | 3.91 | 3.19 | 3.28 | 3.19 |
| Outbreak | 0.00 | 0.00 | 0.00 | 0.00 | 0.00 | 0.00 | 0.00 | 0.00 |
| Non-endemic | 0.62 | 0.00 | 1.92 | 2.51 | 0.62 | 1.79 | 1.29 | 1.74 |
| Lost to follow-up | 2.06 | 2.43 | 0.86 | 0.56 | 0.82 | 1.39 | 1.14 | 1.21 |
| Total | 6.61 | 7.30 | 10.45 | 11.82 | 9.26 | 9.76 | 9.24 ↓ | 10.25 |
a As of May 1, 2018 Ontario site does not report on asymptomatic Giardia cases.
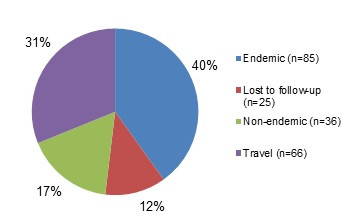
Figure 7.1 - Text description
Figure 7.1 shows a pie chart of the relative proportion of giardiasis cases in the FoodNet Canada surveillance system by case classification of endemic, lost to follow-up, non-endemic and travel for 2018. The chart shows the number of cases and the relative proportion in percent, by case classification.
| Case Classification | Number of cases | Relative proportion |
|---|---|---|
| Endemic | 85 | 40% |
| Lost to Follow-Up | 25 | 12% |
| Non-Endemic | 36 | 17% |
| Travel | 66 | 31% |
Clinical profile (endemic cases only):
- Most commonly reported symptoms
- Diarrhea: 86%
- Abdominal pain: 69%
- Fatigue and weakness: 62%
- Nausea: 60%
- Anorexia: 56%
- Indicators of severity:
- Bloody diarrhea: 11%
- Emergency room visits: 32%
- Hospitalizations: 5%
- Antimicrobial prescriptions: 71%
Significant changes in endemic, travel, and total incidence rates:
- There were no significant changes from 2017 to 2018.
2018 travel cases: 66/212 (31%)
- Cases by region travelled to:
- Asia: 45%
- Americas (Central, South, Caribbean): 36%
- USA: 9%
- Multiple/Other: 6%
- Africa: 2%
- Europe: 2%
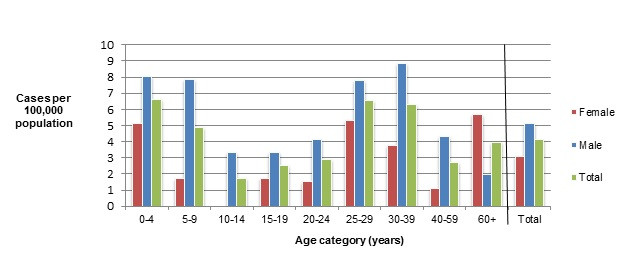
Figure 7.2 - Text description
Figure 7.2 shows a bar chart of the annual incidence rate of giardiasis per 100,000 by age category and gender for 2018. The y-axis presents the incidence rate per 100,000 population and the x-axis presents the age categories and gender combinations. There are three bars side-by-side for each age group: a bar representing females, a bar representing males and a bar representing the overall incidence of both genders combined. Age categories are defined by a range of years.
| Age category | Female | Male | Overall total (all genders combined) |
|---|---|---|---|
| 0 to 4 | 5.13 | 8.06 | 6.64 |
| 5 to 9 | 1.69 | 7.88 | 4.90 |
| 10 to 14 | 0.00 | 3.33 | 1.71 |
| 15 to 19 | 1.73 | 3.30 | 2.53 |
| 20 to 24 | 1.52 | 4.16 | 2.90 |
| 25 to 29 | 5.33 | 7.79 | 6.58 |
| 30 to 39 | 3.79 | 8.85 | 6.32 |
| 40 to 59 | 1.10 | 4.33 | 2.72 |
| 60+ | 5.65 | 1.97 | 3.92 |
| Overall Total (all ages combined) | 3.09 | 5.13 | 4.11 |
Cryptosporidium
| N/A | Ontario site | Alberta site | British Columbia site | All sites | ||||
|---|---|---|---|---|---|---|---|---|
| 2017 | 2018 | 2017 | 2018 | 2017 | 2018 | 2017 | 2018 | |
| Endemic | 1.65 | 2.23 | 2.11 | 4.56 ↑ | 1.44 | 1.20 | 1.84 | 3.19 ↑ |
| Travel | 0.00 | 0.20 | 1.25 | 1.30 | 0.21 | 0.80 | 0.70 | 0.92 |
| Outbreak | 0.00 | 0.00 | 0.00 | 0.00 | 0.00 | 0.00 | 0.00 | 0.00 |
| Non-endemic | 0.00 | 0.00 | 0.00 | 0.00 | 0.00 | 0.00 | 0.00 | 0.00 |
| Lost to follow-up | 0.41 | 1.42 | 0.19 | 0.74 | 0.21 | 0.00 | 0.25 | 0.72 |
| Total | 2.06 | 3.85 | 3.55 | 6.61 ↑ | 1.85 | 1.99 | 2.78 | 4.83 ↑ |
↑ Indicates a significant increase in prevalence in 2018.
Significant changes in endemic, travel, and total incidence rates:
- There was a significant increase in the all sites total and endemic incidence rates from 2017 to 2018. In 2018 some private laboratories implemented PCR multiplex testing. This change may have led to an increase in detections.
- There was a significant increase in the AB site total and endemic rates from 2017 to 2018.
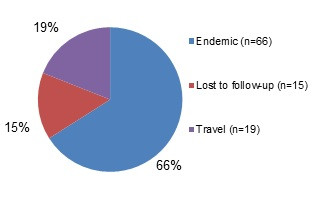
Figure 8.1 - Text description
Figure 8.1 shows a pie chart of the relative proportion of cryptosporidiosis cases in the FoodNet Canada surveillance system by case classification of endemic, lost to follow-up, and travel for 2018. The chart shows the number of cases and the relative proportion in percent, by case classification.
| Case classification | Number of cases | Relative proportion |
|---|---|---|
| Endemic | 66 | 66% |
| Lost to Follow-Up | 15 | 15% |
| Travel | 19 | 19% |
Clinical profile (endemic cases only):
- Most commonly reported symptoms
- Diarrhea: 100%
- Abdominal pain: 80%
- Fatigues and weakness: 76%
- Anorexia: 74%
- Nausea: 71%
- Indicators of severity:
- Bloody diarrhea: 5%
- Emergency room visits: 53%
- Hospitalization: 3%
- Antibiotic prescriptions: 29%
2018 travel cases: 19/100 (19%)
- Cases by region travelled to:
- Americas (Central, South, Caribbean): 42%
- Asia: 26%
- Africa: 11%
- Multiple/Other: 11%
- U.S.A: 5%
- Europe : 5%
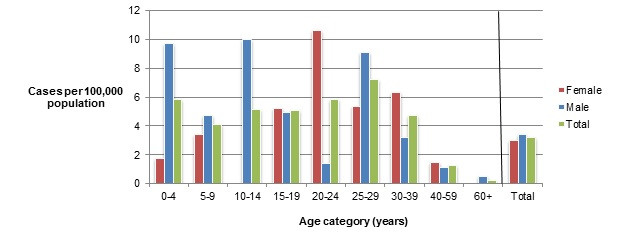
Figure 8.2 - Text description
Figure 8.2 shows a bar chart of the annual incidence rate of cryptosporidiosis per 100,000 by age category and gender for 2017. The y-axis presents the incidence rate per 100,000 population and the x-axis presents the age categories and gender combinations. There are three bars side-by-side for each age group: a bar representing females, a bar representing males and a bar representing the overall incidence of both genders combined. Age categories are defined by a range of years.
| Age category | Female | Male | Overall total (all genders combined) |
|---|---|---|---|
| 0 to 4 | 1.71 | 9.68 | 5.81 |
| 5 to 9 | 3.39 | 4.73 | 4.08 |
| 10 to 14 | 0.00 | 9.98 | 5.12 |
| 15 to 19 | 5.20 | 4.95 | 5.07 |
| 20 to 24 | 10.61 | 1.39 | 5.79 |
| 25 to 29 | 5.33 | 9.09 | 7.23 |
| 30 to 39 | 6.31 | 3.16 | 4.74 |
| 40 to 59 | 1.46 | 1.08 | 1.27 |
| 60+ | 0.00 | 0.49 | 0.23 |
| Overall Total (all ages combined) | 2.99 | 3.38 | 3.19 |
Cyclospora
| N/A | Ontario site | Alberta site | British Columbia site | All sites | ||||
|---|---|---|---|---|---|---|---|---|
| 2017 | 2018 | 2017 | 2018 | 2017 | 2018 | 2017 | 2018 | |
| Endemic | 0.83 | 0.00 | 0.00 | 0.09 | 0.00 | 0.00 | 0.20 | 0.05 |
| Travel | 0.00 | 1.42 | 0.10 | 0.09 | 1.44 | 0.20 | 0.40 | 0.43 |
| Outbreak | 0.00 | 0.00 | 0.00 | 0.00 | 0.00 | 0.20 | 0.00 | 0.05 |
| Non-endemic | 0.00 | 0.00 | 0.00 | 0.00 | 0.00 | 0.00 | 0.00 | 0.00 |
| Lost to follow-up | 0.00 | 0.41 | 0.00 | 0.00 | 0.21 | 0.00 | 0.05 | 0.10 |
| Total | 0.83 | 1.82 | 0.10 | 0.19 | 1.65 | 0.40 | 0.65 | 0.63 |
Significant changes in endemic, travel, and total incidence rates:
- There were no significant changes from 2017 to 2018.
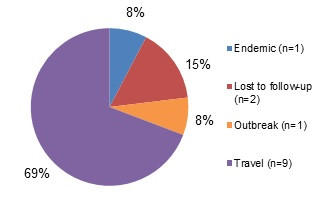
Figure 9.1 - Text description
Figure 9.1 shows a pie chart of the relative proportion of cyclosporiasis cases in the FoodNet Canada surveillance system by case classification of endemic, lost to follow-up, and travel for 2018. The chart shows the number of cases and the relative proportion in percent, by case classification.
| Case Classification | Number of cases | Relative proportion |
|---|---|---|
| Endemic | 1 | 8% |
| Lost to Follow-Up | 2 | 15% |
| Outbreak | 1 | 8% |
| Travel | 9 | 69% |
2018 travel cases: 9/13 (69%)
- Cases by region travelled to:
- Americas (Central, South, Caribbean): 67%
- Asia: 11%
- U.S.A.: 11%
- Other: 11%
- Cases by country of travel in the Americas:
- Mexico: 83%
- Cuba: 17%
Retail sampling summary
Please see summary of targeted studies of seafood.
Public health impact
Similar to previous years, the majority (69%) of cyclosporiasis cases in 2018 were acquired during travel to regions where the parasite is endemic. Mexico was the most common destination for those reporting travel to the Americas (Central, South, Caribbean). Education of safe food practices continues to be the best strategy to reduce the risk of Cyclospora infections in Canadian travelersFootnote 13.
Targeted study: raw bivalve molluscs at retail
A two year targeted study to describe the presence of pathogens in raw, bivalve molluscs commenced in January 2018. For the first year of reporting, the results have been combined for all sites.
Results at a glance (2018)
During the course of the year, 188 samples of bivalve molluscs (125 raw mussels; 63 raw oysters) were submitted for testing. Due to viable sample volumes, the number of pathogens included in testing varied. The organisms isolated from the retail samples included Vibrio spp (62%; 112/182), generic Escherichia coli (27%; 48/180), Giardia duodenalis Assemblage B (4%; 7/177), Cryptosporidium parvum (4%; 7/177), Listeria monocytogenes (4%; 6/169), Toxoplasma gondii (2%; 4/182), and Salmonella (0.6%; 1/180) (Table 10.1). Laboratory results for norovirus and hepatitis A were pending at the time of report production and will be published in the 2019 FoodNet Canada Annual Report.
| Sample type | Bacteria | Parasites | |||||
|---|---|---|---|---|---|---|---|
| Generic E. coli | Listeria | Salmonella | Vibrio | Giardia | Toxoplasma | Cryptosporidium | |
| Mussels | 24% (29/119) |
4% (5/118) |
0% (0/119) |
52% (63/121) |
3% (4/119) |
3% (4/121) |
4% (5/119) |
| Oysters | 31% (19/61) |
2% (1/51) |
2% (1/61) |
80% (49/61) |
5% (3/58) |
0% (0/61) |
3% (2/58) |
Vibrio species were found in 52% of mussels and 80% of oysters tested. Of these, potentially pathogenic strains belonging to the species Vibrio alginolyticus, V. parahaemolyticus, V. vulnificus and non-01/non-139 V. cholerae were detected individually or in combination with one or more strains. One or more virulence genes associated with foodborne illness (vibriosis) were found in 76% (85/112) of Vibrio isolates from the combined sample types of mussels and oysters (Table 10.2). Of the oysters, 69% (42/61) of isolates carried between 1 and 5 virulence genes.
| Sample type | Vibrio spp. (Number of isolates) | Number of isolates containing virulence genes | |||||
|---|---|---|---|---|---|---|---|
| clg+ | ctx+ | tdh+ | tlh+ | trh+ | Vvha+ | ||
| Mussels | alginolyticus (n=47) | 31 | - | - | 11 | - | - |
| cholera (n=6) | - | 1 | - | - | - | - | |
| parahaemolyticus (n=20) | - | - | - | 17 | 1 | - | |
| vulnificus (n=7) | - | - | - | - | - | 7 | |
| Oysters | alginolyticus (n=42) | 36 | - | - | - | - | - |
| cholera (n=2) | - | - | - | - | - | - | |
| parahaemolyticus (n=19) | - | - | 2 | 11 | 4 | - | |
| vulnificus (n=3) | - | - | - | - | - | 2 | |
Vibrio species in mussels and oysters at retail were detected throughout the year. V. alginolyticus was the most commonly identified species in both mussels and oysters as a single species (56 %; 63/112) and in combination with V. parahaemolyticus (24%; 27/112) throughout the year (Figure 10.1). In mussels, the variety of Vibrio species was greater overall than in oysters.
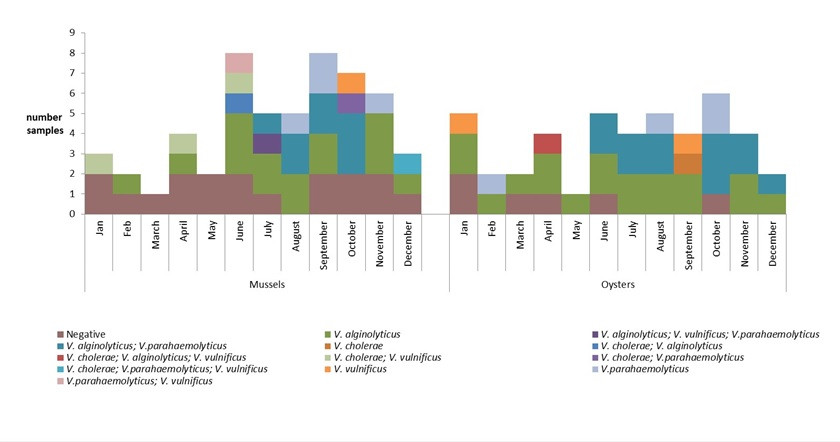
Figure 10.1 - Text description
This figure is a vertically stacked bar graph displaying the results for Vibrio isolation and species by sample (y-axis) by month (x-axis) for mussels and oysters collected by FoodNet Canada in 2018. Each sample collected is colour coded to represent whether the sample was negative for Vibrio spp. or the species recovered. Each sample has between 0-3 species recovered and each unique combination of species recovered from a single sample are represented by a single colour.
| Month | Mussels | ||||||||||
|---|---|---|---|---|---|---|---|---|---|---|---|
| Negative | V. alginolyticus | V. vulnificas | V. parahaemolyticus | V. cholerae; V. vulnificus |
V. cholerae; V. alginolyticus |
V. parahaemolyticus; V. vulnificus |
V. alginolyticus; V. parahaemolyticus |
V. alginolyticus; V. vulnificus; V. parahaemolyticus |
V. cholerae; V. parahaemolyticus |
V. cholerae; V. parahaemolyticus; V. vulnificus |
|
| Jan. | 2 | N/A | N/A | N/A | 1 | N/A | N/A | N/A | N/A | N/A | N/A |
| Feb. | 1 | 1 | N/A | N/A | N/A | N/A | N/A | N/A | N/A | N/A | N/A |
| Mar. | 1 | N/A | N/A | N/A | N/A | N/A | N/A | N/A | N/A | N/A | N/A |
| Apr. | 2 | 1 | N/A | N/A | 1 | N/A | N/A | N/A | N/A | N/A | N/A |
| May | 2 | N/A | N/A | N/A | N/A | N/A | N/A | N/A | N/A | N/A | N/A |
| Jun. | 2 | 3 | N/A | N/A | 1 | 1 | 1 | N/A | N/A | N/A | N/A |
| Jul. | 1 | 2 | N/A | N/A | N/A | N/A | N/A | 1 | 1 | N/A | N/A |
| Aug. | N/A | 2 | N/A | 1 | N/A | N/A | N/A | 2 | N/A | N/A | N/A |
| Sep. | 2 | 2 | N/A | 2 | N/A | N/A | N/A | 2 | N/A | N/A | N/A |
| Oct. | 2 | N/A | 1 | N/A | N/A | N/A | N/A | 3 | N/A | 1 | N/A |
| Nov. | 2 | 3 | N/A | 1 | N/A | N/A | N/A | N/A | N/A | N/A | N/A |
| Dec. | 1 | 1 | N/A | N/A | N/A | N/A | N/A | N/A | N/A | N/A | 1 |
| Month | Oysters | ||||||
|---|---|---|---|---|---|---|---|
| Negative | V. alginolyticus | V. vulnificus | V. cholerae | V. parahaemolyticus | V. cholerae; V. alginolyticus; V. vulnificus |
V. alginolyticus; V. parahaemolyticus |
|
| Jan. | 2 | 2 | 1 | N/A | N/A | N/A | N/A |
| Feb. | N/A | 1 | N/A | N/A | 1 | N/A | N/A |
| Mar. | 1 | 1 | N/A | N/A | N/A | N/A | N/A |
| Apr. | 1 | 2 | N/A | N/A | N/A | 1 | N/A |
| May | N/A | 1 | N/A | N/A | N/A | N/A | N/A |
| Jun. | 1 | 2 | N/A | N/A | N/A | N/A | 2 |
| Jul. | N/A | 2 | N/A | N/A | N/A | N/A | 2 |
| Aug. | N/A | 2 | N/A | N/A | 1 | N/A | 2 |
| Sep. | N/A | 2 | 1 | 1 | N/A | N/A | N/A |
| Oct. | 1 | N/A | N/A | N/A | 2 | N/A | 3 |
| Nov. | N/A | 2 | N/A | N/A | N/A | N/A | 2 |
| Dec. | N/A | 1 | N/A | N/A | N/A | N/A | 1 |
Public health impact
Of the samples tested, the proportion testing positive for most of the food borne pathogens tested remained low. The prevalence of Vibrio spp., however, was high. Vibrio is a bacterium that is naturally occuring in coastal marine environments. Although many Vibrio species only rarely cause illness or their potential to cause illness is unknown, strains carrying virulence genes (Table 10.2) are of concern.
Symptoms of Vibro infection range from mild to severe gastroenteritis with some species causing wound and blood-borne infections. Severe symptoms do result in hospitalizations and in rare cases, deathFootnote 14. In Canada, only infections caused by Vibrio cholerae are reportable nationallyFootnote 15, while V. parahaemolyticus is reportable in the provinces of British ColumbiaFootnote 16 and AlbertaFootnote 17. The Canadian Food Inspection Agency conducts testing and enforces Health Canada's bacteriological guidelines for Vibrio cholerae contamination on cooked and ready to eat mussles, and V. parahaemolyticus contamination on raw oystersFootnote 18. In 2015, the largest Canadian outbreak of V. parahaemolyticus infection caused by raw oysters occurred, with changing sea surface temperatures identified as a probable causeFootnote 19. Based on the Vibrio reported to the Canadian National Enteric Surveillance ProgramFootnote 20, the incidence rate was 0.15 cases per 100,000 population in 2017Footnote 20. Due to different province-specific practices of reporting non-cholera Vibrio spp. the true magnitude of vibriosis in the Canadian population is unknown.
A major risk factor for vibriosis is consuming raw or undercooked seafoodFootnote 14. The clinical significance of Vibrio species identified in this targeted study is still unknown as the quantity of bacteria in the sample is unknown and the potential of Vibrio alginolyticus and Vibrio vulnificus to cause vibriosis is still unknown. Since the main consumption trend of oysters is to eat freshly shucked raw oysters, this is an emerging potential source for foodborne illness.
Raw or undercooked bivalve molluscs continue to be a potential source for foodborne illness in Canada.
Appendix A - Data collection and reporting and surveillance strategy
Data collection and reporting
Each FoodNet Canada sentinel site relies on a unique partnership with the local public health authority, private laboratories, water and agri-food sectors as well as the provincial and federal institutions responsible for public health, food safety, and water safety. The sites include Ontario (Middlesex-London Health Unit), British Columbia (Fraser Health Authority) and Alberta (Calgary and Central Zones of Alberta Health Services). The Ontario (ON) site data collection began in August of 2014; data from the ON pilot sentinel site (Region of Waterloo) (2005–Mar 2014) were not included in this report. The British Columbia (BC) site was officially established in April 2010 and includes the communities of Burnaby, Abbotsford, and Chilliwack. The province of Alberta (AB) contains the third site and data collection began in June of 2014.
Results are reported for all three sites unless otherwise stated. Readers should be cautious when extrapolating these results to areas beyond the sentinel communities. As additional sentinel sites are established, comprehensive information from laboratory and epidemiological analyses from all sites will provide more representative national trends in enteric disease incidence and exposure sources to inform accurate estimates for all of Canada.
In 2018, the farm and retail components were active across all sentinel sites in ON, AB, and BC whereas the water component was only active in AB and BC. The non-human surveillance data collected by FoodNet Canada represents possible exposure sources for human enteric illnesses within each sentinel site. The data are meant to be interpreted aggregately and cannot to be used to directly attribute a specific human case reported to FoodNet Canada to a positive isolate obtained from an exposure source. In this report, the non-human and human data are integrated using descriptive methods. The term "significant" is reserved in this report for describing trends that are statistically significant.
FoodNet Canada retail and farm sampling is integrated with CIPARS. This has included the streamlining and sharing of sampling and sampling sites, retrospective and prospective testing of antimicrobial resistance in selected bacteria isolated from FoodNet Canada samples, and improving data management mechanisms to maximize data linkages. CIPARS monitors trends and the relationship between antimicrobial use and antimicrobial resistance in selected bacterial organisms from human, animal, and food sources across Canada to inform evidence-based policy decision making to contain the emergence and spread of resistant bacteria. For further information about CIPARS, please refer to the program's website.
Surveillance strategy
Human surveillance
Public health professionals in each site use FoodNet Canada's enhanced standardized questionnaire to interview reported enteric disease cases (or proxy respondents). Information on potential exposures collected from the questionnaires is used to determine case classification (e.g. international travel, endemic) and compare exposures between cases. In addition, advanced subtyping analyses on isolates from case specimens are conducted for further integration with non-human source information.
Retail surveillance
The retail stage of food production represents the point closest to consumers through which they can be exposed to enteric pathogens. Retail meats, meat products are collected from a variety of large and small food retail outlets on a routine basis throughout the year within each site. FoodNet Canada collects samples of raw fresh (chilled) skinless chicken breasts and ground beef on a weekly basis. Each year, FoodNet Canada and its partners assess knowledge gaps and from this process, select targeted retail products to sample for a given year (see Appendix C for 2018 details). In past years, targeted meats have included but were not limited to pork chops, ground chicken and turkey, veal and uncooked frozen breaded chicken products, such as nuggets and strips. In 2018, FoodNet Canada opted to continue the targeted investigation of frozen breaded chicken products that began in 2011 as well as incorporating fresh pork sausage and fresh bivalve molluscs (oysters and mussels). In 2018, FoodNet Canada also began a targeted study collecting retail meat samples (chicken breast, ground beef and pork sausage) from farmers' markets in the AB and ON sentinel sites. Samples were collected once per month from May–August, replacing grocery store samples during those weeks. Preliminary results from the farmers' market sampling are presented throughout the report. Microbiological testing continued in 2018 as in previous years with Campylobacter and Salmonella being tested for among all chicken products and pork sausage, Listeria spp. tested for in all retail meat products, and shigatoxigenic Escherichia coli (STEC) tested for in ground beef and pork sausage samples. Raw bivalve molluscs were tested for the presence of Vibrio, Salmonella, Giardia duodenalis, Listeria monocytogenes, Toxoplasma gondii, Hepatitis A, and Norovirus.
Beginning in January 2018, a two-year targeted study was undertaken to describe the contamination of pathogens in raw, bivalve molluscs. In consultation with internal and external stakeholders, data from outbreak, surveillance, consumption, and research were used to define the study parameters. Raw shelled oysters and mussels were collected using the FoodNet Canada retail component sampling platform in all three sentinel sites (British Columbia, Alberta and Ontario). Sampling structure included large chain stores, small independent stores and fish mongers within the 2018 sampling schedule. Laboratory diagnostics for bacteria, viruses and parasites was conducted at FoodNet Canada-associated laboratories using culture-based methods for bacteria, PCR-based detection methods for viruses and PCR-based and microscopy methods for parasites. Enumeration of bacterial load was not conducted. Vibrio virulence genes associated with disease-causing properties were tested for using PCR methods in all Vibrio isolates. For the first year of reporting, the results have been combined for all sites.
On-farm surveillance
The presence of enteric pathogens on farms is a potential source of environmental exposure of enteric pathogens, and also represents an important source in the farm-to-fork transmission chain. In 2018, the farm component was active across all three sentinel sites, although commodities varied by site (Appendix C). Manure samples were collected from beef cattle, swine, broiler chicken, and turkey farms in order to estimate the pathogen levels on farms. Approximately 30 farms of each type of participating farm commodities are targeted in each site, however, the number of farms and sampling location is based on the representativeness of each commodity in a particular region. A short management survey, and up to six manure samples (usually fresh pooled samples) were obtained at each farm visit. All samples were tested for Campylobacter and Salmonella with the beef samples additionally being tested for E. coli O157 and STEC. Throughout the report, farm results are reported at both the sample-level and farm-level to account for clustering within farms. Sample-level results include all manure samples collected on each farm, while farm-level results are based on a threshold of one positive manure sample per farm to report a farm as positive.
Water surveillance
Water is another environmental source of enteric pathogens collected in the FoodNet Canada surveillance program. In 2018, irrigation water was sampled in both the BC and AB sentinel sites and was tested for Campylobacter, Salmonella, and STEC (Appendix C). Sampling in BC occurred bi-weekly from April to July, and monthly in AB from May to August.
Whole genome sequencing (WGS) – Listeria, Salmonella, and STEC
In January 2017, WGS was implemented across Canada as the primary tool to characterize Listeria isolates causing invasive human listeriosis, including cases captured within FoodNet Canada's sentinel sites. Shortly after WGS implementation for human isolates, FoodNet Canada also began to work with PHAC's National Microbiology Laboratory (NML) to sequence Listeria isolates from non-clinical retail meat samples collected by FoodNet Canada, which have been analyzed together with human isolates to assist in surveillance and outbreak detection activities. Since the implementation of WGS for Salmonella isolates in May 2017, FoodNet Canada has continued to work with PHAC's NML to assist in outbreak detection activities, in addition to integrating and analyzing WGS information from FoodNet Canada's human, retail, farm and water components. In April 2018, FoodNet Canada also began WGS for all STEC isolates from retail, farm, and water sources. This integration of data has presented new opportunities in understanding the transmission pathways of these organisms.
Appendix B - FoodNet Canada sentinel site boundaries
Sentinel site 1: Ontario (Middlesex-London Health Unit) - Text description
Missing Long description
Sentinel site 2: British Columbia (Fraser Health Region) - Text description
Missing Long description
Sentinel site 3: Alberta (Alberta Health Services: Calgary and Central Zones) - Text description
Missing Long description
Appendix C - Non-human sample types tested in 2018
| Site | Retail | Farm | Water |
|---|---|---|---|
| British Columbia | Ground beef, skinless chicken breast, frozen raw breaded chicken products, pork sausage, molluscs | Broiler chickens & turkeys | Five sampling locations in the Sumas & Serpentine irrigation canals |
| Alberta | Ground beef, skinless chicken breast, frozen raw breaded chicken products, pork sausage, molluscs | Broiler chickens, swine, turkeys, & feedlot beef | Eight sampling locations in the Western Irrigation District |
| Ontario | Ground beef, skinless chicken breast, frozen raw breaded chicken products, pork sausage, molluscs | Broiler chickens, swine, & turkeys | - |
Appendix D - Abbreviations and references
Abbreviations
- AB
- Alberta
- BC
- British Columbia
- CFIA
- Canadian Food Inspection Agency
- CIPARS
- Canadian Integrated Program for Antimicrobial Resistance Surveillance
- ER
- Emergency room
- FRBCP
- Frozen raw breaded chicken products
- NESP
- National Enteric Surveillance Program
- NML
- National Microbiology Laboratory
- NT
- Not tested
- OMD
- Outbreak Management Division
- ON
- Ontario
- PCR
- Polymerase chain reaction
- PHAC
- Public Health Agency of Canada
- SE
- Salmonella Enteritidis
- STEC
- Shigatoxigenic Escherichia coli
- WGS
- Whole genome sequencing
- USA
- United States of America