
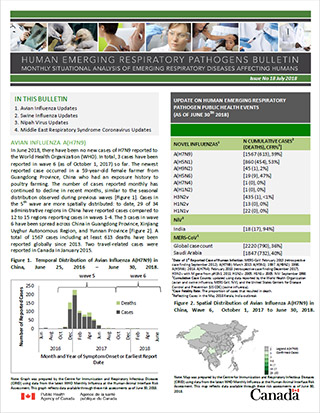
Human Emerging Respiratory Pathogens Bulletin: Issue 018 July 2018
Monthly situational analysis of emerging respiratory diseases affecting humans
| Cumulative Case Counttable 1 note 2 | Deaths | Case Fatality Rate %table 1 note 3 | |
|---|---|---|---|
| Novel influenzatable 1 note 1 | |||
| A(H7N9) | 1,567 | 613 | 39% |
| A(H5N1) | 860 | 454 | 53% |
| A(H9N2) | 45 | 1 | 2% |
| A(H5N6) | 19 | 9 | 47% |
| A(H7N4) | 1 | 0 | 0% |
| A(H1N2) | 1 | 0 | 0% |
| H3N2v | 435 | 1 | <1% |
| H1N2v | 13 | 0 | 0% |
| H1N1v | 22 | 0 | 0% |
| NiVtable 1 note 4 | |||
| India | 18 | 17 | 94% |
| MERS-CoVtable 1 note 1 | |||
| Global Case Count | 2,220 | 790 | 36% |
| Saudi Arabia | 1,847 | 732 | 40% |
Table 1 notes
|
|||
Download the alternative format
(PDF format, 700 KB, 2 pages)
Organization: Public Health Agency of Canada
Published: 2018-08-31
In this bulletin
- Avian Influenza Updates
- Swine Influenza Updates
- Nipah Virus Updates
- Middle East Respiratory Syndrome Coronavirus Updates
Avian Influenza Updates
Avian influenza A(H7N9)
In June 2018, there have been no new cases of H7N9 reported to the World Health Organization (WHO). In total, 3 cases have been reported in wave 6 (as of October 1, 2017) so far. The newest reported case occurred in a 59-year-old female farmer from Guangdong Province, China who had an exposure history to poultry farming. The number of cases reported monthly has continued to decline in recent months, similar to the seasonal distribution observed during previous waves [Figure 1]. Cases in the 5th wave are more spatially distributed: to date, 29 of 34 administrative regions in China have reported cases compared to 12 to 15 regions reporting cases in waves 1-4. The 3 cases in wave 6 have been spread across China in Guangdong Province, Xinjiang Uyghur Autonomous Region, and Yunnan Province [Figure 2]. A total of 1567 cases including at least 613 deaths have been reported globally since 2013. Two travel-related cases were reported in Canada in January 2015.
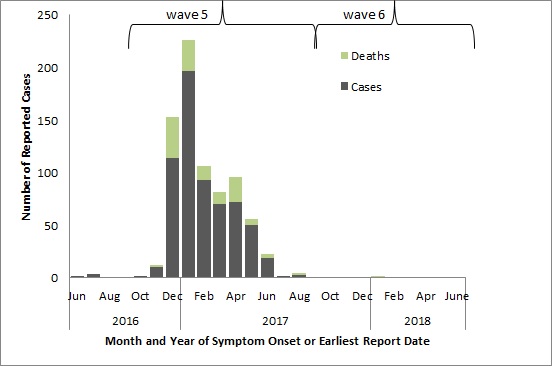
Note: Graph was prepared by the Centre for Immunization and Respiratory Infectious Diseases (CIRID) using data from the latest WHO Monthly Influenza at the Human-Animal Interface Risk Assessment. This graph reflects data available through these risk assessments as of June 30, 2018.
Figure 1 - Text description
| Cases | Deaths | ||
|---|---|---|---|
| 2016 | Jun | 2 | 0 |
| Jul | 4 | 0 | |
| Aug | 0 | 0 | |
| Sep | 0 | 0 | |
| Oct | 2 | 0 | |
| Nov | 10 | 2 | |
| Dec | 114 | 39 | |
| 2017 | Jan | 197 | 29 |
| Feb | 93 | 13 | |
| Mar | 70 | 12 | |
| Apr | 72 | 24 | |
| May | 50 | 6 | |
| Jun | 19 | 4 | |
| Jul | 2 | 0 | |
| Aug | 3 | 2 | |
| Sep | 1 | 0 | |
| Oct | 0 | 0 | |
| Nov | 0 | 0 | |
| Dec | 1 | 0 | |
| 2018 | Jan | 1 | 1 |
| Feb | 1 | 0 | |
| Mar | 0 | 0 | |
| Apr | 0 | 0 | |
| May | 0 | 0 | |
| June | 0 | 0 | |
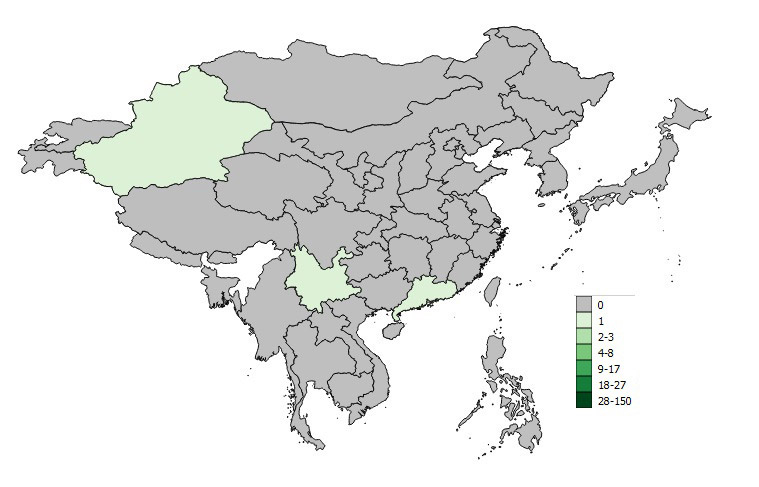
Note: Map was prepared by the Centre for Immunization and Respiratory Infectious Diseases (CIRID) using data from the latest WHO Monthly Influenza at the Human-Animal Interface Risk Assessment. This map reflects data available through these risk assessments as of June 30, 2018.
Figure 2 - Text description
The spatial distribution of reported avian influenza A(H7N9) cases in wave 6 from October 1, 2018 to June 30, 2018 has been displayed in Figure 2. Throughout October 1, 2018 to June 30, 2018, a total of 3 cases have been reported. The 3 cases in wave 6 were spread across China in Guangdong Province, Xinjiang Uyghur Autonomous Region, and Yunnan Province.
Avian Influenza A(H7N4)
On February 14, 2018, the WHO was notified of the first known human case of Avian Influenza A(H7N4). No new cases have been reported since.
Avian Influenza A(H9N2)
In June 2018, no new cases of H9N2 were reported to the WHO. A total of 45 cases, including 1 death, have been reported globally since 1998. No cases have been reported from Canada.
Avian Influenza A(H5N1)
In June 2018, no new cases of H5N1 were reported to the WHO. A total of 860 cases including 454 deaths have been reported globally since 1997. One fatal travel-related case of A(H5N1) was reported in Canada in January 2014.
Avian Influenza A(H5N6)
In June 2018, no new cases of H5N6 were reported to the WHO. There have been a total of 19 cases, including 9 deaths, reported globally since 2014, with all cases occurring in China.
Swine Influenza Updates
Swine origin Influenza A(H3N2)v
One new case of H3N2v occurred in June 2018. The Indiana State Department of Health reported the first case of H3N2v this year in the United States in a county fairgoer who had been in close proximity to swine. The case is a child (<12 years old) who developed symptoms on June 18 and has since fully recovered. One locally-acquired case of H3N2v was reported in Canada in December 2016.
Swine origin Influenza A(H1N2)v
In June 2018, there have been no new cases of H1N2v. Since 2005, there have been a total of 13 confirmed cases of H1N2v in the United States, with four cases occurring in 2017. Most of the reported cases resulted in mild illness.
Swine origin Influenza A(H1N1)v
In June 2018, no new cases of H1N1v were reported to the WHO. There have been a total of 22 cases reported since 2005 and only one case reported in 2018.
Nipah Virus Updates
Nipah Virus (NiV)
In May 2018, an outbreak of Nipah Virus (NiV) occurred in the southern state of Kerala, India. A total of 18 cases and 17 deaths were attributed to the NiV outbreak. The possible route of transmission for the outbreak included consumption of fruits partially eaten by bats and person-to-person transmission. No new cases have been reported since.
Middle East Respiratory Syndrome Coronavirus Updates
Middle East Respiratory Syndrome - Coronavirus (MERS-CoV)
Data regarding MERS-CoV cases are currently only available up until May 31, 2018. According to the WHO, the National IHR Focal Point of the Kingdom of Saudi Arabia reported a total of 75 laboratory confirmed cases of MERS-CoV, including 23 deaths [Figure 3]. Of these reported cases, 21 were involved in 4 distinct clusters. The latest cluster occurred from May 23 - 31, 2018 and involved household cases reported from Najran. Officially, 8 cases including the suspected index case have been identified. From this cluster, all cases were Saudi males, with an age range of 19 - 52 years old (median: 36). The WHO states that a total of 2220 laboratory-confirmed cases of MERS-CoV cases, including 790 deaths, have been reported globally since 2012. No cases have been reported in Canada.
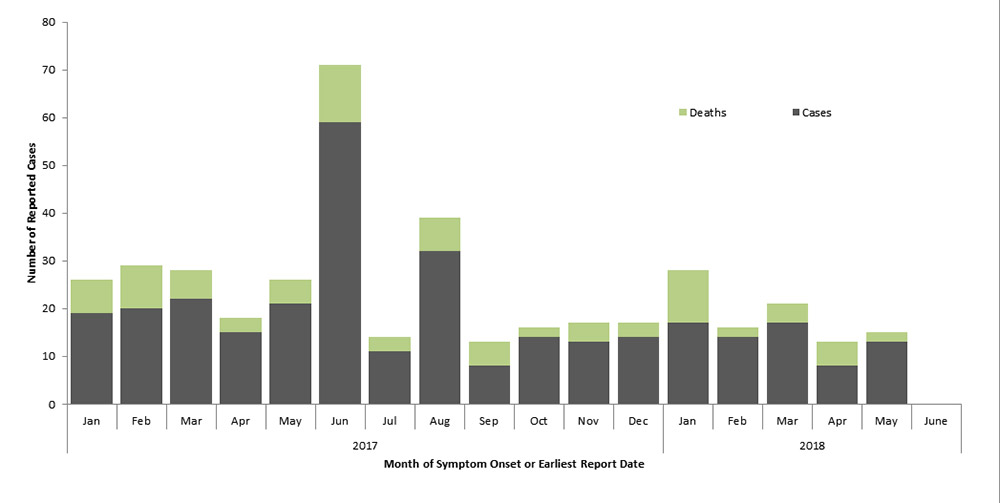
Note: Graph was prepared by the Centre for Immunization and Respiratory Infectious Diseases (CIRID) using data from the WHO Disease Outbreak News and Saudi Arabia's Ministry of Health. This graph reflects data available as of June 30, 2018.
Figure 3 - Text description
| Cases | Deaths | ||
|---|---|---|---|
| 2017 | Jan | 19 | 7 |
| Feb | 20 | 9 | |
| Mar | 22 | 6 | |
| Apr | 15 | 3 | |
| May | 21 | 5 | |
| Jun | 59 | 12 | |
| Jul | 11 | 3 | |
| Aug | 32 | 7 | |
| Sep | 8 | 5 | |
| Oct | 14 | 2 | |
| Nov | 13 | 4 | |
| Dec | 14 | 3 | |
| 2018 | Jan | 17 | 11 |
| Feb | 14 | 2 | |
| Mar | 17 | 4 | |
| Apr | 8 | 5 | |
| May | 13 | 2 | |
| June | 0 | 0 | |
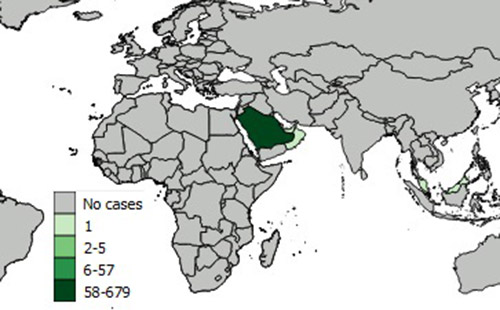
Note: Map was prepared by the Centre for Immunization and Respiratory Infectious Diseases (CIRID) using data from the latest WHO Monthly Influenza at the Human-Animal Interface Risk Assessment. This map reflects data available through these risk assessments as of June 30, 2018.
Figure 4 - Text description
The spatial distribution of reported MERS cases from January 1, 2018 to June 30, 2018 has been displayed in Figure 4. Throughout January 1, 2018 to June 30, 2018, the greatest number of cases have always been reported from Saudi Arabia. In 2018, up until June 30, Saudi Arabia has reported 58-679 cases so far.