
Human emerging respiratory pathogens bulletin: Issue 43, July 2020
Download the alternative format
(PDF format, 1.3 MB, 2 pages)
Organization: Public Health Agency of Canada
Date published: 2020-08-11
Monthly situational analysis of emerging respiratory diseases affecting humans (data to July 31, 2020)
In this bulletin
- COVID-2019 update
- Avian influenza updates
- Swine influenza updates
- Middle East respiratory syndrome coronavirus (MERS-CoV) update
| Novel influenzaTable 1 Footnote 1 | Cumulative Case CountTable 1 Footnote 2 | Deaths | Case Fatality Rate %Table 1 Footnote 3 |
|---|---|---|---|
| A(H7N9) | 1,568 | 615 | 39% |
| A(H5N1) | 879 | 461 | 52% |
| A(H9N2) | 58 | 1 | 2% |
| A(H5N6) | 24 | 7 | 29% |
| A(H7N4) | 1 | 0 | 0% |
| A(H1N2) | 2 | 0 | 0% |
| A(H3N2)v | 436 | 1 | <1% |
| A(H1N2)v | 27 | 0 | 0% |
| A(H1N1)v | 26 | 0 | 0% |
| MERS-CoVTable 1 Footnote 1 | Cumulative Case CountTable 1 Footnote 2 | Deaths | Case Fatality Rate %Table 1 Footnote 3 |
| Global Case Count | 2,553 | 872 | 34% |
| Saudi Arabia | 2,157 | 794 | 37% |
|
|||
COVID-19 update
On December 31, 2019, cases of a pneumonia of unknown etiology were reported in Wuhan, China, which have since been determined to be due to a novel coronavirus (COVID-2019). On January 30, 2020, the World Health Organization (WHO) declared the outbreak a Public Health Emergency of International Concern (PHEIC).
As of July 31, 2020, 116,302 cases of COVID-2019 have been reported in Canada. The highest number of cases were reported from Ontario and Quebec (represent 85% of the national cases).
The Public Health Agency of Canada is monitoring the situation closely.
Avian influenza updates
Avian influenza A(H7N9)
No new H7N9 cases were reported to the WHO in July 2020. The last case was globally reported in April 2019. Two travel-related cases were reported in Canada in January 2015. A total of 1568 human cases of avian influenza A(H7N9), including at least 615 deaths, have been reported globally since 2013 (Figure 1).
Figure 1. Temporal distribution of human infection with avian influenza A(H7N9), globally, by month and year, January 1, 2013 to July 31, 2020 (n=1568).
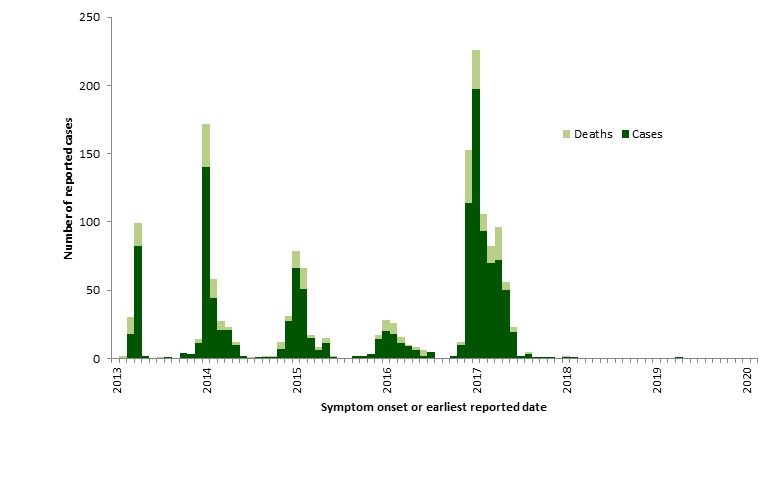
Note: Graph was prepared by the Centre for Immunization and Respiratory Infectious Diseases (CIRID) using data from the latest WHO Monthly Influenza at the Human-Animal Interface Risk Assessment. This graph reflects data available through these risk assessments as of July 31, 2020.
Figure 1 - Text Equivalent
The temporal distribution of avian influenza A(H7N9), globally, January 1st, 2013 – July 31, 2020, has been displayed in Figure 1. The highest number of reports occurred in 2017, with a peak in January. Three cases were reported in 2018 and one case was reported in 2019.
| Dates | Cases | Deaths | |
|---|---|---|---|
| 2016 | Jun | 2 | 0 |
| Jul | 4 | 0 | |
| Aug | 0 | 0 | |
| Sep | 0 | 0 | |
| Oct | 2 | 0 | |
| Nov | 10 | 2 | |
| Dec | 114 | 39 | |
| 2017 | Jan | 197 | 29 |
| Feb | 93 | 13 | |
| Mar | 70 | 12 | |
| Apr | 72 | 24 | |
| May | 50 | 6 | |
| Jun | 19 | 4 | |
| Jul | 2 | 0 | |
| Aug | 3 | 2 | |
| Sep | 1 | 0 | |
| Oct | 0 | 0 | |
| Nov | 0 | 0 | |
| Dec | 1 | 0 | |
| 2018 | Jan | 1 | 1 |
| Feb | 1 | 0 | |
| Mar | 0 | 0 | |
| Apr | 0 | 0 | |
| May | 0 | 0 | |
| June | 0 | 0 | |
| July | 0 | 0 | |
| Aug | 0 | 0 | |
| Sep | 0 | 0 | |
| Oct | 0 | 0 | |
| Nov | 0 | 0 | |
| Dec | 0 | 0 | |
| 2019 | Jan | 0 | 0 |
| Feb | 0 | 0 | |
| Mar | 0 | 0 | |
| Apr | 1 | 0 | |
| May | 0 | 0 | |
| June | 0 | 0 | |
| July | 0 | 0 | |
| Aug | 0 | 0 | |
| Sept | 0 | 0 | |
| Oct | 0 | 0 | |
| Nov | 0 | 0 | |
| Dec | 0 | 0 | |
| 2020 | Jan | 0 | 0 |
| Feb | 0 | 0 | |
| Mar | 0 | 0 | |
| Apr | 0 | 0 | |
| May | 0 | 0 | |
| June | 0 | 0 | |
| July | 0 | 0 | |
Avian influenza A(H5N1)
No new H5N1 cases were reported to WHO in July 2020. The most recent case was reported in March 25, 2019 in Nepal. A total of 879 cases including 461 deaths have been reported globally since 1997. One fatal travel-related case of H5N1 was reported in Canada in January 2014.
Avian influenza A(H5N6)
No new cases of H5N6 were reported to the WHO in July 2020. The most recent case of H5N6 was reported in China in August 2019. There have been a total of 24 cases, including 7 deaths, reported globally since 2014, all in China.
Swine influenza updates
Swine origin influenza A(H3N2)v
A human case of A(H3N2)v was reported to the WHO from the United States on July 25, 2020. The case is a child who presented with influenza-like illness on June 30, 2020. They were taken to an outpatient clinic on July 1, 2020, where a respiratory sample was taken for testing. Initial testing indicated infection with A(H3N2)v, and these results were confirmed by the CDC on July 24, 2020. Although the case had no reported swine exposure prior to symptom onset, investigations are ongoing regarding the case's infection source. This case is the first human case of A(H3N2)v reported out of the United States since 2018. A total of 436 cases, including 1 death, have been reported globally since 2011. One locally acquired case of H3N2v was reported in Canada in December 2016.
Swine origin influenza A(H1N2)v
The most recent case of swine origin influenza H1N2v was reported in June 2020 in Brazil. The case reported exposure to swine at a slaughterhouse. Most reported H1N2v cases result in mild illness.
Swine origin influenza A(H1N1)v
The most recent case of swine origin influenza A(H1N1) infection was detected in Germany in June 2020. This case presented with influenza-like illness after contact with pigs during a farm visit. To date, reported H1N1v infections have been associated with mild illness.
Figure 2. Spatial distribution of human cases of avian and swine influenza reported globally in July 2020 (n=1).
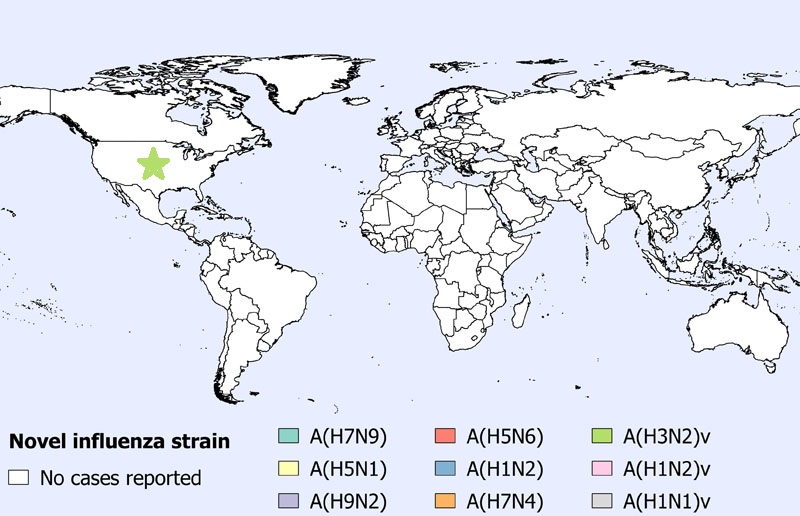
Note: Map was prepared by the Centre for Immunization and Respiratory Infectious Diseases (CIRID) using data from the latest WHO Monthly Influenza at the Human-Animal Interface Risk Assessment. This map reflects data available through these risk assessments as of July 31, 2020.
Figure 2 - Text Equivalent
The spatial distribution of avian and swine influenza human cases in July 2020 has been displayed in Figure 2.
Middle East respiratory syndrome coronavirus (MERS-CoV) update
In July 2020, Saudi Arabia retroactively reported one new MERS-CoV from May 2020, who has since passed away. The case was a 96 year old male from Alkharj City. A total of 2,553 laboratory-confirmed cases of MERS-CoV, including 872 deaths, have been reported globally since 2012 by the WHO. No cases have been reported in Canada.
Figure 3. Temporal distribution of human cases of MERS-CoV reported to the WHO, globally, by month and year, January 1, 2018 to July 31, 2020 (n=398).
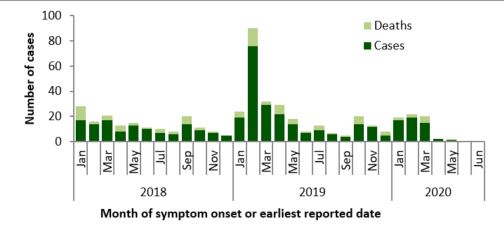
Note: Graph was prepared by the Centre for Immunization and Respiratory Infectious Diseases (CIRID) using data from the WHO Disease Outbreak News and Saudi Arabia’s Ministry of Health. This graph reflects data available as of July 31, 2020.
Figure 3 - Text Equivalent
| Date | Cases | Deaths | |
| 2018 | Jan | 17 | 11 |
| Feb | 14 | 2 | |
| Mar | 17 | 4 | |
| Apr | 8 | 5 | |
| May | 13 | 2 | |
| June | 10 | 1 | |
| July | 7 | 3 | |
| Aug | 6 | 2 | |
| Sep | 14 | 6 | |
| Oct | 9 | 2 | |
| Nov | 7 | 1 | |
| Dec | 5 | 0 | |
| 2019 | Jan | 19 | 5 |
| Feb | 76 | 14 | |
| Mar | 29 | 3 | |
| Apr | 22 | 7 | |
| May | 14 | 4 | |
| June | 7 | 1 | |
| July | 9 | 4 | |
| Aug | 6 | 1 | |
| Sep | 4 | 1 | |
| Oct | 14 | 6 | |
| Nov | 15 | 2 | |
| Dec | 4 | 2 | |
| 2020 | Jan | 17 | 2 |
| Feb | 19 | 3 | |
| Mar | 15 | 5 | |
| Apr | 2 | 0 | |
| May | 1 | 1 | |
| June | 0 | 0 | |
| June | 0 | 0 | |