
Respiratory Virus Report, Week 34 - ending August 26, 2023
Download in PDF format
(945 KB, 13 pages)
Organization: Public Health Agency of Canada
Please note that the Respiratory Virus Detection Surveillance System (RVDSS) is a sentinel laboratory surveillance system that does not capture all respiratory virus testing performed in Canada; differences may exist between the data presented in this report and provincial/territorial epidemiological reports. SARS-CoV-2 laboratory data is included in this report to facilitate the comparison of positivity with other respiratory viruses. Interpretation should be made with caution as testing practices differ among viruses.
For additional SARS-CoV-2 surveillance information, please refer to the COVID-19 epidemiology update.
Overall summary
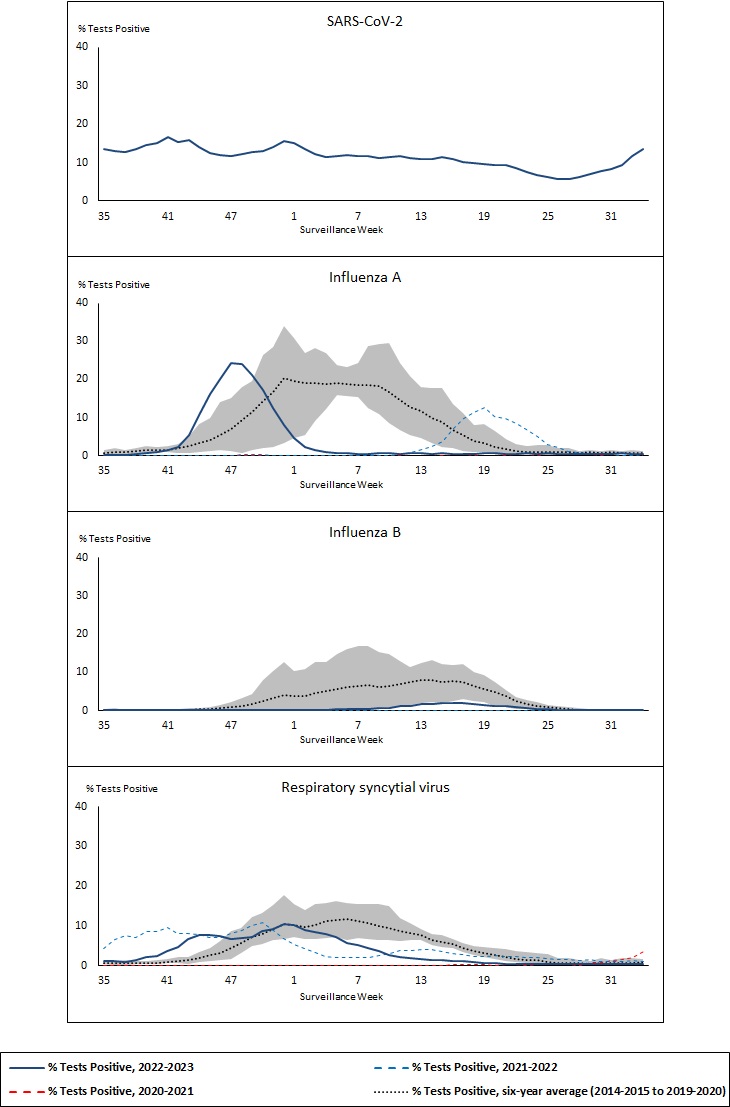
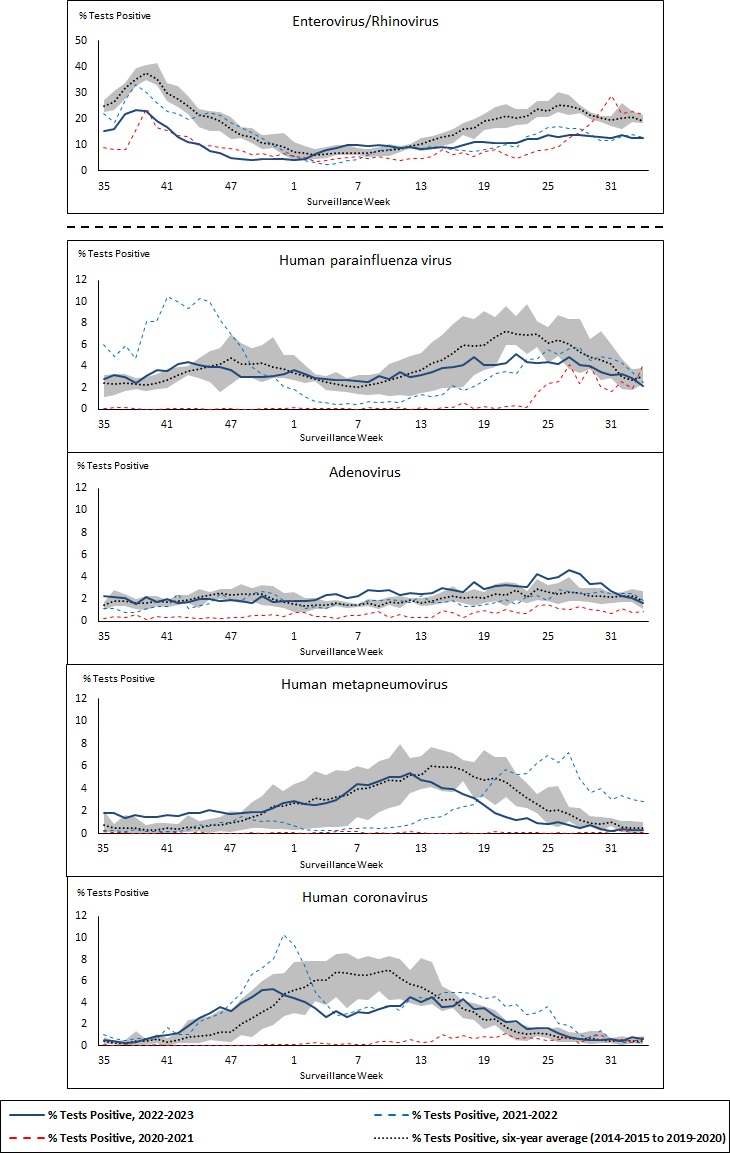
In week 34 (week ending August 26, 2023) in Canada, participating RVDSS laboratories reported 3,133 detections of SARS-CoV-2 from 23,381 tests (13.4% positive). Among non-SARS-CoV-2 respiratory viruses, where test volumes are lower (range of 4,447 to 13,226 tests), activity of enterovirus/rhinovirus is highest.
- There has been an observed increase in national SARS-CoV-2 percent positivity over the latest seven reporting weeks.
- While activity of enterovirus/rhinovirus is highest, it remains below expected levels typical of this time of year (570 detections; 12.5% positive).
- Activity of all other non-SARS-CoV-2 respiratory viruses is low and near expected levels typical of this time of year.
- 33/35 sentinel laboratories reported surveillance data
On this page
- List of abbreviations
- Respiratory virus detections
- Positive respiratory virus tests historical comparison
- Positive severe acute respiratory syndrome coronavirus 2 (SARS-CoV-2) tests
- Positive influenza (Flu) tests
- Positive respiratory syncytial virus (RSV) tests
- Positive human parainfluenza virus (HPIV) tests
- Positive adenovirus (ADV) tests
- Positive human metapneumovirus (HMPV) tests
- Positive enterovirus/rhinovirus (EV/ RV) tests
- Positive human coronavirus (HCoV) tests
Abbreviations:
- ADV
- Adenovirus
- Atl
- Atlantic Canada
- BC
- British Columbia
- Can
- Canada
- EORLA
- Eastern Ontario Regional Laboratory Association
- EV/RV
- Enterovirus/Rhinovirus
- Flu
- Influenza
- Flu A(H1)pdm09
- Influenza A(H1N1)pdm09
- Flu A(H3)
- Influenza A(H3N2)
- Flu A(UnS)
- Influenza A(Unsubtyped)
- HCoV
- Human coronavirus 229E/OC43/NL63/HKU1
- HMPV
- Human metapneumovirus
- HPIV
- Human parainfluenza virus
- HSC
- Health Sciences Centre
- N.C.
- Data not collected
- N.R.
- Data not reported for current week
- ON
- Ontario
- PR
- Prairies
- P.H.O.L.
- Public Health Ontario Laboratory
- QC
- Quebec
- RSV
- Respiratory syncytial virus
- RVDSS
- Respiratory Virus Detection Surveillance System
- SARS-CoV-2
- Severe acute respiratory syndrome coronavirus 2
- Terr
- Territories of Canada
- UHN
- University Health Network
Respiratory virus detections
Table 1: Respiratory virus detections for the week ending August 26, 2023 (surveillance week 2023-34)
| Reporting Laboratory | SARS-CoV-2 Tested | SARS-CoV-2 Positive | Flu Tested | A(H1)pdm09 Positive | A(H3) Positive | A(UnS) Positive | Total Flu A Positive | Total Flu B Positive | RSV Tested | RSV Positive | HPIV Tested | HPIV 1 Positive | HPIV 2 Positive | HPIV 3 Positive | HPIV 4 Positive | Other HPIV Positive | ADV Tested | ADV Positive | HMPV Tested | HMPV Positive | EV/RV Tested | EV/RV Positive | HCoV Tested | HCoV Positive |
|---|---|---|---|---|---|---|---|---|---|---|---|---|---|---|---|---|---|---|---|---|---|---|---|---|
| Newfoundland | 377 | 47 | 217 | 0 | 0 | 0 | 0 | 0 | 217 | 1 | 217 | 0 | 0 | 0 | 3 | 0 | 217 | 5 | 217 | 0 | 217 | 39 | 217 | 2 |
| Prince Edward Island | 116 | 13 | 11 | 0 | 0 | 0 | 0 | 0 | 11 | 0 | 5 | 0 | 0 | 0 | 0 | 0 | 5 | 0 | 5 | 0 | 5 | 1 | 5 | 0 |
| Nova Scotia | 816 | 141 | 353 | 0 | 0 | 0 | 0 | 0 | 353 | 2 | 32 | 1 | 0 | 0 | 3 | 0 | 32 | 0 | 32 | 0 | 32 | 6 | 32 | 1 |
| New Brunswick | 516 | 53 | 324 | 0 | 0 | 0 | 0 | 0 | 312 | 0 | 42 | 0 | 0 | 1 | 0 | 0 | 42 | 2 | 42 | 0 | 42 | 6 | 42 | 1 |
| Atlantic | 1825 | 254 | 905 | 0 | 0 | 0 | 0 | 0 | 893 | 3 | 296 | 1 | 0 | 1 | 6 | 0 | 296 | 7 | 296 | 0 | 296 | 52 | 296 | 4 |
| Région Nord-Est | 1158 | 178 | 917 | 0 | 0 | 1 | 1 | 0 | 184 | 1 | 67 | 2 | 1 | 1 | 3 | 0 | 67 | 5 | 66 | 1 | N.C. | N.C. | 67 | 0 |
| Québec-Chaudière-Appalaches | 1621 | 252 | 424 | 0 | 0 | 1 | 1 | 0 | 424 | 5 | 186 | 1 | 0 | 0 | 0 | 0 | 204 | 7 | 186 | 1 | N.C. | N.C. | 186 | 1 |
| Centre-du-Québec | 1250 | 206 | 200 | 0 | 0 | 0 | 0 | 0 | 200 | 6 | 36 | 1 | 0 | 0 | 1 | 0 | 36 | 2 | 36 | 0 | N.C. | N.C. | 36 | 0 |
| Montréal-Laval | 2491 | 337 | 1046 | 0 | 0 | 5 | 5 | 2 | 988 | 12 | 581 | 0 | 2 | 3 | 6 | 0 | 581 | 8 | 581 | 8 | N.C. | N.C. | 581 | 0 |
| Ouest du Québec | 1050 | 170 | 254 | 0 | 0 | 4 | 4 | 1 | 254 | 1 | 20 | 1 | 1 | 1 | 2 | 0 | 20 | 1 | 20 | 1 | N.C. | N.C. | 20 | 1 |
| Montérégie | 1010 | 140 | 536 | 0 | 0 | 1 | 1 | 0 | 535 | 5 | 8 | 0 | 0 | 0 | 0 | 0 | 8 | 0 | 8 | 0 | N.C. | N.C. | 8 | 0 |
| Province of Québec | 8580 | 1283 | 3377 | 0 | 0 | 12 | 12 | 3 | 2585 | 30 | 898 | 5 | 4 | 5 | 12 | 0 | 916 | 23 | 897 | 11 | N.C. | N.C. | 898 | 2 |
| P.H.O.L. - Ottawa | 337 | 125 | 194 | 0 | 0 | 0 | 0 | 0 | 194 | 0 | 89 | 0 | 0 | 0 | 0 | 2 | 89 | 0 | 89 | 1 | 89 | 9 | 89 | 1 |
| EORLA | 1263 | 104 | 271 | 0 | 0 | 2 | 2 | 0 | 271 | 8 | 25 | 0 | 0 | 0 | 0 | 0 | 25 | 0 | 25 | 0 | 25 | 7 | 25 | 0 |
| P.H.O.L. - Kingston | 307 | 96 | 81 | 0 | 0 | 0 | 0 | 0 | 81 | 0 | 53 | 0 | 0 | 0 | 0 | 2 | 53 | 0 | 53 | 0 | 53 | 12 | 53 | 0 |
| UHN / Mount Sinai Hospital | 527 | 32 | 495 | 0 | 1 | 2 | 3 | 0 | 495 | 0 | 19 | 0 | 0 | 0 | 0 | 0 | 19 | 0 | 19 | 0 | 19 | 0 | 19 | 1 |
| P.H.O.L. - Toronto | 367 | 78 | 744 | 11 | 3 | 0 | 13 | 0 | 744 | 3 | 689 | 0 | 0 | 0 | 0 | 40 | 690 | 9 | 689 | 1 | 689 | 140 | 689 | 1 |
| Sick Kids Hospital - Toronto | N.R. | N.R. | N.R. | N.R. | N.R. | N.R. | N.R. | N.R. | N.R. | N.R. | N.R. | N.R. | N.R. | N.R. | N.R. | N.R. | N.R. | N.R. | N.R. | N.R. | N.R. | N.R. | N.R. | N.R. |
| Shared Hospital Laboratory | 691 | 42 | 691 | 2 | 0 | 1 | 3 | 0 | 691 | 5 | 694 | 0 | 0 | 0 | 0 | 7 | 694 | 5 | 698 | 1 | 697 | 51 | 698 | 0 |
| P.H.O.L. - Sault Ste. Marie | 2 | 1 | 4 | 0 | 0 | 0 | 0 | 0 | 4 | 0 | 4 | 0 | 0 | 0 | 0 | 0 | 4 | 0 | 4 | 0 | 4 | 0 | 4 | 0 |
| P.H.O.L. - Timmins | 21 | 1 | 7 | 0 | 0 | 0 | 0 | 0 | 7 | 0 | 7 | 0 | 0 | 0 | 0 | 0 | 7 | 1 | 7 | 0 | 7 | 0 | 7 | 0 |
| St. Joseph's - London | 517 | 44 | 24 | 0 | 0 | 0 | 0 | 0 | 24 | 0 | 24 | 0 | 0 | 0 | 0 | 0 | 24 | 0 | 24 | 0 | 24 | 0 | 24 | 0 |
| P.H.O.L. - London | 223 | 32 | 153 | 1 | 0 | 0 | 1 | 0 | 153 | 0 | 136 | 0 | 0 | 0 | 0 | 10 | 136 | 0 | 136 | 0 | 136 | 32 | 136 | 0 |
| P.H.O.L. - Orillia | 41 | 14 | 26 | 0 | 0 | 0 | 0 | 0 | 26 | 0 | 17 | 0 | 0 | 0 | 0 | 0 | 17 | 2 | 17 | 0 | 17 | 4 | 17 | 0 |
| P.H.O.L. - Thunder Bay | 30 | 4 | 18 | 0 | 0 | 0 | 0 | 0 | 18 | 0 | 9 | 0 | 0 | 0 | 0 | 0 | 9 | 0 | 9 | 0 | 9 | 1 | 9 | 0 |
| P.H.O.L. - Sudbury | 17 | 5 | 18 | 0 | 0 | 0 | 0 | 0 | 18 | 0 | 18 | 0 | 0 | 0 | 0 | 0 | 18 | 0 | 18 | 0 | 18 | 4 | 18 | 0 |
| P.H.O.L. - Hamilton | 204 | 55 | 117 | 0 | 0 | 0 | 0 | 0 | 117 | 0 | 98 | 0 | 0 | 0 | 0 | 1 | 98 | 1 | 98 | 0 | 98 | 9 | 98 | 0 |
| P.H.O.L. - Peterborough | 24 | 4 | 23 | 1 | 0 | 0 | 1 | 0 | 23 | 0 | 16 | 0 | 0 | 0 | 0 | 0 | 16 | 4 | 16 | 0 | 16 | 2 | 16 | 0 |
| St. Joseph's - Hamilton | 1273 | 94 | 1041 | 0 | 0 | 3 | 3 | 1 | 1041 | 3 | 1041 | 0 | 0 | 1 | 0 | 0 | 1041 | 8 | 1041 | 1 | 1041 | 53 | 0 | 0 |
| Sault Area Hospital | 52 | 7 | 42 | 0 | 0 | 0 | 0 | 0 | 42 | 0 | 42 | 0 | 0 | 0 | 0 | 0 | 42 | 0 | 42 | 0 | 42 | 8 | 52 | 0 |
| Province of Ontario | 5896 | 738 | 3949 | 15 | 4 | 8 | 26 | 1 | 3949 | 19 | 2981 | 0 | 0 | 1 | 0 | 62 | 2982 | 30 | 2985 | 4 | 2984 | 332 | 1954 | 3 |
| Manitoba | 987 | 138 | 858 | 0 | 0 | 1 | 1 | 0 | 858 | 3 | 66 | 1 | 2 | 0 | 0 | 0 | 66 | 4 | 92 | 0 | 66 | 22 | 92 | 0 |
| Saskatchewan | 1024 | 76 | 474 | 0 | 0 | 0 | 0 | 1 | 462 | 1 | 218 | 0 | 2 | 0 | 0 | 0 | 218 | 5 | 218 | 0 | 218 | 28 | 218 | 5 |
| Alberta | 2805 | 256 | 1897 | 4 | 0 | 0 | 4 | 1 | 1797 | 5 | 552 | 1 | 2 | 1 | 0 | 0 | 552 | 9 | 49 | 0 | 546 | 67 | 552 | 7 |
| Prairies | 4816 | 470 | 3229 | 4 | 0 | 1 | 5 | 2 | 3117 | 9 | 836 | 2 | 6 | 1 | 0 | 0 | 836 | 18 | 359 | 0 | 830 | 117 | 862 | 12 |
| British Columbia | 2163 | 378 | 1706 | 1 | 0 | 0 | 23 | 0 | 1706 | 1 | 469 | 6 | 2 | 0 | 4 | 0 | 469 | 13 | 469 | 0 | 437 | 69 | 437 | 5 |
| Yukon | 39 | 7 | 17 | 0 | 0 | 0 | 0 | 0 | 17 | 0 | N.C. | N.C. | N.C. | N.C. | N.C. | N.C. | N.C. | N.C. | N.C. | N.C. | N.C. | N.C. | N.C. | N.C. |
| Northwest Territories | N.R. | N.R. | N.R. | N.R. | N.R. | N.R. | N.R. | N.R. | N.R. | N.R. | N.C. | N.C. | N.C. | N.C. | N.C. | N.C. | N.C. | N.C. | N.C. | N.C. | 0 | 0 | N.C. | N.C. |
| Nunavut | 62 | 3 | 43 | 0 | 0 | 0 | 0 | 0 | 43 | 1 | N.C. | N.C. | N.C. | N.C. | N.C. | N.C. | N.C. | N.C. | N.C. | N.C. | N.C. | N.C. | N.C. | N.C. |
| Territories | 101 | 10 | 60 | 0 | 0 | 0 | 0 | 0 | 60 | 1 | N.C. | N.C. | N.C. | N.C. | N.C. | N.C. | N.C. | N.C. | N.C. | N.C. | 0 | 0 | N.C. | N.C. |
| CANADA | 23381 | 3133 | 13226 | 20 | 4 | 21 | 66 | 6 | 12310 | 63 | 5480 | 14 | 12 | 8 | 22 | 62 | 5499 | 91 | 5006 | 15 | 4547 | 570 | 4447 | 26 |
The data in the RVDSS report represent surveillance data available at the time of writing. Data missing from the current week are denoted by N.R. Data not collected by reporting lab denoted by N.C.
Some specimens from Yukon (YT) are sent to reference laboratories in British Columbia and reported results reflect specimens identified as originating from YT.
Results from British Columbia comprise of specimens from the following sites: Children's and Women's Hospital Laboratory, Fraser Health Medical Microbiology Laboratory, Island Health, Providence Health Care, Vancouver Coastal Health sites, Victoria General Hospital, BCCDC Public Health Laboratory, Interior Health Authority sites and Northern Health Authority sites.
Due to different testing protocols of laboratories across Canada, influenza A subtype detection counts may not be included in total influenza A detection counts. Total influenza A and B positive counts are used to calculate percentage of tests positive.
Delays in the reporting of data may cause data to change retrospectively.
Table 2: Cumulative respiratory virus detections from August 28, 2022 to August 26, 2023 (surveillance weeks 2022-35 to 2023-34)
| Reporting Laboratory | SARS-CoV-2 Tested | SARS-CoV-2 Positive | Flu Tested | A(H1)pdm09 Positive | A(H3) Positive | A(UnS) Positive | Total Flu A Positive | Total Flu B Positive | RSV Tested | RSV Positive | HPIV Tested | HPIV 1 Positive | HPIV 2 Positive | HPIV 3 Positive | HPIV 4 Positive | Other HPIV Positive | ADV Tested | ADV Positive | HMPV Tested | HMPV Positive | EV/RV Tested | EV/RV Positive | HCoV Tested | HCoV Positive |
|---|---|---|---|---|---|---|---|---|---|---|---|---|---|---|---|---|---|---|---|---|---|---|---|---|
| Newfoundland | 25987 | 4363 | 15322 | 8 | 246 | 680 | 934 | 11 | 15322 | 649 | 15322 | 75 | 33 | 388 | 173 | 0 | 15322 | 328 | 15322 | 386 | 15322 | 1442 | 15322 | 575 |
| Prince Edward Island | 34030 | 7371 | 4138 | 1 | 119 | 248 | 368 | 4 | 4138 | 384 | 1208 | 21 | 27 | 81 | 8 | 0 | 1208 | 82 | 1208 | 39 | 1208 | 351 | 1208 | 35 |
| Nova Scotia | 142197 | 27023 | 49046 | 0 | 4 | 3661 | 3665 | 15 | 49037 | 2436 | 1686 | 16 | 17 | 36 | 11 | 0 | 1693 | 69 | 1683 | 45 | 1693 | 333 | 1693 | 66 |
| New Brunswick | 114035 | 16307 | 54271 | 25 | 133 | 4439 | 4597 | 31 | 46170 | 2066 | 4408 | 41 | 35 | 167 | 8 | 0 | 4408 | 302 | 4408 | 188 | 4408 | 814 | 4353 | 237 |
| Atlantic | 316249 | 55064 | 122777 | 34 | 502 | 9028 | 9564 | 61 | 114667 | 5535 | 22624 | 153 | 112 | 672 | 200 | 0 | 22631 | 781 | 22621 | 658 | 22631 | 2940 | 22576 | 913 |
| Région Nord-Est | 107483 | 12445 | 66489 | 2 | 4 | 3897 | 3903 | 112 | 18833 | 1411 | 2285 | 35 | 14 | 97 | 20 | 0 | 2286 | 189 | 2262 | 101 | N.C. | N.C. | 2286 | 113 |
| Québec-Chaudière-Appalaches | 210932 | 19834 | 30861 | 0 | 0 | 2911 | 2911 | 185 | 30179 | 1984 | 9525 | 27 | 7 | 98 | 28 | 0 | 10406 | 817 | 9525 | 372 | N.C. | N.C. | 9525 | 346 |
| Centre-du-Québec | 172407 | 22627 | 18061 | 0 | 0 | 1788 | 1788 | 124 | 16291 | 1014 | 1441 | 18 | 3 | 57 | 23 | 0 | 1441 | 146 | 1441 | 78 | N.C. | N.C. | 1441 | 72 |
| Montréal-Laval | 243080 | 28663 | 118709 | 2 | 9 | 6414 | 6425 | 1595 | 69122 | 2877 | 29448 | 159 | 45 | 638 | 140 | 0 | 29459 | 1173 | 29612 | 873 | N.C. | N.C. | 29141 | 824 |
| Ouest du Québec | 128960 | 16067 | 27412 | 0 | 7 | 2211 | 2218 | 194 | 26495 | 1495 | 1291 | 23 | 2 | 71 | 17 | 0 | 1290 | 212 | 1291 | 66 | N.C. | N.C. | 1292 | 64 |
| Montérégie | 160719 | 17867 | 55068 | 0 | 0 | 3121 | 3121 | 286 | 48660 | 1914 | 220 | 0 | 0 | 2 | 0 | 0 | 220 | 5 | 220 | 6 | N.C. | N.C. | 220 | 6 |
| Province of Québec | 1023581 | 117503 | 316600 | 4 | 20 | 20342 | 20366 | 2496 | 209580 | 10695 | 44210 | 262 | 71 | 963 | 228 | 0 | 45102 | 2542 | 44351 | 1496 | N.C. | N.C. | 43905 | 1425 |
| P.H.O.L. - Ottawa | 30948 | 7863 | 6722 | 28 | 136 | 66 | 224 | 3 | 6722 | 355 | 4710 | 0 | 0 | 0 | 0 | 145 | 4710 | 21 | 4710 | 116 | 4710 | 491 | 4710 | 213 |
| EORLA | 100180 | 9324 | 19886 | 0 | 0 | 1428 | 1428 | 61 | 19886 | 1340 | 1665 | 13 | 14 | 61 | 20 | 0 | 1665 | 58 | 1665 | 64 | 1665 | 361 | 1665 | 102 |
| P.H.O.L. - Kingston | 32827 | 5193 | 3781 | 9 | 92 | 38 | 138 | 3 | 3778 | 180 | 3003 | 0 | 0 | 0 | 0 | 159 | 3004 | 32 | 3003 | 81 | 3003 | 394 | 3003 | 106 |
| UHN / Mount Sinai Hospital | 108748 | 7896 | 30428 | 7 | 45 | 366 | 418 | 62 | 30428 | 326 | 2522 | 2 | 2 | 65 | 4 | 0 | 2489 | 9 | 2522 | 16 | 2522 | 104 | 2522 | 99 |
| P.H.O.L. - Toronto | 56190 | 11862 | 36828 | 204 | 2423 | 157 | 1200 | 77 | 36791 | 1367 | 32896 | 0 | 0 | 0 | 0 | 1596 | 32901 | 720 | 32893 | 1110 | 32896 | 3712 | 32893 | 1399 |
| Sick Kids Hospital - Toronto | 0 | 0 | 0 | 0 | 0 | 0 | 0 | 0 | 0 | 0 | 0 | 0 | 0 | 0 | 0 | 0 | 0 | 0 | 0 | 0 | 0 | 0 | 0 | 0 |
| Shared Hospital Laboratory | 97192 | 6552 | 97191 | 152 | 1479 | 732 | 2363 | 393 | 97192 | 2249 | 74498 | 4 | 0 | 16 | 0 | 986 | 74511 | 830 | 74817 | 970 | 74764 | 2809 | 74657 | 1076 |
| P.H.O.L. - Sault Ste. Marie | 1910 | 347 | 781 | 1 | 52 | 15 | 58 | 0 | 781 | 25 | 688 | 0 | 0 | 0 | 0 | 54 | 688 | 5 | 688 | 31 | 688 | 58 | 688 | 44 |
| P.H.O.L. - Timmins | 9650 | 925 | 1227 | 0 | 161 | 6 | 156 | 0 | 1225 | 98 | 1120 | 0 | 0 | 0 | 0 | 56 | 1120 | 15 | 1120 | 29 | 1120 | 103 | 1120 | 49 |
| St. Joseph's - London | 132325 | 15715 | 21614 | 0 | 0 | 886 | 886 | 76 | 21614 | 1016 | 2775 | 0 | 0 | 0 | 0 | 96 | 2809 | 93 | 2809 | 74 | 2809 | 381 | 2398 | 108 |
| P.H.O.L. - London | 40513 | 8341 | 13303 | 19 | 587 | 63 | 651 | 28 | 13302 | 891 | 10885 | 0 | 0 | 0 | 0 | 576 | 10886 | 153 | 10886 | 267 | 10885 | 1194 | 10886 | 330 |
| P.H.O.L. - Orillia | 764 | 302 | 2720 | 6 | 261 | 23 | 290 | 16 | 2720 | 238 | 2631 | 0 | 0 | 0 | 0 | 157 | 2632 | 90 | 2631 | 83 | 2631 | 404 | 2631 | 108 |
| P.H.O.L. - Thunder Bay | 9034 | 1809 | 1285 | 0 | 107 | 3 | 110 | 0 | 1284 | 96 | 1125 | 0 | 0 | 0 | 0 | 38 | 1125 | 21 | 1125 | 29 | 1125 | 153 | 1126 | 40 |
| P.H.O.L. - Sudbury | 2239 | 332 | 921 | 1 | 65 | 14 | 67 | 0 | 921 | 79 | 800 | 0 | 0 | 0 | 0 | 30 | 800 | 9 | 800 | 51 | 800 | 67 | 800 | 25 |
| P.H.O.L. - Hamilton | 28203 | 7335 | 11019 | 38 | 305 | 92 | 418 | 41 | 11016 | 560 | 8418 | 0 | 0 | 0 | 0 | 377 | 8420 | 230 | 8418 | 268 | 8418 | 891 | 8418 | 302 |
| P.H.O.L. - Peterborough | 5780 | 1062 | 2225 | 5 | 69 | 11 | 85 | 19 | 2223 | 118 | 1857 | 0 | 0 | 0 | 0 | 80 | 1857 | 60 | 1857 | 50 | 1857 | 368 | 1857 | 50 |
| St. Joseph's - Hamilton | 115001 | 14464 | 62728 | 0 | 0 | 2786 | 2786 | 532 | 62728 | 2312 | 62728 | 0 | 0 | 1191 | 0 | 0 | 62728 | 1060 | 62728 | 976 | 62728 | 4019 | 0 | 0 |
| Sault Area Hospital | 13299 | 2184 | 9200 | 1 | 262 | 258 | 521 | 8 | 9200 | 173 | 3359 | 38 | 9 | 74 | 4 | 0 | 3359 | 62 | 3359 | 101 | 3359 | 378 | 3376 | 88 |
| Province of Ontario | 784803 | 101506 | 321859 | 471 | 6044 | 6944 | 11799 | 1319 | 321811 | 11423 | 215680 | 57 | 25 | 1407 | 28 | 4350 | 215704 | 3468 | 216031 | 4316 | 215980 | 15887 | 152750 | 4139 |
| Manitoba | 84112 | 12683 | 53509 | 18 | 205 | 1820 | 2043 | 87 | 53509 | 1814 | 6310 | 49 | 58 | 179 | 16 | 0 | 6300 | 194 | 6930 | 229 | 6310 | 1160 | 6930 | 225 |
| Saskatchewan | 182305 | 14257 | 49015 | 7 | 41 | 3997 | 4045 | 83 | 40707 | 2219 | 16904 | 169 | 137 | 534 | 116 | 0 | 16906 | 507 | 16906 | 688 | 16907 | 2090 | 16902 | 549 |
| Alberta | 271820 | 36063 | 160049 | 1124 | 7312 | 2855 | 11291 | 796 | 143803 | 7697 | 55243 | 405 | 202 | 991 | 155 | 0 | 55223 | 866 | 53917 | 1268 | 54331 | 5635 | 55242 | 1366 |
| Prairies | 538237 | 63003 | 262573 | 1149 | 7558 | 8672 | 17379 | 966 | 238019 | 11730 | 78457 | 623 | 397 | 1704 | 287 | 0 | 78429 | 1567 | 77753 | 2185 | 77548 | 8885 | 79074 | 2140 |
| British Columbia | 263844 | 28259 | 158560 | 616 | 4366 | 314 | 9245 | 331 | 150473 | 8280 | 36423 | 452 | 250 | 1196 | 356 | 6 | 36391 | 1320 | 36391 | 1222 | 35199 | 5532 | 35219 | 1213 |
| Yukon | 5672 | 431 | 1119 | 3 | 136 | 0 | 142 | 9 | 1117 | 61 | N.C. | N.C. | N.C. | N.C. | N.C. | N.C. | N.C. | N.C. | N.C. | N.C. | N.C. | N.C. | N.C. | N.C. |
| Northwest Territories | 1824 | 195 | 1658 | 10 | 147 | 1 | 158 | 5 | 1658 | 115 | N.C. | N.C. | N.C. | N.C. | N.C. | N.C. | N.C. | N.C. | N.C. | N.C. | 1658 | 351 | N.C. | N.C. |
| Nunavut | 5812 | 402 | 3538 | 8 | 230 | 3 | 241 | 234 | 3538 | 167 | N.C. | N.C. | N.C. | N.C. | N.C. | N.C. | N.C. | N.C. | N.C. | N.C. | N.C. | N.C. | N.C. | N.C. |
| Territories | 13308 | 1028 | 6315 | 21 | 513 | 4 | 541 | 248 | 6313 | 343 | N.C. | N.C. | N.C. | N.C. | N.C. | N.C. | N.C. | N.C. | N.C. | N.C. | 1658 | 351 | N.C. | N.C. |
| CANADA | 2940022 | 366363 | 1188684 | 2295 | 19003 | 45304 | 68894 | 5421 | 1040863 | 48006 | 397394 | 1547 | 855 | 5942 | 1099 | 4356 | 398257 | 9678 | 397147 | 9877 | 353016 | 33595 | 333524 | 9830 |
The data in the RVDSS report represent surveillance data available at the time of writing. Data not collected by reporting lab denoted by N.C.
Some specimens from Yukon (YT) are sent to reference laboratories in British Columbia and reported results reflect specimens identified as originating from YT.
Results from British Columbia comprise of specimens from the following sites: Children's and Women's Hospital Laboratory, Fraser Health Medical Microbiology Laboratory, Island Health, Providence Health Care, Vancouver Coastal Health sites, Victoria General Hospital, BCCDC Public Health Laboratory, Interior Health Authority sites and Northern Health Authority sites.
Due to different testing protocols of laboratories across Canada, influenza A subtype detection counts may not be included in total influenza A detection counts. Total influenza A and B positive counts are used to calculate percentage of tests positive.
Delays in the reporting of data may cause data to change retrospectively. Due to these delays, the sum of weekly report totals do not add up to cumulative totals.
Positive respiratory virus tests historical comparison
Shaded area represents the maximum and minimum % of respiratory virus tests positive reported by week from seasons 2014-2015 to 2019-2020
Note: Changes to testing practices during the COVID-19 pandemic may cause substantial changes to indicator estimates from previous years. Collection of laboratory testing practice meta-data to understand these changes is ongoing. Interpret trends with caution.
Note: SARS-CoV-2 surveillance was integrated into RVDSS at the beginning of the 2022-2023 season; no appropriate data is available for historical comparison.
Note: Data from week 11 of the 2019-2020 season onwards are excluded from the historical comparison due to the COVID-19 pandemic.
Figure 1: Positive severe acute respiratory syndrome coronavirus 2 (SARS-CoV-2), influenza, and respiratory syncytial virus tests (%) reported by participating laboratories in Canada by surveillance week compared to average and range from 2014-2015 to 2019-2020 season
| Week | Week end | 2022-2023 SARS-CoV-2% | 2022-2023 A% | 2021-2022 A% | 2020-2021 A% | Max A% Base | Min A% Base | Av A% Base | 2022-2023 B% | 2021-2022 B% | 2020-2021 B% | Max B% Base | Min B% Base | Av B% Base | 2022-2023 RSV% | 2021-2022 RSV% | 2020-2021 RSV% | Max RSV% Base | Min RSV% Base | Av RSV% Base |
|---|---|---|---|---|---|---|---|---|---|---|---|---|---|---|---|---|---|---|---|---|
| 35 | 2022-09-03 | 13.40 | 0.18 | 0.04 | 0.00 | 1.60 | 0.11 | 0.68 | 0.02 | 0.00 | 0.02 | 0.28 | 0.00 | 0.13 | 1.14 | 4.43 | 0.02 | 1.34 | 0.38 | 0.60 |
| 36 | 2022-09-10 | 13.07 | 0.14 | 0.01 | 0.00 | 2.11 | 0.23 | 0.98 | 0.04 | 0.00 | 0.00 | 0.55 | 0.00 | 0.15 | 1.12 | 6.61 | 0.04 | 1.09 | 0.22 | 0.57 |
| 37 | 2022-09-17 | 12.73 | 0.24 | 0.03 | 0.00 | 1.59 | 0.36 | 0.87 | 0.01 | 0.00 | 0.00 | 0.19 | 0.04 | 0.12 | 1.05 | 7.59 | 0.02 | 1.37 | 0.31 | 0.64 |
| 38 | 2022-09-24 | 13.61 | 0.48 | 0.00 | 0.02 | 2.15 | 0.43 | 1.16 | 0.02 | 0.00 | 0.00 | 0.21 | 0.00 | 0.14 | 1.40 | 7.16 | 0.10 | 1.24 | 0.37 | 0.64 |
| 39 | 2022-10-01 | 14.45 | 0.68 | 0.01 | 0.00 | 2.65 | 0.57 | 1.53 | 0.03 | 0.00 | 0.00 | 0.29 | 0.09 | 0.18 | 2.11 | 8.48 | 0.05 | 1.29 | 0.41 | 0.68 |
| 40 | 2022-10-08 | 15.06 | 0.99 | 0.00 | 0.00 | 2.17 | 1.01 | 1.58 | 0.03 | 0.02 | 0.00 | 0.20 | 0.05 | 0.11 | 2.44 | 8.53 | 0.07 | 1.39 | 0.34 | 0.67 |
| 41 | 2022-10-15 | 16.58 | 1.44 | 0.03 | 0.01 | 2.66 | 1.05 | 1.57 | 0.01 | 0.03 | 0.00 | 0.36 | 0.03 | 0.16 | 3.52 | 9.54 | 0.10 | 1.74 | 0.58 | 0.98 |
| 42 | 2022-10-22 | 15.39 | 2.39 | 0.03 | 0.00 | 2.96 | 0.77 | 1.92 | 0.05 | 0.02 | 0.00 | 0.45 | 0.05 | 0.25 | 4.56 | 8.18 | 0.07 | 2.11 | 0.63 | 1.14 |
| 43 | 2022-10-29 | 15.78 | 5.54 | 0.03 | 0.01 | 5.23 | 0.68 | 2.60 | 0.03 | 0.02 | 0.00 | 0.55 | 0.06 | 0.23 | 6.59 | 8.11 | 0.07 | 2.16 | 0.55 | 1.32 |
| 44 | 2022-11-05 | 13.91 | 10.91 | 0.10 | 0.04 | 8.42 | 1.08 | 3.39 | 0.03 | 0.10 | 0.03 | 0.71 | 0.12 | 0.31 | 7.63 | 7.82 | 0.05 | 3.35 | 0.83 | 1.92 |
| 45 | 2022-11-12 | 12.43 | 16.20 | 0.07 | 0.02 | 9.83 | 1.18 | 4.19 | 0.04 | 0.06 | 0.02 | 0.97 | 0.22 | 0.44 | 7.54 | 7.03 | 0.04 | 4.43 | 1.29 | 2.59 |
| 46 | 2022-11-19 | 11.97 | 20.15 | 0.10 | 0.03 | 13.95 | 1.42 | 5.47 | 0.05 | 0.06 | 0.01 | 1.49 | 0.09 | 0.58 | 7.51 | 7.18 | 0.06 | 6.33 | 1.38 | 3.29 |
| 47 | 2022-11-26 | 11.76 | 24.06 | 0.13 | 0.03 | 15.24 | 1.25 | 6.91 | 0.04 | 0.07 | 0.04 | 2.13 | 0.13 | 0.80 | 6.65 | 8.10 | 0.03 | 8.69 | 1.79 | 4.46 |
| 48 | 2022-12-03 | 12.12 | 23.83 | 0.19 | 0.04 | 18.07 | 0.76 | 9.40 | 0.03 | 0.15 | 0.01 | 3.18 | 0.08 | 1.20 | 6.93 | 8.92 | 0.02 | 9.47 | 3.11 | 5.72 |
| 49 | 2022-12-10 | 12.63 | 20.95 | 0.23 | 0.03 | 19.52 | 1.43 | 11.41 | 0.06 | 0.05 | 0.01 | 4.21 | 0.19 | 1.60 | 7.36 | 10.09 | 0.06 | 12.26 | 4.87 | 7.12 |
| 50 | 2022-12-17 | 13.10 | 17.20 | 0.23 | 0.01 | 26.42 | 1.97 | 14.27 | 0.07 | 0.02 | 0.01 | 7.95 | 0.15 | 2.55 | 8.71 | 10.78 | 0.07 | 13.19 | 5.39 | 7.93 |
| 51 | 2022-12-24 | 14.15 | 12.50 | 0.18 | 0.00 | 28.53 | 2.27 | 16.81 | 0.05 | 0.02 | 0.01 | 10.44 | 0.19 | 3.30 | 9.26 | 8.97 | 0.07 | 15.23 | 6.52 | 9.27 |
| 52 | 2022-12-31 | 15.61 | 7.97 | 0.09 | 0.00 | 33.97 | 3.30 | 20.41 | 0.07 | 0.01 | 0.00 | 12.73 | 0.23 | 4.07 | 10.69 | 6.72 | 0.01 | 17.80 | 6.83 | 10.39 |
| 1 | 2023-01-07 | 15.09 | 4.59 | 0.08 | 0.00 | 30.93 | 4.58 | 19.55 | 0.07 | 0.00 | 0.00 | 10.34 | 0.22 | 3.86 | 10.40 | 5.26 | 0.04 | 15.62 | 7.12 | 10.17 |
| 2 | 2023-01-14 | 13.41 | 2.24 | 0.11 | 0.00 | 26.80 | 5.46 | 19.10 | 0.05 | 0.01 | 0.00 | 11.01 | 0.29 | 3.91 | 9.12 | 4.32 | 0.07 | 14.05 | 6.60 | 9.63 |
| 3 | 2023-01-21 | 12.26 | 1.39 | 0.04 | 0.01 | 28.20 | 9.13 | 18.94 | 0.14 | 0.01 | 0.01 | 12.75 | 0.35 | 4.69 | 8.47 | 3.42 | 0.03 | 15.56 | 6.72 | 10.32 |
| 4 | 2023-01-28 | 11.35 | 0.91 | 0.05 | 0.00 | 27.01 | 12.34 | 18.81 | 0.15 | 0.00 | 0.00 | 12.74 | 0.41 | 5.15 | 7.97 | 2.33 | 0.05 | 15.88 | 7.02 | 11.23 |
| 5 | 2023-02-04 | 11.56 | 0.75 | 0.03 | 0.00 | 23.66 | 15.78 | 19.14 | 0.28 | 0.01 | 0.00 | 14.84 | 0.41 | 5.76 | 7.18 | 2.19 | 0.04 | 16.33 | 7.17 | 11.49 |
| 6 | 2023-02-11 | 11.89 | 0.68 | 0.04 | 0.02 | 23.36 | 15.63 | 18.79 | 0.34 | 0.01 | 0.00 | 16.23 | 0.44 | 6.21 | 5.79 | 2.10 | 0.08 | 15.79 | 6.52 | 11.70 |
| 7 | 2023-02-18 | 11.79 | 0.55 | 0.02 | 0.00 | 24.22 | 15.48 | 18.52 | 0.29 | 0.00 | 0.00 | 17.02 | 0.35 | 6.54 | 5.13 | 2.16 | 0.02 | 15.53 | 6.95 | 11.26 |
| 8 | 2023-02-25 | 11.74 | 0.57 | 0.06 | 0.00 | 28.62 | 12.42 | 18.53 | 0.50 | 0.02 | 0.00 | 16.79 | 0.45 | 6.60 | 4.54 | 2.12 | 0.05 | 15.47 | 6.64 | 10.63 |
| 9 | 2023-03-04 | 11.19 | 0.63 | 0.12 | 0.00 | 29.30 | 11.04 | 18.35 | 0.70 | 0.00 | 0.00 | 15.45 | 0.74 | 6.24 | 3.73 | 2.50 | 0.01 | 15.62 | 6.54 | 10.04 |
| 10 | 2023-03-11 | 11.43 | 0.62 | 0.16 | 0.00 | 29.65 | 8.51 | 16.81 | 0.78 | 0.00 | 0.00 | 14.86 | 0.81 | 6.41 | 2.82 | 3.10 | 0.00 | 14.97 | 6.35 | 9.37 |
| 11 | 2023-03-18 | 11.59 | 0.52 | 0.26 | 0.01 | 24.27 | 6.74 | 14.55 | 1.16 | 0.01 | 0.00 | 13.11 | 1.05 | 6.86 | 2.20 | 3.71 | 0.03 | 12.11 | 6.29 | 8.83 |
| 12 | 2023-03-25 | 11.29 | 0.60 | 0.86 | 0.00 | 20.91 | 5.51 | 12.67 | 1.29 | 0.00 | 0.00 | 11.53 | 1.51 | 7.43 | 1.97 | 3.79 | 0.07 | 10.70 | 6.46 | 8.12 |
| 13 | 2023-04-01 | 10.85 | 0.64 | 1.52 | 0.00 | 18.09 | 4.67 | 11.66 | 1.74 | 0.00 | 0.00 | 12.55 | 1.98 | 7.90 | 1.64 | 4.00 | 0.04 | 9.32 | 6.45 | 7.64 |
| 14 | 2023-04-08 | 10.92 | 0.38 | 2.48 | 0.00 | 17.83 | 3.21 | 9.98 | 1.85 | 0.01 | 0.00 | 13.12 | 2.12 | 7.88 | 1.34 | 4.05 | 0.08 | 8.09 | 5.32 | 6.44 |
| 15 | 2023-04-15 | 11.37 | 0.60 | 3.84 | 0.01 | 17.75 | 2.18 | 8.72 | 1.93 | 0.02 | 0.00 | 12.22 | 2.00 | 7.55 | 1.41 | 3.46 | 0.11 | 7.73 | 4.64 | 5.97 |
| 16 | 2023-04-22 | 10.94 | 0.51 | 6.98 | 0.00 | 13.67 | 2.13 | 6.80 | 1.85 | 0.01 | 0.00 | 11.94 | 2.56 | 7.68 | 1.31 | 2.97 | 0.23 | 6.64 | 4.40 | 5.40 |
| 17 | 2023-04-29 | 10.08 | 0.48 | 9.67 | 0.00 | 11.31 | 1.28 | 5.34 | 1.83 | 0.01 | 0.00 | 12.18 | 2.94 | 7.49 | 1.14 | 2.84 | 0.21 | 5.79 | 3.52 | 4.58 |
| 18 | 2023-05-06 | 9.85 | 0.50 | 11.28 | 0.00 | 8.05 | 0.89 | 3.95 | 1.81 | 0.01 | 0.00 | 10.20 | 2.62 | 6.31 | 0.86 | 2.34 | 0.27 | 4.86 | 2.78 | 3.62 |
| 19 | 2023-05-13 | 9.60 | 0.66 | 12.58 | 0.00 | 8.27 | 0.90 | 3.26 | 1.46 | 0.05 | 0.00 | 9.33 | 2.12 | 5.72 | 0.72 | 2.40 | 0.24 | 4.61 | 2.30 | 3.16 |
| 20 | 2023-05-20 | 9.33 | 0.77 | 10.28 | 0.00 | 6.42 | 0.56 | 2.33 | 1.29 | 0.07 | 0.01 | 7.59 | 1.12 | 4.89 | 0.61 | 2.52 | 0.18 | 4.46 | 1.59 | 2.66 |
| 21 | 2023-05-27 | 9.23 | 0.51 | 9.73 | 0.01 | 4.40 | 0.12 | 1.67 | 1.13 | 0.04 | 0.00 | 5.43 | 0.91 | 3.93 | 0.40 | 2.25 | 0.25 | 4.10 | 1.23 | 2.13 |
| 22 | 2023-06-03 | 8.45 | 0.53 | 8.38 | 0.00 | 2.98 | 0.29 | 1.35 | 1.02 | 0.06 | 0.00 | 3.51 | 0.53 | 2.51 | 0.55 | 2.40 | 0.26 | 3.72 | 0.86 | 1.71 |
| 23 | 2023-06-10 | 7.44 | 0.62 | 6.88 | 0.00 | 2.55 | 0.56 | 1.07 | 0.69 | 0.13 | 0.00 | 2.78 | 0.32 | 1.79 | 0.41 | 2.10 | 0.18 | 3.38 | 0.77 | 1.56 |
| 24 | 2023-06-17 | 6.69 | 0.57 | 4.95 | 0.02 | 2.82 | 0.30 | 0.93 | 0.47 | 0.06 | 0.00 | 2.11 | 0.27 | 1.32 | 0.32 | 1.95 | 0.32 | 3.22 | 0.50 | 1.37 |
| 25 | 2023-06-24 | 6.18 | 0.60 | 2.95 | 0.00 | 2.78 | 0.32 | 0.97 | 0.35 | 0.08 | 0.00 | 1.35 | 0.32 | 0.91 | 0.34 | 1.82 | 0.31 | 2.91 | 0.42 | 1.05 |
| 26 | 2023-07-01 | 5.79 | 0.52 | 2.19 | 0.00 | 2.04 | 0.48 | 1.08 | 0.19 | 0.06 | 0.00 | 1.08 | 0.21 | 0.73 | 0.37 | 1.45 | 0.27 | 2.06 | 0.26 | 0.79 |
| 27 | 2023-07-08 | 5.75 | 0.40 | 1.19 | 0.00 | 1.90 | 0.30 | 1.06 | 0.19 | 0.04 | 0.00 | 1.04 | 0.06 | 0.42 | 0.33 | 1.47 | 0.43 | 1.85 | 0.30 | 0.81 |
| 28 | 2023-07-15 | 6.14 | 0.58 | 0.74 | 0.00 | 1.35 | 0.34 | 0.65 | 0.22 | 0.05 | 0.00 | 0.59 | 0.00 | 0.26 | 0.38 | 1.40 | 0.11 | 1.48 | 0.35 | 0.67 |
| 29 | 2023-07-22 | 6.94 | 0.45 | 0.63 | 0.00 | 1.38 | 0.47 | 0.93 | 0.09 | 0.05 | 0.00 | 0.40 | 0.00 | 0.15 | 0.48 | 1.48 | 0.82 | 1.28 | 0.11 | 0.48 |
| 30 | 2023-07-29 | 7.70 | 0.45 | 0.36 | 0.04 | 1.29 | 0.40 | 0.75 | 0.04 | 0.02 | 0.00 | 0.31 | 0.06 | 0.15 | 0.48 | 1.08 | 0.93 | 1.96 | 0.14 | 0.64 |
| 31 | 2023-08-05 | 8.41 | 0.38 | 0.26 | 0.00 | 1.57 | 0.40 | 0.92 | 0.08 | 0.04 | 0.00 | 0.36 | 0.00 | 0.19 | 0.48 | 1.18 | 1.36 | 1.42 | 0.31 | 0.68 |
| 32 | 2023-08-12 | 9.39 | 0.64 | 0.16 | 0.00 | 1.19 | 0.45 | 0.77 | 0.06 | 0.02 | 0.00 | 0.32 | 0.00 | 0.15 | 0.55 | 1.14 | 1.52 | 1.84 | 0.16 | 0.64 |
| 33 | 2023-08-19 | 11.58 | 0.56 | 0.16 | 0.00 | 1.51 | 0.32 | 0.69 | 0.08 | 0.02 | 0.00 | 0.25 | 0.06 | 0.16 | 0.43 | 1.37 | 1.98 | 1.96 | 0.25 | 0.76 |
| 34 | 2023-08-26 | 13.40 | 0.50 | 0.23 | 0.02 | 1.29 | 0.42 | 0.82 | 0.05 | 0.00 | 0.01 | 0.29 | 0.00 | 0.10 | 0.51 | 1.17 | 3.59 | 1.76 | 0.26 | 0.88 |
Shaded area represents the maximum and minimum % of respiratory virus tests positive reported by week from seasons 2014-2015 to 2019-2020
Note: Changes to testing practices during the COVID-19 pandemic may cause substantial changes to indicator estimates from previous years. Collection of laboratory testing practice meta-data to understand these changes is ongoing. Interpret trends with caution.
Note: Data from week 11 of the 2019-2020 season onwards are excluded from the historical comparison due to the COVID-19 pandemic.
Note: % Tests Positive scale changes across the dashed line
Figure 2: Positive tests (%) of other respiratory viruses reported by participating laboratories in Canada by surveillance week compared to average and range from 2014-2015 to 2019-2020 season
| Week | Week end | 2022-2023 EV/RV% | 2021-2022 EV/RV% | 2020-2021 EV/RV% | Max EV/RV% Base | Min EV/RV% Base | Av EV/RV% Base | 2022-2023 HPIV% | 2021-2022 HPIV% | 2020-2021 HPIV% | Max HPIV% Base | Min HPIV% Base | Av HPIV% Base | 2022-2023 ADV% | 2021-2022 ADV% | 2020-2021 ADV% | Max ADV% Base | Min ADV% Base | Av ADV% Base | 2022-2023 HMPV% | 2021-2022 HMPV% | 2020-2021 HMPV% | Max HMPV% Base | Min HMPV% Base | Av HMPV% Base | 2022-2023 HCoV% | 2021-2022 HCoV% | 2020-2021 HCoV% | Max HCoV% Base | Min HCoV% Base | Av HCoV% Base |
|---|---|---|---|---|---|---|---|---|---|---|---|---|---|---|---|---|---|---|---|---|---|---|---|---|---|---|---|---|---|---|---|
| 35 | 2022-09-03 | 15.47 | 21.96 | 9.07 | 27.19 | 22.44 | 24.78 | 2.80 | 5.99 | 0.08 | 3.16 | 1.15 | 2.42 | 2.28 | 1.18 | 0.27 | 1.74 | 0.99 | 1.43 | 1.80 | 0.23 | 0.17 | 2.04 | 0.10 | 0.77 | 0.53 | 1.05 | 0.06 | 0.76 | 0.18 | 0.45 |
| 36 | 2022-09-10 | 16.22 | 18.59 | 8.13 | 30.69 | 23.30 | 26.31 | 3.21 | 4.93 | 0.20 | 3.31 | 1.35 | 2.32 | 2.19 | 1.15 | 0.40 | 2.85 | 1.42 | 1.87 | 1.81 | 0.24 | 0.06 | 0.84 | 0.10 | 0.48 | 0.38 | 0.62 | 0.00 | 0.38 | 0.12 | 0.22 |
| 37 | 2022-09-17 | 21.73 | 27.46 | 8.07 | 33.58 | 27.74 | 31.68 | 3.02 | 5.97 | 0.13 | 3.26 | 1.65 | 2.40 | 2.10 | 0.81 | 0.35 | 2.44 | 1.38 | 1.86 | 1.38 | 0.17 | 0.05 | 1.61 | 0.00 | 0.51 | 0.28 | 0.44 | 0.05 | 0.56 | 0.00 | 0.26 |
| 38 | 2022-09-24 | 23.50 | 33.19 | 15.67 | 39.57 | 32.80 | 35.33 | 2.40 | 4.73 | 0.07 | 2.87 | 1.92 | 2.33 | 1.59 | 0.82 | 0.58 | 2.04 | 1.11 | 1.63 | 1.61 | 0.37 | 0.02 | 1.43 | 0.06 | 0.47 | 0.32 | 0.67 | 0.00 | 1.36 | 0.06 | 0.43 |
| 39 | 2022-10-01 | 22.89 | 30.01 | 24.12 | 40.59 | 34.87 | 37.68 | 3.10 | 8.12 | 0.02 | 3.01 | 1.70 | 2.24 | 2.21 | 1.14 | 0.19 | 2.27 | 1.04 | 1.66 | 1.43 | 0.17 | 0.04 | 0.72 | 0.05 | 0.28 | 0.59 | 0.62 | 0.05 | 0.66 | 0.07 | 0.45 |
| 40 | 2022-10-08 | 19.32 | 26.26 | 16.62 | 41.29 | 33.00 | 35.43 | 3.70 | 8.19 | 0.02 | 3.28 | 1.90 | 2.43 | 1.80 | 1.31 | 0.44 | 2.25 | 1.39 | 1.82 | 1.43 | 0.16 | 0.00 | 0.92 | 0.05 | 0.34 | 0.93 | 0.57 | 0.09 | 1.08 | 0.22 | 0.58 |
| 41 | 2022-10-15 | 16.70 | 22.91 | 15.48 | 33.62 | 26.94 | 29.81 | 3.52 | 10.46 | 0.06 | 3.70 | 1.94 | 2.74 | 2.03 | 1.37 | 0.37 | 1.91 | 1.28 | 1.70 | 1.66 | 0.20 | 0.19 | 0.95 | 0.04 | 0.46 | 1.00 | 1.69 | 0.02 | 0.70 | 0.00 | 0.33 |
| 42 | 2022-10-22 | 12.95 | 22.16 | 13.60 | 32.62 | 24.54 | 27.82 | 4.21 | 10.01 | 0.06 | 3.89 | 2.64 | 3.20 | 1.67 | 2.54 | 0.47 | 2.38 | 1.47 | 1.86 | 1.59 | 0.15 | 0.06 | 0.89 | 0.15 | 0.38 | 1.16 | 1.07 | 0.00 | 1.18 | 0.20 | 0.49 |
| 43 | 2022-10-29 | 11.05 | 19.64 | 13.14 | 28.73 | 21.67 | 24.95 | 4.41 | 9.38 | 0.07 | 3.98 | 3.18 | 3.56 | 1.79 | 1.15 | 0.37 | 2.42 | 1.63 | 1.96 | 1.78 | 0.36 | 0.02 | 1.64 | 0.12 | 0.57 | 1.86 | 1.05 | 0.00 | 2.35 | 0.27 | 0.75 |
| 44 | 2022-11-05 | 10.23 | 21.45 | 9.23 | 23.82 | 16.75 | 21.34 | 4.14 | 10.28 | 0.03 | 4.81 | 2.94 | 3.70 | 2.02 | 1.42 | 0.22 | 2.88 | 1.18 | 2.20 | 1.79 | 0.77 | 0.13 | 1.08 | 0.23 | 0.47 | 2.54 | 2.21 | 0.00 | 2.59 | 0.21 | 0.88 |
| 45 | 2022-11-12 | 7.77 | 22.39 | 9.70 | 23.08 | 15.17 | 20.56 | 3.90 | 9.97 | 0.01 | 5.42 | 2.53 | 4.01 | 1.99 | 1.63 | 0.33 | 2.68 | 2.02 | 2.42 | 2.06 | 0.64 | 0.01 | 1.30 | 0.04 | 0.77 | 3.00 | 2.57 | 0.03 | 2.74 | 0.52 | 0.96 |
| 46 | 2022-11-19 | 6.93 | 21.37 | 9.02 | 22.77 | 15.28 | 19.27 | 3.97 | 8.29 | 0.04 | 5.72 | 1.62 | 4.19 | 1.87 | 2.51 | 0.30 | 2.90 | 1.99 | 2.53 | 1.89 | 0.99 | 0.04 | 1.43 | 0.18 | 0.79 | 3.54 | 2.99 | 0.03 | 3.32 | 0.46 | 1.25 |
| 47 | 2022-11-26 | 4.88 | 18.54 | 8.44 | 20.84 | 12.15 | 16.09 | 3.63 | 7.04 | 0.06 | 7.00 | 2.36 | 4.72 | 1.89 | 1.94 | 0.32 | 2.95 | 1.83 | 2.35 | 1.78 | 1.01 | 0.02 | 2.02 | 0.09 | 0.89 | 3.24 | 3.90 | 0.04 | 3.26 | 0.37 | 1.25 |
| 48 | 2022-12-03 | 4.74 | 16.64 | 7.94 | 16.72 | 12.69 | 13.83 | 3.04 | 5.78 | 0.02 | 6.14 | 3.03 | 4.18 | 1.87 | 1.89 | 0.35 | 3.34 | 1.66 | 2.48 | 1.86 | 1.48 | 0.02 | 1.94 | 0.31 | 1.08 | 3.94 | 4.94 | 0.02 | 4.30 | 1.00 | 2.04 |
| 49 | 2022-12-10 | 4.09 | 14.57 | 6.21 | 16.32 | 10.72 | 13.07 | 3.03 | 3.97 | 0.00 | 5.65 | 2.94 | 4.19 | 1.68 | 2.48 | 0.54 | 3.03 | 1.84 | 2.49 | 1.93 | 1.22 | 0.05 | 2.80 | 0.49 | 1.46 | 4.48 | 6.58 | 0.05 | 5.19 | 0.84 | 2.52 |
| 50 | 2022-12-17 | 4.58 | 12.40 | 6.62 | 13.85 | 8.43 | 10.90 | 2.98 | 3.23 | 0.06 | 5.95 | 2.54 | 4.27 | 2.29 | 2.72 | 0.51 | 3.27 | 1.49 | 2.45 | 1.92 | 1.08 | 0.02 | 3.32 | 0.46 | 1.70 | 5.13 | 7.26 | 0.11 | 6.04 | 1.54 | 3.16 |
| 51 | 2022-12-24 | 4.49 | 9.95 | 5.65 | 14.18 | 8.81 | 10.48 | 3.09 | 3.01 | 0.04 | 6.71 | 2.94 | 3.95 | 1.76 | 2.54 | 0.58 | 3.20 | 1.36 | 2.04 | 2.23 | 1.20 | 0.04 | 4.39 | 0.37 | 2.44 | 5.28 | 8.11 | 0.05 | 6.68 | 1.87 | 3.72 |
| 52 | 2022-12-31 | 4.50 | 7.71 | 6.53 | 14.41 | 6.24 | 9.23 | 3.32 | 2.13 | 0.03 | 5.08 | 2.87 | 3.75 | 1.80 | 1.92 | 0.48 | 2.59 | 1.20 | 1.76 | 2.75 | 1.00 | 0.11 | 3.81 | 0.41 | 2.44 | 4.73 | 10.33 | 0.07 | 6.73 | 2.78 | 4.75 |
| 1 | 2023-01-07 | 4.19 | 5.71 | 5.43 | 11.09 | 4.36 | 7.42 | 3.63 | 1.84 | 0.12 | 5.08 | 2.68 | 3.34 | 1.88 | 1.84 | 0.81 | 2.67 | 0.85 | 1.54 | 2.94 | 0.72 | 0.06 | 4.45 | 0.28 | 2.70 | 4.40 | 9.27 | 0.12 | 7.77 | 3.07 | 5.16 |
| 2 | 2023-01-14 | 4.71 | 3.98 | 5.18 | 9.55 | 4.31 | 6.79 | 3.24 | 1.19 | 0.08 | 4.12 | 2.46 | 3.05 | 1.87 | 1.13 | 0.82 | 2.15 | 0.87 | 1.37 | 2.61 | 0.38 | 0.03 | 4.76 | 0.42 | 2.66 | 4.01 | 7.46 | 0.16 | 7.89 | 2.84 | 5.44 |
| 3 | 2023-01-21 | 6.68 | 3.12 | 3.56 | 8.42 | 4.44 | 6.01 | 2.92 | 0.76 | 0.05 | 3.25 | 2.59 | 2.82 | 1.97 | 1.34 | 0.40 | 2.10 | 1.15 | 1.45 | 2.56 | 0.24 | 0.11 | 5.56 | 0.47 | 3.13 | 3.46 | 4.97 | 0.26 | 7.90 | 4.17 | 6.11 |
| 4 | 2023-01-28 | 8.22 | 2.60 | 3.87 | 9.04 | 4.89 | 6.41 | 2.78 | 0.64 | 0.06 | 3.12 | 1.77 | 2.55 | 2.35 | 1.18 | 0.46 | 1.83 | 1.11 | 1.49 | 2.71 | 0.23 | 0.12 | 5.19 | 0.55 | 3.01 | 2.63 | 3.92 | 0.16 | 7.86 | 3.79 | 6.08 |
| 5 | 2023-02-04 | 8.94 | 3.02 | 4.76 | 9.79 | 6.06 | 6.94 | 2.70 | 0.48 | 0.06 | 3.48 | 1.70 | 2.39 | 2.44 | 1.57 | 0.29 | 1.93 | 1.36 | 1.62 | 2.96 | 0.25 | 0.16 | 5.70 | 0.58 | 3.29 | 3.20 | 2.83 | 0.13 | 8.49 | 4.55 | 6.84 |
| 6 | 2023-02-11 | 9.97 | 3.86 | 5.08 | 9.89 | 6.16 | 6.98 | 2.67 | 0.51 | 0.10 | 2.89 | 1.57 | 2.19 | 2.14 | 1.44 | 0.54 | 1.74 | 1.25 | 1.51 | 3.73 | 0.42 | 0.19 | 5.57 | 0.65 | 3.39 | 2.64 | 3.01 | 0.20 | 8.57 | 3.48 | 6.75 |
| 7 | 2023-02-18 | 9.87 | 4.46 | 5.56 | 8.95 | 6.00 | 7.02 | 2.63 | 0.44 | 0.00 | 3.20 | 1.42 | 2.12 | 2.31 | 1.52 | 0.49 | 1.61 | 1.30 | 1.51 | 4.41 | 0.44 | 0.14 | 6.05 | 1.45 | 3.94 | 3.14 | 3.24 | 0.13 | 8.02 | 4.35 | 6.54 |
| 8 | 2023-02-25 | 9.55 | 6.31 | 4.77 | 8.35 | 5.20 | 6.94 | 2.55 | 0.73 | 0.16 | 3.21 | 1.31 | 2.25 | 2.86 | 1.85 | 0.72 | 2.00 | 1.38 | 1.67 | 4.29 | 0.53 | 0.04 | 5.74 | 1.19 | 4.08 | 3.06 | 3.67 | 0.14 | 8.29 | 4.21 | 6.60 |
| 9 | 2023-03-04 | 9.77 | 7.80 | 5.48 | 9.04 | 5.73 | 7.75 | 3.06 | 0.60 | 0.07 | 3.35 | 1.41 | 2.44 | 2.75 | 1.90 | 0.86 | 1.92 | 1.09 | 1.40 | 4.72 | 0.40 | 0.11 | 6.42 | 1.87 | 4.38 | 3.41 | 3.32 | 0.36 | 8.01 | 5.09 | 6.86 |
| 10 | 2023-03-11 | 9.42 | 8.24 | 4.62 | 10.16 | 5.55 | 8.08 | 2.77 | 0.68 | 0.06 | 4.18 | 1.19 | 2.69 | 2.79 | 1.98 | 0.38 | 2.23 | 1.50 | 1.78 | 5.04 | 0.51 | 0.00 | 6.74 | 2.26 | 4.80 | 3.70 | 3.86 | 0.34 | 8.34 | 4.28 | 7.01 |
| 11 | 2023-03-18 | 8.77 | 8.97 | 4.08 | 9.45 | 7.15 | 8.24 | 3.48 | 0.66 | 0.19 | 4.58 | 1.35 | 3.00 | 2.39 | 1.88 | 0.63 | 2.32 | 1.23 | 1.69 | 5.07 | 0.59 | 0.11 | 7.94 | 2.52 | 4.71 | 3.70 | 3.25 | 0.33 | 8.02 | 4.35 | 6.23 |
| 12 | 2023-03-25 | 9.31 | 9.52 | 4.61 | 10.26 | 8.71 | 9.66 | 2.98 | 1.05 | 0.00 | 4.95 | 1.26 | 3.34 | 2.56 | 1.71 | 0.35 | 2.13 | 1.84 | 1.97 | 5.45 | 0.77 | 0.14 | 6.69 | 3.65 | 5.19 | 4.53 | 4.38 | 0.54 | 6.99 | 3.95 | 5.69 |
| 13 | 2023-04-01 | 8.35 | 8.49 | 4.86 | 12.58 | 7.69 | 10.26 | 3.17 | 1.39 | 0.18 | 5.21 | 1.48 | 3.68 | 2.51 | 2.30 | 0.35 | 2.12 | 1.37 | 1.70 | 4.79 | 1.28 | 0.07 | 6.90 | 3.95 | 5.18 | 4.04 | 4.45 | 0.30 | 8.16 | 3.65 | 5.46 |
| 14 | 2023-04-08 | 8.95 | 9.25 | 5.49 | 13.59 | 8.60 | 12.03 | 3.45 | 1.18 | 0.00 | 6.26 | 1.67 | 4.31 | 2.56 | 1.74 | 0.34 | 2.31 | 1.50 | 1.86 | 4.61 | 1.45 | 0.04 | 7.70 | 4.14 | 6.00 | 4.51 | 4.24 | 0.41 | 7.79 | 3.84 | 4.87 |
| 15 | 2023-04-15 | 9.16 | 9.14 | 8.23 | 14.59 | 9.44 | 13.16 | 3.83 | 1.35 | 0.12 | 6.94 | 1.97 | 4.61 | 3.04 | 1.71 | 0.98 | 2.62 | 1.64 | 2.12 | 4.09 | 1.52 | 0.04 | 7.47 | 3.81 | 5.94 | 3.56 | 4.97 | 1.07 | 5.52 | 3.23 | 4.24 |
| 16 | 2023-04-22 | 8.67 | 8.20 | 6.18 | 16.10 | 10.84 | 13.78 | 3.89 | 2.19 | 0.16 | 7.88 | 1.97 | 5.20 | 2.79 | 1.84 | 0.82 | 3.21 | 1.85 | 2.32 | 3.93 | 2.18 | 0.04 | 7.16 | 3.71 | 5.90 | 3.64 | 4.91 | 0.69 | 4.99 | 3.51 | 4.32 |
| 17 | 2023-04-29 | 9.88 | 7.74 | 7.23 | 18.29 | 13.64 | 16.16 | 4.07 | 1.78 | 0.61 | 8.67 | 2.07 | 6.01 | 2.63 | 1.37 | 0.35 | 2.54 | 1.70 | 2.10 | 3.53 | 2.40 | 0.04 | 6.58 | 4.68 | 5.64 | 4.36 | 4.91 | 0.96 | 4.11 | 2.54 | 3.37 |
| 18 | 2023-05-06 | 10.97 | 7.41 | 5.63 | 20.03 | 12.39 | 16.31 | 4.84 | 2.07 | 0.08 | 8.42 | 3.19 | 5.85 | 3.57 | 1.32 | 0.77 | 2.89 | 1.36 | 2.23 | 3.15 | 2.55 | 0.00 | 6.37 | 3.14 | 5.08 | 3.42 | 4.80 | 0.69 | 4.00 | 2.36 | 3.09 |
| 19 | 2023-05-13 | 11.03 | 8.36 | 7.40 | 21.71 | 15.70 | 19.30 | 4.09 | 2.71 | 0.21 | 9.09 | 3.67 | 5.95 | 2.96 | 1.52 | 0.98 | 2.63 | 1.66 | 2.07 | 2.51 | 3.63 | 0.04 | 7.46 | 3.23 | 4.80 | 3.46 | 4.37 | 0.86 | 3.71 | 1.58 | 2.36 |
| 20 | 2023-05-20 | 10.82 | 9.06 | 8.13 | 24.52 | 16.67 | 19.75 | 4.12 | 3.29 | 0.05 | 8.60 | 3.90 | 6.75 | 3.18 | 1.68 | 0.71 | 3.35 | 1.79 | 2.44 | 1.79 | 4.79 | 0.14 | 6.85 | 2.55 | 4.99 | 2.71 | 4.53 | 0.75 | 3.31 | 1.87 | 2.49 |
| 21 | 2023-05-27 | 10.68 | 10.26 | 6.36 | 25.86 | 16.41 | 21.07 | 4.33 | 3.47 | 0.25 | 9.56 | 6.00 | 7.27 | 3.26 | 1.95 | 1.05 | 3.51 | 1.41 | 2.39 | 1.44 | 5.69 | 0.10 | 6.80 | 3.22 | 4.63 | 2.15 | 3.64 | 1.17 | 2.37 | 1.10 | 1.74 |
| 22 | 2023-06-03 | 10.83 | 9.14 | 4.59 | 23.76 | 17.55 | 20.50 | 5.12 | 3.32 | 0.35 | 8.71 | 5.94 | 6.99 | 3.16 | 1.56 | 0.82 | 3.45 | 1.91 | 2.79 | 1.23 | 5.22 | 0.11 | 5.39 | 2.43 | 3.84 | 2.31 | 3.78 | 0.69 | 2.06 | 0.56 | 1.23 |
| 23 | 2023-06-10 | 12.30 | 13.26 | 6.14 | 23.65 | 18.15 | 21.01 | 4.42 | 4.59 | 0.17 | 9.74 | 5.14 | 6.94 | 3.10 | 2.26 | 0.71 | 2.72 | 1.69 | 2.18 | 1.41 | 5.35 | 0.06 | 4.49 | 2.25 | 3.18 | 1.50 | 2.93 | 0.74 | 1.86 | 0.47 | 1.08 |
| 24 | 2023-06-17 | 12.22 | 14.36 | 8.01 | 26.76 | 20.72 | 23.68 | 4.26 | 4.70 | 1.52 | 8.25 | 5.76 | 7.01 | 4.24 | 2.36 | 1.43 | 3.80 | 1.96 | 2.89 | 0.97 | 6.29 | 0.12 | 3.48 | 1.85 | 2.67 | 1.61 | 3.09 | 0.62 | 1.54 | 0.88 | 1.19 |
| 25 | 2023-06-24 | 13.93 | 16.62 | 8.12 | 26.73 | 20.65 | 23.03 | 4.37 | 5.58 | 2.36 | 7.61 | 4.34 | 6.13 | 3.82 | 1.91 | 1.49 | 3.30 | 1.80 | 2.63 | 0.82 | 6.96 | 0.00 | 4.18 | 0.89 | 2.01 | 1.63 | 3.60 | 0.49 | 1.55 | 0.66 | 1.09 |
| 26 | 2023-07-01 | 12.97 | 16.96 | 9.31 | 30.25 | 22.65 | 25.25 | 4.22 | 5.11 | 2.54 | 8.72 | 4.97 | 6.42 | 4.04 | 2.87 | 1.16 | 3.49 | 1.55 | 2.43 | 1.02 | 6.29 | 0.12 | 4.28 | 0.60 | 2.05 | 1.13 | 2.02 | 0.53 | 1.77 | 0.36 | 0.76 |
| 27 | 2023-07-08 | 13.93 | 16.40 | 12.79 | 29.34 | 21.60 | 24.75 | 4.90 | 5.67 | 4.19 | 8.37 | 3.78 | 6.03 | 4.63 | 2.68 | 1.08 | 4.02 | 1.86 | 2.67 | 0.76 | 7.22 | 0.00 | 2.35 | 1.08 | 1.69 | 0.77 | 1.89 | 0.87 | 1.29 | 0.30 | 0.68 |
| 28 | 2023-07-15 | 13.74 | 16.12 | 14.81 | 25.35 | 22.07 | 23.65 | 4.09 | 5.78 | 2.41 | 8.38 | 3.40 | 5.36 | 4.27 | 2.54 | 1.31 | 3.02 | 1.87 | 2.55 | 0.52 | 4.88 | 0.07 | 2.28 | 0.44 | 1.22 | 0.59 | 1.07 | 0.17 | 1.17 | 0.30 | 0.60 |
| 29 | 2023-07-22 | 13.27 | 13.96 | 18.26 | 22.73 | 20.04 | 21.41 | 4.04 | 4.49 | 3.95 | 6.57 | 3.76 | 4.83 | 3.37 | 2.47 | 1.03 | 3.00 | 1.78 | 2.28 | 0.75 | 3.65 | 0.06 | 1.58 | 0.66 | 0.94 | 0.52 | 0.64 | 0.89 | 1.32 | 0.17 | 0.69 |
| 30 | 2023-07-29 | 13.02 | 11.53 | 22.88 | 21.00 | 18.90 | 20.22 | 3.43 | 4.87 | 2.08 | 7.25 | 2.75 | 4.60 | 3.45 | 2.71 | 0.98 | 2.97 | 1.60 | 2.26 | 0.41 | 4.03 | 0.12 | 1.47 | 0.24 | 0.87 | 0.55 | 1.38 | 1.07 | 1.33 | 0.27 | 0.53 |
| 31 | 2023-08-05 | 12.69 | 11.53 | 29.00 | 21.14 | 17.43 | 19.41 | 3.14 | 4.70 | 1.62 | 6.03 | 2.95 | 4.17 | 2.74 | 2.48 | 0.69 | 2.57 | 1.65 | 2.15 | 0.18 | 3.06 | 0.19 | 1.35 | 0.71 | 0.98 | 0.60 | 0.61 | 0.41 | 0.67 | 0.26 | 0.45 |
| 32 | 2023-08-12 | 13.94 | 13.14 | 22.06 | 26.07 | 16.14 | 20.44 | 3.28 | 4.31 | 2.55 | 4.64 | 1.86 | 3.01 | 2.30 | 2.55 | 1.18 | 2.68 | 1.77 | 2.26 | 0.41 | 3.40 | 0.24 | 1.11 | 0.17 | 0.56 | 0.39 | 0.33 | 0.52 | 0.87 | 0.09 | 0.48 |
| 33 | 2023-08-19 | 12.79 | 13.82 | 22.68 | 23.10 | 18.63 | 20.64 | 2.91 | 3.43 | 1.94 | 3.75 | 1.79 | 2.73 | 2.12 | 2.51 | 0.78 | 2.95 | 1.77 | 2.31 | 0.34 | 3.00 | 0.05 | 1.10 | 0.07 | 0.50 | 0.77 | 0.33 | 0.37 | 0.72 | 0.20 | 0.44 |
| 34 | 2023-08-26 | 12.54 | 12.83 | 21.79 | 21.44 | 18.25 | 19.30 | 2.15 | 2.50 | 4.22 | 3.86 | 2.31 | 3.05 | 1.65 | 1.88 | 0.86 | 2.70 | 1.14 | 1.80 | 0.30 | 2.86 | 0.12 | 1.06 | 0.08 | 0.52 | 0.58 | 0.30 | 0.72 | 0.84 | 0.19 | 0.45 |
Positive severe acute respiratory syndrome coronavirus 2 (SARS-CoV-2) tests
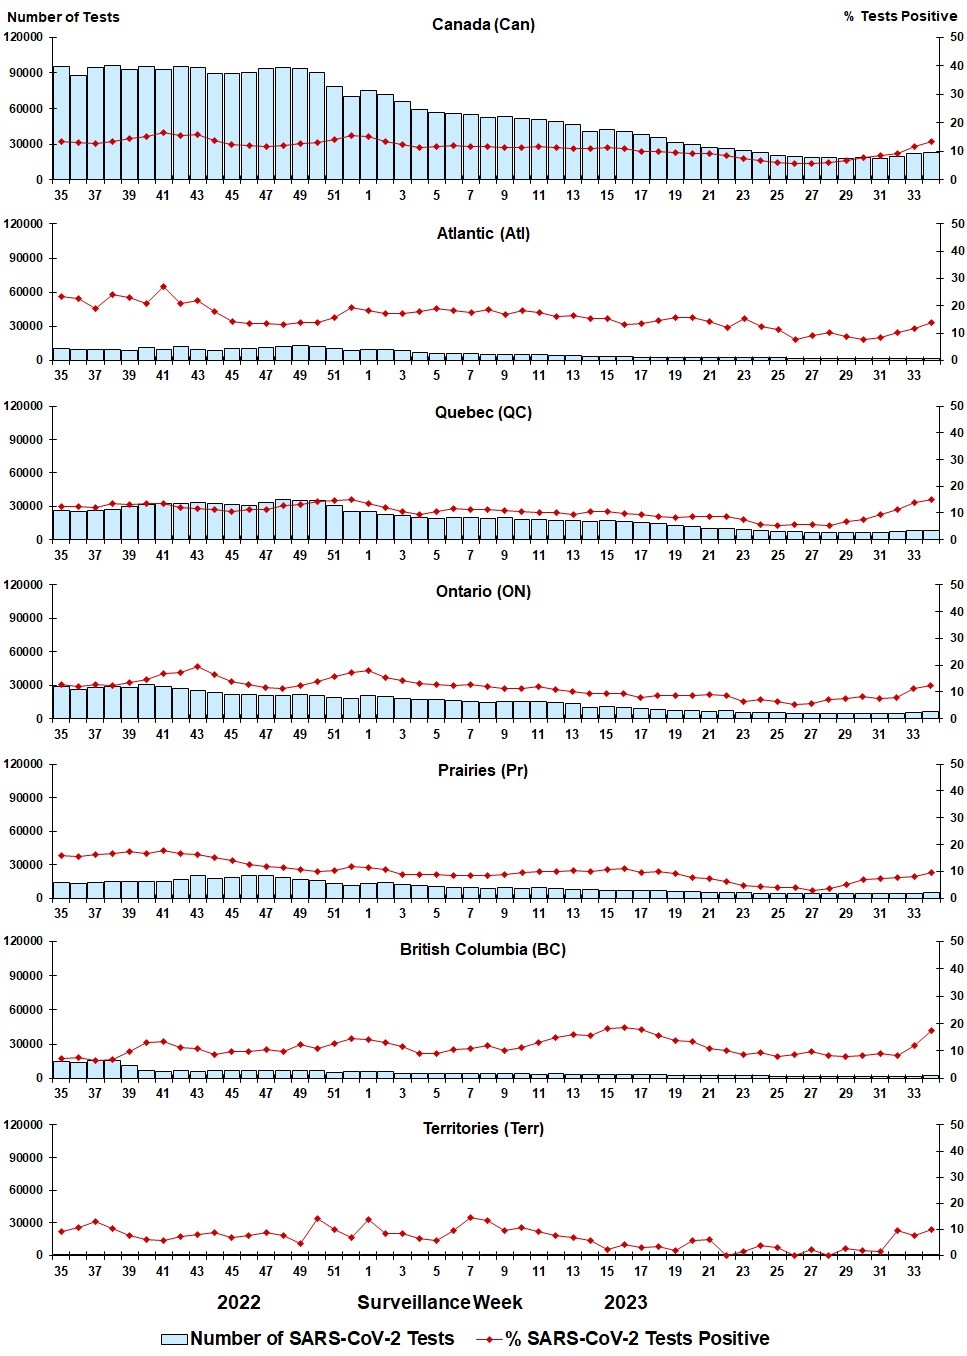
Note: Differences in positivity between jurisdictions can reflect differences in testing practices. Please interpret with caution.
Figure 3: Positive severe acute respiratory syndrome coronavirus 2 (SARS-CoV-2) tests (%) in Canada by region by surveillance week
| Week | Week end | Can Tests | SARS-CoV-2% | Atl Tests | SARS-CoV-2% | QC Tests | SARS-CoV-2% | ON Tests | SARS-CoV-2% | Pr Tests | SARS-CoV-2% | BC Tests | SARS-CoV-2% | Terr Tests | SARS-CoV-2% |
|---|---|---|---|---|---|---|---|---|---|---|---|---|---|---|---|
| 35 | 2022-09-03 | 95312 | 13.40 | 10317 | 23.39 | 26519 | 12.26 | 28978 | 12.71 | 14414 | 16.11 | 14523 | 7.27 | 561 | 9.27 |
| 36 | 2022-09-10 | 88007 | 13.07 | 9220 | 22.81 | 25637 | 12.40 | 25742 | 12.04 | 13370 | 15.42 | 13642 | 7.44 | 396 | 10.86 |
| 37 | 2022-09-17 | 94363 | 12.73 | 9788 | 18.93 | 26091 | 12.17 | 28069 | 12.72 | 14241 | 16.20 | 15727 | 6.70 | 447 | 13.20 |
| 38 | 2022-09-24 | 96287 | 13.61 | 9345 | 24.14 | 26931 | 13.36 | 28977 | 12.35 | 15042 | 16.85 | 15532 | 6.99 | 460 | 10.43 |
| 39 | 2022-10-01 | 92675 | 14.45 | 8311 | 23.17 | 29662 | 13.22 | 27909 | 13.57 | 14884 | 17.55 | 11511 | 9.65 | 398 | 7.79 |
| 40 | 2022-10-08 | 95462 | 15.06 | 11290 | 20.91 | 31745 | 13.44 | 30640 | 14.46 | 14766 | 16.55 | 6525 | 13.01 | 496 | 6.05 |
| 41 | 2022-10-15 | 93092 | 16.58 | 9618 | 27.02 | 32473 | 13.37 | 28633 | 17.02 | 15441 | 17.70 | 6458 | 13.35 | 469 | 5.76 |
| 42 | 2022-10-22 | 95270 | 15.39 | 11962 | 20.72 | 32792 | 12.10 | 26742 | 17.29 | 16894 | 16.80 | 6521 | 11.13 | 359 | 7.24 |
| 43 | 2022-10-29 | 94756 | 15.78 | 9563 | 21.97 | 33446 | 11.75 | 25142 | 19.65 | 20195 | 16.34 | 5991 | 10.82 | 419 | 8.11 |
| 44 | 2022-11-05 | 89782 | 13.91 | 8906 | 17.97 | 32692 | 11.30 | 23508 | 16.57 | 17710 | 15.27 | 6497 | 8.56 | 469 | 8.74 |
| 45 | 2022-11-12 | 89643 | 12.43 | 10513 | 14.36 | 31704 | 10.58 | 22024 | 13.83 | 18372 | 13.92 | 6651 | 9.76 | 379 | 6.86 |
| 46 | 2022-11-19 | 90476 | 11.97 | 10650 | 13.65 | 30751 | 11.13 | 21425 | 12.63 | 20655 | 12.41 | 6640 | 9.79 | 355 | 7.61 |
| 47 | 2022-11-26 | 93875 | 11.76 | 11661 | 13.65 | 33538 | 11.43 | 20744 | 11.77 | 20339 | 11.72 | 7236 | 10.50 | 357 | 8.68 |
| 48 | 2022-12-03 | 94410 | 12.12 | 12354 | 13.22 | 35547 | 12.95 | 20852 | 11.38 | 18486 | 11.58 | 6818 | 9.78 | 353 | 7.65 |
| 49 | 2022-12-10 | 93753 | 12.63 | 13445 | 13.82 | 34889 | 13.37 | 21193 | 12.30 | 16624 | 10.88 | 7198 | 12.25 | 404 | 4.46 |
| 50 | 2022-12-17 | 89983 | 13.10 | 11781 | 13.87 | 34271 | 14.24 | 20346 | 13.88 | 16279 | 10.13 | 6965 | 10.73 | 341 | 14.08 |
| 51 | 2022-12-24 | 78912 | 14.15 | 10225 | 15.87 | 30937 | 14.58 | 18610 | 15.78 | 13249 | 10.30 | 5579 | 12.56 | 312 | 9.94 |
| 52 | 2022-12-31 | 69932 | 15.61 | 8458 | 19.43 | 25554 | 15.29 | 18079 | 17.14 | 11699 | 11.99 | 5877 | 14.45 | 265 | 6.79 |
| 1 | 2023-01-07 | 75195 | 15.09 | 9934 | 18.10 | 24748 | 13.67 | 20785 | 17.96 | 13420 | 11.46 | 5974 | 14.16 | 334 | 13.77 |
| 2 | 2023-01-14 | 71607 | 13.41 | 9630 | 17.07 | 22640 | 12.05 | 19450 | 15.40 | 13853 | 10.63 | 5694 | 12.93 | 340 | 8.53 |
| 3 | 2023-01-21 | 65814 | 12.26 | 8435 | 17.29 | 21828 | 10.70 | 18101 | 14.33 | 12528 | 9.01 | 4637 | 11.47 | 285 | 8.42 |
| 4 | 2023-01-28 | 59464 | 11.35 | 6656 | 17.86 | 19478 | 9.48 | 17201 | 13.27 | 11564 | 8.86 | 4313 | 9.07 | 252 | 6.35 |
| 5 | 2023-02-04 | 56552 | 11.56 | 5958 | 18.95 | 18579 | 10.53 | 16669 | 12.57 | 10944 | 8.89 | 4144 | 8.93 | 258 | 5.81 |
| 6 | 2023-02-11 | 56255 | 11.89 | 6104 | 18.18 | 19683 | 11.59 | 16025 | 12.38 | 10040 | 8.40 | 4144 | 10.71 | 259 | 9.65 |
| 7 | 2023-02-18 | 55033 | 11.79 | 5613 | 17.66 | 19596 | 11.17 | 15744 | 12.81 | 9694 | 8.32 | 4179 | 10.91 | 207 | 14.49 |
| 8 | 2023-02-25 | 52551 | 11.74 | 4878 | 18.63 | 19200 | 11.20 | 14836 | 12.15 | 9171 | 8.45 | 4259 | 11.86 | 207 | 13.53 |
| 9 | 2023-03-04 | 53644 | 11.19 | 5550 | 16.85 | 19339 | 10.82 | 15219 | 11.39 | 9232 | 8.77 | 4055 | 10.09 | 249 | 9.64 |
| 10 | 2023-03-11 | 51399 | 11.43 | 4959 | 18.33 | 18106 | 10.52 | 14995 | 11.34 | 8995 | 9.69 | 4122 | 11.28 | 222 | 10.81 |
| 11 | 2023-03-18 | 50826 | 11.59 | 4754 | 17.37 | 17765 | 10.26 | 15074 | 11.90 | 9191 | 10.14 | 3828 | 13.01 | 214 | 9.35 |
| 12 | 2023-03-25 | 48733 | 11.29 | 4607 | 16.21 | 16710 | 10.15 | 14209 | 10.89 | 9087 | 10.08 | 3939 | 14.78 | 181 | 7.73 |
| 13 | 2023-04-01 | 46607 | 10.85 | 4341 | 16.47 | 17132 | 9.38 | 13065 | 9.94 | 8216 | 10.22 | 3676 | 15.86 | 177 | 6.78 |
| 14 | 2023-04-08 | 40799 | 10.92 | 3595 | 15.35 | 15657 | 10.40 | 10310 | 9.28 | 7634 | 10.07 | 3408 | 15.76 | 195 | 5.64 |
| 15 | 2023-04-15 | 41872 | 11.37 | 3771 | 15.43 | 16447 | 10.52 | 10477 | 9.48 | 7269 | 10.55 | 3736 | 18.31 | 172 | 2.33 |
| 16 | 2023-04-22 | 40231 | 10.94 | 3412 | 13.25 | 16103 | 9.69 | 9788 | 9.28 | 7057 | 11.21 | 3660 | 18.63 | 211 | 4.27 |
| 17 | 2023-04-29 | 38134 | 10.08 | 2700 | 13.52 | 15387 | 9.25 | 9083 | 7.85 | 7102 | 9.48 | 3690 | 18.02 | 172 | 2.91 |
| 18 | 2023-05-06 | 35581 | 9.85 | 2743 | 14.69 | 14520 | 8.49 | 8229 | 8.48 | 6765 | 9.98 | 3123 | 15.63 | 201 | 3.48 |
| 19 | 2023-05-13 | 31622 | 9.60 | 2557 | 15.68 | 12892 | 8.32 | 7456 | 8.64 | 5733 | 9.14 | 2794 | 13.92 | 190 | 2.11 |
| 20 | 2023-05-20 | 29753 | 9.33 | 2463 | 15.63 | 11868 | 8.49 | 6935 | 8.51 | 5833 | 7.63 | 2498 | 13.53 | 156 | 5.77 |
| 21 | 2023-05-27 | 27278 | 9.23 | 2311 | 14.11 | 10150 | 8.69 | 6566 | 9.15 | 5577 | 7.55 | 2481 | 11.08 | 193 | 6.22 |
| 22 | 2023-06-03 | 26683 | 8.45 | 2143 | 12.13 | 9842 | 8.63 | 6854 | 8.59 | 5368 | 6.09 | 2286 | 10.06 | 190 | 0.00 |
| 23 | 2023-06-10 | 24430 | 7.44 | 2274 | 15.17 | 9116 | 7.42 | 5647 | 6.34 | 5078 | 4.81 | 2171 | 8.89 | 144 | 1.39 |
| 24 | 2023-06-17 | 22707 | 6.69 | 2096 | 12.45 | 8566 | 5.70 | 5230 | 7.09 | 4579 | 4.26 | 2102 | 9.51 | 134 | 3.73 |
| 25 | 2023-06-24 | 20788 | 6.18 | 2126 | 11.19 | 7213 | 5.41 | 4997 | 6.36 | 4294 | 3.98 | 2061 | 8.01 | 97 | 3.09 |
| 26 | 2023-07-01 | 20066 | 5.79 | 1828 | 7.82 | 7184 | 5.83 | 4671 | 5.44 | 4209 | 3.94 | 2070 | 8.70 | 104 | 0.00 |
| 27 | 2023-07-08 | 19074 | 5.75 | 1685 | 9.14 | 6792 | 5.58 | 4457 | 5.47 | 4118 | 3.01 | 1939 | 9.95 | 83 | 2.41 |
| 28 | 2023-07-15 | 18813 | 6.14 | 1688 | 10.13 | 6640 | 5.38 | 4625 | 7.26 | 3925 | 3.57 | 1845 | 8.24 | 90 | 0.00 |
| 29 | 2023-07-22 | 18383 | 6.94 | 1560 | 8.91 | 6202 | 6.90 | 4887 | 7.47 | 3875 | 5.08 | 1750 | 8.17 | 109 | 2.75 |
| 30 | 2023-07-29 | 18540 | 7.70 | 1675 | 7.82 | 6178 | 7.59 | 4663 | 8.19 | 4105 | 7.16 | 1823 | 8.23 | 96 | 2.08 |
| 31 | 2023-08-05 | 18166 | 8.41 | 1684 | 8.49 | 6352 | 9.54 | 4533 | 7.65 | 3826 | 7.21 | 1700 | 9.12 | 71 | 1.41 |
| 32 | 2023-08-12 | 19314 | 9.39 | 1571 | 10.18 | 7151 | 11.44 | 4756 | 7.74 | 3986 | 7.90 | 1756 | 8.20 | 94 | 9.57 |
| 33 | 2023-08-19 | 21837 | 11.58 | 1716 | 11.77 | 7858 | 13.86 | 5757 | 11.06 | 4493 | 8.01 | 1933 | 12.16 | 80 | 7.50 |
| 34 | 2023-08-26 | 23381 | 13.40 | 1825 | 13.92 | 8580 | 14.95 | 5896 | 12.52 | 4816 | 9.76 | 2163 | 17.48 | 101 | 9.90 |
Positive influenza (Flu) tests
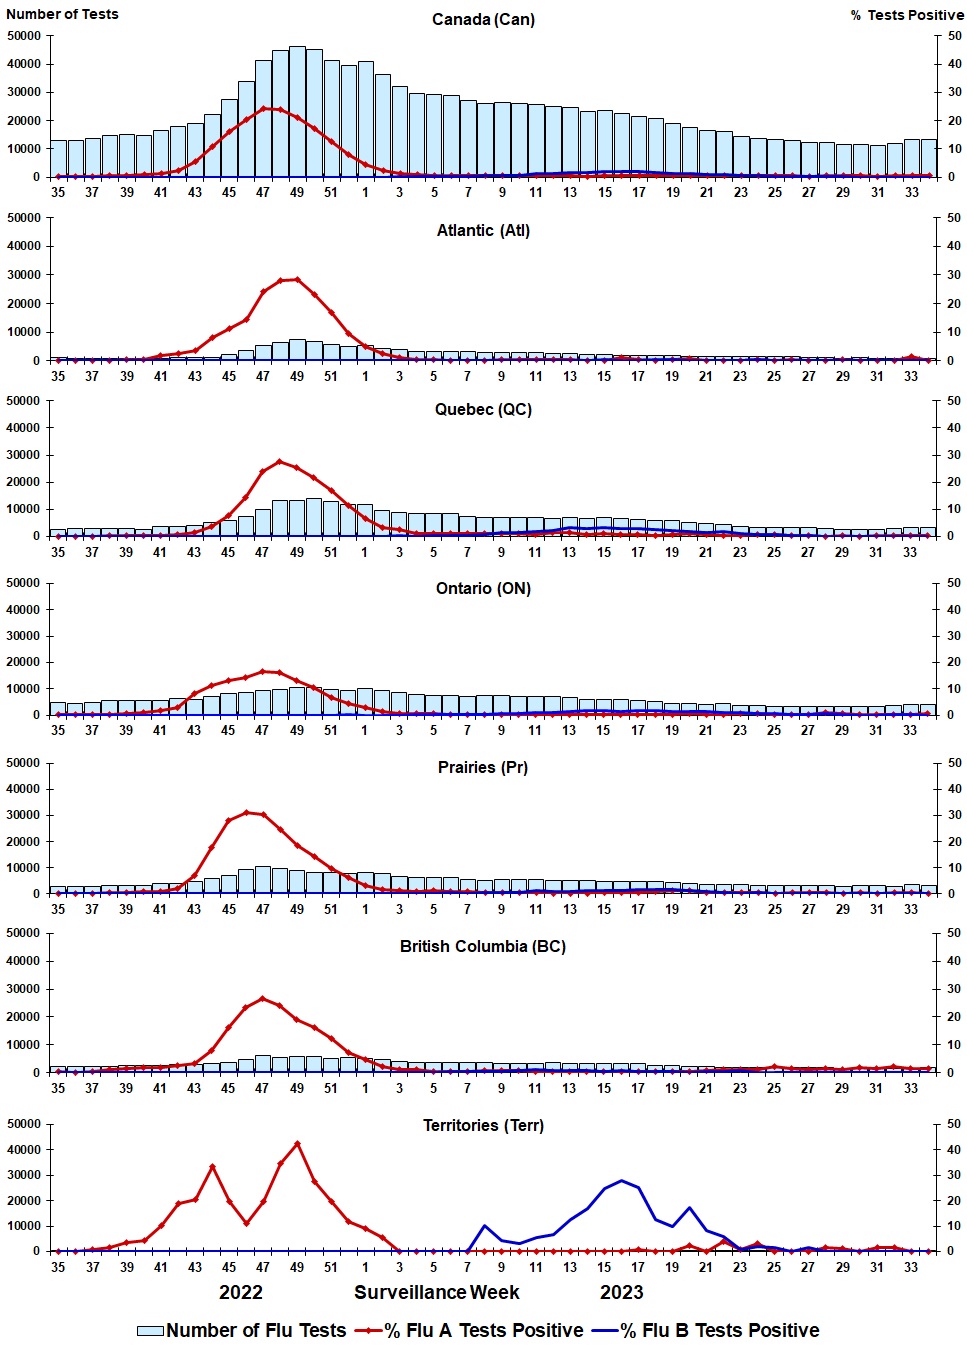
Figure 4: Positive influenza (Flu) tests (%) in Canada by region by surveillance week
| Week | Week end | Can Tests | Can A% | Can B% | Atl Tests | Atl A% | Atl B% | QC Tests | QC A% | QC B% | ON Tests | ON A% | ON B% | Pr Tests | Pr A% | Pr B% | BC Tests | BC A% | BC B% | Terr Tests | Terr A% | Terr B% |
|---|---|---|---|---|---|---|---|---|---|---|---|---|---|---|---|---|---|---|---|---|---|---|
| 35 | 2022-09-03 | 12769 | 0.18 | 0.02 | 932 | 0.11 | 0.11 | 2404 | 0.17 | 0.04 | 4663 | 0.11 | 0.00 | 2649 | 0.34 | 0.04 | 2006 | 0.20 | 0.00 | 115 | 0.00 | 0.00 |
| 36 | 2022-09-10 | 12637 | 0.14 | 0.04 | 906 | 0.00 | 0.00 | 2520 | 0.12 | 0.00 | 4411 | 0.16 | 0.02 | 2659 | 0.15 | 0.08 | 2055 | 0.19 | 0.10 | 86 | 0.00 | 0.00 |
| 37 | 2022-09-17 | 13539 | 0.24 | 0.01 | 854 | 0.12 | 0.00 | 2618 | 0.19 | 0.04 | 4801 | 0.31 | 0.02 | 2897 | 0.17 | 0.00 | 2247 | 0.22 | 0.00 | 122 | 0.82 | 0.00 |
| 38 | 2022-09-24 | 14521 | 0.48 | 0.02 | 788 | 0.13 | 0.00 | 2714 | 0.22 | 0.04 | 5515 | 0.38 | 0.00 | 3144 | 0.41 | 0.03 | 2226 | 1.21 | 0.04 | 134 | 1.49 | 0.00 |
| 39 | 2022-10-01 | 14943 | 0.68 | 0.03 | 688 | 0.29 | 0.15 | 2873 | 0.21 | 0.10 | 5624 | 0.66 | 0.02 | 3234 | 0.62 | 0.00 | 2411 | 1.33 | 0.00 | 113 | 3.54 | 0.00 |
| 40 | 2022-10-08 | 14585 | 0.99 | 0.03 | 818 | 0.24 | 0.00 | 2339 | 0.21 | 0.00 | 5676 | 1.02 | 0.05 | 3181 | 0.88 | 0.03 | 2430 | 1.85 | 0.00 | 141 | 4.26 | 0.00 |
| 41 | 2022-10-15 | 16307 | 1.44 | 0.01 | 776 | 1.68 | 0.00 | 3275 | 0.49 | 0.00 | 5761 | 1.89 | 0.00 | 3829 | 0.97 | 0.03 | 2540 | 1.85 | 0.00 | 126 | 10.32 | 0.00 |
| 42 | 2022-10-22 | 17826 | 2.39 | 0.05 | 1001 | 2.60 | 0.00 | 3608 | 0.86 | 0.03 | 6230 | 3.10 | 0.08 | 4101 | 2.12 | 0.02 | 2774 | 2.45 | 0.07 | 112 | 18.75 | 0.00 |
| 43 | 2022-10-29 | 18556 | 5.54 | 0.03 | 969 | 3.72 | 0.00 | 3821 | 1.41 | 0.08 | 6013 | 8.13 | 0.02 | 4567 | 6.90 | 0.00 | 3026 | 3.34 | 0.07 | 160 | 20.63 | 0.00 |
| 44 | 2022-11-05 | 21669 | 10.91 | 0.03 | 1209 | 8.02 | 0.00 | 4458 | 3.45 | 0.02 | 7006 | 11.28 | 0.04 | 5715 | 17.76 | 0.02 | 3111 | 8.07 | 0.06 | 170 | 33.53 | 0.00 |
| 45 | 2022-11-12 | 27004 | 16.20 | 0.04 | 2145 | 11.38 | 0.05 | 5731 | 7.47 | 0.07 | 8254 | 13.28 | 0.04 | 7204 | 27.94 | 0.03 | 3507 | 16.03 | 0.03 | 163 | 19.63 | 0.00 |
| 46 | 2022-11-19 | 33291 | 20.15 | 0.05 | 3433 | 14.54 | 0.00 | 6914 | 13.65 | 0.04 | 8727 | 14.32 | 0.07 | 9301 | 30.99 | 0.05 | 4741 | 23.52 | 0.04 | 175 | 10.86 | 0.00 |
| 47 | 2022-11-26 | 40370 | 24.06 | 0.04 | 5140 | 24.20 | 0.00 | 9252 | 22.84 | 0.06 | 9193 | 16.41 | 0.03 | 10338 | 30.32 | 0.01 | 6279 | 26.74 | 0.10 | 168 | 19.64 | 0.00 |
| 48 | 2022-12-03 | 44029 | 23.83 | 0.03 | 6393 | 27.94 | 0.02 | 12431 | 26.91 | 0.06 | 9930 | 16.05 | 0.02 | 9751 | 24.78 | 0.03 | 5334 | 24.07 | 0.00 | 190 | 34.74 | 0.00 |
| 49 | 2022-12-10 | 45446 | 20.95 | 0.06 | 7404 | 28.55 | 0.00 | 12616 | 25.12 | 0.13 | 10560 | 13.10 | 0.06 | 8800 | 18.65 | 0.02 | 5819 | 19.02 | 0.07 | 247 | 42.51 | 0.00 |
| 50 | 2022-12-17 | 44356 | 17.20 | 0.07 | 6554 | 23.25 | 0.00 | 13081 | 21.57 | 0.15 | 10525 | 10.56 | 0.02 | 8264 | 14.41 | 0.01 | 5731 | 16.18 | 0.10 | 201 | 27.36 | 0.00 |
| 51 | 2022-12-24 | 40210 | 12.50 | 0.05 | 5487 | 16.93 | 0.00 | 11742 | 17.27 | 0.09 | 9666 | 6.57 | 0.03 | 8008 | 9.67 | 0.01 | 5122 | 12.16 | 0.10 | 185 | 19.46 | 0.00 |
| 52 | 2022-12-31 | 38348 | 7.97 | 0.07 | 4924 | 9.36 | 0.00 | 10677 | 12.04 | 0.14 | 9370 | 4.30 | 0.09 | 7758 | 6.38 | 0.04 | 5477 | 7.23 | 0.04 | 142 | 11.97 | 0.00 |
| 1 | 2023-01-07 | 39868 | 4.59 | 0.07 | 5460 | 4.93 | 0.00 | 10659 | 6.90 | 0.14 | 10122 | 3.03 | 0.08 | 8311 | 3.22 | 0.00 | 5152 | 4.54 | 0.12 | 164 | 9.15 | 0.00 |
| 2 | 2023-01-14 | 35461 | 2.24 | 0.05 | 4291 | 2.47 | 0.02 | 8879 | 3.47 | 0.08 | 9531 | 1.29 | 0.08 | 7952 | 1.84 | 0.01 | 4646 | 2.17 | 0.02 | 162 | 5.56 | 0.00 |
| 3 | 2023-01-21 | 31232 | 1.39 | 0.14 | 3858 | 1.17 | 0.03 | 8035 | 2.50 | 0.25 | 8462 | 0.79 | 0.05 | 6806 | 1.16 | 0.25 | 3936 | 1.07 | 0.05 | 135 | 0.00 | 0.00 |
| 4 | 2023-01-28 | 28799 | 0.91 | 0.15 | 3184 | 0.44 | 0.03 | 7597 | 1.29 | 0.17 | 8022 | 0.57 | 0.15 | 6332 | 1.01 | 0.21 | 3571 | 1.09 | 0.08 | 93 | 0.00 | 0.00 |
| 5 | 2023-02-04 | 28377 | 0.75 | 0.28 | 3221 | 0.25 | 0.00 | 7614 | 1.06 | 0.56 | 7653 | 0.55 | 0.25 | 6261 | 1.12 | 0.24 | 3527 | 0.37 | 0.09 | 101 | 0.00 | 0.00 |
| 6 | 2023-02-11 | 27982 | 0.68 | 0.34 | 3116 | 0.10 | 0.03 | 7619 | 1.00 | 0.45 | 7451 | 0.44 | 0.31 | 6138 | 1.06 | 0.39 | 3538 | 0.40 | 0.34 | 120 | 0.00 | 0.00 |
| 7 | 2023-02-18 | 26289 | 0.55 | 0.29 | 3068 | 0.10 | 0.00 | 6834 | 0.91 | 0.45 | 7239 | 0.23 | 0.18 | 5621 | 0.87 | 0.30 | 3444 | 0.41 | 0.41 | 83 | 0.00 | 0.00 |
| 8 | 2023-02-25 | 25449 | 0.57 | 0.50 | 2864 | 0.07 | 0.03 | 6409 | 1.09 | 0.94 | 7307 | 0.23 | 0.33 | 5236 | 0.67 | 0.44 | 3545 | 0.62 | 0.28 | 88 | 0.00 | 10.23 |
| 9 | 2023-03-04 | 26136 | 0.63 | 0.70 | 2917 | 0.31 | 0.07 | 6757 | 1.11 | 1.42 | 7347 | 0.37 | 0.48 | 5626 | 0.48 | 0.46 | 3373 | 0.77 | 0.53 | 116 | 0.00 | 4.31 |
| 10 | 2023-03-11 | 25805 | 0.62 | 0.78 | 2949 | 0.31 | 0.03 | 6864 | 1.18 | 1.35 | 7129 | 0.28 | 0.70 | 5349 | 0.41 | 0.60 | 3413 | 0.82 | 0.64 | 101 | 0.00 | 2.97 |
| 11 | 2023-03-18 | 25613 | 0.52 | 1.16 | 2824 | 0.35 | 0.14 | 6927 | 0.90 | 1.82 | 6957 | 0.34 | 0.86 | 5382 | 0.37 | 1.26 | 3416 | 0.53 | 0.94 | 107 | 0.00 | 5.61 |
| 12 | 2023-03-25 | 24111 | 0.60 | 1.29 | 2665 | 0.41 | 0.19 | 5617 | 1.46 | 2.39 | 7066 | 0.24 | 1.16 | 5198 | 0.33 | 1.00 | 3444 | 0.49 | 0.87 | 121 | 0.00 | 6.61 |
| 13 | 2023-04-01 | 24352 | 0.64 | 1.74 | 2435 | 0.45 | 0.21 | 6887 | 1.47 | 3.44 | 6826 | 0.38 | 1.35 | 4959 | 0.22 | 1.11 | 3126 | 0.22 | 0.61 | 119 | 0.00 | 12.61 |
| 14 | 2023-04-08 | 22978 | 0.38 | 1.85 | 2099 | 0.10 | 0.19 | 6354 | 0.76 | 3.12 | 6082 | 0.23 | 1.66 | 5198 | 0.21 | 1.48 | 3114 | 0.39 | 0.74 | 131 | 0.00 | 16.79 |
| 15 | 2023-04-15 | 23421 | 0.60 | 1.93 | 2175 | 0.18 | 0.23 | 6913 | 1.27 | 3.31 | 6142 | 0.33 | 1.73 | 4918 | 0.37 | 1.40 | 3156 | 0.32 | 0.44 | 117 | 0.00 | 24.79 |
| 16 | 2023-04-22 | 22666 | 0.51 | 1.85 | 1928 | 1.09 | 0.10 | 6585 | 0.80 | 2.99 | 5961 | 0.29 | 1.41 | 4720 | 0.38 | 1.33 | 3293 | 0.21 | 0.73 | 179 | 0.00 | 27.93 |
| 17 | 2023-04-29 | 21493 | 0.48 | 1.83 | 1771 | 0.28 | 0.17 | 6155 | 0.70 | 2.79 | 5560 | 0.11 | 1.67 | 4595 | 0.67 | 1.87 | 3292 | 0.52 | 0.30 | 120 | 0.83 | 25.00 |
| 18 | 2023-05-06 | 20580 | 0.50 | 1.81 | 1775 | 0.17 | 0.28 | 6066 | 0.45 | 2.75 | 5250 | 0.25 | 1.81 | 4639 | 1.08 | 1.64 | 2701 | 0.37 | 0.41 | 149 | 0.00 | 12.75 |
| 19 | 2023-05-13 | 18936 | 0.66 | 1.46 | 1679 | 0.30 | 0.24 | 5732 | 0.66 | 2.08 | 4563 | 0.35 | 1.47 | 4393 | 1.34 | 1.55 | 2436 | 0.29 | 0.25 | 133 | 0.00 | 9.77 |
| 20 | 2023-05-20 | 17524 | 0.77 | 1.29 | 1623 | 0.62 | 0.18 | 5277 | 0.95 | 1.80 | 4619 | 0.50 | 1.45 | 3909 | 1.13 | 1.13 | 2010 | 0.30 | 0.10 | 86 | 2.33 | 17.44 |
| 21 | 2023-05-27 | 16495 | 0.51 | 1.13 | 1568 | 0.19 | 0.13 | 4895 | 0.65 | 1.59 | 4117 | 0.27 | 1.29 | 3752 | 0.64 | 0.96 | 2039 | 0.69 | 0.39 | 124 | 0.00 | 8.06 |
| 22 | 2023-06-03 | 16098 | 0.53 | 1.02 | 1504 | 0.00 | 0.07 | 4581 | 0.37 | 1.66 | 4283 | 0.40 | 1.19 | 3671 | 0.60 | 0.63 | 1907 | 1.21 | 0.21 | 152 | 3.95 | 5.92 |
| 23 | 2023-06-10 | 14412 | 0.62 | 0.69 | 1577 | 0.19 | 0.00 | 3699 | 0.49 | 1.05 | 3719 | 0.67 | 0.99 | 3533 | 0.59 | 0.34 | 1774 | 1.24 | 0.56 | 110 | 0.91 | 0.91 |
| 24 | 2023-06-17 | 13758 | 0.57 | 0.47 | 1496 | 0.27 | 0.27 | 3470 | 0.61 | 0.78 | 3614 | 0.47 | 0.50 | 3320 | 0.42 | 0.36 | 1759 | 1.14 | 0.11 | 99 | 3.03 | 2.02 |
| 25 | 2023-06-24 | 13253 | 0.60 | 0.35 | 1466 | 0.14 | 0.00 | 3340 | 0.63 | 0.57 | 3415 | 0.32 | 0.56 | 3225 | 0.28 | 0.16 | 1735 | 2.13 | 0.12 | 72 | 0.00 | 1.39 |
| 26 | 2023-07-01 | 13121 | 0.52 | 0.19 | 1320 | 0.23 | 0.00 | 3338 | 0.30 | 0.42 | 3403 | 0.24 | 0.21 | 3173 | 0.57 | 0.09 | 1817 | 1.60 | 0.06 | 70 | 0.00 | 0.00 |
| 27 | 2023-07-08 | 12397 | 0.40 | 0.19 | 1059 | 0.19 | 0.09 | 3218 | 0.19 | 0.22 | 3163 | 0.38 | 0.19 | 3127 | 0.42 | 0.26 | 1767 | 0.96 | 0.00 | 63 | 0.00 | 1.59 |
| 28 | 2023-07-15 | 12316 | 0.58 | 0.22 | 1053 | 0.09 | 0.00 | 3019 | 0.17 | 0.10 | 3411 | 0.91 | 0.47 | 3098 | 0.36 | 0.16 | 1669 | 1.38 | 0.18 | 66 | 1.52 | 0.00 |
| 29 | 2023-07-22 | 11589 | 0.45 | 0.09 | 915 | 0.33 | 0.00 | 2694 | 0.30 | 0.07 | 3435 | 0.55 | 0.17 | 3011 | 0.20 | 0.03 | 1446 | 1.04 | 0.07 | 88 | 1.14 | 0.00 |
| 30 | 2023-07-29 | 11590 | 0.45 | 0.04 | 964 | 0.10 | 0.00 | 2645 | 0.15 | 0.04 | 3356 | 0.27 | 0.06 | 3043 | 0.39 | 0.03 | 1513 | 1.72 | 0.07 | 69 | 0.00 | 0.00 |
| 31 | 2023-08-05 | 11369 | 0.38 | 0.08 | 856 | 0.00 | 0.12 | 2700 | 0.26 | 0.07 | 3299 | 0.18 | 0.06 | 3074 | 0.29 | 0.10 | 1383 | 1.45 | 0.07 | 57 | 1.75 | 0.00 |
| 32 | 2023-08-12 | 11798 | 0.64 | 0.06 | 870 | 0.00 | 0.00 | 2923 | 0.34 | 0.07 | 3540 | 0.34 | 0.11 | 2953 | 0.68 | 0.03 | 1452 | 2.27 | 0.00 | 60 | 1.67 | 0.00 |
| 33 | 2023-08-19 | 13162 | 0.56 | 0.08 | 901 | 1.33 | 0.00 | 3225 | 0.40 | 0.06 | 3941 | 0.38 | 0.15 | 3421 | 0.35 | 0.06 | 1624 | 1.35 | 0.06 | 50 | 0.00 | 0.00 |
| 34 | 2023-08-26 | 13226 | 0.50 | 0.05 | 905 | 0.00 | 0.00 | 3377 | 0.36 | 0.09 | 3949 | 0.66 | 0.03 | 3229 | 0.15 | 0.06 | 1706 | 1.35 | 0.00 | 60 | 0.00 | 0.00 |
Positive respiratory syncytial virus (RSV) tests
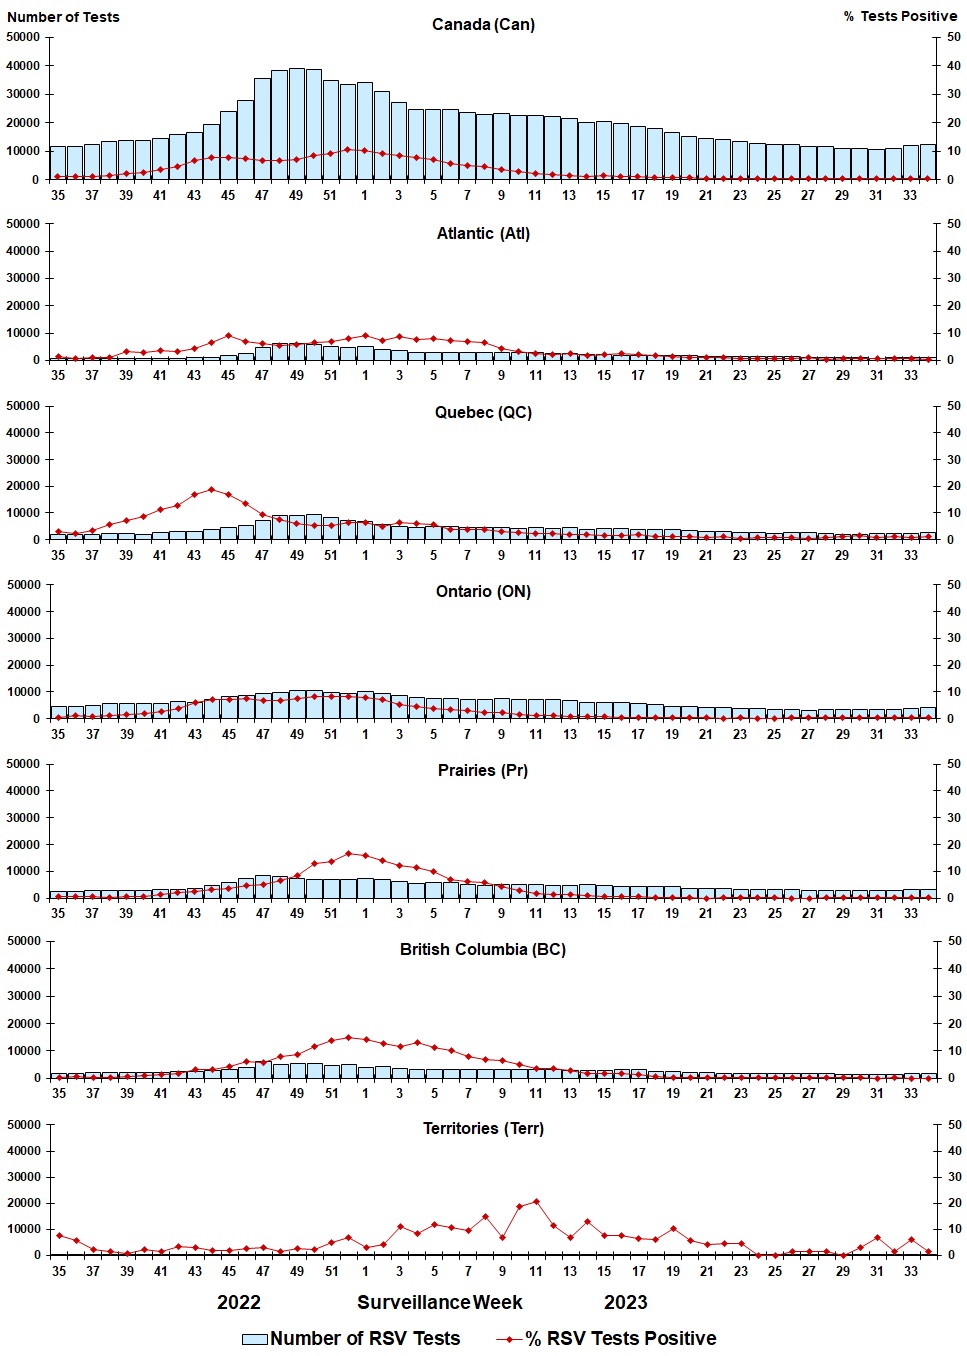
Figure 5: Positive respiratory syncytial virus (RSV) tests (%) in Canada by region by surveillance week
| Week | Week end | Can Tests | RSV% | Atl Tests | RSV% | QC Tests | RSV% | ON Tests | RSV% | Pr Tests | RSV% | BC Tests | RSV% | Terr Tests | RSV% |
|---|---|---|---|---|---|---|---|---|---|---|---|---|---|---|---|
| 35 | 2022-09-03 | 11585 | 1.14 | 832 | 1.44 | 1737 | 3.51 | 4663 | 0.54 | 2443 | 0.65 | 1795 | 0.50 | 115 | 7.83 |
| 36 | 2022-09-10 | 11442 | 1.12 | 785 | 0.64 | 1737 | 2.71 | 4411 | 1.00 | 2508 | 0.52 | 1915 | 0.73 | 86 | 5.81 |
| 37 | 2022-09-17 | 12331 | 1.05 | 721 | 0.97 | 1851 | 3.51 | 4801 | 0.60 | 2709 | 0.66 | 2127 | 0.38 | 122 | 2.46 |
| 38 | 2022-09-24 | 13335 | 1.40 | 707 | 1.13 | 1908 | 5.56 | 5515 | 0.98 | 2921 | 0.34 | 2150 | 0.33 | 134 | 1.49 |
| 39 | 2022-10-01 | 13629 | 2.11 | 556 | 3.06 | 2029 | 7.69 | 5623 | 1.35 | 2996 | 0.73 | 2312 | 0.65 | 113 | 0.88 |
| 40 | 2022-10-08 | 13346 | 2.44 | 677 | 2.95 | 1727 | 8.92 | 5675 | 1.92 | 2807 | 0.64 | 2319 | 0.95 | 141 | 2.13 |
| 41 | 2022-10-15 | 14337 | 3.52 | 695 | 3.45 | 2330 | 11.12 | 5761 | 2.46 | 3141 | 1.34 | 2284 | 1.53 | 126 | 1.59 |
| 42 | 2022-10-22 | 15783 | 4.56 | 799 | 3.38 | 2644 | 13.09 | 6230 | 3.60 | 3447 | 2.15 | 2551 | 1.72 | 112 | 3.57 |
| 43 | 2022-10-29 | 16274 | 6.59 | 929 | 4.20 | 2751 | 17.52 | 6010 | 6.09 | 3745 | 2.62 | 2680 | 3.10 | 159 | 3.14 |
| 44 | 2022-11-05 | 18915 | 7.63 | 964 | 6.64 | 3126 | 20.15 | 7006 | 7.09 | 4658 | 3.24 | 2993 | 3.31 | 168 | 1.79 |
| 45 | 2022-11-12 | 23546 | 7.54 | 1867 | 9.16 | 3986 | 16.88 | 8242 | 7.01 | 5898 | 3.49 | 3390 | 4.25 | 163 | 1.84 |
| 46 | 2022-11-19 | 27482 | 7.51 | 2538 | 6.82 | 4620 | 14.11 | 8721 | 7.41 | 7387 | 4.67 | 4041 | 5.99 | 175 | 2.86 |
| 47 | 2022-11-26 | 34682 | 6.65 | 4680 | 6.24 | 6170 | 9.98 | 9192 | 6.80 | 8329 | 5.01 | 6143 | 5.73 | 168 | 2.98 |
| 48 | 2022-12-03 | 37476 | 6.93 | 6110 | 5.35 | 8002 | 7.91 | 9926 | 6.85 | 8157 | 6.61 | 5091 | 8.15 | 190 | 1.58 |
| 49 | 2022-12-10 | 38234 | 7.36 | 6227 | 5.77 | 8206 | 6.37 | 10558 | 7.62 | 7504 | 8.49 | 5492 | 8.78 | 247 | 2.83 |
| 50 | 2022-12-17 | 37745 | 8.71 | 5921 | 6.67 | 8545 | 5.36 | 10522 | 8.33 | 7140 | 13.04 | 5416 | 11.48 | 201 | 2.49 |
| 51 | 2022-12-24 | 34329 | 9.26 | 4905 | 6.81 | 7661 | 5.33 | 9664 | 8.14 | 7114 | 13.66 | 4800 | 13.96 | 185 | 4.86 |
| 52 | 2022-12-31 | 32948 | 10.69 | 4669 | 7.90 | 6616 | 6.48 | 9370 | 8.19 | 7032 | 16.74 | 5119 | 15.06 | 142 | 7.04 |
| 1 | 2023-01-07 | 33446 | 10.40 | 5144 | 8.98 | 6335 | 6.46 | 10120 | 7.99 | 7536 | 15.96 | 4147 | 14.23 | 164 | 3.05 |
| 2 | 2023-01-14 | 30533 | 9.12 | 4078 | 7.41 | 5279 | 4.83 | 9531 | 7.09 | 7108 | 13.89 | 4375 | 12.75 | 162 | 4.32 |
| 3 | 2023-01-21 | 26624 | 8.47 | 3667 | 8.67 | 4553 | 6.50 | 8462 | 5.13 | 6065 | 12.38 | 3742 | 11.76 | 135 | 11.11 |
| 4 | 2023-01-28 | 24389 | 7.97 | 3037 | 7.74 | 4237 | 5.81 | 8022 | 4.62 | 5580 | 11.31 | 3420 | 13.25 | 93 | 8.60 |
| 5 | 2023-02-04 | 24100 | 7.18 | 2906 | 7.91 | 4304 | 5.72 | 7653 | 3.78 | 5758 | 10.04 | 3378 | 11.13 | 101 | 11.88 |
| 6 | 2023-02-11 | 24263 | 5.79 | 2953 | 7.42 | 4604 | 3.84 | 7451 | 3.21 | 5772 | 7.17 | 3363 | 10.20 | 120 | 10.83 |
| 7 | 2023-02-18 | 23026 | 5.13 | 2897 | 6.83 | 4209 | 3.64 | 7239 | 3.18 | 5299 | 6.30 | 3298 | 7.82 | 84 | 9.52 |
| 8 | 2023-02-25 | 22395 | 4.54 | 2721 | 6.43 | 4066 | 3.91 | 7307 | 2.29 | 4872 | 5.69 | 3341 | 6.76 | 88 | 14.77 |
| 9 | 2023-03-04 | 22965 | 3.73 | 2800 | 4.39 | 4224 | 3.10 | 7347 | 2.10 | 5274 | 4.29 | 3204 | 6.68 | 116 | 6.90 |
| 10 | 2023-03-11 | 22558 | 2.82 | 2843 | 3.13 | 4150 | 2.67 | 7130 | 1.40 | 5060 | 2.92 | 3274 | 5.19 | 101 | 18.81 |
| 11 | 2023-03-18 | 22373 | 2.20 | 2727 | 2.57 | 4216 | 2.21 | 6957 | 1.29 | 5084 | 1.89 | 3282 | 3.69 | 107 | 20.56 |
| 12 | 2023-03-25 | 21508 | 1.97 | 2598 | 2.27 | 3523 | 2.36 | 7065 | 1.13 | 4917 | 1.46 | 3284 | 3.53 | 121 | 11.57 |
| 13 | 2023-04-01 | 21203 | 1.64 | 2369 | 2.41 | 4251 | 1.88 | 6826 | 0.88 | 4693 | 1.26 | 2945 | 2.85 | 119 | 6.72 |
| 14 | 2023-04-08 | 20026 | 1.34 | 2088 | 1.92 | 3817 | 1.91 | 6082 | 0.64 | 4955 | 0.93 | 2953 | 1.79 | 131 | 12.98 |
| 15 | 2023-04-15 | 20156 | 1.41 | 2164 | 2.22 | 4170 | 1.77 | 6142 | 0.94 | 4653 | 0.84 | 2910 | 1.92 | 117 | 7.69 |
| 16 | 2023-04-22 | 19854 | 1.31 | 1942 | 2.57 | 4094 | 1.69 | 5961 | 0.57 | 4501 | 0.73 | 3177 | 1.89 | 179 | 7.82 |
| 17 | 2023-04-29 | 18841 | 1.14 | 1755 | 2.05 | 3925 | 1.91 | 5560 | 0.49 | 4355 | 0.62 | 3126 | 1.31 | 120 | 6.67 |
| 18 | 2023-05-06 | 18059 | 0.86 | 1771 | 1.92 | 3858 | 1.30 | 5250 | 0.50 | 4422 | 0.45 | 2609 | 0.65 | 149 | 6.04 |
| 19 | 2023-05-13 | 16607 | 0.72 | 1636 | 1.28 | 3609 | 1.08 | 4563 | 0.48 | 4232 | 0.28 | 2434 | 0.49 | 133 | 10.53 |
| 20 | 2023-05-20 | 15326 | 0.61 | 1617 | 1.11 | 3253 | 0.92 | 4619 | 0.54 | 3741 | 0.21 | 2010 | 0.40 | 86 | 5.81 |
| 21 | 2023-05-27 | 14441 | 0.40 | 1560 | 0.90 | 2991 | 0.67 | 4116 | 0.27 | 3615 | 0.08 | 2035 | 0.25 | 124 | 4.03 |
| 22 | 2023-06-03 | 14242 | 0.55 | 1500 | 1.00 | 2876 | 1.08 | 4283 | 0.16 | 3524 | 0.40 | 1907 | 0.26 | 152 | 4.61 |
| 23 | 2023-06-10 | 13314 | 0.41 | 1572 | 0.64 | 2733 | 0.55 | 3719 | 0.27 | 3407 | 0.23 | 1773 | 0.39 | 110 | 4.55 |
| 24 | 2023-06-17 | 12735 | 0.32 | 1490 | 0.54 | 2537 | 0.75 | 3613 | 0.14 | 3238 | 0.19 | 1758 | 0.17 | 99 | 0.00 |
| 25 | 2023-06-24 | 12283 | 0.34 | 1460 | 0.62 | 2451 | 0.69 | 3415 | 0.12 | 3151 | 0.13 | 1734 | 0.46 | 72 | 0.00 |
| 26 | 2023-07-01 | 12269 | 0.37 | 1317 | 0.68 | 2575 | 0.70 | 3403 | 0.38 | 3087 | 0.06 | 1817 | 0.17 | 70 | 1.43 |
| 27 | 2023-07-08 | 11619 | 0.33 | 1055 | 0.95 | 2533 | 0.51 | 3163 | 0.28 | 3038 | 0.07 | 1767 | 0.17 | 63 | 1.59 |
| 28 | 2023-07-15 | 11556 | 0.38 | 1050 | 0.19 | 2348 | 0.81 | 3410 | 0.38 | 3014 | 0.17 | 1668 | 0.24 | 66 | 1.52 |
| 29 | 2023-07-22 | 10904 | 0.48 | 913 | 0.55 | 2100 | 1.29 | 3430 | 0.38 | 2927 | 0.17 | 1446 | 0.14 | 88 | 0.00 |
| 30 | 2023-07-29 | 10924 | 0.48 | 956 | 0.63 | 2083 | 1.39 | 3355 | 0.27 | 2948 | 0.10 | 1513 | 0.20 | 69 | 2.90 |
| 31 | 2023-08-05 | 10735 | 0.48 | 850 | 0.71 | 2144 | 0.89 | 3297 | 0.30 | 3004 | 0.40 | 1383 | 0.00 | 57 | 7.02 |
| 32 | 2023-08-12 | 10965 | 0.55 | 867 | 0.58 | 2214 | 1.13 | 3540 | 0.56 | 2832 | 0.14 | 1452 | 0.34 | 60 | 1.67 |
| 33 | 2023-08-19 | 12182 | 0.43 | 889 | 0.67 | 2374 | 0.72 | 3941 | 0.48 | 3304 | 0.18 | 1624 | 0.06 | 50 | 6.00 |
| 34 | 2023-08-26 | 12310 | 0.51 | 893 | 0.34 | 2585 | 1.16 | 3949 | 0.48 | 3117 | 0.29 | 1706 | 0.06 | 60 | 1.67 |
Positive human parainfluenza virus (HPIV) tests
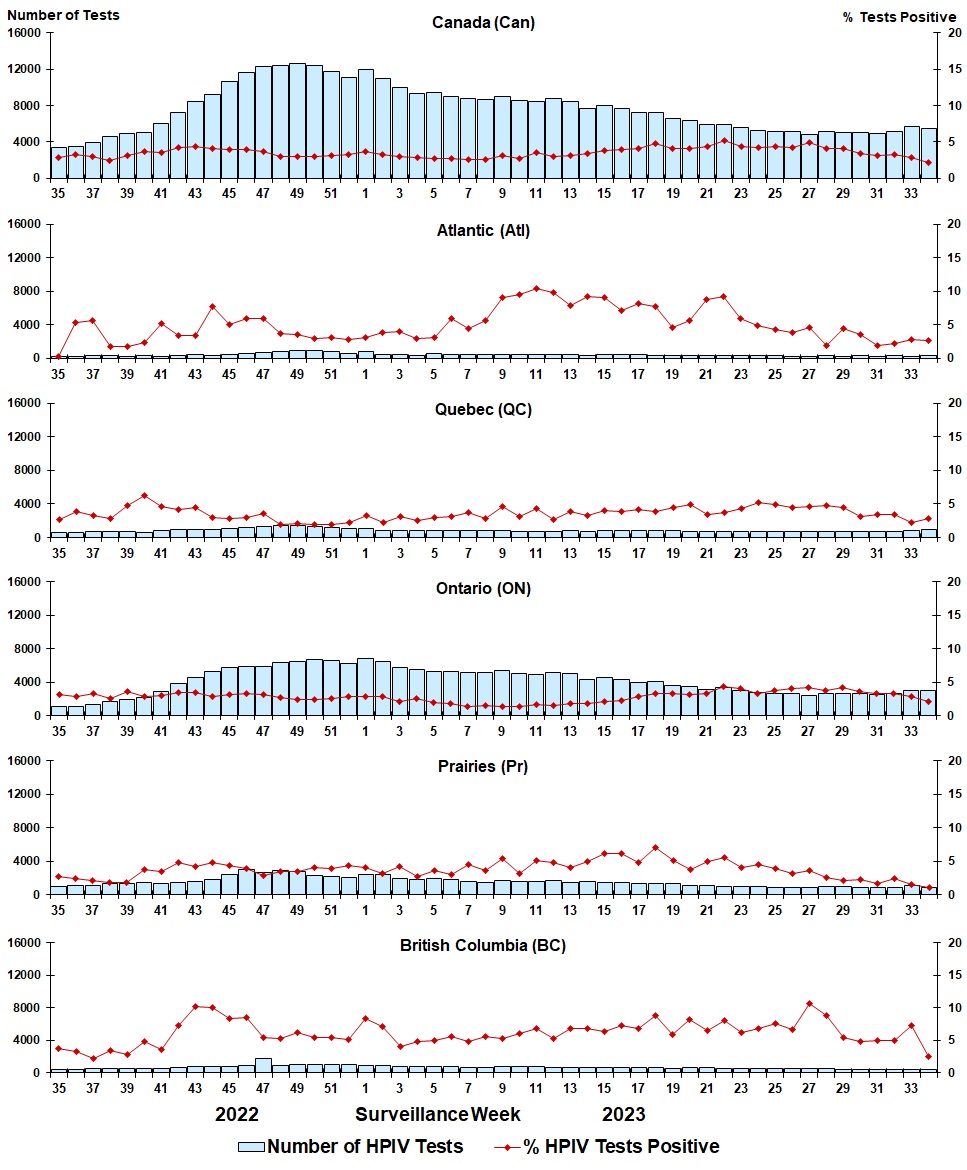
Figure 6: Positive human parainfluenza virus (HPIV) tests (%) in Canada by region by surveillance week
| Week | Week End | Can Tests | HPIV% | Atl Tests | HPIV% | QC Tests | HPIV% | ON Tests | HPIV% | Pr Tests | HPIV% | BC Tests | HPIV% |
|---|---|---|---|---|---|---|---|---|---|---|---|---|---|
| 35 | 2022-09-03 | 3433 | 2.80 | 294 | 0.34 | 619 | 2.75 | 1151 | 3.21 | 967 | 2.69 | 402 | 3.73 |
| 36 | 2022-09-10 | 3454 | 3.21 | 280 | 5.36 | 646 | 3.87 | 1081 | 2.96 | 1025 | 2.44 | 422 | 3.32 |
| 37 | 2022-09-17 | 3973 | 3.02 | 301 | 5.65 | 661 | 3.33 | 1368 | 3.36 | 1112 | 2.07 | 530 | 2.26 |
| 38 | 2022-09-24 | 4589 | 2.40 | 334 | 1.80 | 717 | 2.65 | 1717 | 2.56 | 1274 | 1.73 | 547 | 3.47 |
| 39 | 2022-10-01 | 4878 | 3.10 | 286 | 1.75 | 728 | 4.81 | 1999 | 3.60 | 1327 | 1.81 | 538 | 2.79 |
| 40 | 2022-10-08 | 5057 | 3.70 | 298 | 2.35 | 578 | 6.40 | 2228 | 2.92 | 1386 | 3.68 | 567 | 4.76 |
| 41 | 2022-10-15 | 5998 | 3.52 | 265 | 5.28 | 851 | 4.70 | 2960 | 3.04 | 1323 | 3.40 | 599 | 3.67 |
| 42 | 2022-10-22 | 7244 | 4.21 | 354 | 3.39 | 904 | 4.09 | 3859 | 3.55 | 1420 | 4.72 | 707 | 7.36 |
| 43 | 2022-10-29 | 8429 | 4.41 | 441 | 3.40 | 944 | 4.45 | 4632 | 3.52 | 1572 | 4.20 | 839 | 10.25 |
| 44 | 2022-11-05 | 9258 | 4.14 | 362 | 7.73 | 974 | 2.98 | 5243 | 2.96 | 1857 | 4.79 | 822 | 9.98 |
| 45 | 2022-11-12 | 10628 | 3.90 | 458 | 5.02 | 1103 | 2.81 | 5832 | 3.24 | 2451 | 4.28 | 783 | 8.43 |
| 46 | 2022-11-19 | 11671 | 3.97 | 575 | 5.91 | 1243 | 3.06 | 5943 | 3.30 | 2973 | 3.87 | 937 | 8.54 |
| 47 | 2022-11-26 | 12299 | 3.63 | 677 | 5.91 | 1319 | 3.64 | 5937 | 3.17 | 2644 | 2.91 | 1722 | 5.46 |
| 48 | 2022-12-03 | 12364 | 3.04 | 808 | 3.71 | 1439 | 1.88 | 6344 | 2.70 | 2817 | 3.48 | 956 | 5.23 |
| 49 | 2022-12-10 | 12670 | 3.03 | 962 | 3.64 | 1438 | 2.09 | 6470 | 2.43 | 2710 | 3.51 | 1090 | 6.15 |
| 50 | 2022-12-17 | 12356 | 2.98 | 988 | 2.94 | 1350 | 1.93 | 6718 | 2.44 | 2231 | 4.03 | 1069 | 5.52 |
| 51 | 2022-12-24 | 11701 | 3.09 | 783 | 3.19 | 1147 | 2.01 | 6638 | 2.65 | 2147 | 3.91 | 986 | 5.38 |
| 52 | 2022-12-31 | 11030 | 3.32 | 638 | 2.82 | 1016 | 2.17 | 6308 | 2.92 | 2063 | 4.36 | 1005 | 5.17 |
| 1 | 2023-01-07 | 11997 | 3.63 | 802 | 3.12 | 1017 | 3.24 | 6863 | 2.93 | 2351 | 4.08 | 964 | 8.30 |
| 2 | 2023-01-14 | 11015 | 3.24 | 526 | 3.80 | 828 | 2.17 | 6446 | 2.82 | 2351 | 3.19 | 864 | 7.18 |
| 3 | 2023-01-21 | 9972 | 2.92 | 498 | 4.02 | 849 | 3.06 | 5818 | 2.20 | 1971 | 4.21 | 836 | 4.07 |
| 4 | 2023-01-28 | 9363 | 2.78 | 413 | 2.91 | 813 | 2.58 | 5596 | 2.52 | 1761 | 2.73 | 780 | 4.87 |
| 5 | 2023-02-04 | 9383 | 2.70 | 596 | 3.19 | 788 | 3.05 | 5337 | 1.93 | 1870 | 3.58 | 792 | 5.05 |
| 6 | 2023-02-11 | 9047 | 2.67 | 420 | 5.95 | 816 | 3.19 | 5274 | 1.80 | 1767 | 3.00 | 770 | 5.58 |
| 7 | 2023-02-18 | 8811 | 2.63 | 449 | 4.45 | 860 | 3.72 | 5232 | 1.43 | 1542 | 4.54 | 728 | 4.81 |
| 8 | 2023-02-25 | 8628 | 2.55 | 421 | 5.70 | 795 | 2.77 | 5230 | 1.55 | 1481 | 3.65 | 701 | 5.56 |
| 9 | 2023-03-04 | 9020 | 3.06 | 421 | 9.03 | 788 | 4.44 | 5409 | 1.37 | 1641 | 5.42 | 761 | 5.26 |
| 10 | 2023-03-11 | 8553 | 2.77 | 472 | 9.53 | 766 | 3.13 | 5019 | 1.45 | 1542 | 3.18 | 754 | 6.10 |
| 11 | 2023-03-18 | 8476 | 3.48 | 428 | 10.51 | 764 | 4.32 | 4991 | 1.74 | 1525 | 5.11 | 768 | 6.77 |
| 12 | 2023-03-25 | 8626 | 2.98 | 456 | 9.87 | 641 | 2.65 | 5162 | 1.53 | 1633 | 4.72 | 734 | 5.31 |
| 13 | 2023-04-01 | 8443 | 3.17 | 467 | 7.92 | 789 | 3.80 | 5061 | 1.90 | 1484 | 4.11 | 642 | 6.85 |
| 14 | 2023-04-08 | 7692 | 3.45 | 399 | 9.27 | 731 | 3.28 | 4346 | 1.84 | 1517 | 5.01 | 699 | 6.87 |
| 15 | 2023-04-15 | 8023 | 3.83 | 482 | 9.13 | 825 | 4.00 | 4592 | 2.16 | 1446 | 6.09 | 678 | 6.34 |
| 16 | 2023-04-22 | 7629 | 3.89 | 450 | 7.11 | 821 | 3.90 | 4321 | 2.31 | 1385 | 6.21 | 652 | 7.21 |
| 17 | 2023-04-29 | 7257 | 4.07 | 443 | 8.13 | 802 | 4.11 | 4032 | 2.90 | 1289 | 4.81 | 691 | 6.80 |
| 18 | 2023-05-06 | 7234 | 4.84 | 390 | 7.69 | 806 | 3.85 | 4052 | 3.38 | 1352 | 7.10 | 634 | 8.83 |
| 19 | 2023-05-13 | 6623 | 4.09 | 342 | 4.68 | 802 | 4.36 | 3592 | 3.31 | 1288 | 5.12 | 599 | 5.84 |
| 20 | 2023-05-20 | 6356 | 4.12 | 367 | 5.72 | 723 | 4.84 | 3546 | 3.19 | 1084 | 3.78 | 636 | 8.18 |
| 21 | 2023-05-27 | 5885 | 4.33 | 378 | 8.73 | 712 | 3.37 | 3131 | 3.39 | 1047 | 4.97 | 617 | 6.48 |
| 22 | 2023-06-03 | 5933 | 5.12 | 305 | 9.18 | 739 | 3.79 | 3325 | 4.42 | 966 | 5.49 | 598 | 8.03 |
| 23 | 2023-06-10 | 5590 | 4.42 | 332 | 6.02 | 712 | 4.35 | 2983 | 4.06 | 1010 | 4.06 | 553 | 6.15 |
| 24 | 2023-06-17 | 5284 | 4.26 | 323 | 4.95 | 708 | 5.23 | 2764 | 3.36 | 943 | 4.45 | 546 | 6.78 |
| 25 | 2023-06-24 | 5107 | 4.37 | 329 | 4.26 | 723 | 4.84 | 2673 | 3.74 | 844 | 3.91 | 538 | 7.62 |
| 26 | 2023-07-01 | 5097 | 4.22 | 281 | 3.91 | 731 | 4.51 | 2716 | 4.05 | 857 | 3.15 | 512 | 6.64 |
| 27 | 2023-07-08 | 4812 | 4.90 | 278 | 4.68 | 714 | 4.62 | 2435 | 4.27 | 879 | 3.64 | 506 | 10.67 |
| 28 | 2023-07-15 | 5134 | 4.09 | 306 | 1.96 | 704 | 4.83 | 2716 | 3.79 | 907 | 2.54 | 501 | 8.78 |
| 29 | 2023-07-22 | 5045 | 4.04 | 268 | 4.48 | 705 | 4.40 | 2672 | 4.30 | 925 | 2.16 | 475 | 5.47 |
| 30 | 2023-07-29 | 5045 | 3.43 | 308 | 3.57 | 753 | 3.19 | 2624 | 3.62 | 878 | 2.28 | 482 | 4.77 |
| 31 | 2023-08-05 | 4903 | 3.14 | 264 | 1.89 | 696 | 3.45 | 2573 | 3.34 | 896 | 1.67 | 474 | 5.06 |
| 32 | 2023-08-12 | 5116 | 3.28 | 324 | 2.16 | 768 | 3.39 | 2711 | 3.36 | 851 | 2.47 | 462 | 4.98 |
| 33 | 2023-08-19 | 5644 | 2.91 | 286 | 2.80 | 807 | 2.23 | 3029 | 2.87 | 1039 | 1.54 | 483 | 7.25 |
| 34 | 2023-08-26 | 5480 | 2.15 | 296 | 2.70 | 898 | 2.90 | 2981 | 2.11 | 836 | 1.08 | 469 | 2.56 |
Positive adenovirus (ADV) tests
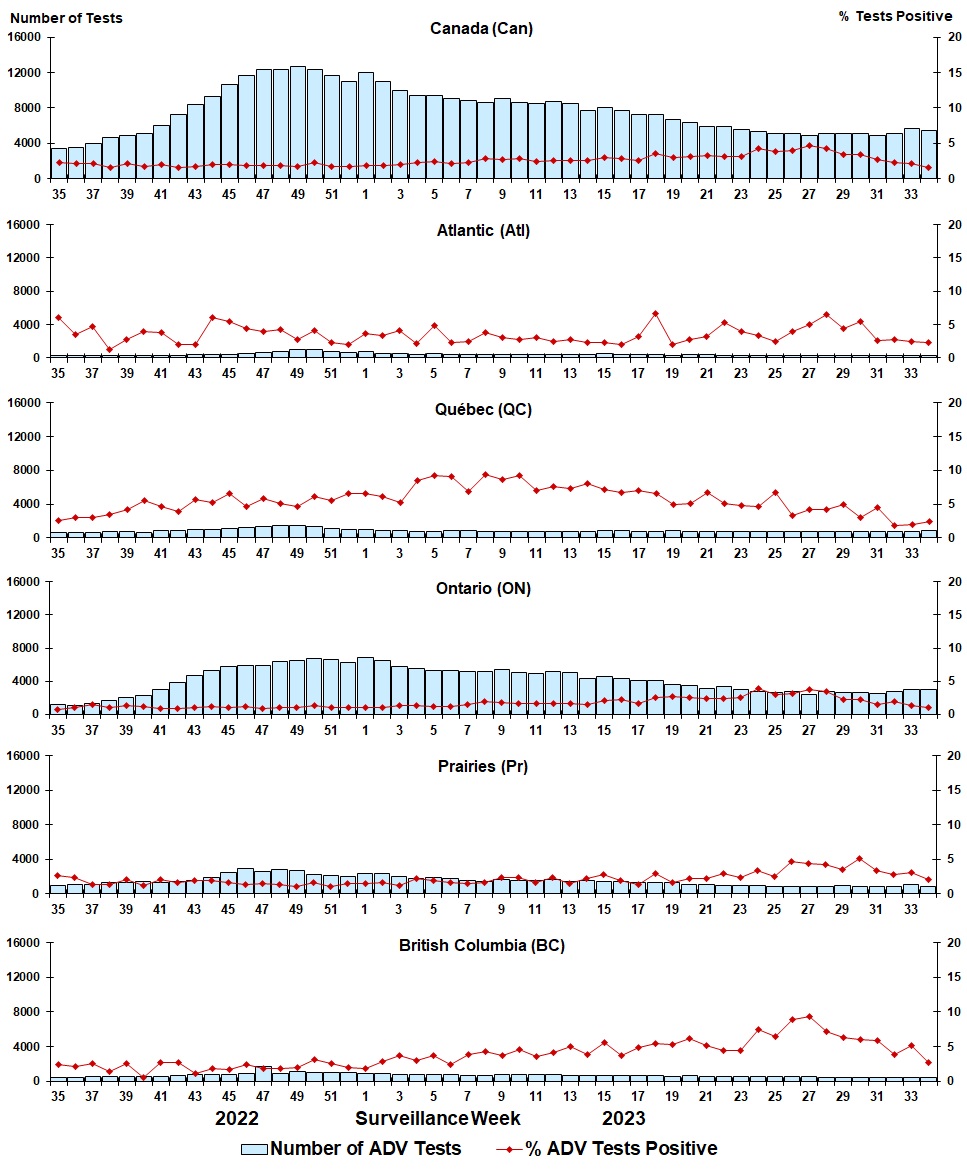
Figure 7: Positive adenovirus (ADV) tests (%) in Canada by region by surveillance week
| Week | Week End | Can Tests | ADV% | Atl Tests | ADV% | QC Tests | ADV% | ON Tests | ADV% | Pr Tests | ADV% | BC Tests | ADV% |
|---|---|---|---|---|---|---|---|---|---|---|---|---|---|
| 35 | 2022-09-03 | 3472 | 2.28 | 294 | 6.12 | 632 | 2.53 | 1179 | 0.76 | 965 | 2.69 | 402 | 2.49 |
| 36 | 2022-09-10 | 3478 | 2.19 | 280 | 3.57 | 659 | 3.03 | 1089 | 1.10 | 1028 | 2.43 | 422 | 2.13 |
| 37 | 2022-09-17 | 3991 | 2.10 | 301 | 4.65 | 679 | 3.09 | 1369 | 1.46 | 1111 | 1.35 | 530 | 2.64 |
| 38 | 2022-09-24 | 4604 | 1.59 | 334 | 1.20 | 731 | 3.42 | 1717 | 1.05 | 1275 | 1.41 | 547 | 1.46 |
| 39 | 2022-10-01 | 4894 | 2.21 | 286 | 2.80 | 742 | 4.18 | 2001 | 1.35 | 1327 | 2.11 | 538 | 2.60 |
| 40 | 2022-10-08 | 5068 | 1.80 | 298 | 4.03 | 583 | 5.66 | 2234 | 1.16 | 1386 | 1.23 | 567 | 0.53 |
| 41 | 2022-10-15 | 6013 | 2.03 | 265 | 3.77 | 864 | 4.63 | 2962 | 0.95 | 1323 | 2.12 | 599 | 2.67 |
| 42 | 2022-10-22 | 7255 | 1.67 | 354 | 1.98 | 915 | 4.04 | 3859 | 0.88 | 1420 | 1.69 | 707 | 2.69 |
| 43 | 2022-10-29 | 8441 | 1.79 | 441 | 2.04 | 955 | 5.76 | 4633 | 1.01 | 1572 | 1.97 | 839 | 1.07 |
| 44 | 2022-11-05 | 9271 | 2.02 | 362 | 6.08 | 987 | 5.27 | 5243 | 1.16 | 1857 | 1.99 | 822 | 1.82 |
| 45 | 2022-11-12 | 10610 | 1.99 | 458 | 5.46 | 1117 | 6.62 | 5800 | 1.03 | 2451 | 1.59 | 783 | 1.66 |
| 46 | 2022-11-19 | 11695 | 1.87 | 575 | 4.35 | 1265 | 4.66 | 5946 | 1.19 | 2972 | 1.38 | 937 | 2.45 |
| 47 | 2022-11-26 | 12290 | 1.89 | 677 | 3.99 | 1333 | 5.85 | 5937 | 0.94 | 2633 | 1.52 | 1710 | 1.81 |
| 48 | 2022-12-03 | 12381 | 1.87 | 808 | 4.33 | 1455 | 5.09 | 6344 | 1.04 | 2818 | 1.38 | 956 | 1.88 |
| 49 | 2022-12-10 | 12679 | 1.68 | 962 | 2.81 | 1450 | 4.69 | 6470 | 1.07 | 2707 | 1.00 | 1090 | 2.02 |
| 50 | 2022-12-17 | 12368 | 2.29 | 987 | 4.05 | 1364 | 6.16 | 6718 | 1.31 | 2230 | 1.70 | 1069 | 3.09 |
| 51 | 2022-12-24 | 11718 | 1.76 | 783 | 2.30 | 1161 | 5.51 | 6638 | 1.11 | 2150 | 1.12 | 986 | 2.64 |
| 52 | 2022-12-31 | 11030 | 1.80 | 638 | 2.04 | 1020 | 6.57 | 6308 | 1.08 | 2059 | 1.51 | 1005 | 1.99 |
| 1 | 2023-01-07 | 12009 | 1.88 | 802 | 3.74 | 1027 | 6.52 | 6865 | 1.12 | 2351 | 1.45 | 964 | 1.87 |
| 2 | 2023-01-14 | 11023 | 1.87 | 526 | 3.42 | 838 | 6.21 | 6446 | 1.12 | 2349 | 1.66 | 864 | 2.89 |
| 3 | 2023-01-21 | 9991 | 1.97 | 502 | 4.18 | 865 | 5.32 | 5818 | 1.31 | 1970 | 1.17 | 836 | 3.71 |
| 4 | 2023-01-28 | 9374 | 2.35 | 413 | 2.18 | 823 | 8.51 | 5596 | 1.39 | 1762 | 2.27 | 780 | 2.95 |
| 5 | 2023-02-04 | 9398 | 2.44 | 596 | 4.87 | 804 | 9.20 | 5337 | 1.14 | 1869 | 1.93 | 792 | 3.66 |
| 6 | 2023-02-11 | 9060 | 2.14 | 420 | 2.38 | 830 | 9.16 | 5274 | 1.14 | 1766 | 1.64 | 770 | 2.47 |
| 7 | 2023-02-18 | 8824 | 2.31 | 449 | 2.45 | 872 | 6.88 | 5233 | 1.55 | 1542 | 1.56 | 728 | 3.85 |
| 8 | 2023-02-25 | 8647 | 2.86 | 424 | 3.77 | 812 | 9.48 | 5230 | 1.91 | 1480 | 1.62 | 701 | 4.28 |
| 9 | 2023-03-04 | 9031 | 2.75 | 421 | 3.09 | 799 | 8.64 | 5409 | 1.85 | 1641 | 2.32 | 761 | 3.68 |
| 10 | 2023-03-11 | 8573 | 2.79 | 472 | 2.75 | 786 | 9.29 | 5019 | 1.61 | 1542 | 2.40 | 754 | 4.64 |
| 11 | 2023-03-18 | 8487 | 2.39 | 428 | 3.04 | 776 | 7.09 | 4991 | 1.62 | 1524 | 1.71 | 768 | 3.65 |
| 12 | 2023-03-25 | 8640 | 2.56 | 456 | 2.41 | 655 | 7.94 | 5162 | 1.72 | 1633 | 2.33 | 734 | 4.22 |
| 13 | 2023-04-01 | 8460 | 2.51 | 467 | 2.78 | 806 | 7.32 | 5061 | 1.70 | 1484 | 1.48 | 642 | 4.98 |
| 14 | 2023-04-08 | 7702 | 2.56 | 399 | 2.26 | 742 | 8.09 | 4346 | 1.56 | 1516 | 2.18 | 699 | 3.86 |
| 15 | 2023-04-15 | 8039 | 3.04 | 482 | 2.28 | 841 | 7.13 | 4592 | 2.05 | 1446 | 2.84 | 678 | 5.60 |
| 16 | 2023-04-22 | 7670 | 2.79 | 450 | 2.00 | 839 | 6.79 | 4322 | 2.22 | 1385 | 1.95 | 674 | 3.71 |
| 17 | 2023-04-29 | 7265 | 2.63 | 443 | 3.16 | 811 | 7.03 | 4032 | 1.69 | 1288 | 1.40 | 691 | 4.92 |
| 18 | 2023-05-06 | 7253 | 3.57 | 390 | 6.67 | 824 | 6.55 | 4052 | 2.59 | 1353 | 2.88 | 634 | 5.52 |
| 19 | 2023-05-13 | 6651 | 2.96 | 342 | 2.05 | 831 | 4.93 | 3592 | 2.67 | 1287 | 1.63 | 599 | 5.34 |
| 20 | 2023-05-20 | 6379 | 3.18 | 367 | 2.72 | 746 | 5.09 | 3546 | 2.59 | 1084 | 2.21 | 636 | 6.13 |
| 21 | 2023-05-27 | 5923 | 3.26 | 379 | 3.17 | 749 | 6.68 | 3131 | 2.43 | 1047 | 2.20 | 617 | 5.19 |
| 22 | 2023-06-03 | 5923 | 3.16 | 305 | 5.25 | 771 | 5.06 | 3325 | 2.38 | 966 | 2.90 | 556 | 4.50 |
| 23 | 2023-06-10 | 5616 | 3.10 | 332 | 3.92 | 738 | 4.88 | 2983 | 2.55 | 1010 | 2.38 | 553 | 4.52 |
| 24 | 2023-06-17 | 5307 | 4.24 | 323 | 3.41 | 731 | 4.65 | 2764 | 3.87 | 943 | 3.39 | 546 | 7.51 |
| 25 | 2023-06-24 | 5131 | 3.82 | 329 | 2.43 | 747 | 6.69 | 2673 | 3.07 | 844 | 2.49 | 538 | 6.51 |
| 26 | 2023-07-01 | 5122 | 4.04 | 281 | 3.91 | 757 | 3.30 | 2716 | 3.13 | 856 | 4.67 | 512 | 8.98 |
| 27 | 2023-07-08 | 4843 | 4.63 | 278 | 5.04 | 747 | 4.28 | 2435 | 3.82 | 877 | 4.33 | 506 | 9.29 |
| 28 | 2023-07-15 | 5156 | 4.27 | 306 | 6.54 | 726 | 4.41 | 2716 | 3.46 | 907 | 4.19 | 501 | 7.19 |
| 29 | 2023-07-22 | 5069 | 3.37 | 268 | 4.48 | 730 | 4.93 | 2672 | 2.25 | 924 | 3.57 | 475 | 6.32 |
| 30 | 2023-07-29 | 5076 | 3.45 | 308 | 5.52 | 784 | 3.06 | 2624 | 2.29 | 878 | 5.13 | 482 | 6.02 |
| 31 | 2023-08-05 | 4927 | 2.74 | 264 | 2.65 | 720 | 4.44 | 2573 | 1.48 | 896 | 3.35 | 474 | 5.91 |
| 32 | 2023-08-12 | 5131 | 2.30 | 324 | 2.78 | 784 | 1.79 | 2711 | 1.95 | 850 | 2.82 | 462 | 3.90 |
| 33 | 2023-08-19 | 5659 | 2.12 | 286 | 2.45 | 822 | 1.95 | 3029 | 1.32 | 1039 | 3.08 | 483 | 5.18 |
| 34 | 2023-08-26 | 5499 | 1.65 | 296 | 2.36 | 916 | 2.51 | 2982 | 1.01 | 836 | 2.15 | 469 | 2.77 |
Positive human metapneumovirus (HMPV) tests
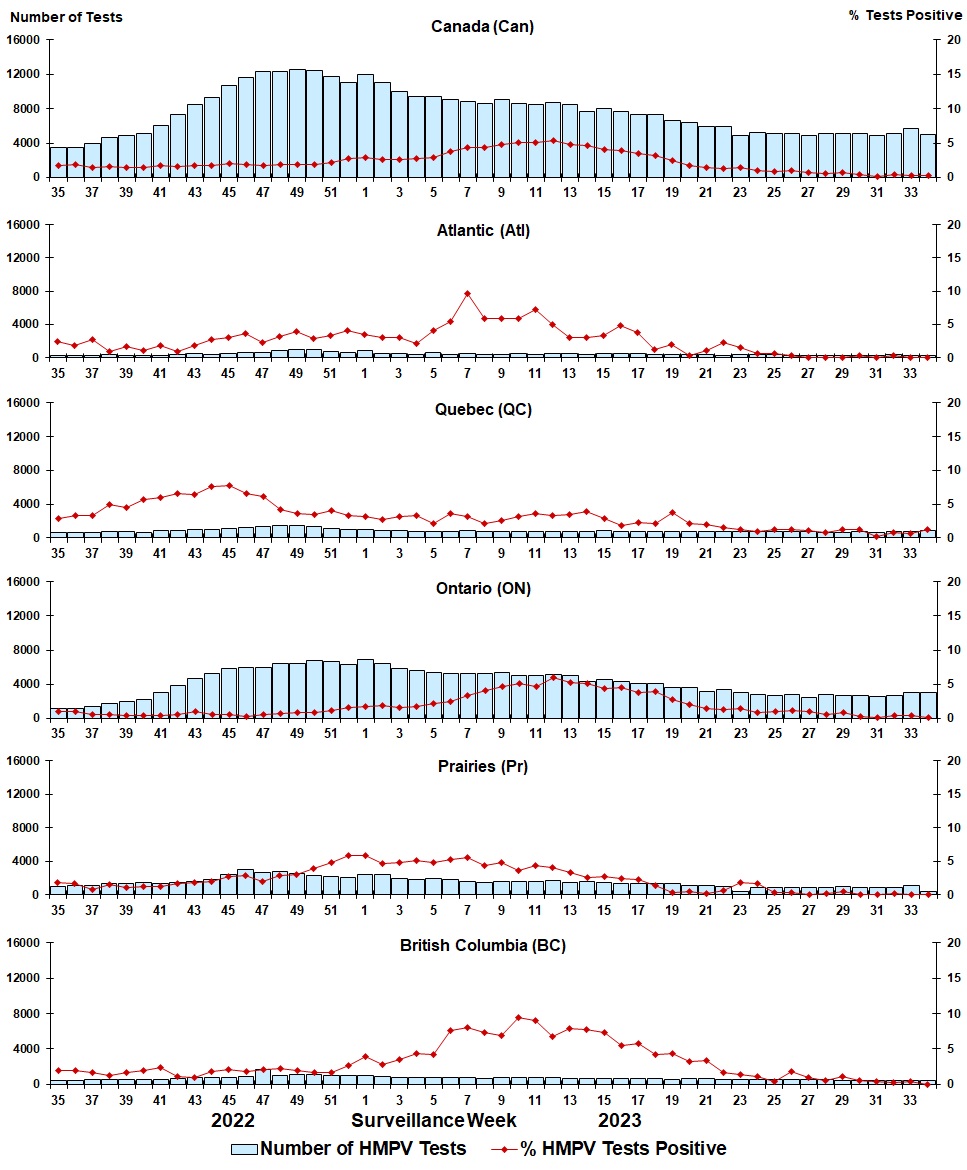
Figure 8: Positive human metapneumovirus (HMPV) tests (%) in Canada by region by surveillance week
| Week | Week End | Can Tests | HMPV% | Atl Tests | HMPV% | QC Tests | HMPV% | ON Tests | HMPV% | Pr Tests | HMPV% | BC Tests | HMPV% |
|---|---|---|---|---|---|---|---|---|---|---|---|---|---|
| 35 | 2022-09-03 | 3492 | 1.80 | 294 | 2.38 | 619 | 2.91 | 1179 | 0.93 | 998 | 1.90 | 402 | 1.99 |
| 36 | 2022-09-10 | 3489 | 1.81 | 280 | 1.79 | 649 | 3.39 | 1089 | 0.92 | 1049 | 1.72 | 422 | 1.90 |
| 37 | 2022-09-17 | 3992 | 1.38 | 301 | 2.66 | 665 | 3.31 | 1368 | 0.51 | 1127 | 0.80 | 530 | 1.70 |
| 38 | 2022-09-24 | 4603 | 1.61 | 334 | 0.90 | 723 | 4.98 | 1714 | 0.53 | 1285 | 1.48 | 547 | 1.28 |
| 39 | 2022-10-01 | 4895 | 1.43 | 286 | 1.75 | 729 | 4.53 | 2001 | 0.45 | 1341 | 1.04 | 538 | 1.67 |
| 40 | 2022-10-08 | 5096 | 1.43 | 298 | 1.01 | 581 | 5.34 | 2236 | 0.45 | 1414 | 1.27 | 567 | 1.94 |
| 41 | 2022-10-15 | 6027 | 1.66 | 265 | 1.89 | 857 | 6.07 | 2962 | 0.41 | 1344 | 1.26 | 599 | 2.34 |
| 42 | 2022-10-22 | 7277 | 1.59 | 354 | 0.85 | 911 | 6.70 | 3865 | 0.52 | 1440 | 1.67 | 707 | 1.13 |
| 43 | 2022-10-29 | 8450 | 1.78 | 441 | 1.81 | 960 | 6.35 | 4632 | 0.97 | 1577 | 1.78 | 839 | 0.95 |
| 44 | 2022-11-05 | 9271 | 1.79 | 362 | 2.76 | 977 | 7.57 | 5245 | 0.57 | 1865 | 1.98 | 822 | 1.82 |
| 45 | 2022-11-12 | 10656 | 2.06 | 458 | 3.06 | 1123 | 7.84 | 5838 | 0.57 | 2453 | 2.77 | 783 | 2.04 |
| 46 | 2022-11-19 | 11676 | 1.89 | 575 | 3.65 | 1247 | 6.58 | 5955 | 0.27 | 2962 | 2.87 | 937 | 1.81 |
| 47 | 2022-11-26 | 12281 | 1.78 | 677 | 2.22 | 1325 | 6.11 | 5951 | 0.55 | 2618 | 2.02 | 1710 | 2.16 |
| 48 | 2022-12-03 | 12376 | 1.86 | 808 | 3.22 | 1440 | 4.17 | 6360 | 0.64 | 2812 | 2.88 | 956 | 2.30 |
| 49 | 2022-12-10 | 12530 | 1.93 | 962 | 3.95 | 1439 | 3.61 | 6474 | 0.85 | 2565 | 2.96 | 1090 | 1.93 |
| 50 | 2022-12-17 | 12385 | 1.92 | 987 | 2.84 | 1350 | 3.48 | 6726 | 0.86 | 2253 | 3.86 | 1069 | 1.68 |
| 51 | 2022-12-24 | 11712 | 2.23 | 773 | 3.36 | 1152 | 4.08 | 6652 | 1.05 | 2149 | 4.75 | 986 | 1.62 |
| 52 | 2022-12-31 | 11053 | 2.75 | 638 | 4.08 | 1020 | 3.33 | 6330 | 1.50 | 2060 | 5.92 | 1005 | 2.69 |
| 1 | 2023-01-07 | 12016 | 2.94 | 802 | 3.49 | 1018 | 3.24 | 6871 | 1.67 | 2361 | 5.89 | 964 | 3.94 |
| 2 | 2023-01-14 | 11046 | 2.61 | 526 | 3.04 | 831 | 2.77 | 6464 | 1.79 | 2361 | 4.62 | 864 | 2.78 |
| 3 | 2023-01-21 | 10031 | 2.56 | 502 | 2.99 | 854 | 3.16 | 5849 | 1.54 | 1990 | 4.82 | 836 | 3.47 |
| 4 | 2023-01-28 | 9404 | 2.71 | 413 | 2.18 | 813 | 3.32 | 5631 | 1.69 | 1767 | 5.09 | 780 | 4.36 |
| 5 | 2023-02-04 | 9432 | 2.96 | 596 | 4.03 | 792 | 2.15 | 5367 | 2.11 | 1885 | 4.88 | 792 | 4.17 |
| 6 | 2023-02-11 | 9062 | 3.73 | 420 | 5.48 | 817 | 3.67 | 5291 | 2.51 | 1764 | 5.27 | 770 | 7.66 |
| 7 | 2023-02-18 | 8821 | 4.41 | 449 | 9.58 | 861 | 3.25 | 5234 | 3.31 | 1549 | 5.62 | 728 | 7.97 |
| 8 | 2023-02-25 | 8642 | 4.29 | 424 | 5.90 | 797 | 2.13 | 5232 | 4.05 | 1488 | 4.44 | 701 | 7.28 |
| 9 | 2023-03-04 | 9019 | 4.72 | 421 | 5.94 | 791 | 2.53 | 5408 | 4.60 | 1638 | 4.82 | 761 | 6.96 |
| 10 | 2023-03-11 | 8563 | 5.04 | 472 | 5.93 | 768 | 3.13 | 5023 | 5.02 | 1546 | 3.69 | 754 | 9.42 |
| 11 | 2023-03-18 | 8505 | 5.07 | 428 | 7.24 | 770 | 3.64 | 4994 | 4.71 | 1545 | 4.40 | 768 | 8.98 |
| 12 | 2023-03-25 | 8649 | 5.45 | 456 | 5.04 | 643 | 3.58 | 5167 | 5.98 | 1649 | 4.00 | 734 | 6.81 |
| 13 | 2023-04-01 | 8462 | 4.79 | 467 | 3.00 | 794 | 3.53 | 5062 | 5.18 | 1497 | 3.34 | 642 | 7.94 |
| 14 | 2023-04-08 | 7722 | 4.61 | 399 | 3.01 | 732 | 3.96 | 4352 | 5.08 | 1540 | 2.60 | 699 | 7.73 |
| 15 | 2023-04-15 | 8035 | 4.09 | 482 | 3.32 | 828 | 2.90 | 4591 | 4.36 | 1456 | 2.68 | 678 | 7.37 |
| 16 | 2023-04-22 | 7677 | 3.93 | 450 | 4.89 | 825 | 1.82 | 4325 | 4.49 | 1403 | 2.42 | 674 | 5.49 |
| 17 | 2023-04-29 | 7276 | 3.53 | 443 | 3.84 | 804 | 2.36 | 4036 | 3.77 | 1302 | 2.23 | 691 | 5.79 |
| 18 | 2023-05-06 | 7265 | 3.15 | 390 | 1.28 | 810 | 2.10 | 4053 | 3.95 | 1378 | 1.45 | 634 | 4.26 |
| 19 | 2023-05-13 | 6646 | 2.51 | 342 | 2.05 | 804 | 3.73 | 3595 | 2.78 | 1306 | 0.31 | 599 | 4.34 |
| 20 | 2023-05-20 | 6367 | 1.79 | 367 | 0.27 | 727 | 2.20 | 3545 | 2.00 | 1092 | 0.46 | 636 | 3.30 |
| 21 | 2023-05-27 | 5907 | 1.44 | 379 | 1.06 | 713 | 1.96 | 3136 | 1.40 | 1062 | 0.19 | 617 | 3.40 |
| 22 | 2023-06-03 | 5915 | 1.23 | 305 | 2.30 | 741 | 1.48 | 3327 | 1.20 | 986 | 0.61 | 556 | 1.62 |
| 23 | 2023-06-10 | 4911 | 1.41 | 332 | 1.51 | 710 | 1.27 | 2982 | 1.37 | 334 | 1.80 | 553 | 1.45 |
| 24 | 2023-06-17 | 5267 | 0.97 | 323 | 0.62 | 710 | 0.99 | 2765 | 0.76 | 923 | 1.63 | 546 | 1.10 |
| 25 | 2023-06-24 | 5134 | 0.82 | 329 | 0.61 | 723 | 1.24 | 2675 | 0.97 | 869 | 0.35 | 538 | 0.37 |
| 26 | 2023-07-01 | 5119 | 1.02 | 281 | 0.36 | 730 | 1.23 | 2718 | 1.10 | 878 | 0.34 | 512 | 1.76 |
| 27 | 2023-07-08 | 4839 | 0.76 | 278 | 0.00 | 713 | 1.12 | 2435 | 0.94 | 907 | 0.11 | 506 | 0.99 |
| 28 | 2023-07-15 | 5151 | 0.52 | 306 | 0.00 | 702 | 0.85 | 2719 | 0.59 | 923 | 0.22 | 501 | 0.60 |
| 29 | 2023-07-22 | 5066 | 0.75 | 268 | 0.00 | 704 | 1.28 | 2675 | 0.75 | 944 | 0.42 | 475 | 1.05 |
| 30 | 2023-07-29 | 5073 | 0.41 | 308 | 0.32 | 752 | 1.20 | 2627 | 0.30 | 904 | 0.00 | 482 | 0.62 |
| 31 | 2023-08-05 | 4922 | 0.18 | 264 | 0.00 | 695 | 0.29 | 2570 | 0.16 | 919 | 0.11 | 474 | 0.42 |
| 32 | 2023-08-12 | 5138 | 0.41 | 324 | 0.31 | 770 | 0.78 | 2714 | 0.41 | 868 | 0.23 | 462 | 0.22 |
| 33 | 2023-08-19 | 5660 | 0.34 | 286 | 0.00 | 807 | 0.62 | 3036 | 0.40 | 1048 | 0.00 | 483 | 0.41 |
| 34 | 2023-08-26 | 5006 | 0.30 | 296 | 0.00 | 897 | 1.23 | 2985 | 0.13 | 359 | 0.00 | 469 | 0.00 |
Positive enterovirus/rhinovirus (EV/RV) tests
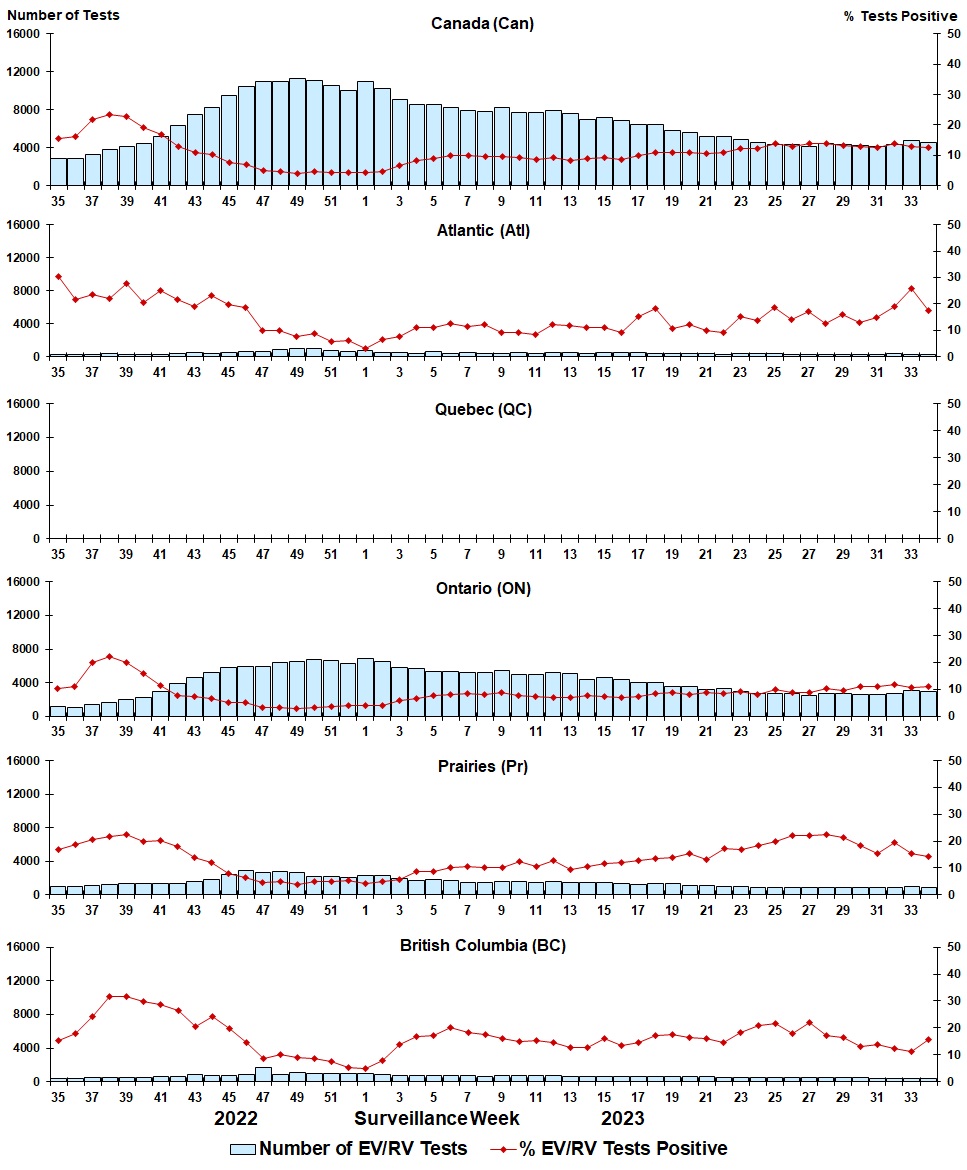
Figure 9: Positive enterovirus/rhinovirus (EV/RV) tests (%) in Canada by region by surveillance week
| Week | Week End | Can Tests | EV/RV% | Atl Tests | EV/RV% | QC Tests | EV/RV% | ON Tests | EV/RV% | Pr Tests | EV/RV% | BC Tests | EV/RV% |
|---|---|---|---|---|---|---|---|---|---|---|---|---|---|
| 35 | 2022-09-03 | 2845 | 15.47 | 294 | 30.27 | N.A. | N.A. | 1179 | 10.18 | 947 | 16.79 | 394 | 15.48 |
| 36 | 2022-09-10 | 2817 | 16.22 | 280 | 21.79 | N.A. | N.A. | 1089 | 11.20 | 1013 | 18.76 | 417 | 17.99 |
| 37 | 2022-09-17 | 3337 | 21.73 | 301 | 23.59 | N.A. | N.A. | 1368 | 20.10 | 1101 | 20.62 | 522 | 24.33 |
| 38 | 2022-09-24 | 3847 | 23.50 | 334 | 22.16 | N.A. | N.A. | 1689 | 22.20 | 1255 | 21.59 | 538 | 31.78 |
| 39 | 2022-10-01 | 4150 | 22.89 | 286 | 27.62 | N.A. | N.A. | 2001 | 19.94 | 1310 | 22.29 | 521 | 31.67 |
| 40 | 2022-10-08 | 4488 | 19.32 | 298 | 20.47 | N.A. | N.A. | 2235 | 15.84 | 1365 | 19.85 | 546 | 29.67 |
| 41 | 2022-10-15 | 5161 | 16.70 | 265 | 24.91 | N.A. | N.A. | 2963 | 11.51 | 1305 | 20.15 | 579 | 28.67 |
| 42 | 2022-10-22 | 6332 | 12.95 | 354 | 21.47 | N.A. | N.A. | 3863 | 7.77 | 1389 | 18.14 | 678 | 26.40 |
| 43 | 2022-10-29 | 7496 | 11.05 | 441 | 19.05 | N.A. | N.A. | 4632 | 7.38 | 1555 | 13.95 | 814 | 20.64 |
| 44 | 2022-11-05 | 8272 | 10.23 | 362 | 23.20 | N.A. | N.A. | 5245 | 6.43 | 1827 | 12.10 | 796 | 24.37 |
| 45 | 2022-11-12 | 9526 | 7.77 | 458 | 19.87 | N.A. | N.A. | 5837 | 4.99 | 2415 | 7.99 | 759 | 19.89 |
| 46 | 2022-11-19 | 10427 | 6.93 | 575 | 18.43 | N.A. | N.A. | 5952 | 4.96 | 2945 | 6.25 | 904 | 14.49 |
| 47 | 2022-11-26 | 10986 | 4.88 | 677 | 9.75 | N.A. | N.A. | 5927 | 3.36 | 2619 | 4.39 | 1678 | 8.70 |
| 48 | 2022-12-03 | 10959 | 4.74 | 808 | 9.78 | N.A. | N.A. | 6360 | 3.21 | 2787 | 4.81 | 931 | 10.20 |
| 49 | 2022-12-10 | 11309 | 4.09 | 962 | 7.59 | N.A. | N.A. | 6474 | 2.90 | 2693 | 3.64 | 1064 | 8.93 |
| 50 | 2022-12-17 | 11052 | 4.58 | 987 | 8.81 | N.A. | N.A. | 6726 | 3.20 | 2213 | 4.84 | 1038 | 8.67 |
| 51 | 2022-12-24 | 10580 | 4.49 | 783 | 5.75 | N.A. | N.A. | 6652 | 3.77 | 2125 | 4.89 | 956 | 7.53 |
| 52 | 2022-12-31 | 10049 | 4.50 | 638 | 6.11 | N.A. | N.A. | 6330 | 3.95 | 2047 | 5.23 | 972 | 5.25 |
| 1 | 2023-01-07 | 10998 | 4.19 | 802 | 3.12 | N.A. | N.A. | 6872 | 4.13 | 2336 | 4.32 | 937 | 5.02 |
| 2 | 2023-01-14 | 10199 | 4.71 | 526 | 6.65 | N.A. | N.A. | 6464 | 4.05 | 2327 | 4.86 | 832 | 7.81 |
| 3 | 2023-01-21 | 9133 | 6.68 | 502 | 7.57 | N.A. | N.A. | 5849 | 5.85 | 1945 | 5.86 | 807 | 13.88 |
| 4 | 2023-01-28 | 8568 | 8.22 | 413 | 11.14 | N.A. | N.A. | 5631 | 6.68 | 1747 | 8.70 | 754 | 16.84 |
| 5 | 2023-02-04 | 8581 | 8.94 | 596 | 11.07 | N.A. | N.A. | 5367 | 7.60 | 1827 | 8.65 | 764 | 17.15 |
| 6 | 2023-02-11 | 8243 | 9.97 | 420 | 12.62 | N.A. | N.A. | 5291 | 8.20 | 1748 | 10.30 | 740 | 20.00 |
| 7 | 2023-02-18 | 7927 | 9.87 | 449 | 11.58 | N.A. | N.A. | 5234 | 8.31 | 1517 | 10.61 | 707 | 18.39 |
| 8 | 2023-02-25 | 7812 | 9.55 | 424 | 12.03 | N.A. | N.A. | 5232 | 8.12 | 1463 | 10.25 | 671 | 17.44 |
| 9 | 2023-03-04 | 8218 | 9.77 | 421 | 9.26 | N.A. | N.A. | 5408 | 8.69 | 1621 | 10.30 | 736 | 16.03 |
| 10 | 2023-03-11 | 7758 | 9.42 | 472 | 9.32 | N.A. | N.A. | 5023 | 7.78 | 1521 | 12.29 | 714 | 14.85 |
| 11 | 2023-03-18 | 7677 | 8.77 | 428 | 8.41 | N.A. | N.A. | 4994 | 7.21 | 1491 | 10.60 | 740 | 15.27 |
| 12 | 2023-03-25 | 7973 | 9.31 | 456 | 12.06 | N.A. | N.A. | 5167 | 7.14 | 1619 | 12.91 | 710 | 14.65 |
| 13 | 2023-04-01 | 7640 | 8.35 | 467 | 11.78 | N.A. | N.A. | 5062 | 7.13 | 1474 | 9.43 | 620 | 12.90 |
| 14 | 2023-04-08 | 6941 | 8.95 | 399 | 11.03 | N.A. | N.A. | 4352 | 7.61 | 1494 | 10.44 | 672 | 12.65 |
| 15 | 2023-04-15 | 7171 | 9.16 | 482 | 11.00 | N.A. | N.A. | 4591 | 7.19 | 1427 | 11.70 | 658 | 16.11 |
| 16 | 2023-04-22 | 6819 | 8.67 | 450 | 9.33 | N.A. | N.A. | 4325 | 6.82 | 1375 | 11.93 | 649 | 13.41 |
| 17 | 2023-04-29 | 6436 | 9.88 | 443 | 15.12 | N.A. | N.A. | 4036 | 7.53 | 1271 | 12.90 | 671 | 14.61 |
| 18 | 2023-05-06 | 6416 | 10.97 | 390 | 18.21 | N.A. | N.A. | 4053 | 8.54 | 1342 | 13.41 | 615 | 17.24 |
| 19 | 2023-05-13 | 5821 | 11.03 | 342 | 10.53 | N.A. | N.A. | 3596 | 8.87 | 1287 | 13.99 | 578 | 17.65 |
| 20 | 2023-05-20 | 5629 | 10.82 | 367 | 11.99 | N.A. | N.A. | 3545 | 8.27 | 1084 | 15.50 | 621 | 16.59 |
| 21 | 2023-05-27 | 5169 | 10.68 | 379 | 10.03 | N.A. | N.A. | 3137 | 8.83 | 1044 | 13.12 | 596 | 16.11 |
| 22 | 2023-06-03 | 5152 | 10.83 | 305 | 9.18 | N.A. | N.A. | 3327 | 8.54 | 955 | 17.07 | 536 | 14.55 |
| 23 | 2023-06-10 | 4862 | 12.30 | 332 | 15.36 | N.A. | N.A. | 2982 | 9.32 | 994 | 16.90 | 532 | 18.23 |
| 24 | 2023-06-17 | 4542 | 12.22 | 323 | 13.62 | N.A. | N.A. | 2766 | 8.28 | 919 | 18.39 | 524 | 20.80 |
| 25 | 2023-06-24 | 4379 | 13.93 | 329 | 18.54 | N.A. | N.A. | 2675 | 9.91 | 835 | 19.88 | 525 | 21.71 |
| 26 | 2023-07-01 | 4350 | 12.97 | 281 | 14.23 | N.A. | N.A. | 2719 | 9.01 | 849 | 22.03 | 490 | 17.76 |
| 27 | 2023-07-08 | 4077 | 13.93 | 278 | 16.91 | N.A. | N.A. | 2435 | 8.91 | 871 | 22.16 | 485 | 22.06 |
| 28 | 2023-07-15 | 4402 | 13.74 | 306 | 12.42 | N.A. | N.A. | 2719 | 10.48 | 893 | 22.28 | 479 | 17.12 |
| 29 | 2023-07-22 | 4333 | 13.27 | 268 | 16.04 | N.A. | N.A. | 2675 | 9.57 | 913 | 21.36 | 462 | 16.45 |
| 30 | 2023-07-29 | 4278 | 13.02 | 308 | 12.99 | N.A. | N.A. | 2627 | 11.08 | 868 | 18.32 | 465 | 13.12 |
| 31 | 2023-08-05 | 4177 | 12.69 | 264 | 14.77 | N.A. | N.A. | 2570 | 11.17 | 879 | 15.36 | 455 | 13.85 |
| 32 | 2023-08-12 | 4346 | 13.94 | 324 | 19.14 | - | - | 2714 | 11.72 | 840 | 19.64 | 451 | 12.20 |
| 33 | 2023-08-19 | 4809 | 12.79 | 286 | 25.87 | - | - | 3036 | 10.87 | 1031 | 15.42 | 456 | 11.40 |
| 34 | 2023-08-26 | 4547 | 12.54 | 296 | 17.57 | - | - | 2984 | 11.13 | 830 | 14.10 | 437 | 15.79 |
Positive human coronavirus (HCoV) tests
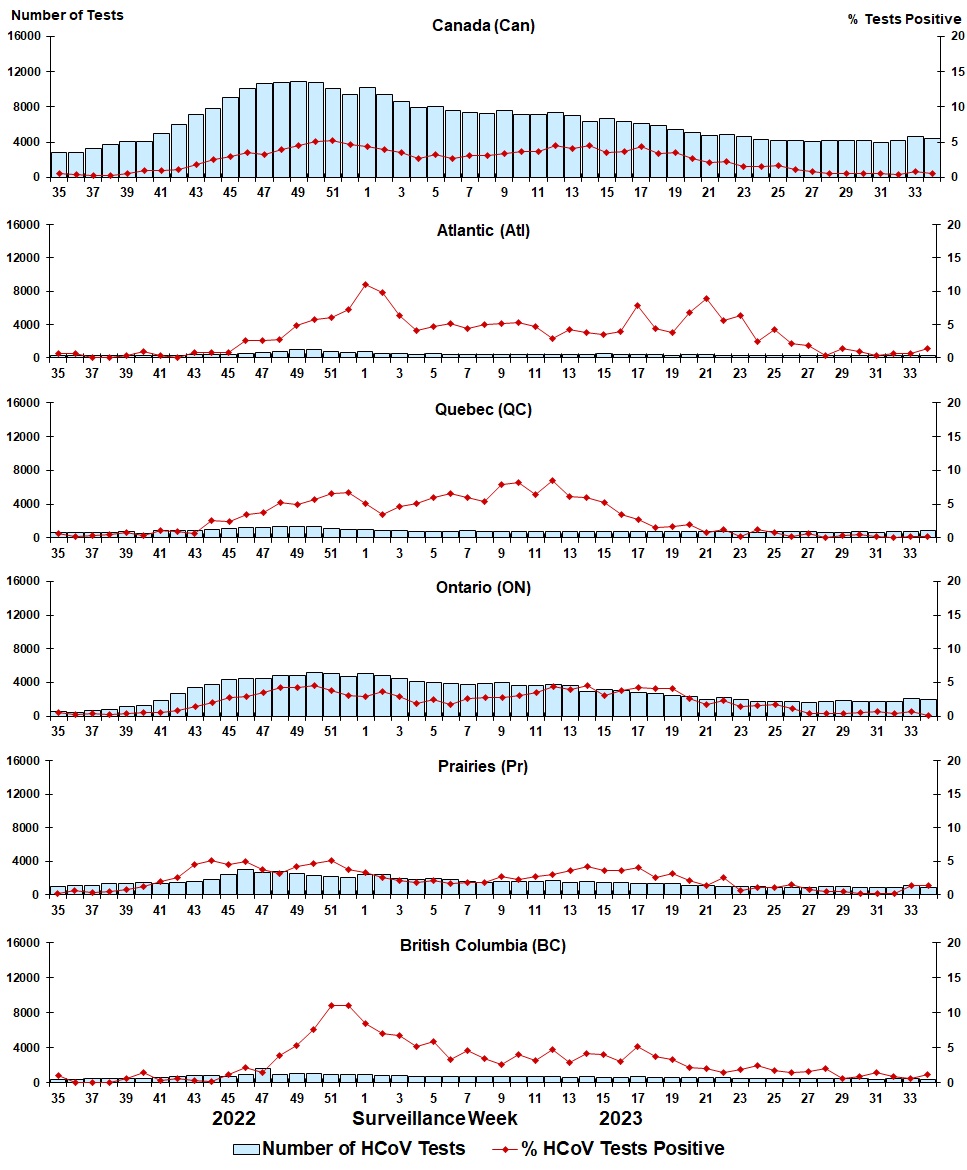
Figure 10: Positive human coronavirus (HCoV) tests (%) in Canada by region by surveillance week
| Week | Week End | Can Tests | HCoV% | Atl Tests | HCoV% | QC Tests | HCoV% | ON Tests | HCoV% | Pr Tests | HCoV% | BC Tests | HCoV% |
|---|---|---|---|---|---|---|---|---|---|---|---|---|---|
| 35 | 2022-09-03 | 2818 | 0.53 | 294 | 0.68 | 610 | 0.66 | 523 | 0.57 | 997 | 0.20 | 394 | 1.02 |
| 36 | 2022-09-10 | 2877 | 0.38 | 280 | 0.71 | 639 | 0.16 | 495 | 0.20 | 1046 | 0.67 | 417 | 0.00 |
| 37 | 2022-09-17 | 3264 | 0.28 | 301 | 0.00 | 654 | 0.31 | 658 | 0.46 | 1128 | 0.35 | 522 | 0.00 |
| 38 | 2022-09-24 | 3716 | 0.32 | 334 | 0.00 | 705 | 0.57 | 853 | 0.23 | 1286 | 0.47 | 538 | 0.00 |
| 39 | 2022-10-01 | 4034 | 0.59 | 286 | 0.35 | 716 | 0.84 | 1170 | 0.34 | 1341 | 0.75 | 521 | 0.58 |
| 40 | 2022-10-08 | 4079 | 0.93 | 298 | 1.01 | 568 | 0.35 | 1253 | 0.56 | 1414 | 1.27 | 546 | 1.47 |
| 41 | 2022-10-15 | 4922 | 1.00 | 265 | 0.38 | 842 | 1.07 | 1889 | 0.53 | 1347 | 2.00 | 579 | 0.35 |
| 42 | 2022-10-22 | 6026 | 1.16 | 354 | 0.00 | 884 | 1.02 | 2671 | 0.79 | 1439 | 2.50 | 678 | 0.59 |
| 43 | 2022-10-29 | 7155 | 1.86 | 386 | 0.78 | 922 | 0.65 | 3451 | 1.45 | 1581 | 4.49 | 814 | 0.37 |
| 44 | 2022-11-05 | 7767 | 2.54 | 362 | 0.83 | 943 | 2.55 | 3800 | 1.97 | 1866 | 5.04 | 796 | 0.13 |
| 45 | 2022-11-12 | 9087 | 3.00 | 458 | 0.87 | 1087 | 2.48 | 4325 | 2.80 | 2457 | 4.56 | 759 | 1.19 |
| 46 | 2022-11-19 | 10076 | 3.54 | 575 | 2.61 | 1193 | 3.52 | 4433 | 2.96 | 2971 | 5.02 | 904 | 2.21 |
| 47 | 2022-11-26 | 10690 | 3.24 | 677 | 2.66 | 1290 | 3.80 | 4433 | 3.50 | 2612 | 3.83 | 1678 | 1.43 |
| 48 | 2022-12-03 | 10723 | 3.94 | 808 | 2.72 | 1381 | 5.29 | 4788 | 4.24 | 2815 | 3.13 | 931 | 3.97 |
| 49 | 2022-12-10 | 10887 | 4.48 | 962 | 4.89 | 1415 | 5.02 | 4875 | 4.21 | 2571 | 4.24 | 1064 | 5.26 |
| 50 | 2022-12-17 | 10765 | 5.13 | 987 | 5.78 | 1350 | 5.63 | 5133 | 4.56 | 2257 | 4.70 | 1038 | 7.61 |
| 51 | 2022-12-24 | 10056 | 5.28 | 783 | 6.00 | 1147 | 6.63 | 5024 | 3.86 | 2149 | 5.07 | 953 | 11.02 |
| 52 | 2022-12-31 | 9437 | 4.73 | 638 | 7.21 | 1016 | 6.69 | 4746 | 3.08 | 2065 | 3.83 | 972 | 11.01 |
| 1 | 2023-01-07 | 10141 | 4.40 | 802 | 10.97 | 1017 | 5.11 | 5025 | 2.95 | 2360 | 3.35 | 937 | 8.43 |
| 2 | 2023-01-14 | 9360 | 4.01 | 526 | 9.89 | 829 | 3.50 | 4805 | 3.64 | 2368 | 2.53 | 832 | 7.09 |
| 3 | 2023-01-21 | 8614 | 3.46 | 502 | 6.37 | 849 | 4.71 | 4464 | 2.91 | 1992 | 2.06 | 807 | 6.82 |
| 4 | 2023-01-28 | 7905 | 2.63 | 413 | 4.12 | 813 | 5.17 | 4157 | 1.88 | 1768 | 1.81 | 754 | 5.17 |
| 5 | 2023-02-04 | 7997 | 3.20 | 596 | 4.70 | 788 | 5.96 | 3962 | 2.42 | 1887 | 2.12 | 764 | 5.89 |
| 6 | 2023-02-11 | 7619 | 2.64 | 420 | 5.24 | 816 | 6.62 | 3877 | 1.81 | 1766 | 1.70 | 740 | 3.38 |
| 7 | 2023-02-18 | 7381 | 3.14 | 449 | 4.45 | 860 | 5.93 | 3812 | 2.62 | 1553 | 1.80 | 707 | 4.67 |
| 8 | 2023-02-25 | 7223 | 3.06 | 424 | 4.95 | 795 | 5.28 | 3844 | 2.78 | 1489 | 1.88 | 671 | 3.43 |
| 9 | 2023-03-04 | 7544 | 3.41 | 421 | 5.23 | 788 | 7.99 | 3962 | 2.73 | 1637 | 2.75 | 736 | 2.58 |
| 10 | 2023-03-11 | 7115 | 3.70 | 472 | 5.30 | 766 | 8.09 | 3615 | 3.10 | 1548 | 2.26 | 714 | 4.06 |
| 11 | 2023-03-18 | 7116 | 3.70 | 428 | 4.67 | 764 | 6.41 | 3638 | 3.55 | 1546 | 2.65 | 740 | 3.24 |
| 12 | 2023-03-25 | 7212 | 4.53 | 456 | 2.85 | 642 | 9.66 | 3754 | 4.45 | 1650 | 3.09 | 710 | 4.79 |
| 13 | 2023-04-01 | 7010 | 4.04 | 467 | 4.28 | 789 | 6.08 | 3636 | 3.91 | 1498 | 3.67 | 620 | 2.90 |
| 14 | 2023-04-08 | 6318 | 4.51 | 399 | 3.76 | 731 | 6.02 | 2976 | 4.50 | 1540 | 4.16 | 672 | 4.17 |
| 15 | 2023-04-15 | 6632 | 3.56 | 482 | 3.53 | 825 | 5.21 | 3209 | 3.02 | 1458 | 3.57 | 658 | 4.10 |
| 16 | 2023-04-22 | 6369 | 3.64 | 450 | 4.00 | 821 | 3.41 | 3046 | 3.81 | 1403 | 3.56 | 649 | 3.08 |
| 17 | 2023-04-29 | 6056 | 4.36 | 443 | 7.90 | 802 | 2.74 | 2836 | 4.23 | 1304 | 3.99 | 671 | 5.22 |
| 18 | 2023-05-06 | 5940 | 3.42 | 390 | 4.36 | 806 | 1.49 | 2752 | 4.18 | 1377 | 2.61 | 615 | 3.74 |
| 19 | 2023-05-13 | 5486 | 3.46 | 342 | 3.80 | 802 | 1.75 | 2456 | 4.15 | 1308 | 3.21 | 578 | 3.29 |
| 20 | 2023-05-20 | 5136 | 2.71 | 367 | 6.81 | 723 | 1.94 | 2333 | 2.70 | 1092 | 2.11 | 621 | 2.25 |
| 21 | 2023-05-27 | 4786 | 2.15 | 379 | 8.97 | 712 | 0.84 | 2036 | 1.77 | 1063 | 1.41 | 596 | 2.01 |
| 22 | 2023-06-03 | 4882 | 2.31 | 305 | 5.57 | 739 | 1.22 | 2258 | 2.30 | 986 | 2.64 | 594 | 1.52 |
| 23 | 2023-06-10 | 4595 | 1.50 | 332 | 6.33 | 712 | 0.28 | 1994 | 1.45 | 1025 | 0.68 | 532 | 1.88 |
| 24 | 2023-06-17 | 4297 | 1.61 | 323 | 2.48 | 708 | 1.27 | 1775 | 1.63 | 967 | 1.03 | 524 | 2.48 |
| 25 | 2023-06-24 | 4228 | 1.63 | 329 | 4.26 | 723 | 0.83 | 1781 | 1.74 | 870 | 1.03 | 525 | 1.71 |
| 26 | 2023-07-01 | 4166 | 1.13 | 281 | 2.14 | 731 | 0.27 | 1784 | 1.07 | 880 | 1.48 | 490 | 1.43 |
| 27 | 2023-07-08 | 4014 | 0.77 | 278 | 1.80 | 714 | 0.70 | 1628 | 0.37 | 909 | 0.77 | 485 | 1.65 |
| 28 | 2023-07-15 | 4212 | 0.59 | 306 | 0.33 | 704 | 0.14 | 1799 | 0.44 | 924 | 0.54 | 479 | 2.09 |
| 29 | 2023-07-22 | 4195 | 0.52 | 268 | 1.49 | 705 | 0.43 | 1815 | 0.44 | 945 | 0.42 | 462 | 0.65 |
| 30 | 2023-07-29 | 4208 | 0.55 | 308 | 0.97 | 753 | 0.53 | 1773 | 0.56 | 909 | 0.22 | 465 | 0.86 |
| 31 | 2023-08-05 | 3999 | 0.60 | 264 | 0.38 | 696 | 0.29 | 1698 | 0.77 | 921 | 0.22 | 420 | 1.43 |
| 32 | 2023-08-12 | 4140 | 0.39 | 324 | 0.62 | 768 | 0.13 | 1728 | 0.41 | 869 | 0.23 | 451 | 0.89 |
| 33 | 2023-08-19 | 4655 | 0.77 | 286 | 0.70 | 807 | 0.25 | 2048 | 0.68 | 1058 | 1.42 | 456 | 0.66 |
| 34 | 2023-08-26 | 4447 | 0.58 | 296 | 1.35 | 898 | 0.22 | 1954 | 0.15 | 862 | 1.39 | 437 | 1.14 |