Annual Report 2023 to 2024: Building tomorrow’s public service today
Contents
- Message from the Commissioners
- Methodology improvements in data integration and reporting
- Public service hiring
- A modernized and inclusive staffing system
- Safeguarding a merit-based, non-partisan public service
- Looking forward
- Endnotes
- Annex 1: Employment equity group applicants to external advertised processes and hires, compared to workforce availability
- Annex 2: Geographical distribution of public service hires and Public Service Employment Act population
- Annex 3: Employment equity group non-advertised appointments
Message from the Commissioners
We are pleased to present the Public Service Commission of Canada’s Annual Report for Fiscal Year 2023 to 2024.
Our work is critical to building a workforce that is drawn from the rich diversity of our country and is ready to put its skills and experiences to work to face current and future challenges.
By safeguarding a merit-based, representative and non-partisan public service, we play a vital role in ensuring the confidence of Canadians. In a complex and ever-accelerating environment, we will be even more diligent in our oversight to ensure the integrity of staffing and protect the non-partisan nature of the public service.
During our terms as Commissioners, we are committed to building on the tremendous efforts to remove biases and barriers within public service appointment processes so as to make hiring inclusive, from design to completion.
Prioritizing accessibility at the outset benefits everyone, as our new online unsupervised second language testing platform, the Candidate Assessment Tool, has shown. The tool has had a substantial impact on all candidates, greatly reducing the need for accommodation measures as well as processing times for the language assessment requests.
We are leveraging technology to modernize public service hiring so we can meet the needs of departments and agencies, as well as the expectations of Canadians seeking employment. We are also experimenting with new approaches to make hiring more efficient.
Our student modernization pilot allows departments to directly hire students in remote locations, for specialized skills, or in support of diversity objectives. This more flexible way to hire students will balance access and efficiency, while supporting public service renewal and upholding the integrity and the impartiality of recruitment.
With regard to non-advertised processes, we are taking steps to increase the data and enhance reporting transparency. While we know that departments and agencies have been meeting policy and legislative requirements when using these processes, disaggregated data will provide a clearer portrait of how they are being used. We will report on this work in our next annual report.
The federal public service continues to count on the valuable skills and experience of persons with priority entitlements, including veterans and Canadian Armed Forces members. Late in the fiscal year, the Public Service Commission of Canada discovered an issue related to the identification of veterans and Canadian Armed Forces members in its recruitment system that may have affected preference and mobility rights for some. We notified those who may have been affected. We also launched an audit to:
- gather detailed information from departments and agencies
- examine specific advertised external selection processes
- determine who may have been affected
The results of the audit have been published. We remain steadfast in our commitment to supporting the employment of veterans and Canadian Armed Forces members in the public service.
Working with departments and agencies, we aim to build a modern, merit-based and inclusive hiring system that is representative of the Canadian population.
President
Commissioner
Commissioner
Methodology improvements in data integration and reporting
We have undertaken a multi-year project to enhance the quality of our analytical data holdings by integrating more detailed and current pay, human resources and recruitment data sources, and by adopting modern data technologies. Beginning in fiscal year 2023 to 2024, data in our annual report is derived from our modernized analytical environment, which is used to integrate, transform and match our data holdings on hiring and staffing in the public service.
This change not only allows for more accurate reporting on key trends but also ensures that the data in this year’s annual report and onward better reflects the current state of public service staffing.
In fiscal year 2023 to 2024, trends in some metrics are affected by these improvements. For these metrics, results from both the legacy and the modernized analytical environment are provided to ensure a transparent transition. Readers should take these changes into account when comparing trends with previous years.
Public service hiring
A shift in hiring trends
The federal public service population (indeterminate, term, casual and student) under the Public Service Employment Act rose by 3.0% (8 349 employees) over the fiscal year, increasing to 282 568 employees as of March 31, 2024.Endnote1, Endnote2
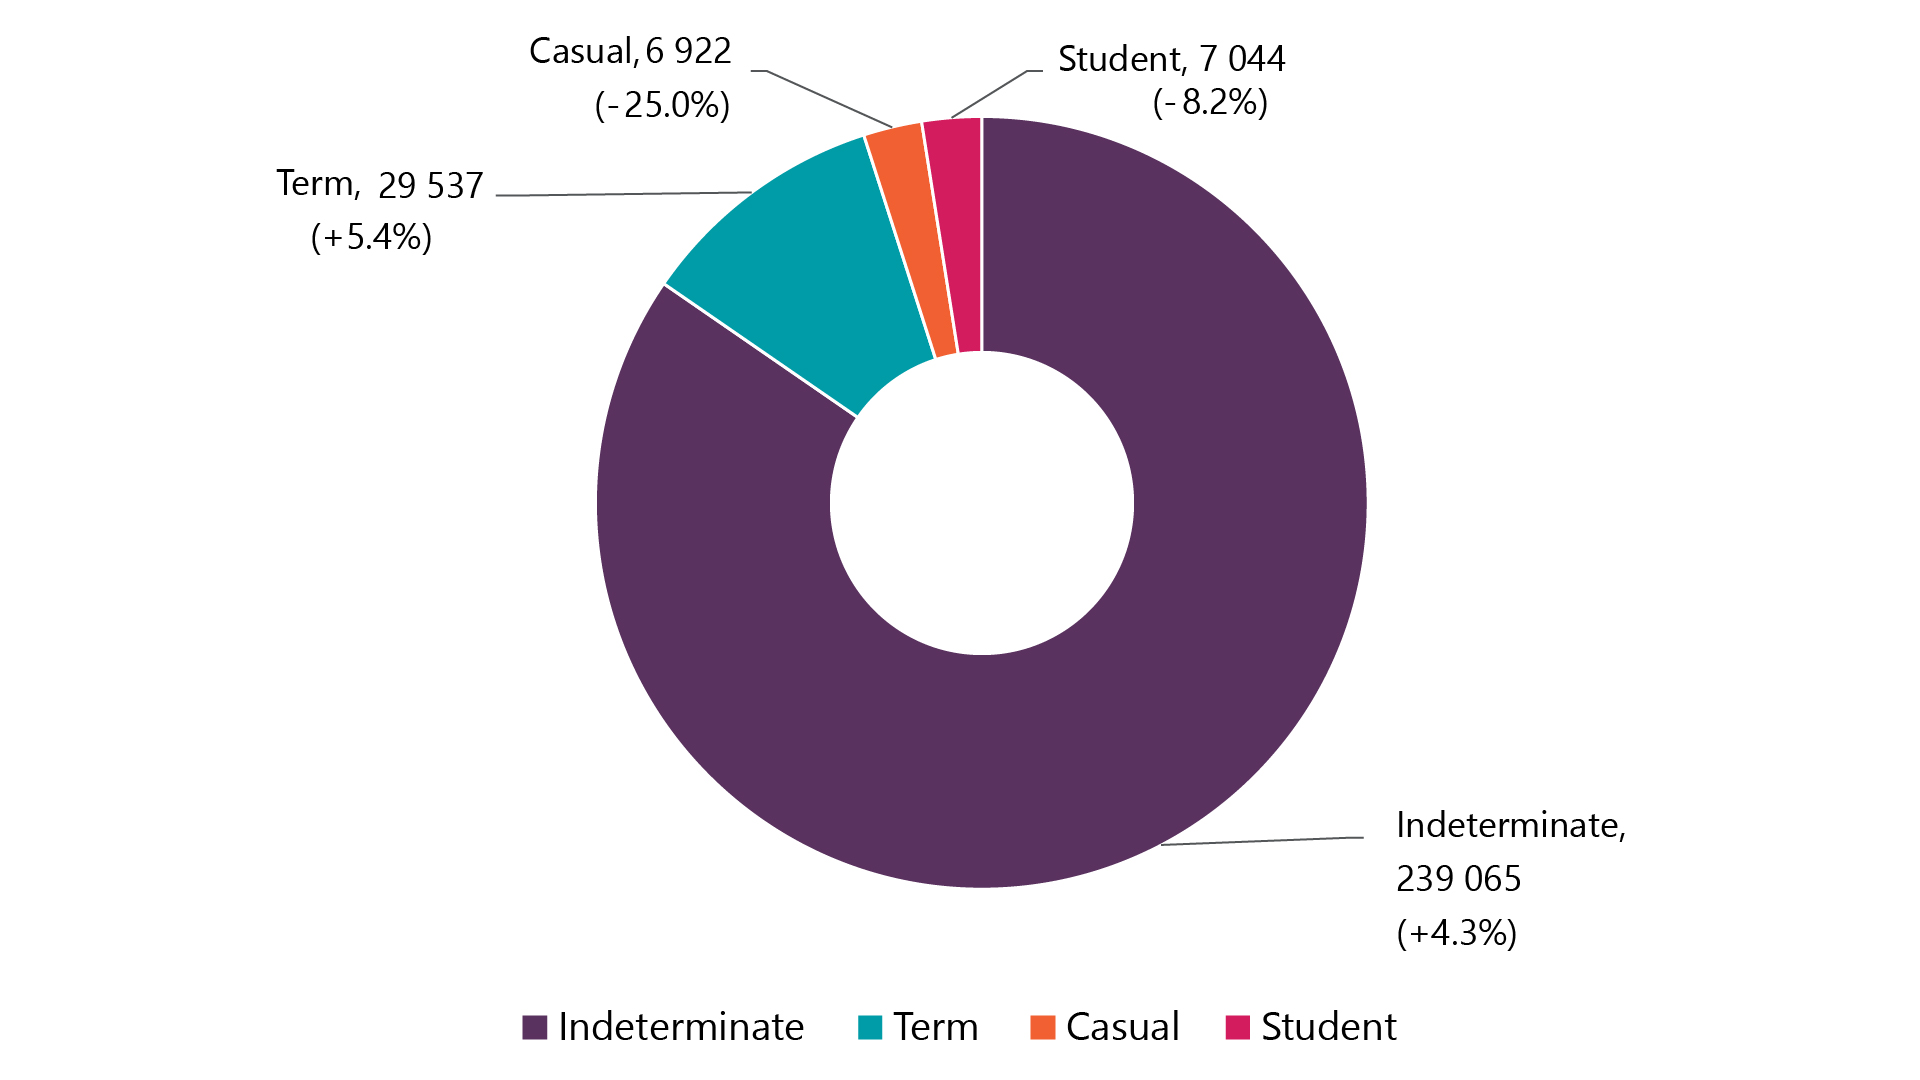
*Percentages in chart represent year-over-year change.
Count and year-over-year change, Public Service Employment Act population, March 31, 2024 - Alternative text
| Tenure | Population | Year-over-year change in population (percentage) |
|---|---|---|
| Indeterminate | 239 065 | + 4.3% |
| Term | 29 537 | + 5.4% |
| Casual | 6 922 | - 25.0% |
| Student | 7 044 | - 8.2% |
| Total | 282 568 | + 3.0% |
This moderate population growth corresponds to a decrease in hiring, with 62 077 external hires (hires from outside the federal public service), representing a decrease of 12.8% (9 123 fewer hires) compared to the previous year.
| Tenure | External hires | Year-over-year change in external hires |
|---|---|---|
| Indeterminate | 11 825 | -10.1% (1 328 fewer hires) |
| Term | 18 696 | -13.5% (2 914 fewer hires) |
| Casual | 16 632 | -22.7% (4 874 fewer hires) |
| Student | 14 924 | 0.0% (7 fewer hires) |
| Total | 62 077 | -12.8% (9 123 fewer hires) |
Applications to public service jobs also fell, with 417 165 applicants to externally advertised federal public service positions, a 1.5% decline from the previous year. With regard to citizenship, of those applicants to externally advertised positions:
- 68.6% (285 972) reported they were Canadian citizens
- 14.3% (59 850) reported they were permanent residents
- 7.2% (30 159) reported they were on work permits
- 9.9% (41 184) reported their status as “other”
| Employment equity groups | Applicants (2021 to 2022) |
Applicants (2022 to 2023) |
Applicants (2023 to 2024) |
Workforce availability |
|---|---|---|---|---|
| Indigenous Peoples | 3.2% | 3.0% | 3.2% | 3.8% |
| Persons with disabilities | 4.8% | 5.1% | 6.7% | 9.2% |
| Members of a visible minority | 29.4% | 30.6% | 34.2% | 17.3% |
| Women | 57.2% | 55.6% | 52.8% | 53.7% |
While the total number of applicants has decreased, there has been an increase in share across all employment equity groups except women. This trend is positive, but more work needs to be done to close the gap in applications from persons with disabilities and Indigenous Peoples.
See Annex 1 for detailed applicant data on employment equity groups and subgroups.Endnote4, Endnote6, Endnote8
Refer to our interactive employment equity dashboard for more data on hiring activities and applicants for employment equity groups and subgroups.
Indigenous Career Navigators Program
The Indigenous Career Navigators Program provides advice and guidance to Indigenous public servants across Canada to help navigate their career from a recruitment, retention, professional development, and career advancement.
Led by the Knowledge Circle for Indigenous Inclusion, this program helps managers recruit Indigenous employees and support their career aspirations. There are currently 62 navigators offering these services in 31 departments, agencies and crown corporations, and the numbers continue to grow.
Renewal amid reduced hiring
This year, hires through the Federal Student Work Experience Program decreased, while hires through the Post-Secondary Co-op/Internship Program and the Research Affiliate Program increased.Endnote10
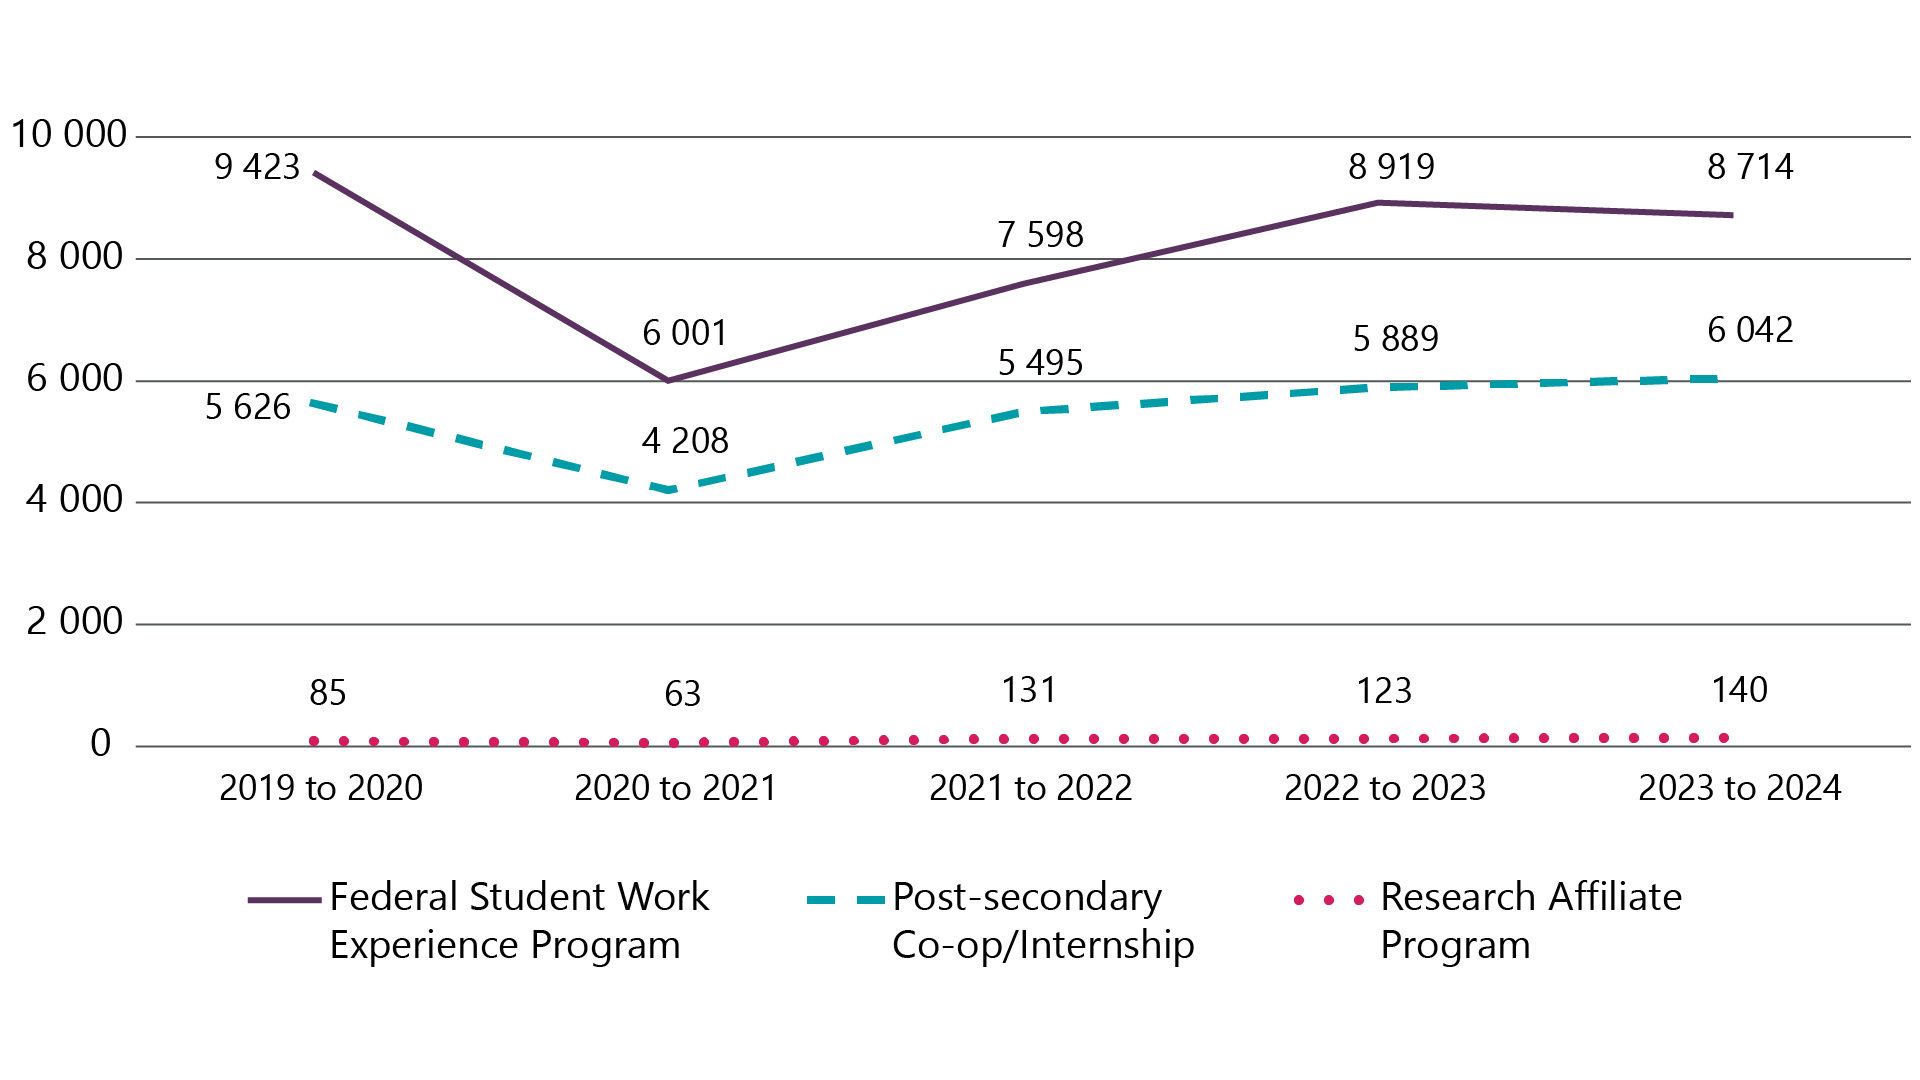
Count of external hiring activities, Federal Student Work Experience Program, Post-Secondary Co‑op/Internship Program and Research Affiliate Program, by fiscal year - Alternative text
| 2019 to 2020 | 2020 to 2021 | 2021 to 2022 | 2022 to 2023 | 2023 to 2024 | |
|---|---|---|---|---|---|
| Federal Student Work Experience Program | 9 423 | 6 001 | 7 598 | 8 919 | 8 714 |
Post-Secondary Co-op/Internship Program |
5 626 | 4 208 | 5 495 | 5 889 | 6 042 |
| Research Affiliate Program | 85 | 63 | 131 | 123 | 140 |
The number of student hires through the Federal Student Work Experience Program remained stable for all 4 designated employment equity groups compared to the previous fiscal year.
| Employment equity groups | Appointments* | Share of Federal Student Work Experience Program appointments |
|---|---|---|
| Indigenous Peoples | 499 | 7.1% |
| Persons with disabilities | 786 | 11.1% |
| Members of a visible minority | 2 916 | 38.2% |
| Women | 5 399 | 62.0% |
*People who self-declare in more than 1 designated employee equity group are included in the total count for each group (for example, an Indigenous woman is included in the total count for both women and Indigenous Peoples).
Students represent a vital source of renewal for the public service, bringing new skills and knowledge. This year, there were 4 626 external hires (indeterminate and term) who had experience in a federal student recruitment program within the last 10 years.
Often highly mobile, students may help close skills gaps across the country. We will continue to work with students, academia and community organizations to promote public service employment. This includes enhancing our partnership with Deputy Minister University Champions through communications and on-campus outreach activities at universities across the country. In a highly competitive market to attract top talent, particularly in high-demand sectors, this partnership is essential to support recruitment into the public service and promote it as an employer of choice.
Intelligence Analyst Student Recruitment Initiative
In fiscal year 2023 to 2024, the Intelligence Analyst Community of Practice, hosted by the Privy Council Office, partnered with the Federal Student Work Experience Program to recruit students to fill intelligence analyst positions across the intelligence community.
The initiative was open to undergraduate and graduate students of all academic backgrounds who self-declared as members of an employment equity group.
- 15 departments sought to recruit students through this initiative.
- It attracted more than 1 500 applicants from across Canada.
- 334 qualified candidates were identified.
- 16 candidates were hired in the fiscal year and more hires are expected in the next fiscal year.
Access to public service jobs
As of March 31, 2024, over half of the Public Service Employment Act population worked outside the National Capital Region (53.1%).Endnote11
| 2018 to 2019 | 2019 to 2020 | 2020 to 2021 | 2021 to 2022 | 2022 to 2023 | 2023 to 2024 | |
|---|---|---|---|---|---|---|
| National Capital Region | 46.7% | 46.9% | 46.8% | 47.5% | 47.6% | 46.8% |
Outside the National Capital Region |
52.6% | 52.3% | 52.4% | 51.9% | 52.2% | 53.1% |
| Unknown | 0.6% | 0.8% | 0.8% | 0.6% | 0.1% | 0.2% |
See Annex 2 for the geographical distribution of public service external hires and Public Service Employment Act population.
Refer to our interactive graphic on regional representation for more information on the regional breakdown of total and employment equity group population and external hiring.
While location has an impact on access to public service jobs for Canadians and permanent residents, so does the decision to make a job opportunity advertised or non-advertised.
In fiscal year 2023 to 2024, 47.8% (12 284) of external hires were identified as non-advertised.Endnote12

Share of external non-advertised appointments - Alternative text
| 2021 to 2022 | 2022 to 2023 | 2023 to 2024 | |
|---|---|---|---|
| Legacy methodology | 50.8% | 55.0% | 61.7% |
| Modernized methodology | 32.5% | 37.2% | 47.8% |
When comparing trends using both the legacy and modernized methodologies, we observe a continued year-over-year increase in the share of external non-advertised appointments.
See Annex 3 for employment equity group non-advertised appointments.
Median time to hire new public servants
This year, the public service’s target timeframe for hiring new public servants was 167 days. However, the median time to hire new public servants remained stable at 214 days, compared to 220 days the previous year.Endnote13
While this is an improvement, it still takes too long to hire. Asking top talent to wait close to 7 months for a job offer jeopardizes the public service’s ability to remain relevant in a highly competitive job market. Finding efficiencies in assessment methods and increasing accountability is key to addressing this persistent issue.
For more data on time to staff, refer to our time-to-staff interactive graphic.
Internal mobility
This year, 27.2% of public servants in an indeterminate or a term position changed roles through a promotion, an acting appointment or a lateral move, a 2.8 percentage point decrease over the previous fiscal year.
The rates of promotion, acting appointment and lateral movement decreased from the previous fiscal year. This is the first decrease in the acting appointment rate since fiscal year 2016 to 2017.Endnote14
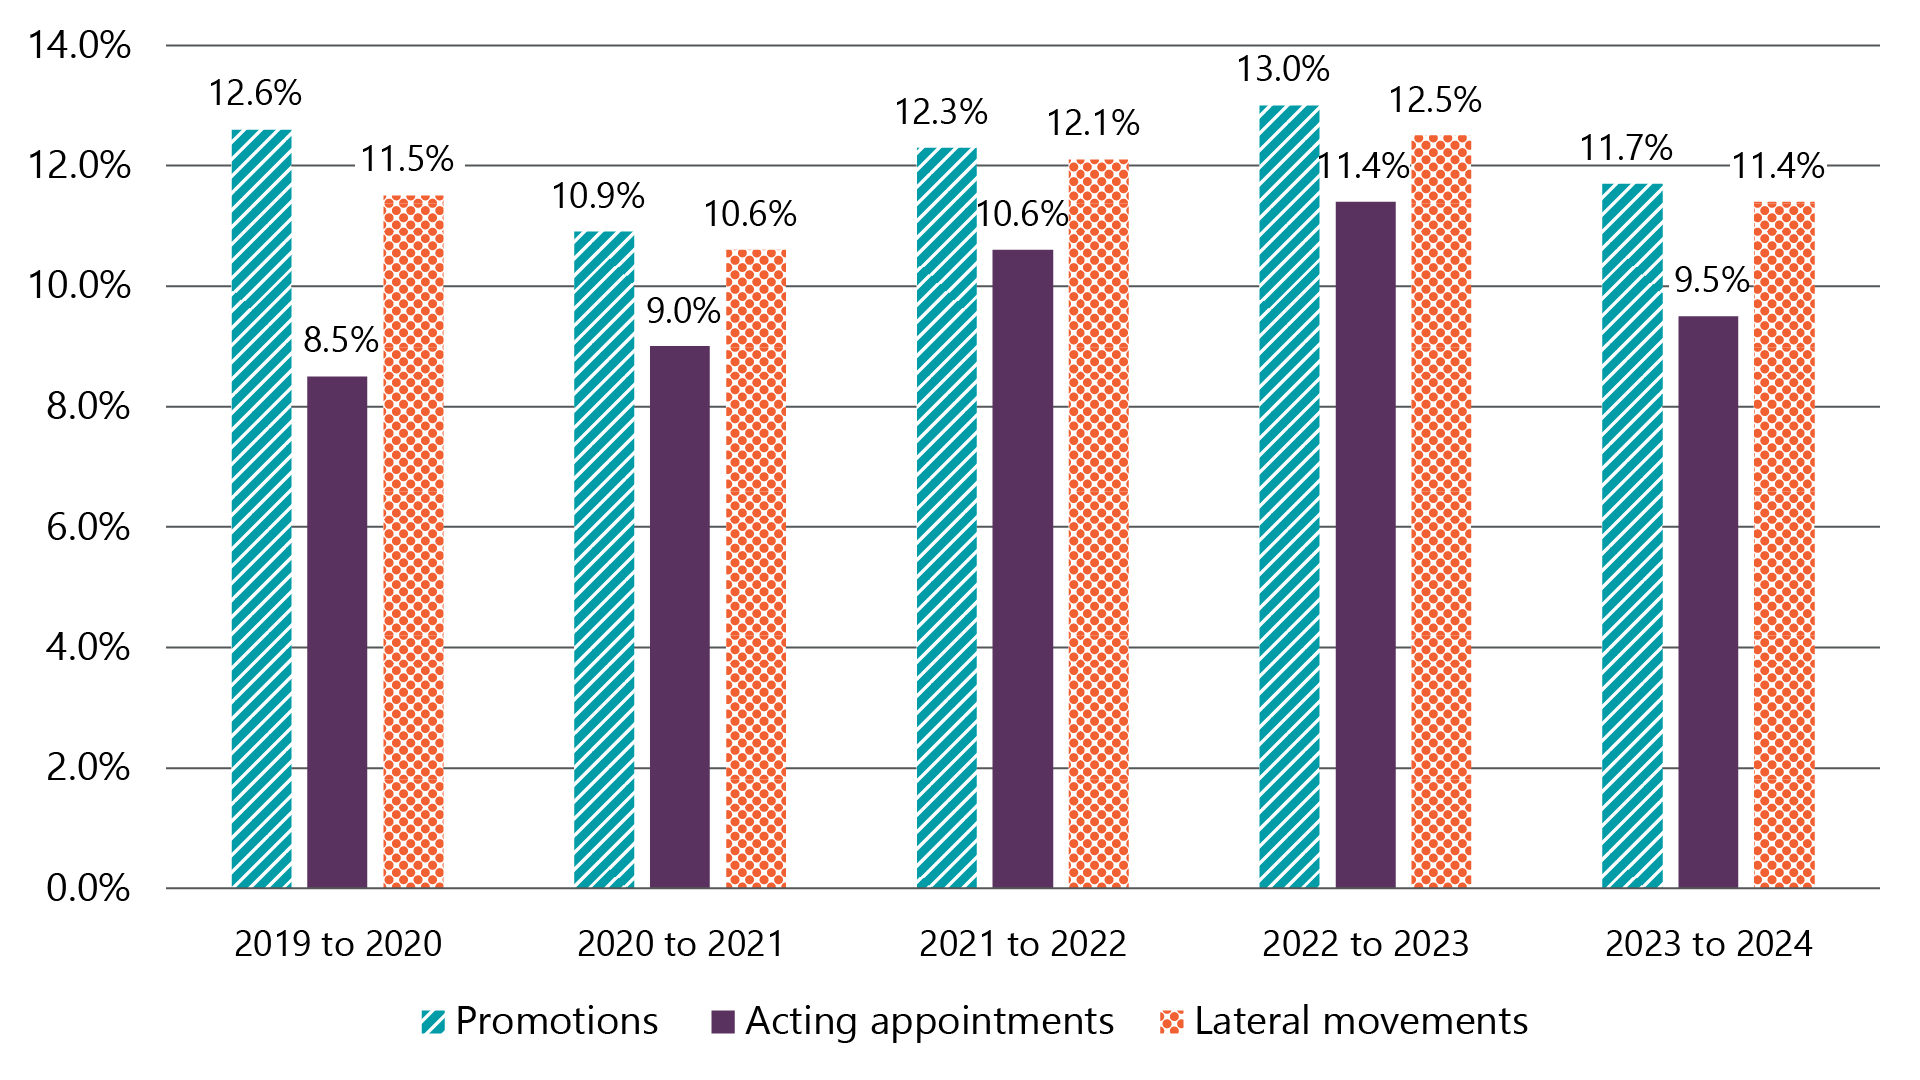
Internal mobility rates, by fiscal year - Alternative text
| 2019 to 2020 | 2020 to 2021 | 2021 to 2022 | 2022 to 2023 | 2023 to 2024 | |
|---|---|---|---|---|---|
| Promotions | 12.6% | 10.9% | 12.3% | 13.0% | 11.7% |
Acting appointments |
8.5% | 9.0% | 10.6% | 11.4% | 9.5% |
| Lateral movements | 11.5% | 10.6% | 12.1% | 12.5% | 11.4% |
Priority entitlements and veteran hiring
Priority entitlements support people who experience career changes because of life events, including:
- workforce adjustment
- becoming disabled
- returning from extended leave
- being medically released from the Canadian Armed Forces or the Royal Canadian Mounted Police
In fiscal year 2023 to 2024, the number of persons with a priority entitlement continued to decrease, from 1 229 to 1 142. We observed a slight decline in the number of new registrations (695 to 686) and appointments (385 to 353) of persons with a priority entitlement, and 270 priority entitlements expired.
While the size of the priority talent pool has continued to decline, the proportion of persons with a priority entitlement who are appointed every year continues to range between 30% and 45%.

Time elapsed from priority entitlement start date to appointment, fiscal year 2023 to 2024 - Alternative text
| 1 to 6 months | 6 to 12 months | Over 1 year | Total | |
|---|---|---|---|---|
| Number of appointments | 121 | 80 | 152 | 353 |
| Percentage of appointments | 34% | 23% | 43% | 100% |
Of the total number of persons with a priority entitlement who were appointed this year, over 50% were appointed within a year of starting their priority entitlement.
The priority entitlements talent pool offers hiring managers quick staffing options to appoint people with a diverse set of experience, skills and abilities. We will continue to promote this experienced workforce to meet hiring needs.
Appointments of veterans in the federal public service
By virtue of the Public Service Employment Act, there are various mechanisms to help veterans transition into a career in the federal public service: priority entitlements, mobility and preference for veterans.Endnote15
Fewer people activated a priority entitlement this year. The number of medically released Canadian Armed Forces members activating their priority entitlement also declined, down 12%, from 383 members available for job opportunities on March 31, 2023, to 336 on March 31, 2024. This reduction corresponds to a decrease in priority appointments of medically released Canadian Armed Forces members, with 83 appointments, representing a 25% decrease (27 fewer appointments) compared to the previous year.
In fiscal year 2023 to 2024, there were 106 appointments under the mobility provision.

Number of appointments under the mobility provision - Alternative text
| 2021 to 2022 | 2022 to 2023 | 2023 to 2024 | |
|---|---|---|---|
| Legacy methodology | 92 | 86 | 40 |
| Modernized methodology | 190 | 158 | 106 |
When comparing trends using both the legacy and modernized methodologies, we observe a continued year-over-year decrease in appointments under the mobility provision.
In fiscal year 2023 to 2024, there were 104 appointments under the preference provision.

Number of appointments under the preference provision - Alternative text
| 2021 to 2022 | 2022 to 2023 | 2023 to 2024 | |
|---|---|---|---|
| Legacy methodology | 85 | 45 | 50 |
| Modernized methodology | 90 | 110 | 104 |
Addressing a data transfer issue
To support preference and mobility entitlements, we receive a list from the Department of National Defence of eligible veterans and serving Canadian Armed Forces members through a secure web service.
Late in fiscal year 2023 to 2024, we discovered a technical issue with this data transfer process that may have led to a number of veterans and Canadian Armed Forces members not being properly identified for preference and mobility entitlements.
We notified veterans and Canadian Armed Forces members who may have been affected, and provided them with information and help to address concerns. In accordance with our authorities under the Public Service Employment Act, Section 17, we also launched an audit with departments and agencies to help determine whose preference rights might have been affected.
The Audit on the Application of the Order of Preference for Veterans During the Data Transfer Outage between the Department of National Defence and the Public Service Commission of Canada has been published online.
The next annual report will contain updated data based on the results of the Audit.
A modernized and inclusive staffing system
Ambassador Network for Inclusive Assessments
Through the Ambassador Network for Inclusive Assessments (accessible only on the Government of Canada network), the Public Service Commission of Canada shares best practices and advises human resources professionals on using inclusive, accessible and equitable assessment methods.
The network includes 59 human resources specialists from over 37 departments and agencies.
Biases and barriers in hiring
On July 1, 2023, final amendments to the Public Service Employment Act came into force. These amendments introduced 2 critical components to help remove biases and barriers or mitigate their impact on equity‑seeking groups:Endnote16
- Before using an assessment method, hiring managers must evaluate it to determine whether the method, and the way it will be applied, includes or creates biases or barriers that disadvantage people belonging to equity-seeking groups. If a bias or barrier is identified, reasonable efforts must be made to remove it or to mitigate its impact.
- Our investigation authorities and those of deputy heads have been expanded to include errors, omissions or improper conduct resulting from a bias or barrier that disadvantages people in an equity-seeking group.
We are providing information sessions and tools to ensure these changes are durable and have a meaningful impact.
Providing opportunities for Canadians with disabilities
The Federal Internship Program for Canadians with Disabilities was launched in 2019. Aiming to hire 125 interns over 5 years, the program helps Canadians with disabilities develop new skills, gain valuable work experience, find employment and build their careers. To date, 126 persons with disabilities have participated in the program.
This investment in the career development of Canadians with disabilities is proving to be an excellent model. Of the 80 people who have completed their internship, 77% have secured further employment in the public service.
We will extend this program beyond its original mandate for another 5 years to support the hiring of persons with disabilities.
Medical exclusion requests
The Public Service Official Languages Exclusion Approval Order allows people to be appointed on a non-imperative basis if they have a medical condition that prevents them from learning their second official language or attaining the linguistic profile of their bilingual position.
In 2023 to 2024, the Public Service Commission of Canada received 18 requests for medical exclusions, representing a continued increase over the last 5 years.
Inclusive second language evaluation
This year, more departments and agencies used our online Candidate Assessment Tool, administering over 95 000 second language tests for reading comprehension and written expression.
Beyond reducing time to staff, this tool and its accessibility features have led to drastic reductions in processing times for assessment accommodation recommendations (on average dropping from 51 to 3 business days) and in assessment accommodation requests (from 10% to 2% of tests).
These reductions were achieved thanks to streamlined operational processes and the Candidate Assessment Tool’s accessibility and compatibility with adaptive technologies. The reduction of over 50% in requests for alternative formats suggests the tool has made it much easier for many people with disabilities to take tests, without having to request accommodation measures.
Student programs modernization
Recognizing the need to modernize our student recruitment programs, we consulted extensively with students, hiring managers, senior human resource leaders and a few other provincial and international governments. With their input, we compiled a suite of recommended actions to make our programs more modern, flexible, inclusive and user-centric, all while advancing key priorities such as public service renewal and diversity, equity and inclusion.
A significant and promising step forward for student hiring
In fiscal year 2023 to 2024, 8 departments and agencies tested a flexible approach to recruiting specific students from the Federal Student Work Experience Program, including students who are:
- members of an employment equity group
- located remotely
- in a specialized field of study
The Specific Name Referral pilot has shown some initial success and will onboard more departments and agencies in fiscal year 2024 to 2025.
Safeguarding a merit-based, non-partisan public service
Integrity at the forefront
As part of our mandate to oversee the integrity of the staffing system and the political impartiality of the federal public service, we investigate concerns about specific appointment processes and allegations of improper political activities.
Investigations data and trends
This fiscal year, we received 264 requests for investigations that fell under our mandate. These included:
- 23 deputy head requests for investigations on their behalf related to error, omission or improper conduct in internal appointment processes
- 154 requests related to error, omission or improper conduct, or to merit not being met, in external appointment processes
- 81 requests related to fraud
- 6 requests related to improper political activities
Investigating biases and barriers in hiring
Following the expansion of our investigation authorities, we examined 14 investigation requests related to concerns about biases or barriers that disadvantage people who belong to an equity-seeking group. The most frequently cited prohibited grounds were disability, race, sex, national or ethnic origin and colour. Two of these requests fell under our expanded authority and, upon review, no investigation was warranted. The other requests were still examined for the possibility of error, omission or improper conduct.
Analysis of completed investigation cases
This fiscal year, we completed 105 investigation cases. This represents a decrease of approximately 40% over last year (105 versus 173). This decrease is due to a higher than usual number of completed investigations cases during the previous fiscal year, mainly stemming from the investigation of 1 appointment process.
| 2019 to 2020 | 2020 to 2021 | 2021 to 2022 | 2022 to 2023 | 2023 to 2024 | |
|---|---|---|---|---|---|
| Fraud | 19 | 9 | 10 | 14 | 17 |
| Error, omission or improper conduct in an external appointment process | 6 | 13 | 8 | 66* | 18 |
| Improper political activities | 20 | 7 | 16 | 29 | 9 |
| Total | 45 | 29 | 34 | 109* | 44 |
* This number can be explained by the investigation of 1 appointment process that yielded multiple individual cases. In fiscal year 2023 to 2024, the number of founded investigation cases returned to the normal trend, with a total of 44 cases.
Refer to our recently launched dashboard for investigations for more information, including the number of fraud investigation cases opened each year, and the breakdown of different types of investigations cases.
Emerging trends
We have observed a growing trend related to the use of various social media platforms to advertise job opportunities. Undeniably, these recruitment methods are increasing the variety of options for marketing job opportunities, recruiting skilled employees and staffing specific jobs. However, departments and agencies must comply with the Appointment Policy’s advertisement requirements, such as using the federal government’s recruitment system (GC Jobs) to advertise an appointment process, even when other platforms are also used.
We have been offering workshops targeted to staffing professionals to increase awareness on how to prevent and detect errors, cheating, fraud and favouritism. We are seeing an increase in questions related to artificial intelligence (AI), and we are providing tips on preventing AI-related issues, as well as guidance on what to do when AI is suspected to have been used in an appointment process.
Non-partisanship and political activities
Before seeking nomination as, or being, a candidate in a municipal, provincial, territorial or federal election, public servants must first request and obtain the permission of the Public Service Commission of Canada.
When deciding whether these activities could impair or be perceived as impairing an employee’s ability to perform their duties in an impartial manner, we consider factors such as:
Actively contributing to the renewed conversation on values and ethics
The Public Service Commission of Canada offers the following services to the entire federal public service:
- administering the provisions of the Public Service Employment Act and regulations that relate to the political activities of employees and deputy heads
- processing requests for permission to seek nomination and be a candidate in federal, provincial, territorial or municipal elections, as well as a leave of absence without pay
- providing guidance, information and tools to employees on their legal rights and responsibilities related to political activities and non-partisanship
We will continue to advance the discussion and collective efforts to protect the integrity of the federal public service while enhancing its effectiveness.
- the level of the election
- the employee’s duties
- the level and visibility of their position
All permission requests received in fiscal year 2023 to 2024 were granted, as any risks to political impartiality were addressed by imposing mitigating conditions.
| Level | Number of elections where a request for candidacy permission was received | Number of candidacy permissions granted |
|---|---|---|
| Municipal | 9 | 5* |
| Provincial and territorial | 6 | 6 |
| Federal | 12 | 12 |
| Total | 27 | 23 |
*Notes about municipal permissions granted:
- 1 request was withdrawn
- 2 requests were received near fiscal year-end, and decisions were rendered in the 2024 to 2025 fiscal year
- 1 permission request was not required since the employee was appointed by the municipality with no election; the employee was referred to their department for the file to be treated under its conflict of interest process
Looking forward
Over the next fiscal year, we will continue to monitor the integrity and inclusiveness of the staffing system, ensuring that changes to the Public Service Employment Act are reflected in staffing practices. We will also support departments and agencies in adapting to these changes and in creating conditions that lead to success.
We will publish the results of specific audits and surveys that will shed light on the integrity and effectiveness of the public service staffing system, as well as on the protection of merit and non-partisanship.
We’ll provide more flexibility to departments and agencies by further modernizing our programs and services. This will involve piloting new models and approaches for student hiring, supporting Indigenous recruitment and continue the recruitment of 5 000 persons with disabilities by 2025. We will also continue to engage stakeholders on the proposal to amend the Employment Equity Act, understanding the significant change this could represent.
Building on the success of the Candidate Assessment Tool, we will also innovate in second language testing to improve staffing processes and the experience of job candidates, and to prepare for an expected increase in demand resulting from the modernization of the Official Languages Act. This will include implementing an accessible-by-design self-serve scheduling system and exploring the use of technologies to improve the robustness of testing.
In addition to exploring new technologies and their potential impact on our activities and the staffing system, we will develop a policy direction and guidance on using artificial intelligence in the recruitment process.
We are developing high-value enhancements and planning long-term strategy for the new public service recruitment platform. We will invest in enhancements and upgrades to our current recruitment platform. We will also continue the use of a digital adoption platform, an interactive and personalized software that will improve time to staff and support all users by guiding them through key tasks and teaching them to make full use of new features. Our work in this area will advance the federal government’s efforts to improve human resources systems in the public service, notably by supporting an end-to-end potential human resources and pay solution.
We look forward to continuing to build a public service where a diversity of Canadians, with a variety of skills, expertise and experience, aspire to work.
Endnotes
Annex 1: Employment equity group applicants to external advertised processes and hires, compared to workforce availability

Indigenous Peoples: applicants and hires to external advertised processes, compared to workforce availability, by fiscal year - Alternative text
| 2018 to 2019 | 2019 to 2020 | 2020 to 2021 | 2021 to 2022 | 2022 to 2023 | 2023 to 2024 | |
|---|---|---|---|---|---|---|
| Applicants | 3.0% | 3.2% | 2.9% | 3.2% | 3.0% | 3.2% |
| Hires | 4.1% | 4.0% | 3.8% | 4.2% | 4.4% | |
| Workforce availability | 4.0% | 4.0% | 4.0% | 3.8% | 3.8% |
| Subgroup | Applicants to external advertised processes, 2022 to 2023 | Hires, 2022 to 2023 | Applicants to external advertised processes, 2023 to 2024 |
|---|---|---|---|
| Inuit | 5.0% | 4.3% | 5.6% |
| Métis | 39.2% | 42.4% | 36.9% |
| North American Indian / First Nation | 47.2% | 46.0% | 48.4% |
| Other | 8.5% | 8.0% | 9.1% |
Note: Some proportions in this table differ from numbers reported in previous annual reports due to a change in the denominator used in the calculations. These totals may exceed 100%, since a person can self-declare and self-identify in more than 1 category given that the categories above are not mutually exclusive.

Persons with disabilities: Applicants and hires to external advertised processes, compared to workforce availability, by fiscal year - Alternative text
| 2018 to 2019 | 2019 to 2020 | 2020 to 2021 | 2021 to 2022 | 2022 to 2023 | 2023 to 2024 | |
|---|---|---|---|---|---|---|
| Applicants | 2.7% | 3.0% | 3.3% | 4.8% | 5.1% | 6.7% |
| Hires | 3.7% | 3.9% | 4.4% | 5.5% | 6.9% | |
| Workforce availability | 9.0% | 9.0% | 9.0% | 9.1% | 9.2% |
| Subgroup | Applicants 2022 to 2023 |
Hires 2022 to 2023 |
Applicants 2023 to 2024 |
|---|---|---|---|
| Blind or visual impairment | 4.8% | 5.3% | 4.3% |
| Coordination or dexterity | 4.3% | 4.9% | 4.0% |
| Deaf or hard of hearing | 8.2% | 8.9% | 6.9% |
| Mobility | 13.7% | 13.8% | 12.1% |
| Other disability | 76.8% | 78.4% | 80.4% |
| Speech impairment | 1.8% | 1.4% | 1.9% |
Note: Some proportions in this table differ from numbers reported in previous annual reports due to a change in the denominator used in the calculations. These totals may exceed 100%, since a person can self-declare and self-identify in more than 1 category given that the categories above are not mutually exclusive.

Members of visible minorities: applicants and hires to external advertised processes, compared to workforce availability, by fiscal year - Alternative text
| 2018 to 2019 | 2019 to 2020 | 2020 to 2021 | 2021 to 2022 | 2022 to 2023 | 2023 to 2024 | |
|---|---|---|---|---|---|---|
| Applicants | 22.3% | 24.3% | 25.0% | 29.4% | 30.6% | 34.2% |
| Hires | 19.3% | 21.3% | 21.3% | 23.2% | 26.9% | |
| Workforce availability | 15.3% | 15.3% | 15.3% | 17.2% | 17.3% |
| Subgroup | Applicants 2022 to 2023 |
Hires 2022 to 2023 |
Applicants 2023 to 2024 |
|---|---|---|---|
| Black | 27.5% | 26.5% | 28.3% |
| Chinese | 10.5% | 11.0% | 9.5% |
| Filipino | 4.7% | 4.1% | 4.5% |
| Japanese | 0.4% | 0.3% | 0.4% |
| Korean | 1.4% | 1.7% | 1.4% |
| Non-white Latin American | 4.9% | 5.1% | 4.5% |
| Non-white West Asian, North African or Arab | 11.8% | 13.3% | 11.6% |
| Person of mixed origin | 4.8% | 8.0% | 4.7% |
| South Asian / East Indian | 29.9% | 20.2% | 31.8% |
| Southeast Asian | 2.9% | 3.7% | 2.6% |
| Other visible minority | 7.3% | 6.1% | 7.1% |
Note: Some proportions in this table differ from numbers reported in previous annual reports due to a change in the denominator used in the calculations. These totals may exceed 100%, since a person can self-declare and self-identify in more than 1 category given that the categories above are not mutually exclusive.

Women: applicants and hires to external advertised processes, compared to workforce availability, by fiscal year - Alternative text
| 2018 to 2019 | 2019 to 2020 | 2020 to 2021 | 2021 to 2022 | 2022 to 2023 | 2023 to 2024 | |
|---|---|---|---|---|---|---|
| Applicants | 55.0% | 55.3% | 57.4% | 57.2% | 55.6% | 52.8% |
| Hires | 56.5% | 58.3% | 60.2% | 60.1% | 61.1% | |
| Workforce availability | 52.7% | 52.7% | 52.7% | 53.3% | 53.7% |
Annex 2: Geographical distribution of public service hires and Public Service Employment Act population
Geographical distribution of:
- hires that happened during fiscal year 2023 to 2024
- the population of people working for the federal public service who were appointed subject to the Public Service Employment Act, as of March 31, 2024
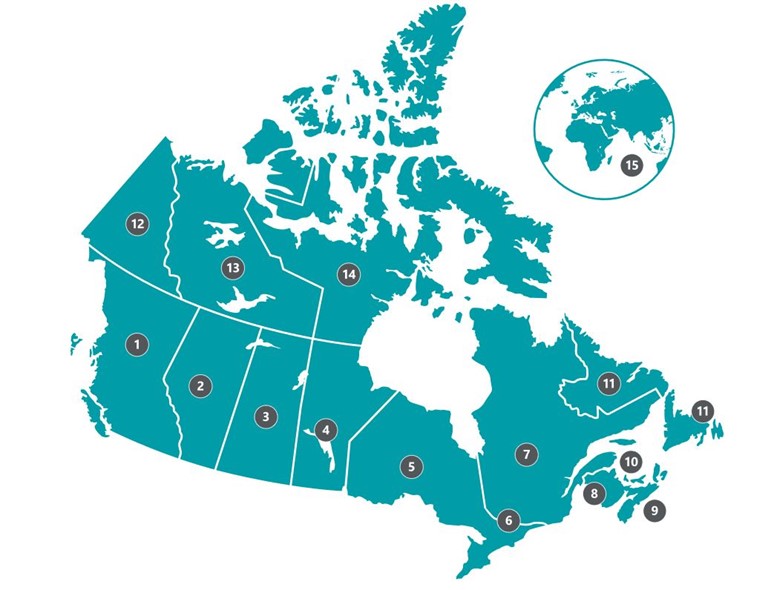
| Regions | Hires | Population as of March 31, 2024 |
|---|---|---|
| 1. British Columbia | 4 515 | 22 255 |
| 2. Alberta | 3 231 | 14 515 |
| 3. Saskatchewan | 1 257 | 5 709 |
| 4. Manitoba | 1 890 | 9 008 |
| 5. Ontario (except NCR) | 7 881 | 35 236 |
| 6. National Capital Region (NCR) | 29 361 | 132 115 |
| 7. Quebec (except NCR) | 6 112 | 29 947 |
| 8. New Brunswick | 2 615 | 11 743 |
| 9. Nova Scotia | 2 577 | 11 712 |
| 10. Prince Edward Island | 575 | 2 616 |
| 11. Newfoundland and Labrador | 696 | 4 454 |
| 12. Yukon | 110 | 396 |
| 13. Northwest Territories | 144 | 499 |
| 14. Nunavut | 79 | 299 |
| 15. International | 75 | 1 563 |
| Unknown* | 959 | 501 |
* Some hiring records were missing a regional indicator, and for this reason are not included in the breakdown.
Annex 3: Employment equity group non-advertised appointments
Non-advertised appointments in the charts in this annex include external hires, promotions and acting appointments of 4 months or more.

Indigenous Peoples: Share of non-advertised appointments compared to workforce availability, by fiscal year - Alternative text
| 2018 to 2019 | 2019 to 2020 | 2020 to 2021 | 2021 to 2022 | 2022 to 2023 | |
|---|---|---|---|---|---|
| Indigenous Peoples | 5.4% | 4.9% | 4.5% | 5.1% | 5.3% |
| Workforce availability | 4.0% | 4.0% | 4.0% | 3.8% | 3.8% |
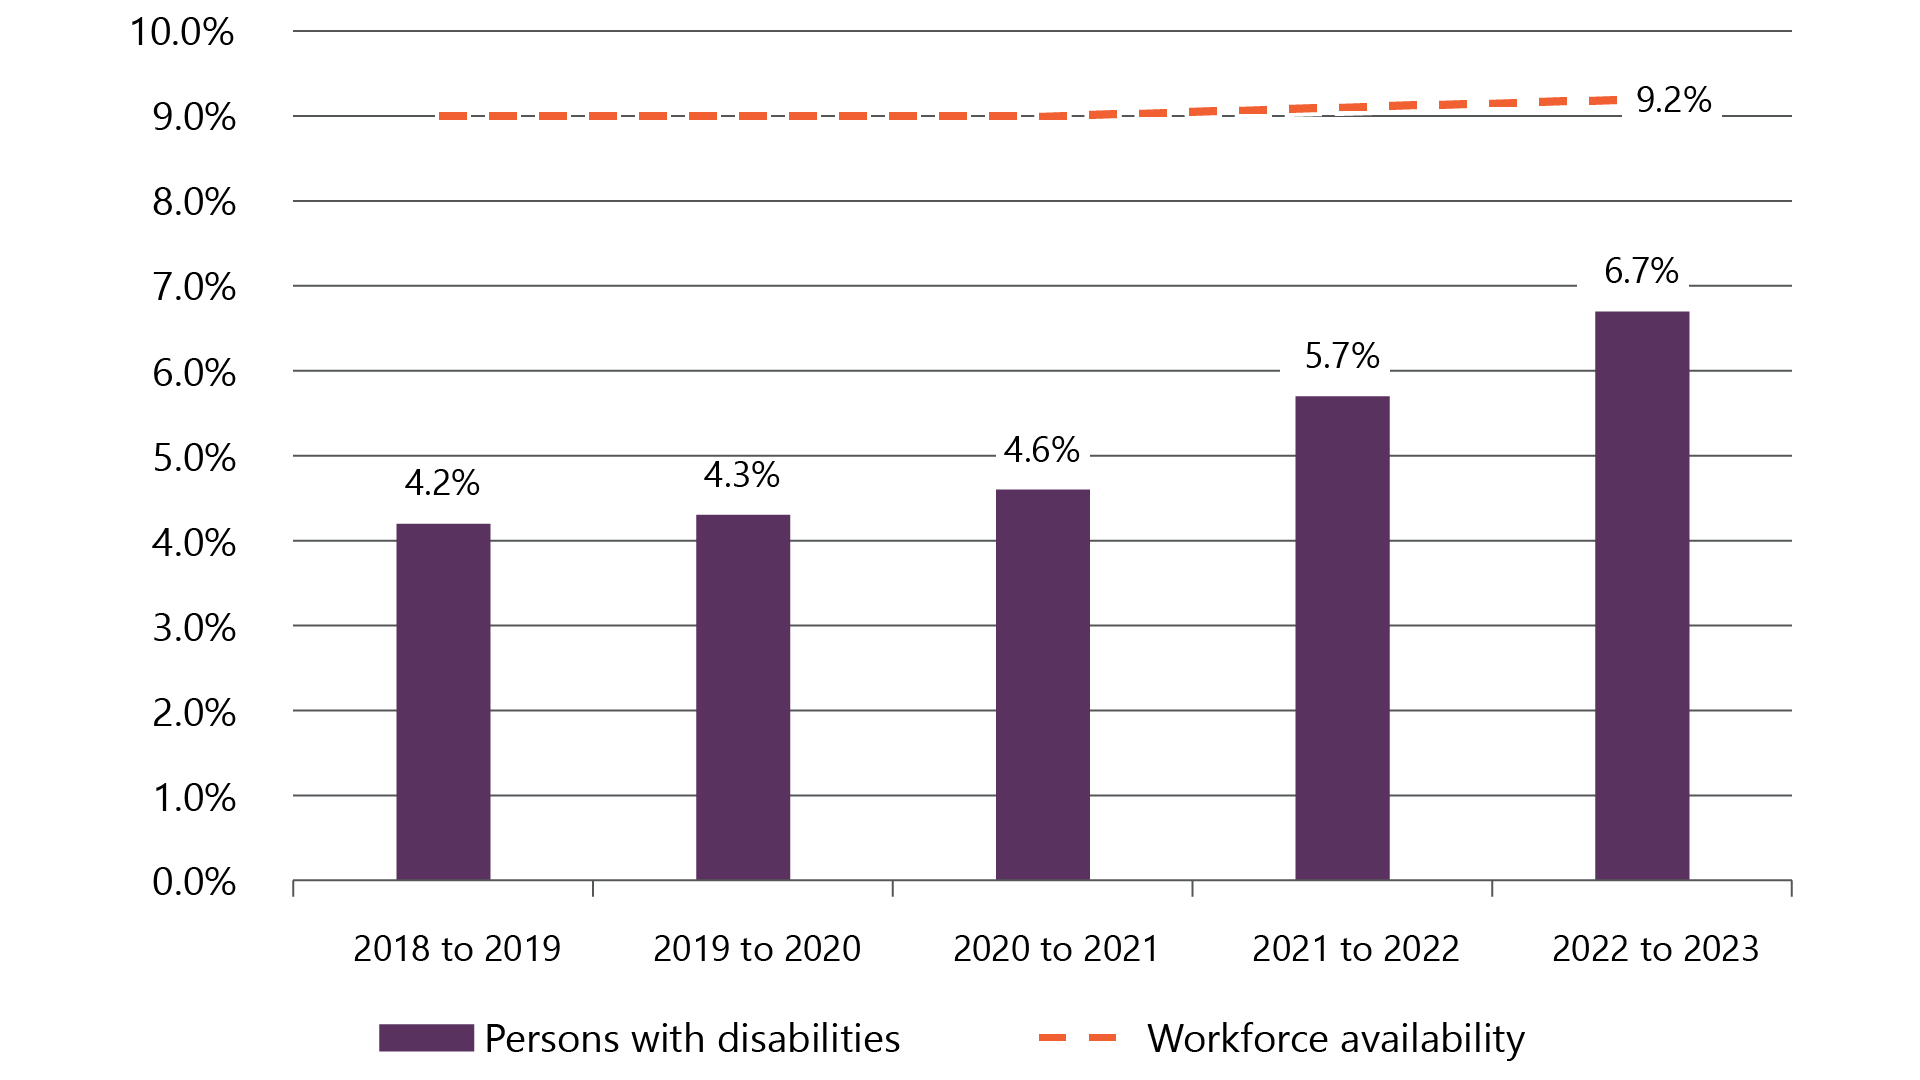
Persons with disabilities: Share of non-advertised appointments compared to workforce availability, by fiscal year - Alternative text
| 2018 to 2019 | 2019 to 2020 | 2020 to 2021 | 2021 to 2022 | 2022 to 2023 | |
|---|---|---|---|---|---|
| Persons with disabilities | 4.2% | 4.3% | 4.6% | 5.7% | 6.7% |
| Workforce availability | 9.0% | 9.0% | 9.0% | 9.1% | 9.2% |

Members of visible minorities: Share of non-advertised appointments compared to workforce availability, by fiscal year - Alternative text
| 2018 to 2019 | 2019 to 2020 | 2020 to 2021 | 2021 to 2022 | 2022 to 2023 | |
|---|---|---|---|---|---|
| Members of visible minorities | 18.0% | 19.6% | 21.0% | 22.9% | 23.8% |
| Workforce availability | 15.3% | 15.3% | 15.3% | 17.2% | 17.3% |

Women: Share of non-advertised appointments compared to workforce availability, by fiscal year - Alternative text
| 2018 to 2019 | 2019 to 2020 | 2020 to 2021 | 2021 to 2022 | 2022 to 2023 | |
|---|---|---|---|---|---|
| Women | 61.8% | 63.3% | 62.1% | 64.2% | 64.6% |
| Workforce availability | 52.7% | 52.7% | 52.7% | 53.3% | 53.7% |
© His Majesty the King in Right of Canada, as represented by the President of the Public Service Commission of Canada, 2024.
Cat. No. SC1E-PDF (Electronic PDF, English)
ISSN: 1912-0842