
Meeting between Patrick Borbey, PSC President, and Peter Routledge, Superintendent of Financial Institutions, Office of the Superintendent of Financial Institutions
*Information valid as of August 2021
Introduction
Deputy Head
Peter Routledge was appointed as the Superintendent of Financial Institutions, Office of the Superintendent of Financial Institutions (OSFI), effective June 29, 2021.
Mr. Routledge is exercising the Public Service Commission’s (PSC) authority for the first time as Deputy Head (DH). A copy of the New Direction in Staffing (NDS) highlights for DHs is attached as Annex A.
Organizational Context
Mandate
OSFI is a separate agency reporting to the Minister of Finance. OSFI supervises and regulates federally registered banks and insurers, trust, and loan companies, as well as private pension plans subject to federal oversight. As Canada’s independent prudential financial regulator, OSFI is focused on financial stability and on the solvency, liquidity, and safety and soundness of some 400 federally regulated financial institutions and 1,200 private pension plans. OSFI’s mandate is to protect the interests of depositors, policyholders, creditors, and pension plan members, while acknowledging the industry’s need to compete effectively and take reasonable risks.
Challenges
OSFI's total spending increased by 15.1% in 2019-20 due to the implementation of OSFI’s Strategic Plan 2019-22, the Phoenix settlement and salary adjustments pursuant to the ratification of the collective agreement for OSFI employees. The increase of 52 FTEs in 2019-20 and the forecasted increase of 102 FTEs in the subsequent two years, largely under Financial Institution and Pension Plan Regulation and Supervision and in Internal Services, are mainly due to the implementation of OSFI’s Strategic Plan 2019-2022 and the acceleration of other work such as technology projects due to the COVID-19 pandemic.
Population and Staffing Activities
Population
OSFI is a medium organization that has a population of 902 employees (as of March 31, 2021). In the 2020-2021 fiscal year, OFSI completed 293 staffing actions.
Staffing Activities
In 2020-2021, OSFI processed a total of 293 staffing actions:
- 183 appointments to the public service (including casual workers and students)
- 18 casual workers
- 84 students
- 81 others
- 72 promotions
- 19 acting appointments (4 months or more)
- 19 lateral and downward movements
The tenure distribution of these activities is as follows:
- 168 indeterminate
- 84 students
- 23 terms; and
- 18 casuals.
Please refer to Annex B for additional details on staffing activities.
Time to Staff
There are insufficient data to provide time to staff results for internal or external staffing processes at OSFI.
Staffing Framework
New Direction in Staffing Implementation
OSFI updated their staffing framework, effective August 4, 2016, to align with NDS requirements. They have shared their Appointment Policy with the PSC. The SSA currently has no indication about an update to their sub-delegation instrument.
Appointment Delegation and Accountability Instrument Annex D Reporting
Use of the Public Service Official Languages Exclusion Approval Order (PSOLEAO) and the Public Service Official Languages Appointment Regulations (PSOLAR)
In 2020-2021, the department reported exclusions under the Public Service Official Languages Exclusion Approval Order and Public Service Official Languages Appointment Regulations. The department also reported that 3 of the exclusions were extended over the initial two-year period to become bilingual. As a result, there was one non-compliant situation that was resolved by the organization in May 2021, at the PSC’s satisfaction. The remaining 2 situations concern employees that are still within their allotted time for meeting the official language requirements of their respective positions and they will pursue their language training as scheduled. Should they not meet the requirements, they will be appointed or deployed to a position to which they meet language requirements and other applicable merit criteria before the end of the allowed exemption period.
Approved Deputy Head Exceptions to the National Area of Selection (NAOS) Requirements for an External Advertised Appointment Process
OSFI reported that the DH did not approve any exceptionto the NAOS.
Results of Organizational Cyclical Assessment
OSFI is expected to submit their cyclical assessment for the period of April 1, 2016, and March 31, 2021, by October 1, 2021 at the latest.
Inquiries and Trends
From April 1, 2020, to March 31, 2021, OSFI made 29 inquiries to the PSC Staffing Support Advisor. Of these, 17 were related to COVID-19 measures in place, 1 was related to diversity and inclusion and 1 was related to changes to the Public Service Employment Act (PSEA).
The following is a spread of inquiries in accordance to topics addressed:
- 15 inquiries regarding assessment
- 3 inquiries regarding legislation
- 4 inquiries regarding delegated authorities
- 2 inquiries regarding the PSC’S appointment policy
- 1 inquiry regarding the PSC website
- 4 inquiries regarding topics outside the PSC mandate.
Topics addressed in these inquiries were similar to those of other organizations, in light of the COVID-19 pandemics.
Oversight
Audits
OSFI was among the 30 organizations that participated in the Audit of Employment Equity Representation in Recruitment published in January 2021. Of the 181 appointment processes examined as part of the audit, 9 were from OSFI. The participation of OSFI in this audit was much appreciated.
OSFI has not been included in any PSC audit/oversight projects that are underway.
Investigations
There have not been any investigations by the PSC on activities falling under the PSC’s jurisdiction and no investigation was conducted by the PSC for OSFI since December 2017.
Staffing and Non-Partisanship Survey Results
Overall, OSFI’s Staffing and Non-Partisanship Survey (SNPS) results are similar in comparison with other medium organizations and the public service, with a few exceptions.
Below are key findings from OFSI’s 2018 SNPS results:
- 67.9% of employees agreed that people hired can do the job, compared to 67.6% in organizations of similar size, and 53.8% in the federal public service
- 44.6% of managers agreed that the New Direction in Staffing has improved the way they hire and appoint persons to and within their organization, compared to 69.4% in organizations of similar size, and 56.1% in the federal public service
- 86.8% of managers agreed that within their organization, the administrative to staff a position is burdensome, compared to 84.0% in organizations of similar size, and 87.9% in the federal public service.
- 52.2% of managers indicated that they have limited or no understanding of the provisions that help veterans gain employment in the federal public service, compared to 32.3% in organizations of similar size, and 34.2% in the federal public service.
Diversity Profile
OSFI is above the representation for members of visible minorities at 39.7%. However, the organization is below workforce availability for:
- Women, who represent 51.2% of its workforce, while the WFA is 52.7%
- Indigenous peoples, who represent 1.4% of its workforce, while the WFA is 4.0%
- Persons with disabilities, who represent 3.9% of its workforce, while the WFA is 9.0%
| Designated Group | Public Service Work Force Availability (WFA) |
Office of the Superintendent of Financial Institutions (2019-2020) | Office of the Superintendent of Financial Institutions EE data from previous year (2018-2019) | Representation across the Public Service of Canada |
|---|---|---|---|---|
| Women | 52.7% | 52.1% | 51.3 % | 55.0% |
| Indigenous peoples | 4.0% | 1.4% | 1.5 % | 5.1% |
| Persons with Disabilities | 9.0% | 3.9% | 3.6 % | 5.2% |
| Members of Visible Minorities | 15.3% | 39.7% | 37.1 % | 17.8% |
Source:
2019-2020 Annual Employment Equity Report – Office of the Superintendent of Financial Institutions
The organization should take action to close the gaps for women, Indigenous peoples, and persons with disabilities, and continue to make merit-based appointments of members of the designated groups when required to ensure ongoing representativeness of its workforce.
The Clerk of the Privy Council asked senior leaders to commit to making measurable change to the diversity and inclusiveness of the public service which includes the creation of staffing plans to close representation gaps for employment equity groups. The data below highlights the fall 2020 gap in representation of persons with disabilities (PWD) at OSFI and the estimated level of recruitment required to close this gap within the next five years, taking into consideration factors such as attrition.
- Representation of PWD in 2018-2019: 3.6%
- Workforce availability (WFA) for PWD: 9.0%
- Gap between WFA and representation: 5.4%
- Closing the gap: as of fall of 2020, PWD population increase required to reach WFA over 5 years: 43
- Closing the gap: as of fall 2020, recruitment of PWD required to achieve population increase over 5 years (estimate): 78
Priority Entitlements and Veterans
Appointments of Persons with a Priority Entitlement
From April 1, 2020, to Jun 30, 2021, OSFI has not appointed any persons with a priority entitlement (PPE).
Appointments of Persons with a Canadian Armed Forces (CAF) Priority Entitlement
Since the coming into force of the Veterans Hiring Act on July 1, 2015, until August 20, 2020, OSFI did not make any appointment of persons with a CAF Priority Entitlement.
Priority Clearance Requests
From April 1, 2020, to August 20, 2021, OSFI submitted 284 priority clearance requests.
| Priority Clearance Type | Amount | Percentage |
|---|---|---|
Internal advertised processes
|
49 5 1 |
17.2% 1.8% 0.4% |
| Internal non-advertised processes | 43 | 15.1% |
External advertised processes
|
135 17 0 |
47.5% 6% 0% |
| External non-advertised processes | 31 | 10.9% |
| Appointment of persons with a priority entitlement (includes term and indeterminate appointments) | 0 | 0% |
| Student bridging | 3 | 1.1% |
| Section 43 | 0 | 0% |
| Total | 284 | 100% |
Source: Priority Information Management System
COVID-19 Related Priority Clearance Requests
Since the Priority Entitlements Policy Division began monitoring priority entitlement clearances related to Covid-19, OSFI has not submitted any request to the PSC.
Persons with a Priority Entitlement
As of July 2, 2021, OSFI had 3 activated persons with priority entitlement in the Priority Information Management System.
Non-Partisanship in the Public Service
In the past five years, the PSC has not received any candidacy permission requests from employees of OSFI.
The results of the 2018 Staffing and Non-Partisanship Survey indicate that the level of awareness of employees at OSFI about their rights and responsibilities of participating in political activities is 75.1%, compared with 80.1% of the public service.
Recruitment Programs
Federal Internship Program for Canadians with Disabilities
OSFI is not currently participating in the Federal Internship Program for Canadians with Disabilities (FIPCD). The FIPCD is an excellent initiative to contribute to the Government of Canada’s Accessibility Strategy by having an intern and supporting them in skill development to increase their employability. The program also offers for a 50% salary reimbursement to hiring departments for the duration of the internship period. In addition, the program provides managers and interns with career coaching services and tools to support the interns’ development such as recommended training offered by the Canada School or Public Service.
Should OSFI wish to hire interns, they may contact the PSC to explore this option at: cfp.diversitedetalent-talentdiversity.psc@canada.ca
Employment Opportunity for Students with Disabilities / Indigenous Student Employment Opportunity
OSFI submitted five requests for referrals for students with disabilities and five for indigenous
students through FSWEP between April 30, 2020, and June 30, 2021. The Employment Opportunity for Students with Disabilities (EOSD) and the Indigenous Student Employment Opportunity (ISEO) are excellent recruitment options to increase diversity in the workplace by hiring students living with disabilities or indigenous students. Managers and students are provided with resources, such as onboarding tools, training, and networking events. The candidates from both these initiatives are available year-round in the FSWEP ongoing inventory.
- Number of available students in EOSD Footnote 1: 4,407
- Number of available students in ISEO Footnote 2: 2,067
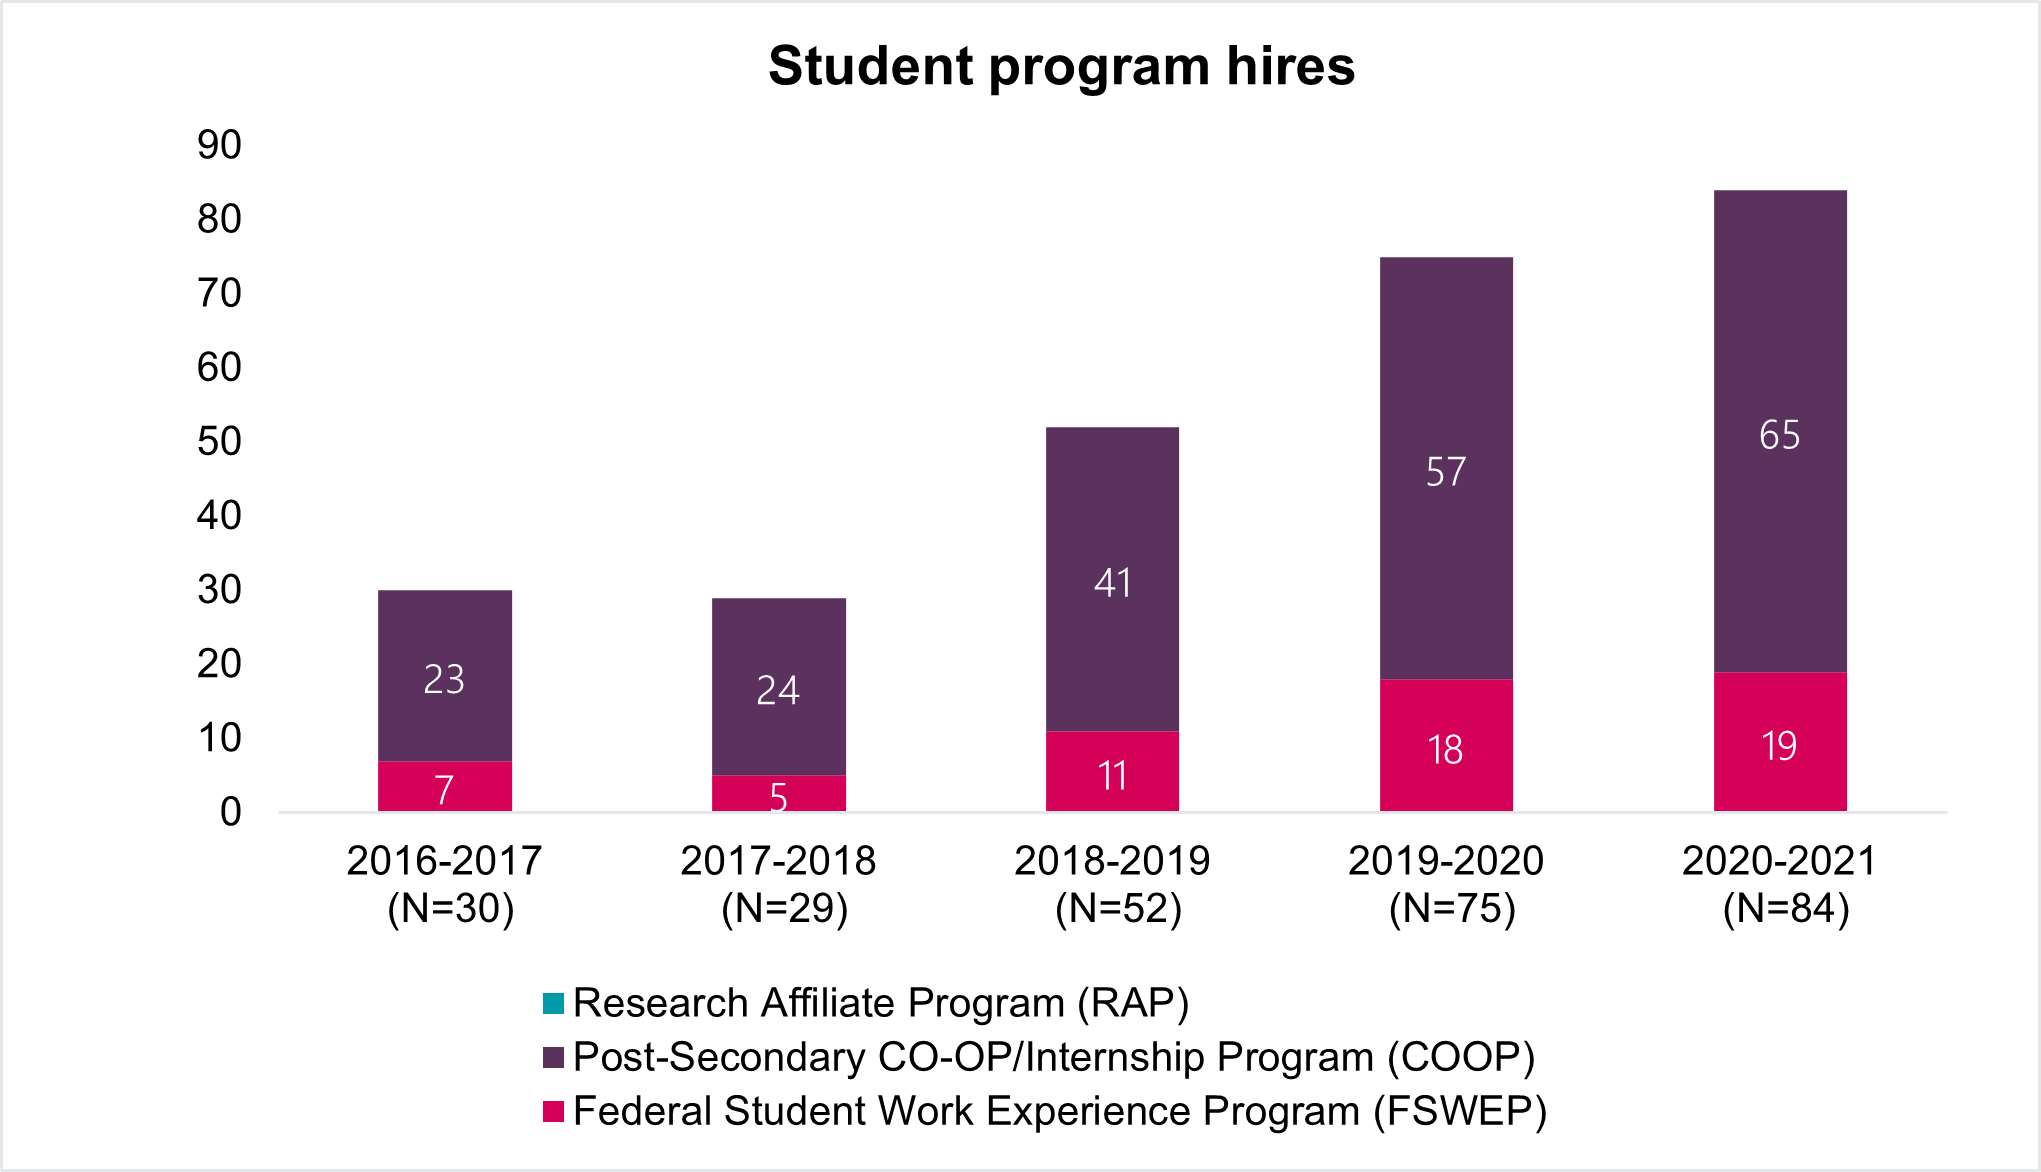
Federal Student Work Experience Program
OSFI has submitted 16 requests for referrals through FSWEP over the last year, between April 30, 2020, and June 30, 2021. Moreover, OSFI hired 53 students through the FSWEP program in the last 4 years. This program is an excellent way for an organization to renew its workforce and bring new energy, ideas, and approaches to its workplace. There are 68 335 Footnote 3 students available in this program.
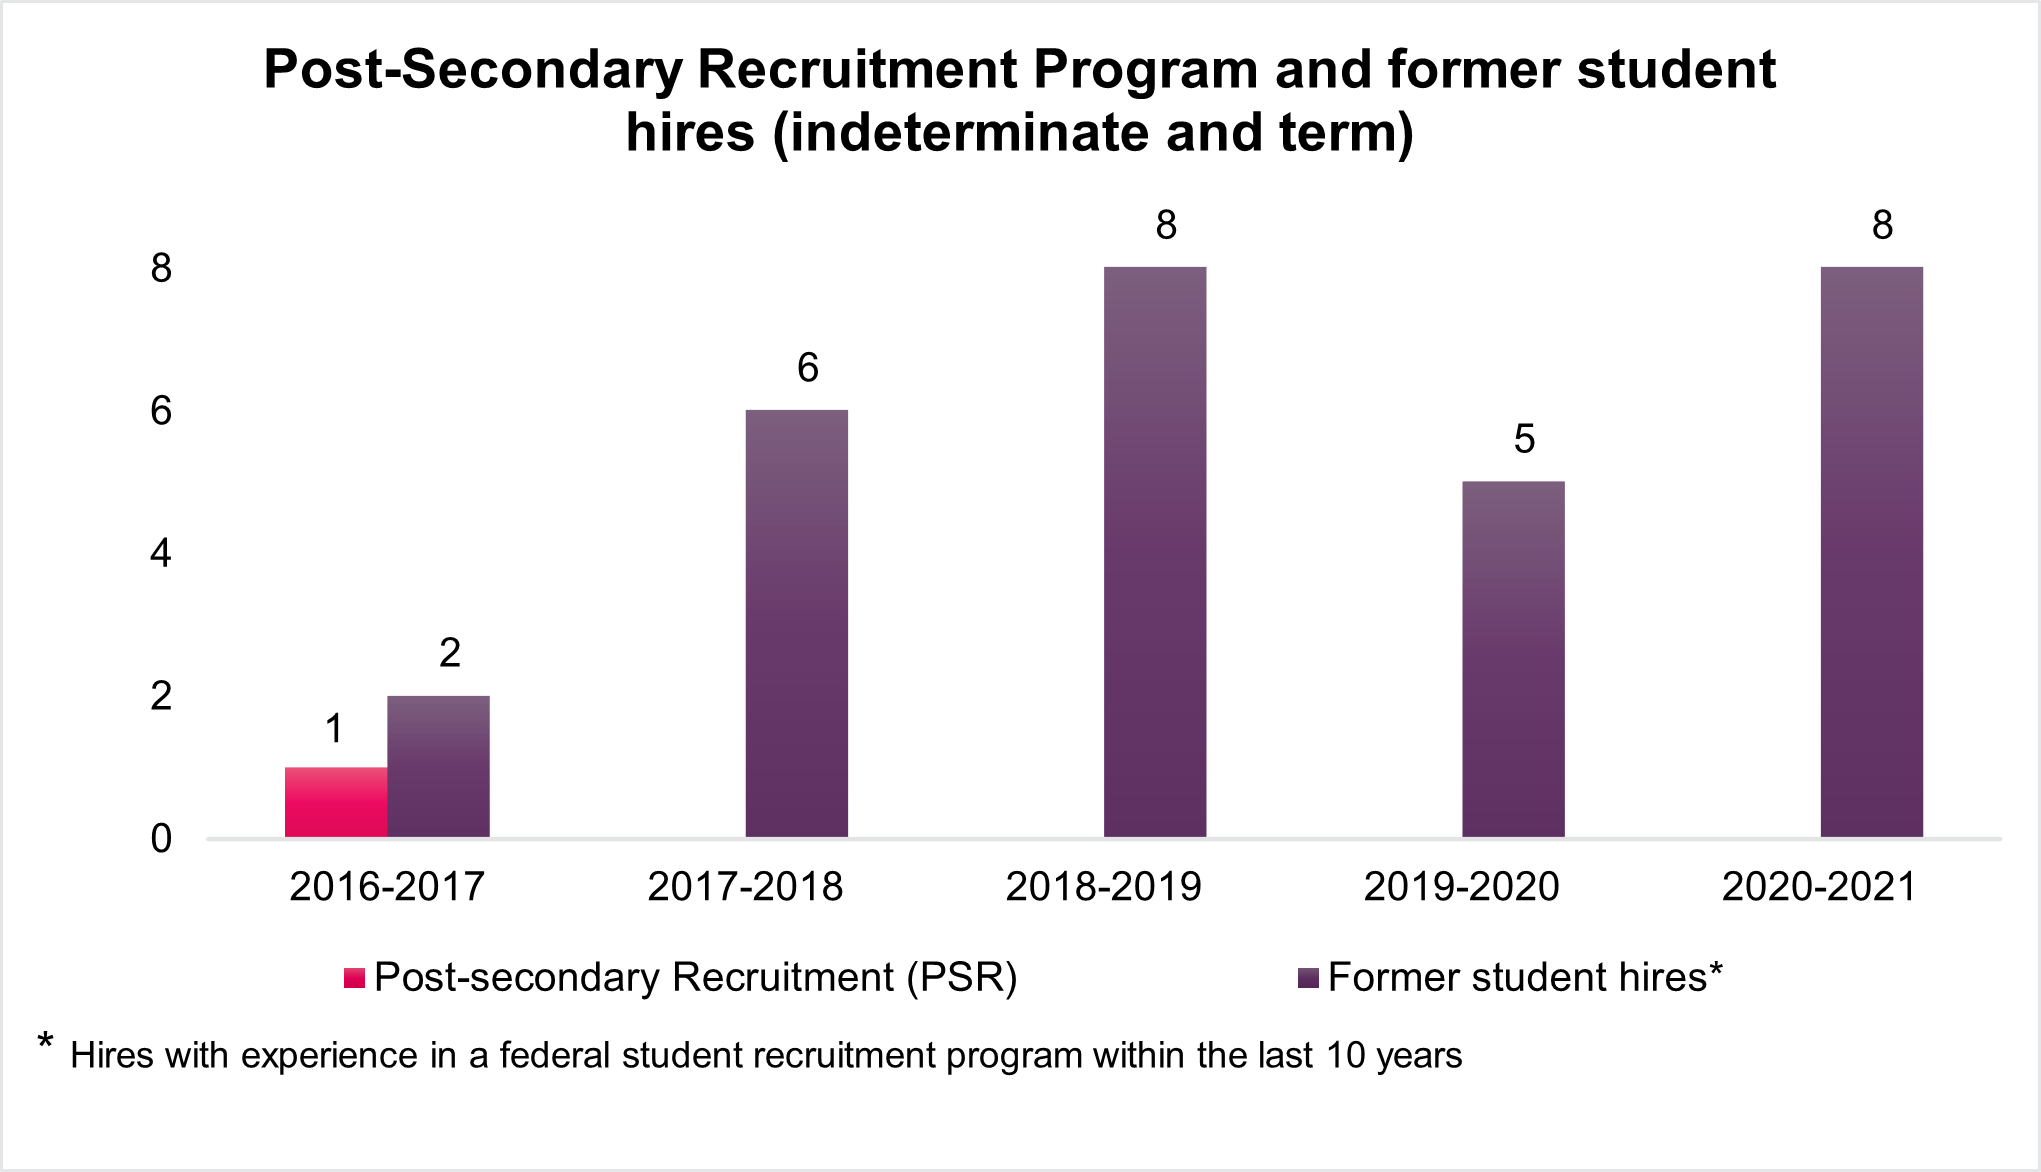
Post-Secondary Recruitment
For 2020-2021, OSFI has submitted, 4 requests for referrals from existing PSR inventories to staff a total of 4 positions in the Administrative Services (AS, PM) field, for which 17 candidates were referred.
Participation in Initiatives Related to the Hiring of Indigenous Peoples
Although the PSC has not collaborated with OSFI on specific initiatives, the Indigenous Career Pathway (ICP) is an initiative that may be of interest to them for the hiring of Indigenous People. They may contact the Aboriginal Centre of Expertise for more information.
The PSC’s Aboriginal Centre of Expertise and the Treasury Board Secretariat’s Office of the Chief Human Resources Officer have developed an ICP that may be of interest to OSFI. It provides information on indigenous recruitment, career progression, as well as development and retention:
- The Inventory of Indigenous Applicants facilitates the matching between hiring managers and candidates by sourcing indigenous talents from existing inventories of the PSC and proactively promoting their profiles to federal organizations. As of April 28, 2021, there were 20 students available.
- The Indigenous Recruitment Toolkit provides a repository of tools, resources and advice on indigenous recruitment, outreach, and initiatives that PSC and other departments offer.
More information about the Indigenous recruitment programs is available on the Indigenous recruitment – Information for hiring managers website.
Staffing Support
Public Service Commission Representatives and Organizational Contacts
The Staffing Support Advisor (SSA) assigned to this organization is Daniel Morin, the primary organizational contact(s) is Dominique Martel, Manager, Corporate HR Policy and Programs and the Head of HR is Natalie Harrington, Managing Director, Human Resources and Administration.
PREPARED BY:
Yannick Fortin,
Staffing Support Advisor
APPROVED BY:
Approved by Lynn Brault
Director General, Staffing Support, Priorities and Political Activities Directorate,
Policy and Communications Sector
Approved by Gaveen Cadotte
Vice-President, Policy and Communications Sector
Annex A
Highlights for deputy heads
A New Direction in Staffing – A Merit-Based System That is Effective, Efficient and Fair
Appointment Policy
New focus on core requirements to provide sub-delegated persons with greater discretion in making an appointment
- One Appointment Policy, no duplication of legal requirements
- Broader focus on values-based system, away from rules-based system
- Appointment Policy supported by streamlined guidance:
- A roadmap to the legislative, regulatory and policy requirements
- Options and considerations for decision-making where there is discretion
- Clear expectations for priority entitlements
- No restrictions on assessment methods for EX appointments
- Exceptions to National Area of Selection approved by deputy head
Delegation
- New ability to customize organizational staffing system based on unique context and evolving business needs
- Deputy heads establish a direction on the use of advertised and non-advertised appointment processes
- Deputy heads to establish requirement(s) for sub-delegated persons to articulate, in writing, their selection decision
- Clarity on requirements related to investigations
- Attestation form to reinforce the accountabilities of sub-delegated persons
All PSC monitoring and reporting requirements now found in the Appointment Delegation and Accountability Instrument
Monitoring and Reporting
Monitoring built by organizations, targeted to their needs
- Annual Departmental Staffing Accountability Report no longer required
- Annual reporting to the PSC limited to:
- Use of Public Service Official Language Exclusion Approval Order
- Exceptions to the National Area of Selection approved by the deputy head
- Results of any internal investigations
- Actions taken following any PSC investigations or audits.
- Deputy head responsible for ongoing monitoring of organizational staffing system based on the organization’s unique context
- Assessment of adherence to requirements, based on organization’s own risks, every five years, at a minimum.
PSC Oversight
System-wide focus
- Government-wide compliance audit every two years
- Renewed Survey of Staffing administered in alternating years with government-wide audit
- System-wide effectiveness and efficiency reviews to support continuous improvement
- Targeted PSC audits as a result of identified system-wide or organizational risks or at the request of the deputy head
- Investigations conducted when there is reason to believe there was political influence, fraud, or improper conduct in an appointment process
This document should be read in conjunction with the Public Service Employment Act, the Public Service Employment Regulations, the PSC Appointment Policy and the PSC Appointment Delegation and Accountability Instrument.
Annex B

Text Alternative
| Year | Indeterminate population | Term population | Casual population | Student population | Total population |
|---|---|---|---|---|---|
| As of March 31, 2016 | 627 | 25 | 9 | 5 | 666 |
| As of March 31, 2017 | 649 | 19 | 9 | 12 | 689 |
| As of March 31, 2018 | 679 | 18 | 9 | 12 | 718 |
| As of March 31, 2019 | 719 | 21 | 6 | 21 | 767 |
| As of March 31, 2020 | 788 | 19 | 10 | 30 | 847 |
| As of March 31, 2021 | 837 | 26 | 6 | 33 | 902 |
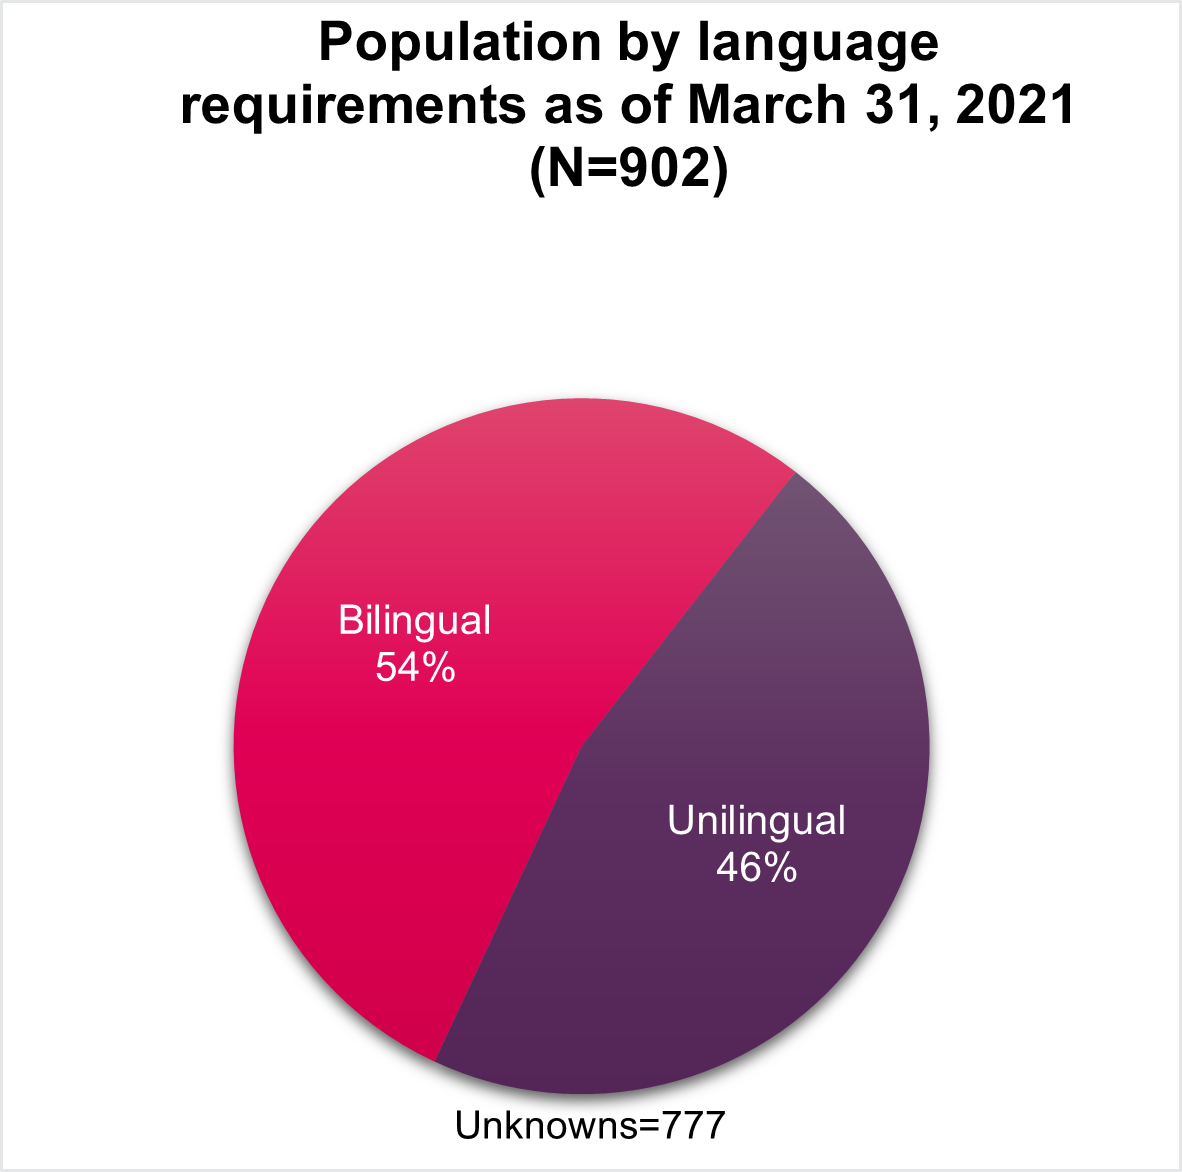
Text Alternative
| Linguistic requirements of the position | Population as of March 31, 2021 | Percentage of population as of March 31, 2021 |
|---|---|---|
| Bilingual | 67 | 54% |
| Unilingual | 58 | 46% |
| Unknowns | 777 | Not Applicable |
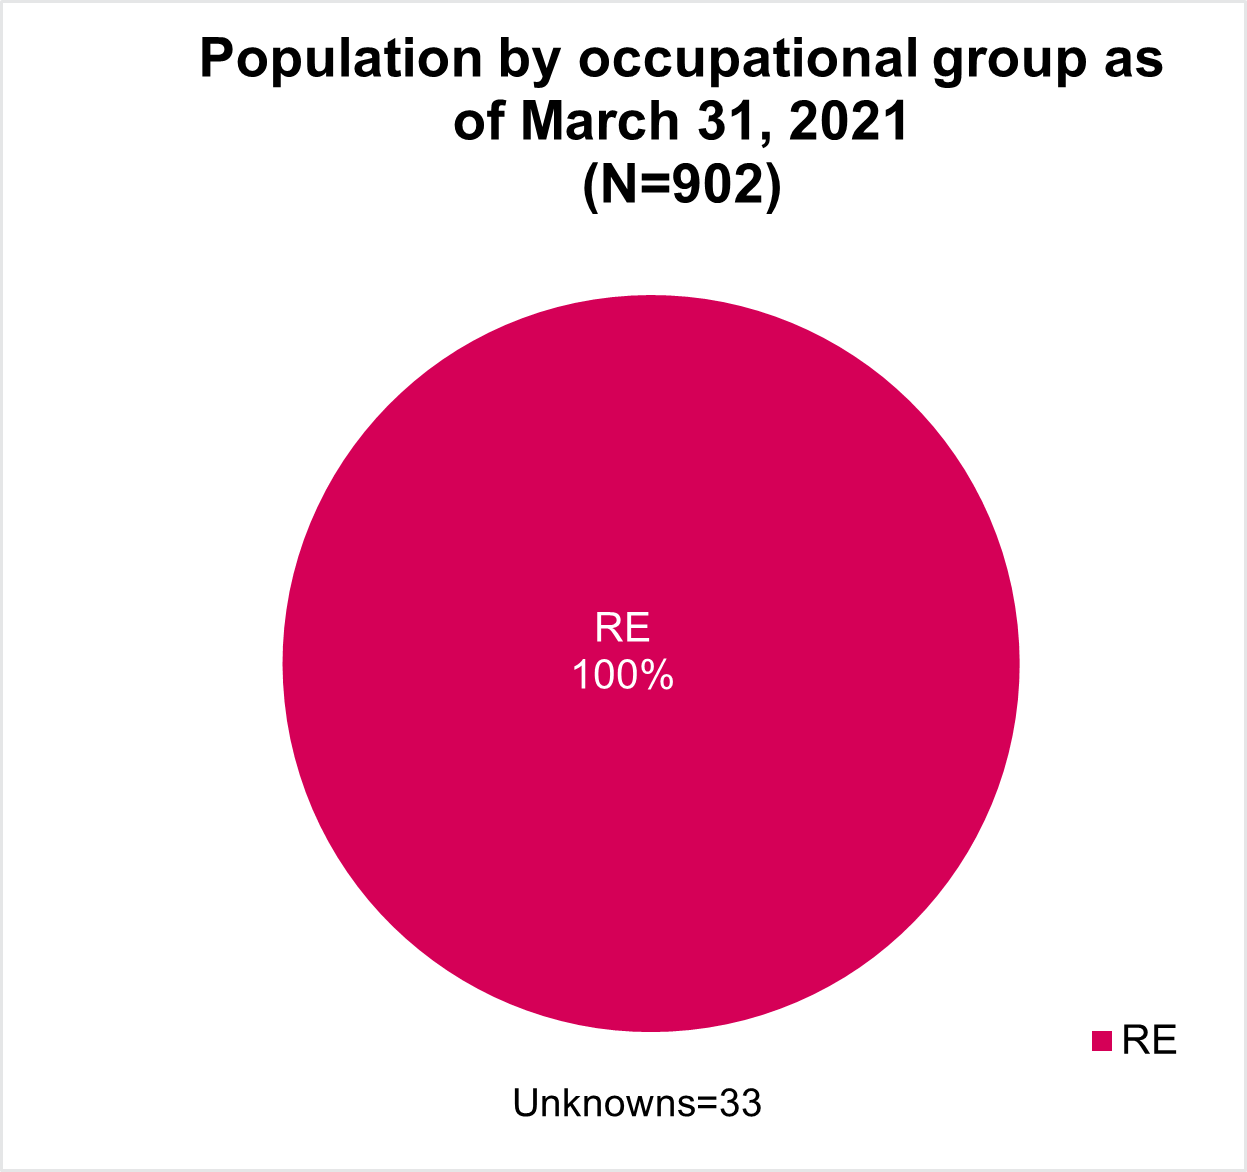
Text Alternative
| Occupational group | Population as of March 31, 2021 | Percentage of population as of March 31, 2021 |
|---|---|---|
| RE – Regulatory Enforcement Group | 869 | 100% |
| Unknowns | 33 | Not Applicable |
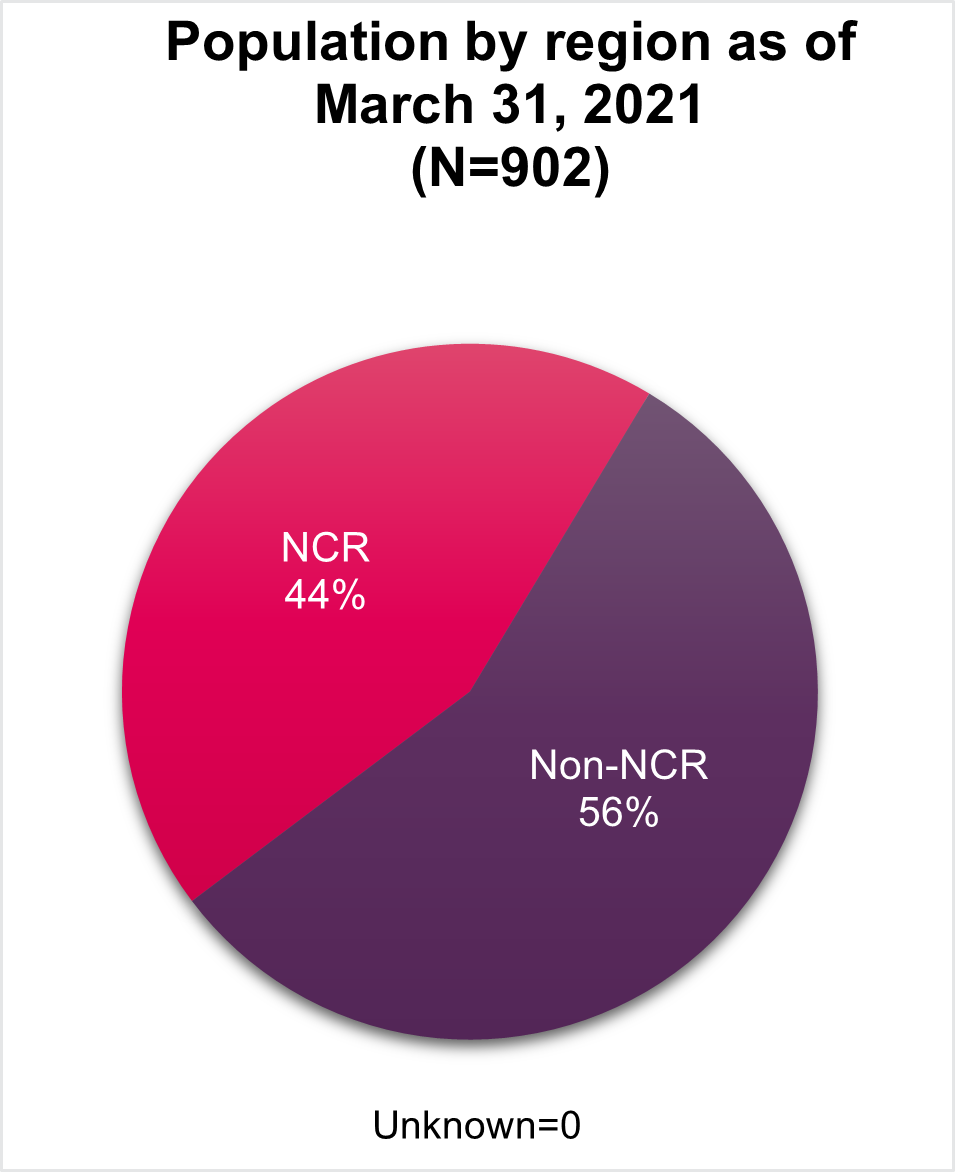
Text Alternative
| Region | Population as of March 31, 2021 | Percentage of population as of March 31, 2021 |
|---|---|---|
| National Capital Region (NCR) | 396 | 44% |
| Non-NCR | 506 | 56% |
| Unknown | 0 | Not Applicable |
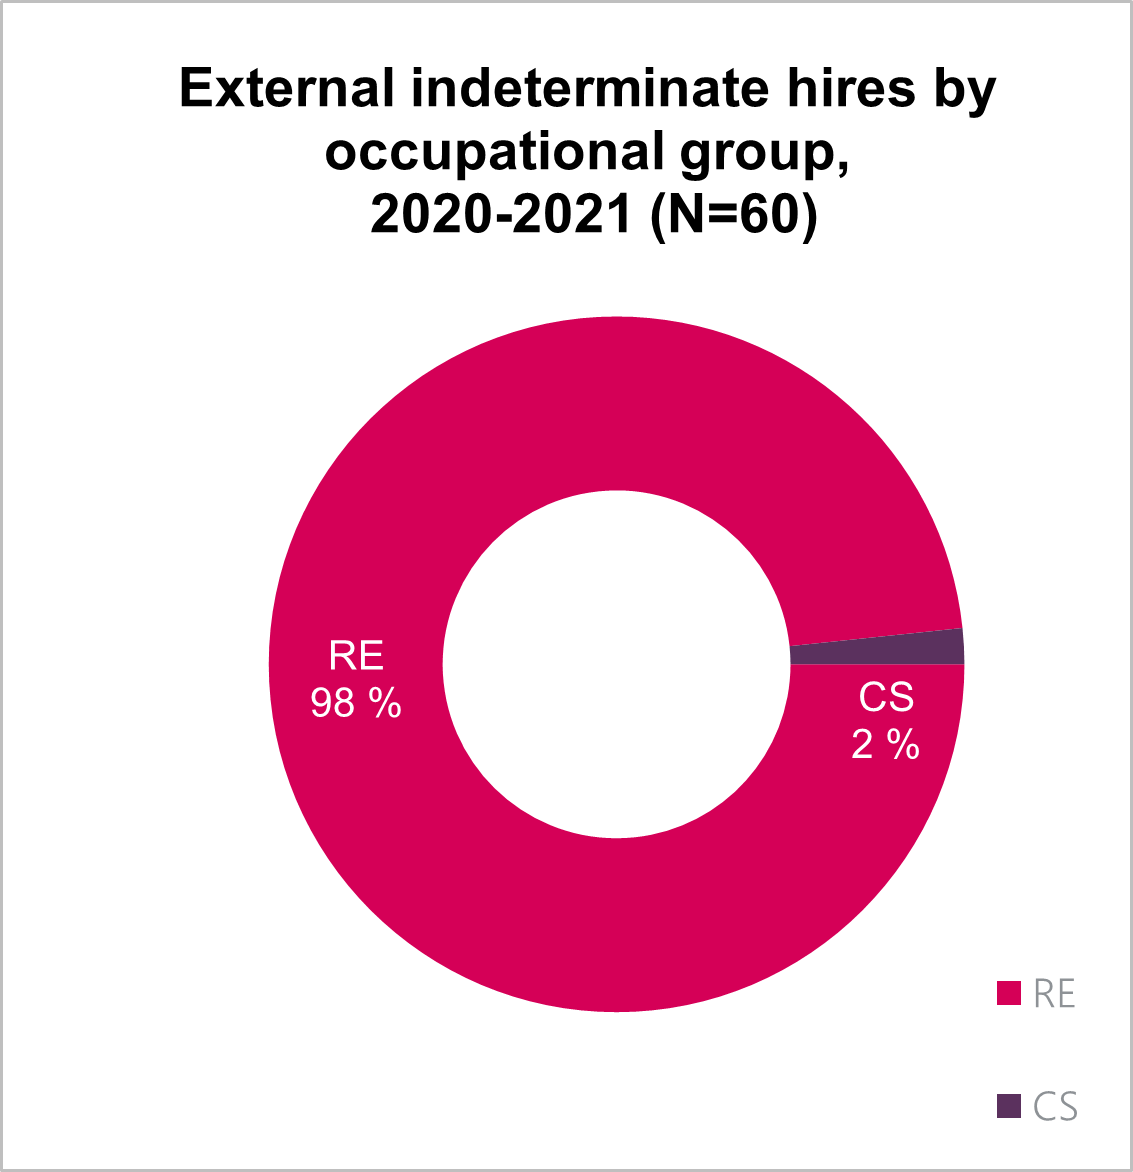
Text Alternative
| Occupational group | Number of indeterminate hiring activities | Percentage of all indeterminate hiring activities |
|---|---|---|
| RE – Regulatory Enforcement Group | 59 | 98% |
| CS – Computer Systems | 1 | 2% |
| Other | 0 | 0% |
| Total | 60 | 100% |
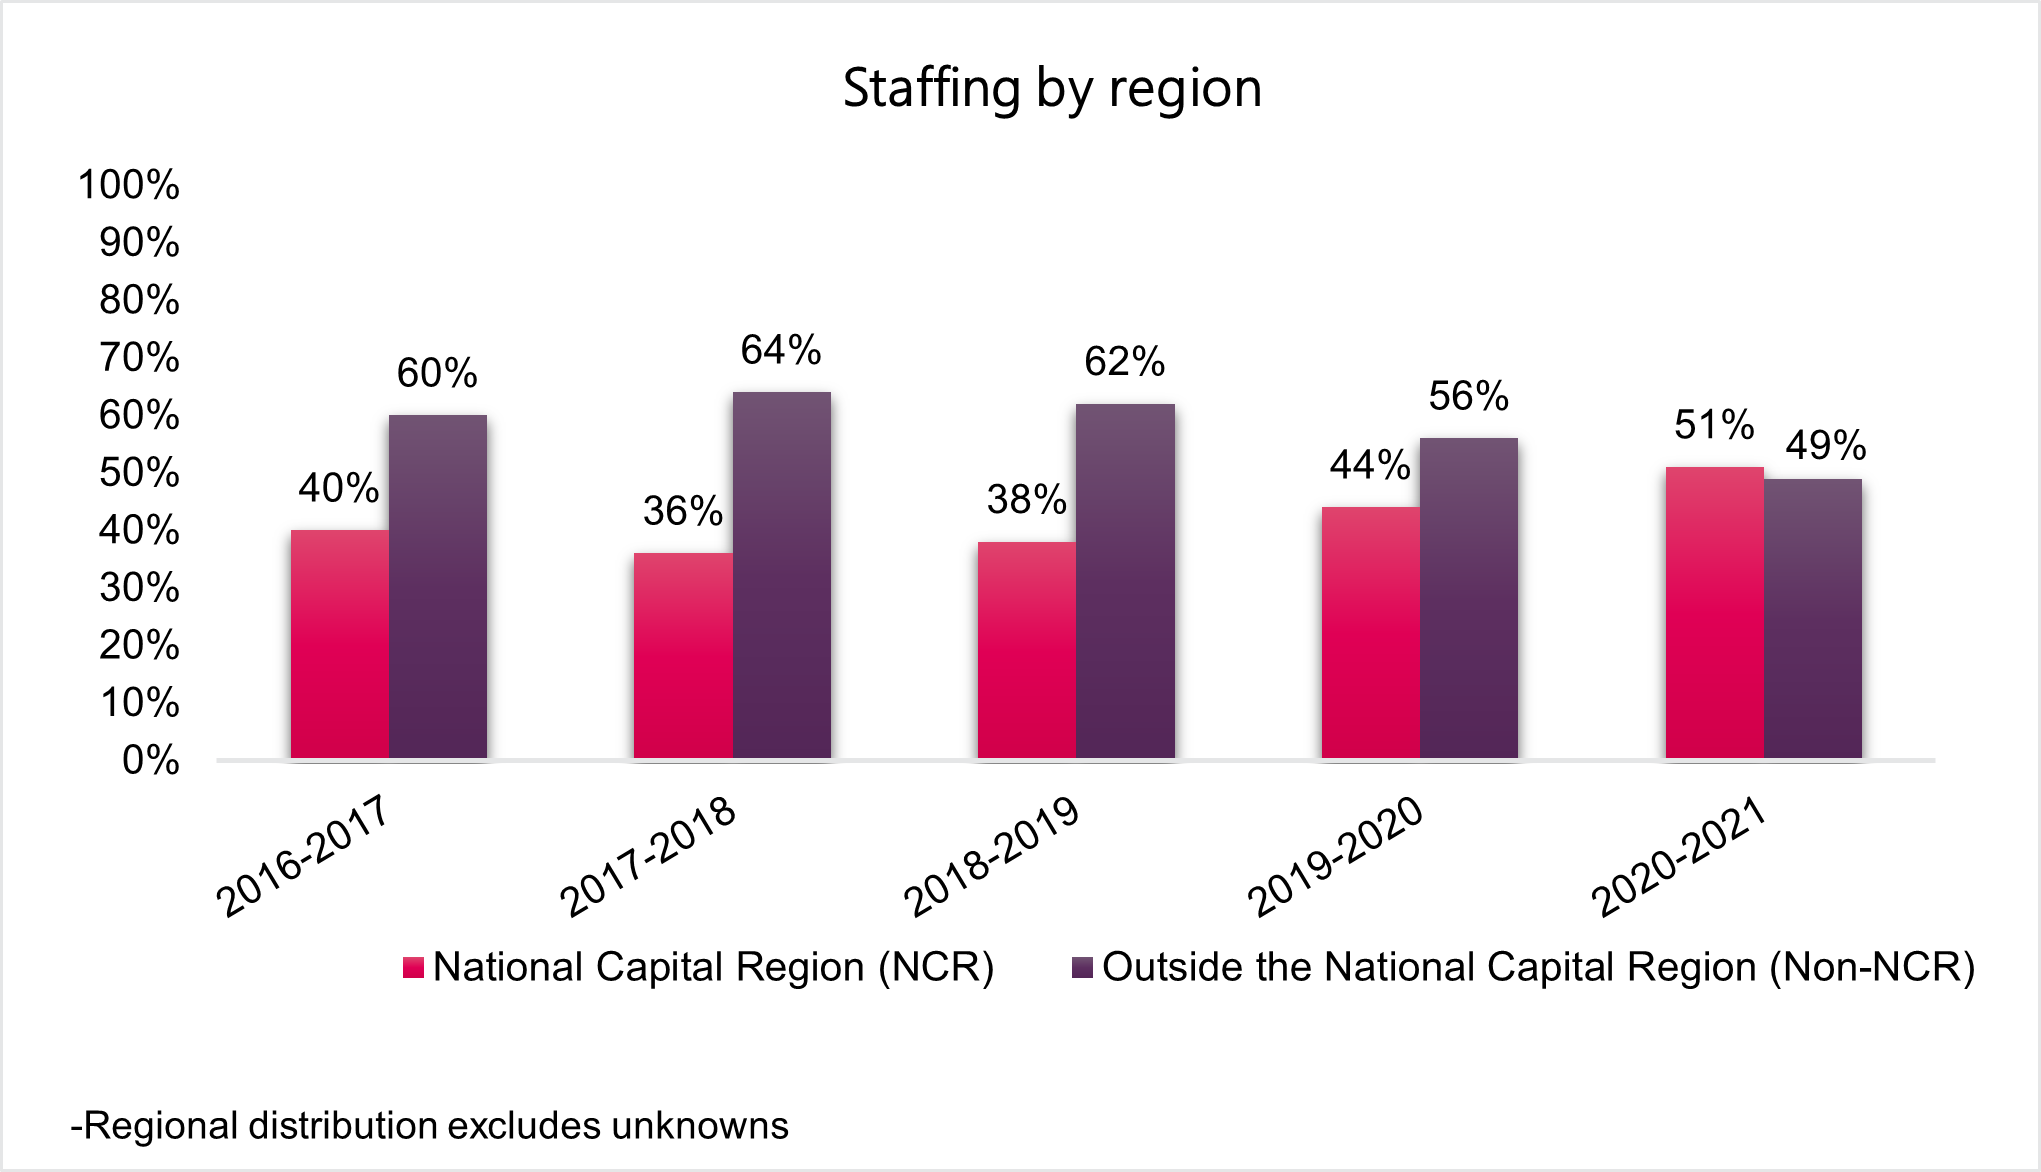
Text Alternative
| Fiscal year | Percentage of staffing activities in the National Capital Region (NCR) * | Percentage of staffing activities in all other regions (Non-NCR) * |
|---|---|---|
| 2016-2017 | 40% | 60% |
| 2017-2018 | 36% | 64% |
| 2018-2019 | 38% | 62% |
| 2019-2020 | 44% | 56% |
| 2020-2021 | 51% | 49% |
* Regional distribution excludes unknowns
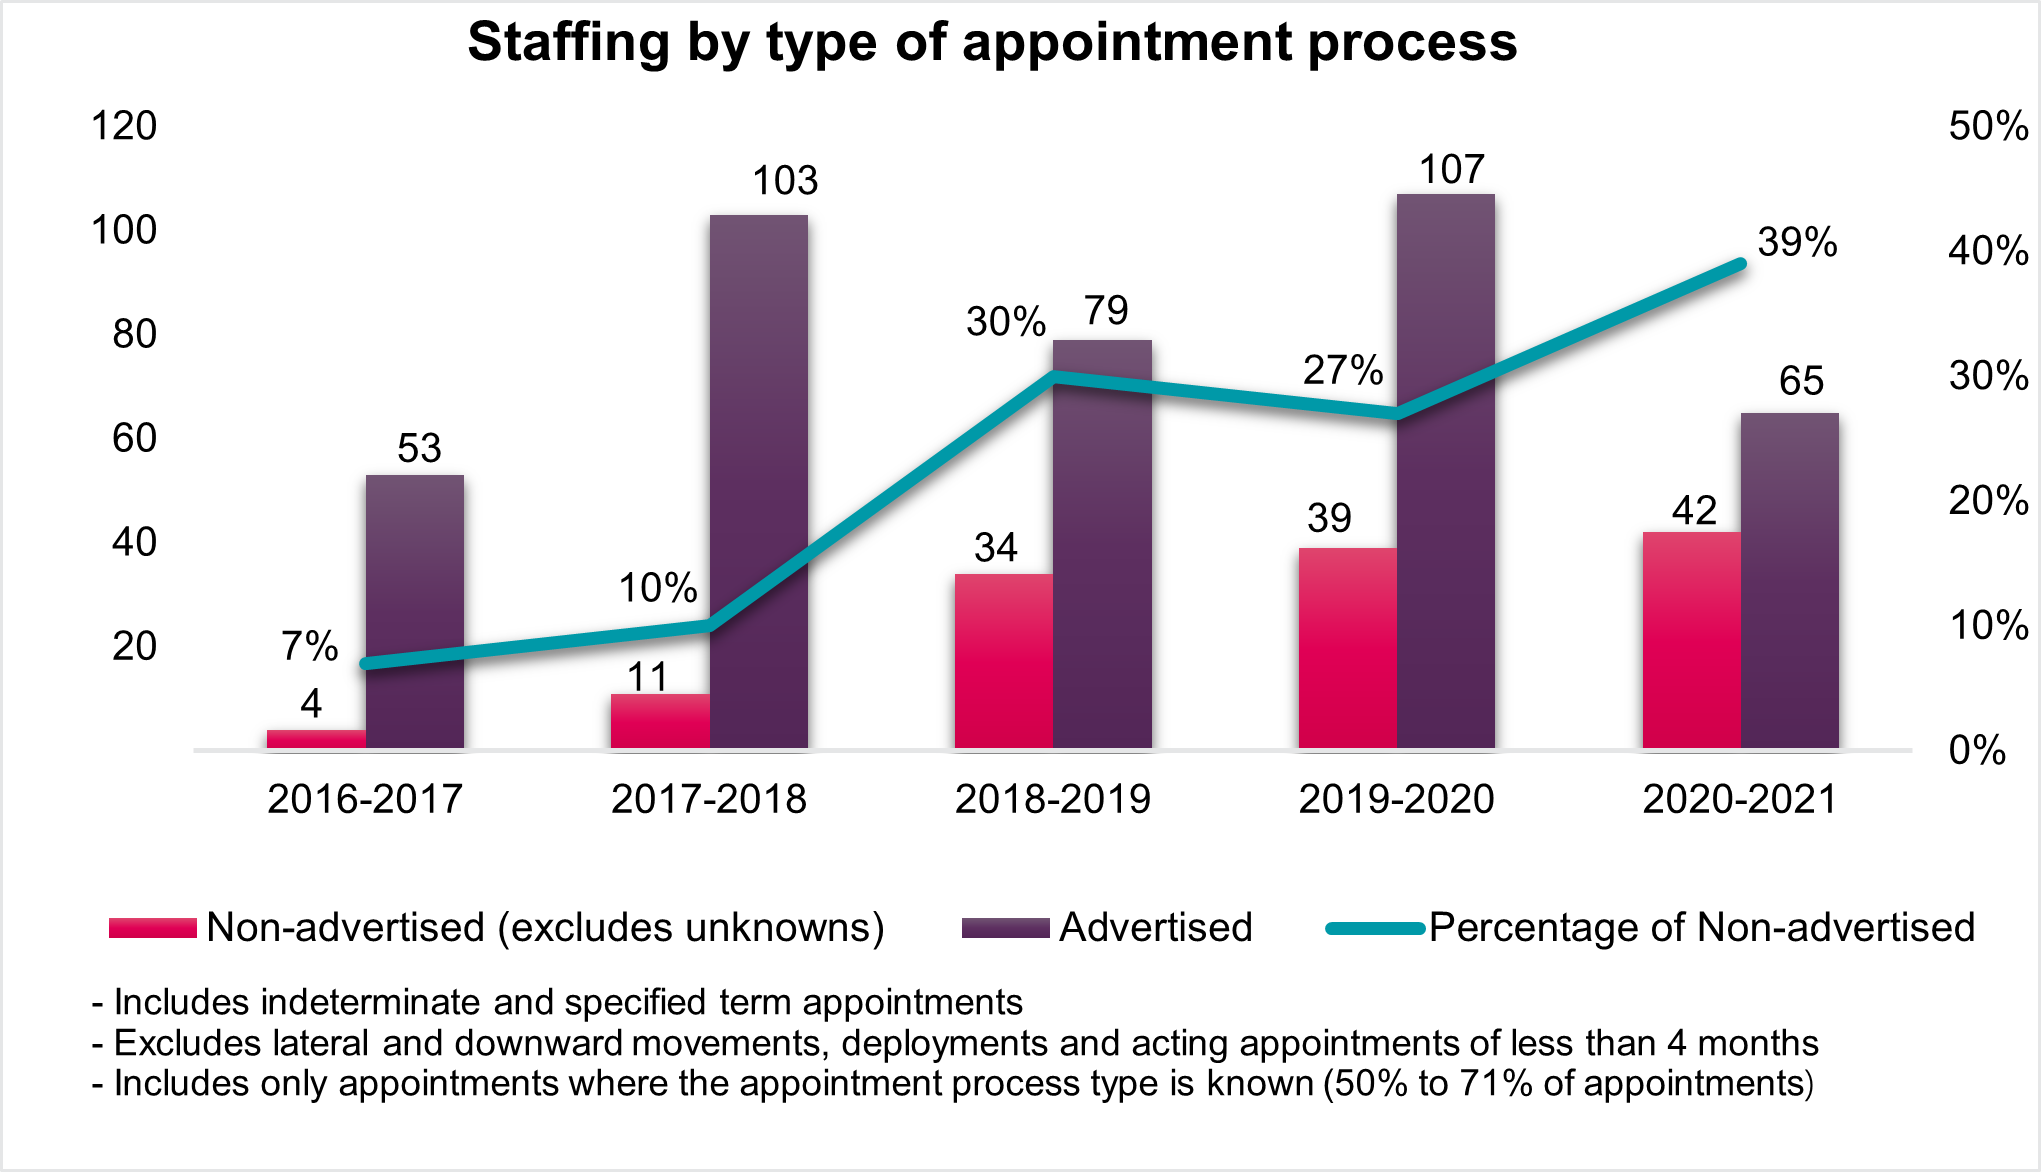
Text Alternative
| Fiscal year | Non-advertised appointments (excludes unknowns) | Advertised appointments | Percentage of Non-advertised appointments |
|---|---|---|---|
| 2016-2017 | 4 | 53 | 7% |
| 2017-2018 | 11 | 103 | 10% |
| 2018-2019 | 34 | 79 | 30% |
| 2019-2020 | 39 | 107 | 27% |
| 2020-2021 | 42 | 65 | 39% |
- Includes indeterminate and specified term appointments
- Excludes lateral and downward movements, deployments, and acting appointments of less than 4 months
- Includes only appointments where the appointment process type is known (50% to 71% of appointments)
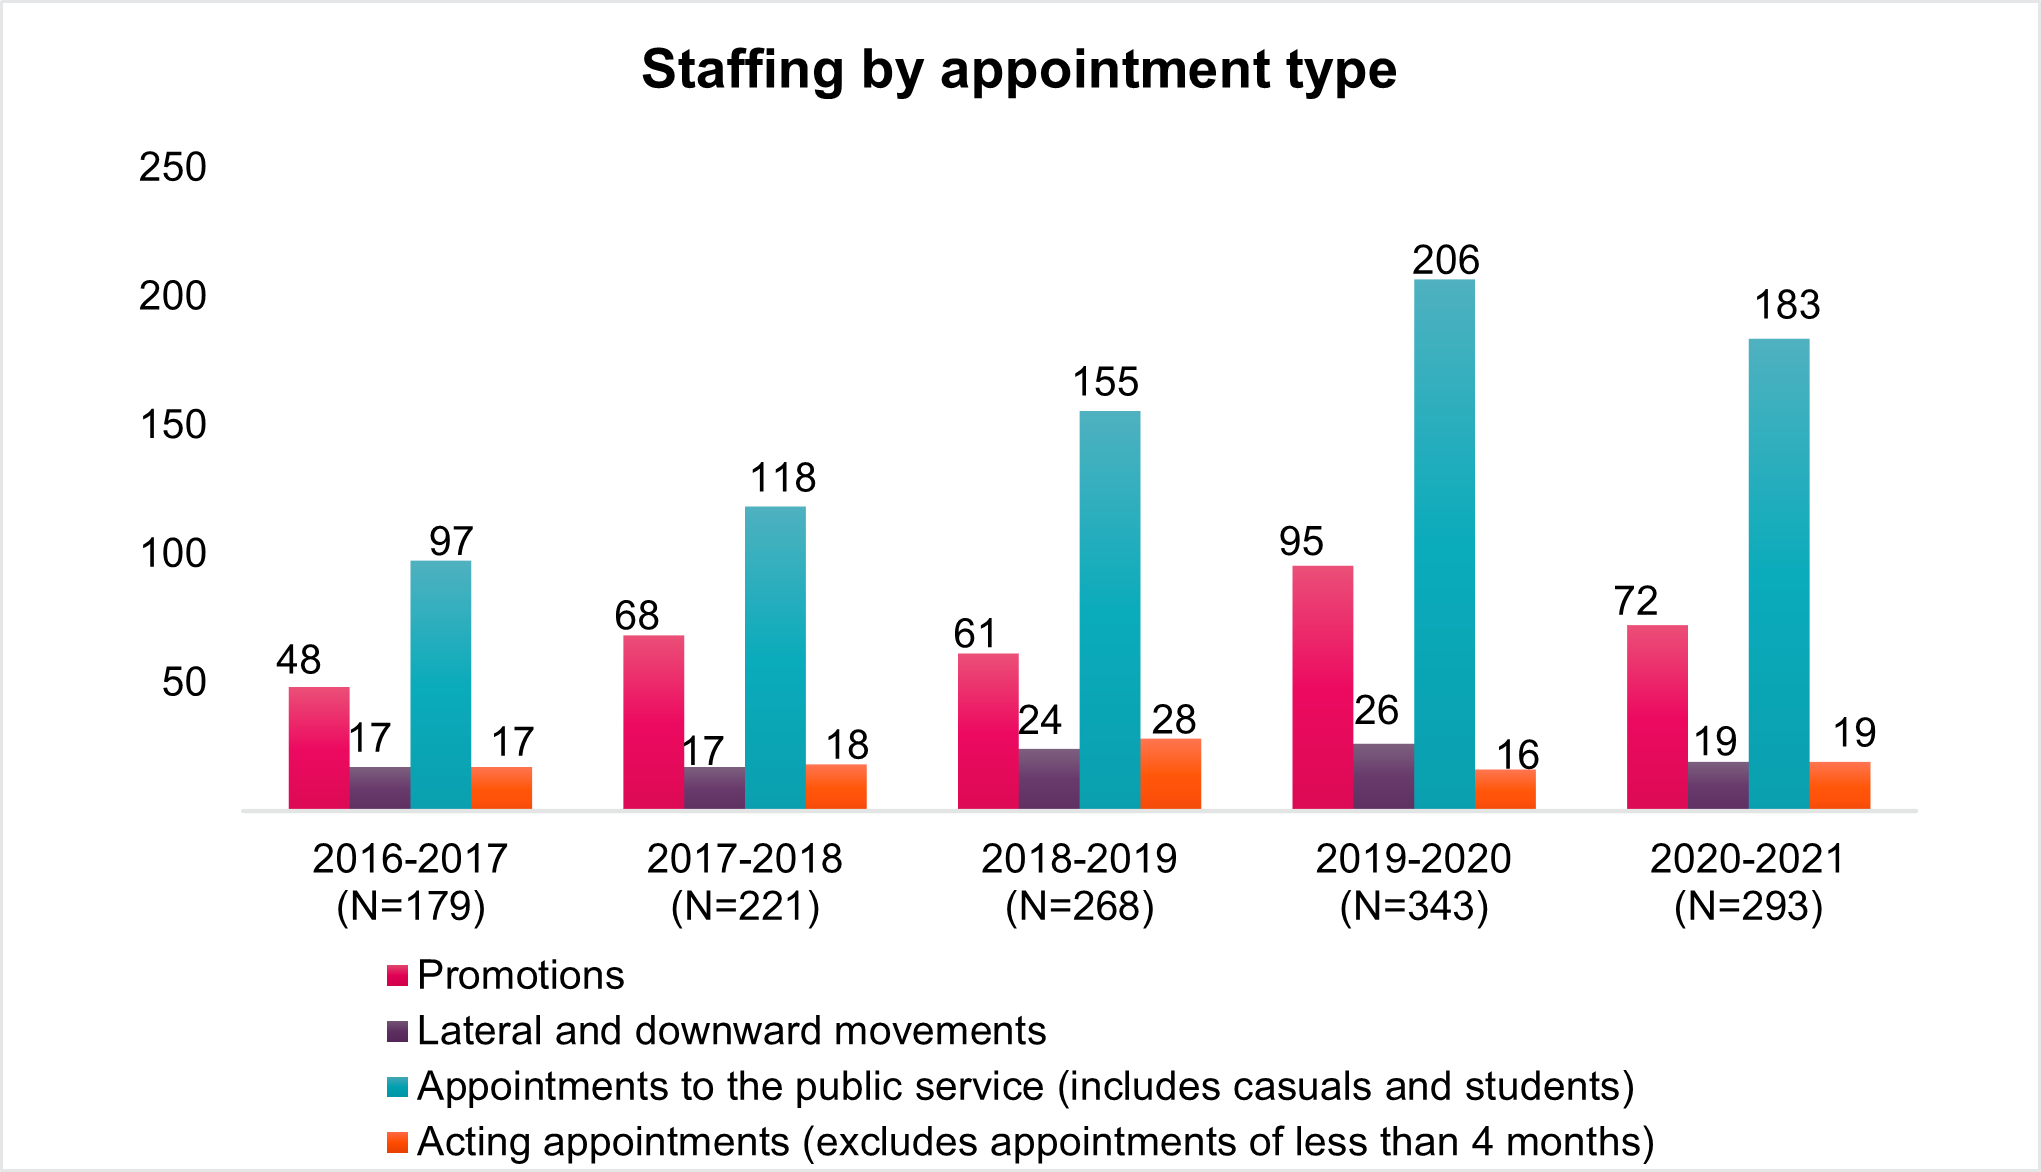
Text Alternative
| Fiscal year | Promotions | Lateral and downward movements | Appointments to the public service (includes casuals and students) | Acting appointments (excludes appointments of less than 4 months) | Total |
|---|---|---|---|---|---|
| 2016-2017 | 48 | 17 | 97 | 17 | 179 |
| 2017-2018 | 68 | 17 | 118 | 18 | 221 |
| 2018-2019 | 61 | 24 | 155 | 28 | 268 |
| 2019-2020 | 95 | 26 | 206 | 16 | 343 |
| 2020-2021 | 72 | 19 | 183 | 19 | 293 |
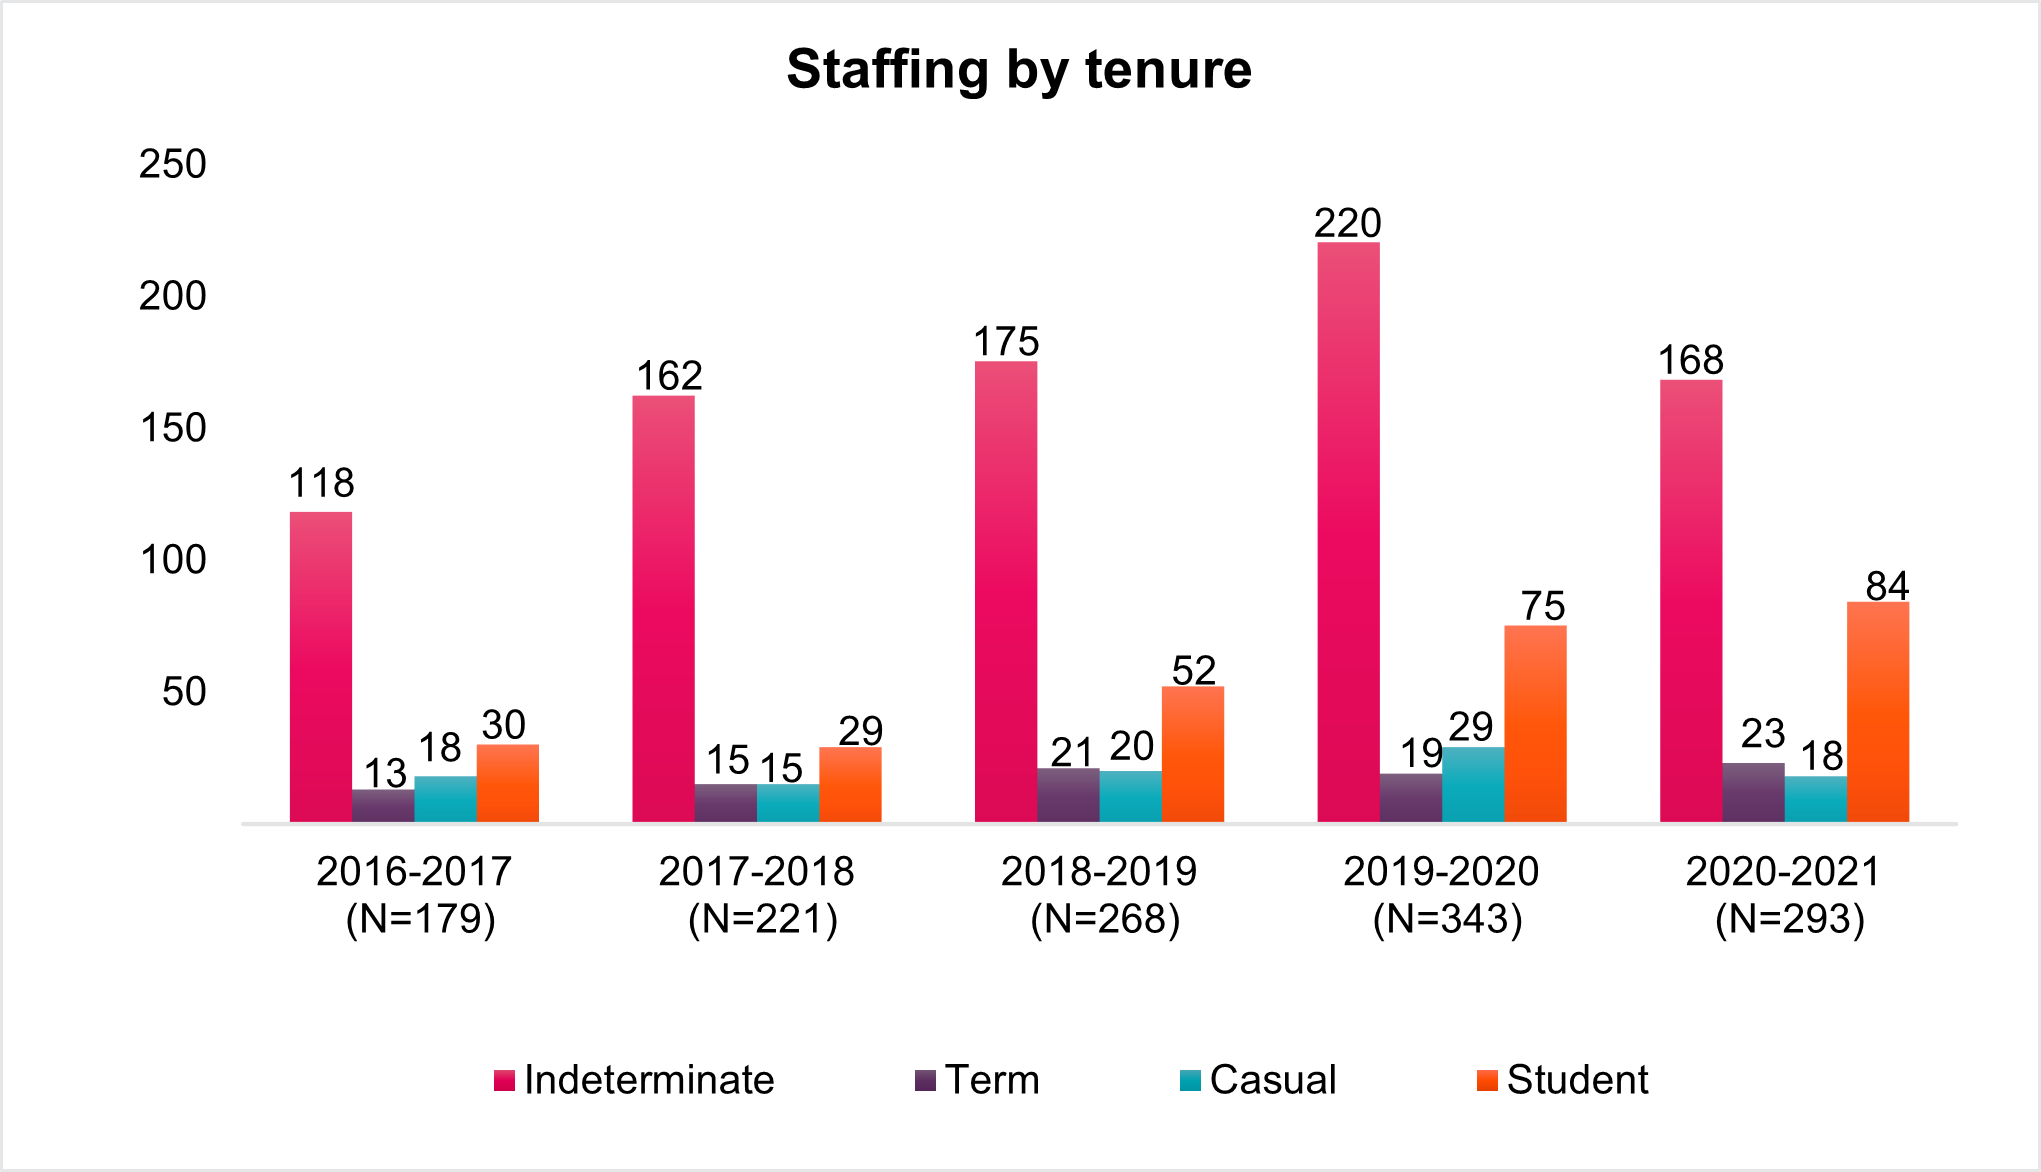
Text Alternative
| Fiscal year | Indeterminate staffing activities | Term staffing activities | Casual staffing activities | Student staffing activities | Total staffing activities |
|---|---|---|---|---|---|
| 2016-2017 | 118 | 13 | 18 | 30 | 179 |
| 2017-2018 | 162 | 15 | 15 | 29 | 221 |
| 2018-2019 | 175 | 21 | 20 | 52 | 268 |
| 2019-2020 | 220 | 19 | 29 | 75 | 343 |
| 2020-2021 | 168 | 23 | 18 | 84 | 293 |
Key findings - Staffing and non-partisanship survey (2018)
- 67.9% of employees agreed that people hired can do the job, compared to 67.6% in organizations of similar size, and 53.8% in the federal public service
- 44.6% of managers agreed that the New Direction in Staffing has improved the way they hire and appoint persons to and within their organization, compared to 69.4% in organizations of similar size, and 56.1% in the federal public service
- 86.8% of managers agreed that within their organization, the administrative to staff a position is burdensome, compared to 84.0% in organizations of similar size, and 87.9% in the federal public service.
Text Alternative
| Fiscal year | Federal Student Work Experience Program | Post-Secondary Co-op/Internship Program | Research Affiliate Program | Total |
|---|---|---|---|---|
| 2016-2017 | 7 | 23 | 0 | 30 |
| 2017-2018 | 5 | 24 | 0 | 29 |
| 2018-2019 | 11 | 41 | 0 | 52 |
| 2019-2020 | 18 | 57 | 0 | 75 |
| 2020-2021 | 19 | 65 | 0 | 84 |
Text Alternative
| Fiscal year | Post-secondary Recruitment (PSR) | Former student hires* |
|---|---|---|
| 2016-2017 | 1 | 2 |
| 2017-2018 | 0 | 6 |
| 2018-2019 | 0 | 8 |
| 2019-2020 | 0 | 5 |
| 2020-2021 | 0 | 8 |
*Hiring of former students includes indeterminate and term hires with experience in a federal student recruitment program within the last 10 years.
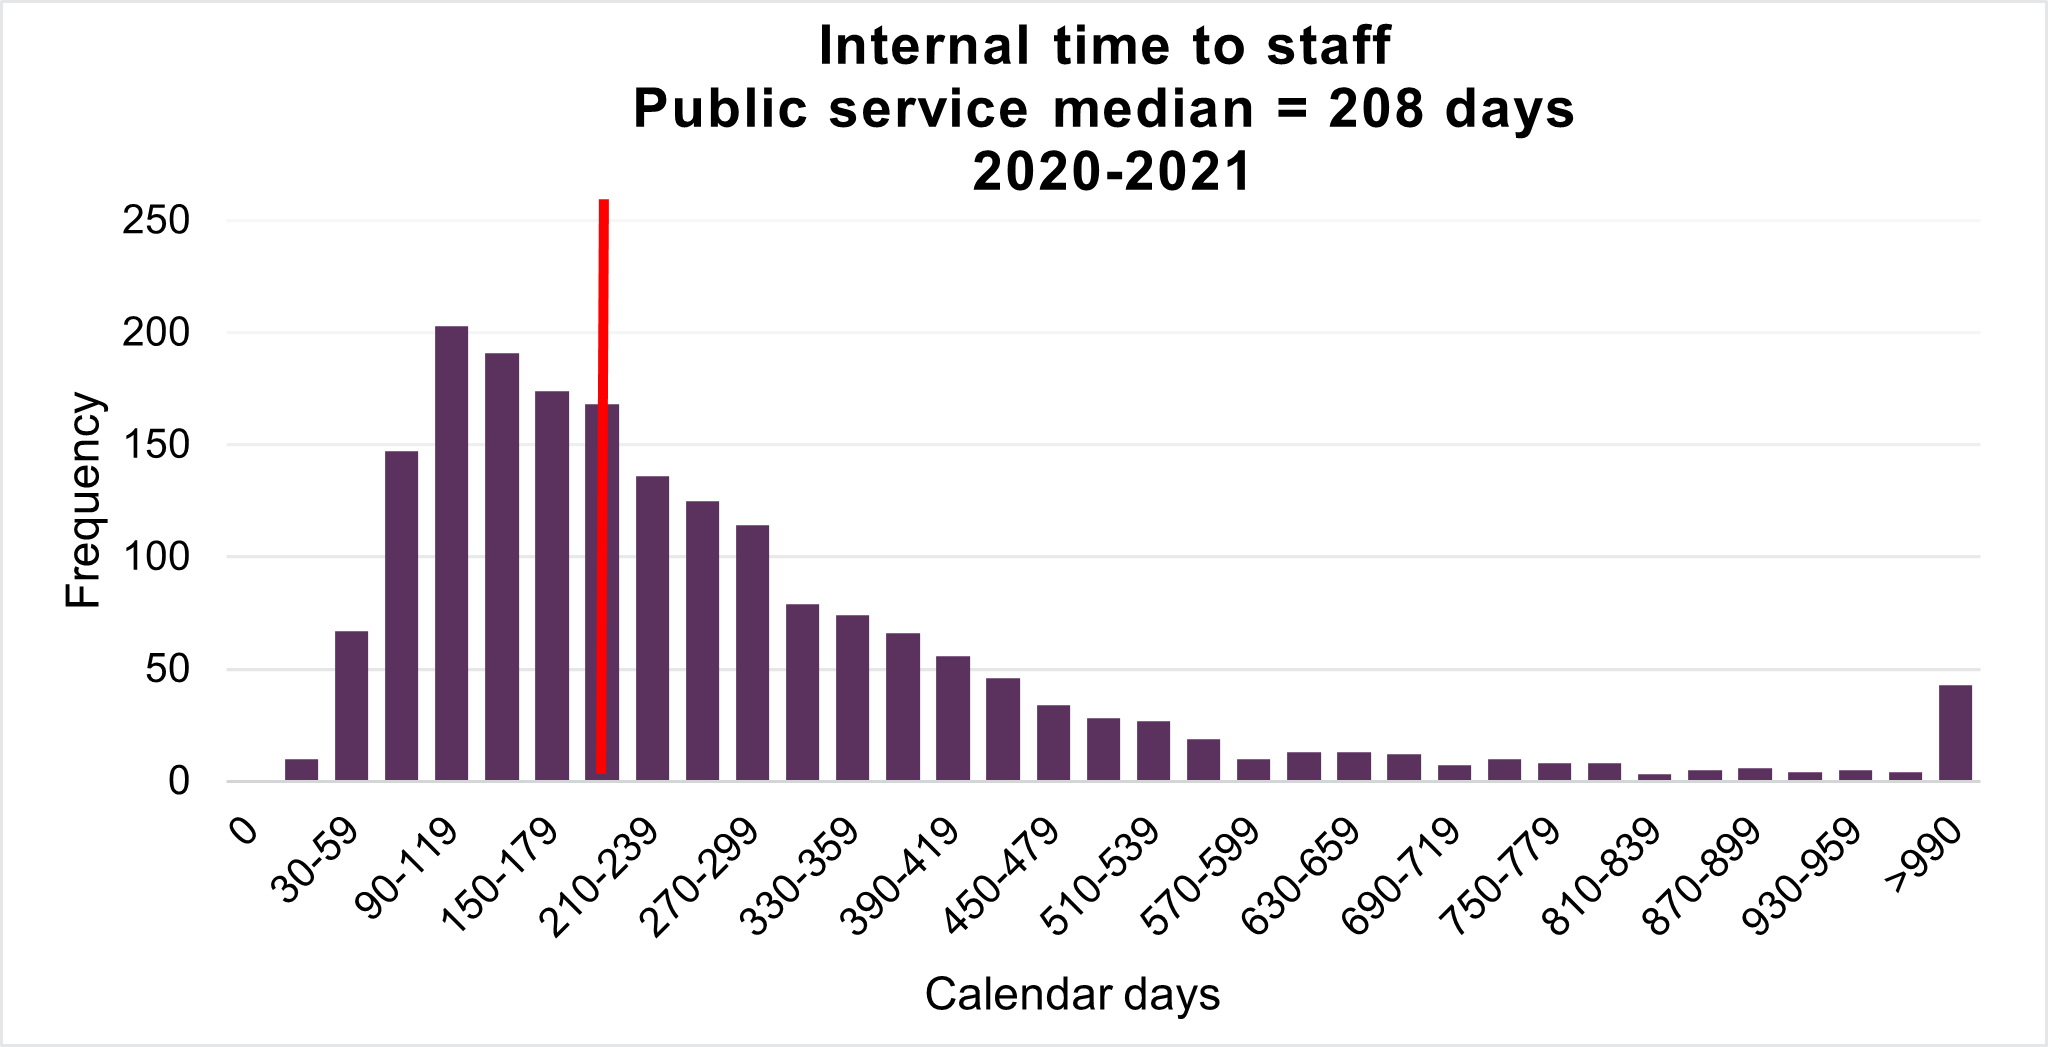
Internal time to staff
Internal time to staff is calculated as the number of calendar days between the opening date of the advertisement and the date of the first notification.
Internal time to staff for fiscal year 2020-2021
The median internal time to staff for the public service (organizations subject to the Public Service Employment Act) for fiscal year 2020-2021 is 208 days. The data is insufficient for providing results on external process times for the Office of the Superintendent of Financial Institutions.
Text Alternative
| Number of calendar days | The number of internal appointments for which the TTS-IA was within the specified number of calendar days for organizations subject to the Public Service Employment Act |
|---|---|
| 0 calendar days | 0 |
| 0 to 29 calendar days | 10 |
| 30 to 59 calendar days | 67 |
| 60 to 89 calendar days | 147 |
| 90 to 119 calendar days | 203 |
| 120 to 149 calendar days | 191 |
| 150 to 179 calendar days | 174 |
| 180 to 209 calendar days | 168 |
| 210 to 239 calendar days | 136 |
| 240 to 269 calendar days | 125 |
| 270 to 299 calendar days | 114 |
| 300 to 329 calendar days | 79 |
| 330 to 359 calendar days | 74 |
| 360 to 389 calendar days | 66 |
| 390 to 419 calendar days | 56 |
| 420 to 449 calendar days | 46 |
| 450 to 479 calendar days | 34 |
| 480 to 509 calendar days | 28 |
| 510 to 539 calendar days | 27 |
| 540 to 569 calendar days | 19 |
| 570 to 599 calendar days | 10 |
| 600 to 629 calendar days | 13 |
| 630 to 659 calendar days | 13 |
| 660 to 689 calendar days | 12 |
| 690 to 719 calendar days | 7 |
| 720 to 749 calendar days | 10 |
| 750 to 779 calendar days | 8 |
| 780 to 809 calendar days | 8 |
| 810 to 839 calendar days | 3 |
| 840 to 869 calendar days | 5 |
| 870 to 899 calendar days | 6 |
| 900 to 929 calendar days | 3 |
| 930 to 959 calendar days | 2 |
| 960 to 989 calendar days | 2 |
| More than 990 calendar days | 36 |
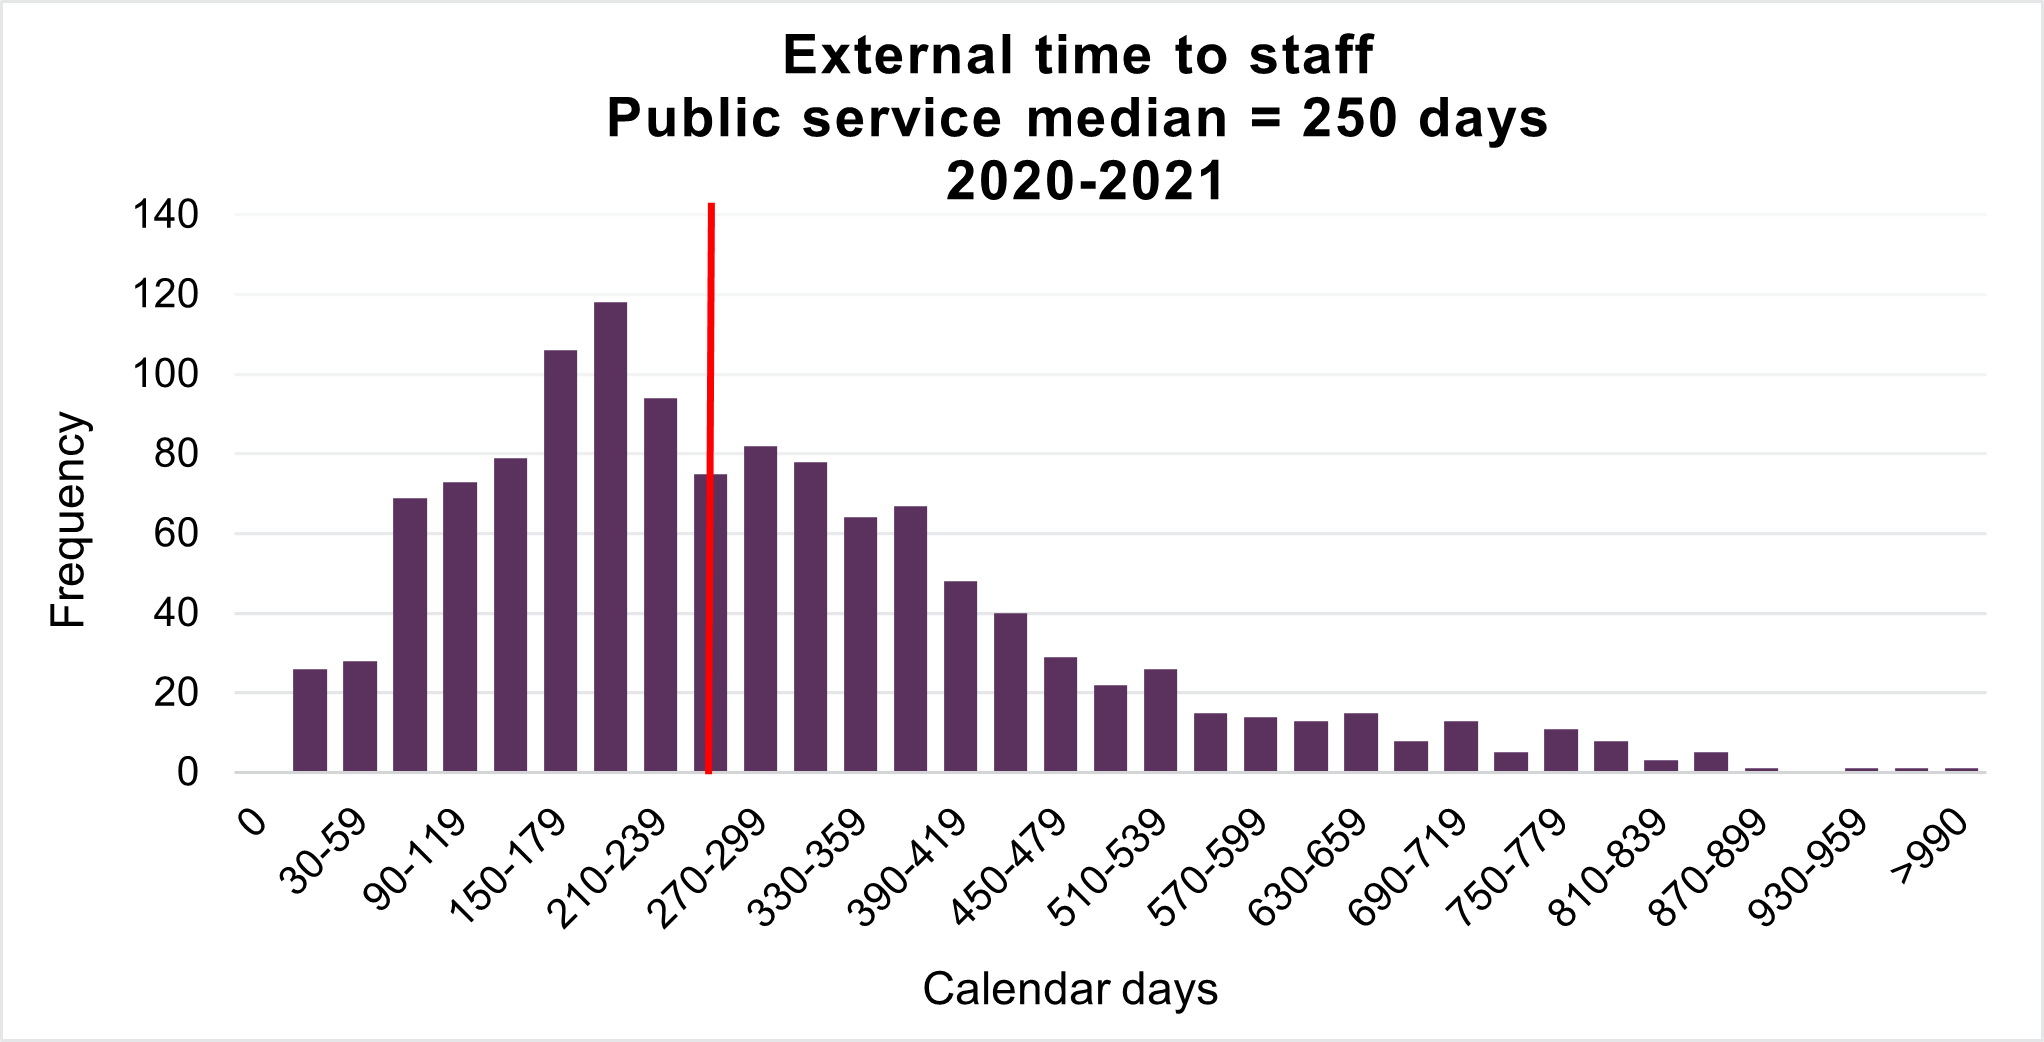
External time to staff is calculated as the number of calendar days between the opening date of the advertisement and the date of the first estimated external hire.
External time to staff for fiscal year 2020-2021
The median external time to staff for the public service (organizations subject to the Public Service Employment Act) for fiscal year 2020-2021 is 250 days. The data is insufficient for providing results on external process times for the Office of the Superintendent of Financial Institutions.
Text Alternative
| Number of calendar days | The number of external appointment processes for which the TTS-EA was within the specified number of calendar days for organizations subject to the Public Service Employment Act. |
|---|---|
| 0 calendar days | 0 |
| 0 to 29 calendar days | 26 |
| 30 to 59 calendar days | 28 |
| 60 to 89 calendar days | 69 |
| 90 to 119 calendar days | 73 |
| 120 to 149 calendar days | 79 |
| 150 to 179 calendar days | 106 |
| 180 to 209 calendar days | 118 |
| 210 to 239 calendar days | 94 |
| 240 to 269 calendar days | 75 |
| 270 to 299 calendar days | 82 |
| 300 to 329 calendar days | 78 |
| 330 to 359 calendar days | 64 |
| 360 to 389 calendar days | 67 |
| 390 to 419 calendar days | 48 |
| 420 to 449 calendar days | 40 |
| 450 to 479 calendar days | 29 |
| 480 to 509 calendar days | 22 |
| 510 to 539 calendar days | 26 |
| 540 to 569 calendar days | 15 |
| 570 to 599 calendar days | 14 |
| 600 to 629 calendar days | 13 |
| 630 to 659 calendar days | 15 |
| 660 to 689 calendar days | 8 |
| 690 to 719 calendar days | 13 |
| 720 to 749 calendar days | 5 |
| 750 to 779 calendar days | 11 |
| 780 to 809 calendar days | 8 |
| 810 to 839 calendar days | 3 |
| 840 to 869 calendar days | 5 |
| 870 to 899 calendar days | 1 |
| 900 to 929 calendar days | 0 |
| 930 to 959 calendar days | 1 |
| 960 to 989 calendar days | 1 |
| More than 990 calendar days | 1 |
Technical Notes:
- The Time to Staff - Internal Appointments (TTS-IA) is the median number of calendar days between the opening date of an internal advertisement and the date of the first Notice of Appointment or Proposal of Appointment (NAPA) from the Public Service Resourcing System for internal term and indeterminate positions. As NAPAs are not required for all internal staffing actions, this measure is limited to reporting on internal promotional appointments.
- Only estimated term and indeterminate appointments/notifications are included (deployments, casual and acting appointments are excluded).
- The Time to Staff - External Appointments (TTS-EA) is the median number of calendar days between the opening date of an external advertisement and the date of the first estimated appointment of an individual from outside an organization subject to the Public Service Employment Act for term and indeterminate positions. Only estimated term and indeterminate appointments/notifications are included (deployments, casual and acting appointments are excluded).
- Because data between systems is linked using a deterministic match, errors in data linkage are a potential source of measurement error.
Sources:
- Hiring and staffing activities data are derived from information received from the Treasury Board of Canada Secretariat Incumbent File. The Incumbent File is extracted from the Public Services and Procurement Canada’s pay system. The data constitutes an estimate of hiring and staffing activities to and within organizations
- Information from the Priority Information Management System and the Public Services Resourcing System is also used to determine if staffing actions are advertised or non-advertised as well as for calculating time to staff.
- The data are not expected to match an organization’s human resource data, due to methodology and timing differences.