
Annual Report on Government of Canada Advertising Activities 2021 to 2022
This report has been compiled to inform Canadians about the advertising activities undertaken by the Government of Canada during fiscal year 2021 to 2022. Advertising activities in this report pertain to institutions subject to the Policy on Communications and Federal Identity and its supporting instruments. These apply to departments and other portions of the federal public administration as set out in Schedules I, I.1 and II of the Financial Administration Act, unless excluded by specific acts, regulations or orders in council. All amounts exclude taxes.
Previous annual reports can be viewed and downloaded on the Government of Canada Publications website.
On this page
- At a glance
- Overview of Government of Canada advertising expenditures
- Government of Canada media expenditures with the Agency of Record
- Government of Canada advertising expenditures
- Appendices
At a glance
During fiscal year 2021 to 2022, from April 1, 2021 to March 31, 2022, the Government of Canada (GC) spent a total of $140.76 million on advertising, involving 42 institutions, one Agency of Record (AOR) for media planning and placement and 10 creative agencies.
The majority of GC advertising activities were suspended when the September 2021 federal general election was called and resumed when the newly elected government was sworn into office, as required by the Directive on the Management of Communications. The COVID-19 pandemic remained a high priority, with advertising efforts from the previous two fiscal years continuing for a third fiscal year, to inform Canadians about government programs, services and public health measures as the situation evolved.
Net media expenditures for media placement through the AOR totalled $120.66 million. A variety of media were used, both digital and traditional. Across all media types combined, television received the largest share of media expenditures with 27%, totalling $32.07 million. Between digital media and traditional media, digital media received the largest share with 53%, totalling $64.05 million. Traditional media expenditures made up 47%, totalling $56.60 million.
Among the digital media types used, display programmatic received the largest share of digital media expenditures at 40%, totalling $25.46 million, followed by social media at 33%, totalling $21.21 million, search engine marketing at 15%, totalling $9.90 million, and display non-programmatic at 12%, totalling $7.49 million.
With respect to traditional media types used, television received the largest share of traditional media expenditures at 57%, totalling $32.07 million, followed by radio at 21%, totalling $11.67 million, print at 12%, totalling $6.51 million, and out-of-home at 11%, totalling $6.36 million.
COVID-19 advertising, which had started in fiscal year 2019 to 2020 and continued in fiscal year 2020 to 2021, carried on with various campaigns throughout fiscal year 2021 to 2022. During this fiscal year, a total of $62.01 million was spent for COVID-19 related media placement through the AOR, making up 51% of total media expenditures for the fiscal year (similar to the previous fiscal year). Of this amount, traditional media received the largest share (similar to the previous fiscal year), making up 53% and totalling $32.73 million. Digital media received 47%, totalling $29.29 million.
Overview of Government of Canada advertising expenditures
In this section
- Figure 1: Advertising expenditures since 2002 to 2003
- Figure 2: Advertising expenditures with and without the Agency of Record in 2021 to 2022
This section provides information on advertising expenditures reported by Government of Canada (GC) institutions. Amounts represent total advertising expenditures, which encompasses media planning, media placement with and without the Agency of Record (AOR), as well as creative production.
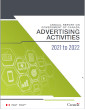
Figure 1 provides total advertising expenditures by fiscal year since the GC began producing an annual report on government advertising activities in 2002 to 2003. Figure 2 provides total advertising expenditures with and without the Agency of Record in fiscal year 2021 to 2022. Heads of communications can decide to purchase media space directly from media outlets for campaigns that have a total media buy of $25,000 or less, in accordance with the Directive on the Management of Communications.
For more information on advertising expenditures reported in each fiscal year, consult the corresponding annual reports.
Figure 1: Advertising expenditures since 2002 to 2003
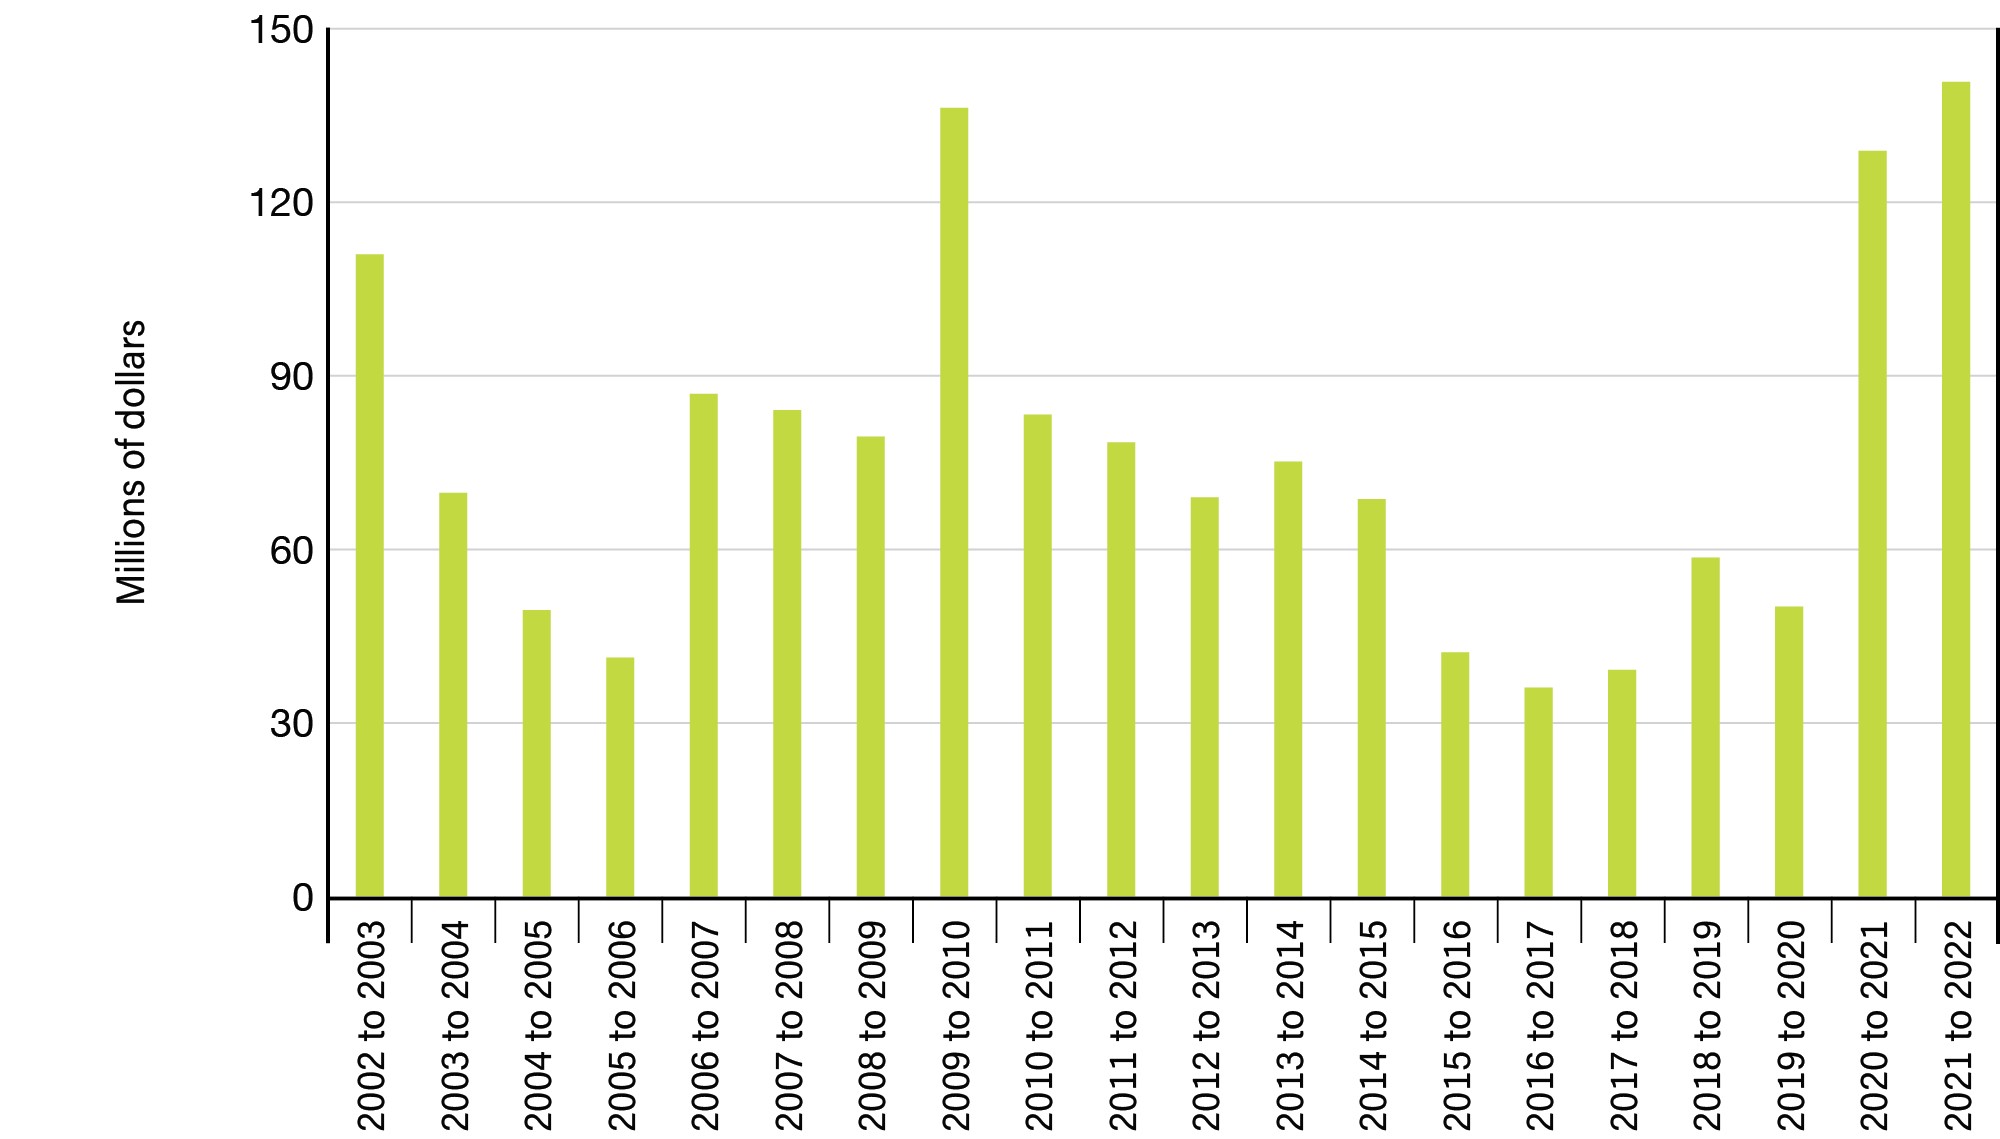
Image description
This vertical bar graphic presents total Government of Canada advertising expenditures in millions of dollars from fiscal year 2002 to 2003 to fiscal year 2021 to 2022. The graphic is provided for illustration purposes. The information illustrated by the graphic is the following:
| Fiscal year | Expenditures (millions of dollars) |
|---|---|
| 2002 to 2003 | 111.0 |
| 2003 to 2004 | 69.8 |
| 2004 to 2005 | 49.5 |
| 2005 to 2006 | 41.3 |
| 2006 to 2007 | 86.9 |
| 2007 to 2008 | 84.1 |
| 2008 to 2009 | 79.5 |
| 2009 to 2010 | 136.3 |
| 2010 to 2011 | 83.3 |
| 2011 to 2012 | 78.5 |
| 2012 to 2013 | 69.0 |
| 2013 to 2014 | 75.2 |
| 2014 to 2015 | 68.7 |
| 2015 to 2016 | 42.2 |
| 2016 to 2017 | 36.1 |
| 2017 to 2018 | 39.2 |
| 2018 to 2019 | 58.6 |
| 2019 to 2020 | 50.1 |
| 2020 to 2021 | 128.9 |
| 2021 to 2022 | 140.8 |
Figure 2: Advertising expenditures with and without the Agency of Record in 2021 to 2022
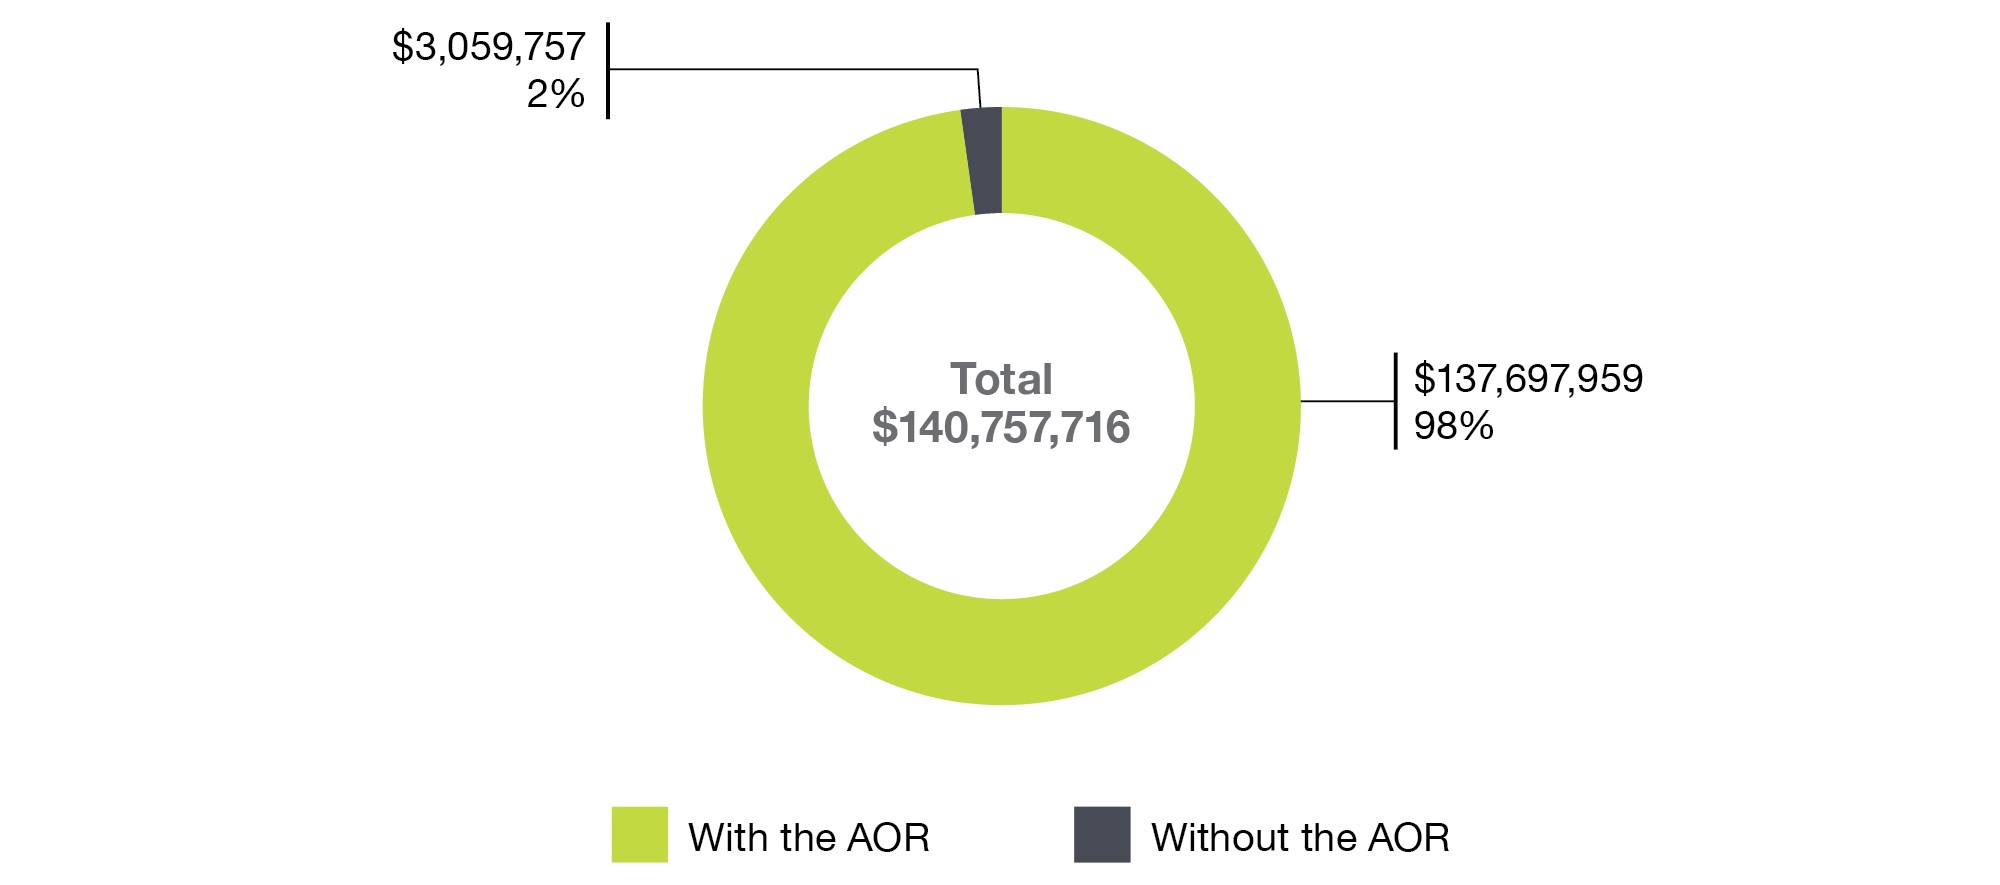
Image description
This segmented pie graphic presents total Government of Canada advertising expenditures in millions of dollars and the amounts spent and related percentage distribution by type of advertising. The types of advertising are: with the Agency of Record and without the Agency of Record. The expenditures and the related percentage distribution are presented next to each pie segment. In the center of the pie is the total amount spent on advertising by the Government of Canada in fiscal year 2021 to 2022. The graphic is provided for illustration purposes. The information illustrated by the graphic is the following:
| Type of advertising | Expenditures | Distribution |
|---|---|---|
| With the AOR | $137,697,959 | 98% |
| Without the AOR | $3,059,757 | 2% |
| Total | $140,757,716 | 100% |
Government of Canada media expenditures with the Agency of Record
In this section
- Total media expenditures
- Figure 3: Media expenditures over 5 years
- Figure 4: Distribution of media expenditures over 5 years
- Figure 5: Media expenditures by media type over 5 years
- Figure 6: Distribution of media expenditures by media type over 5 years
- Figure 7: Digital media expenditures over 5 years
- Figure 8: Distribution of digital media expenditures over 5 years
- Figure 9: Social media expenditures over 5 years
- Figure 10: Distribution of social media expenditures over 5 years
- Figure 11: Search engine marketing media expenditures over 5 years
- Figure 12: Distribution of search engine marketing media expenditures over 5 years
- Figure 13: Traditional media expenditures over 5 years
- Figure 14: Distribution of traditional media expenditures over 5 years
- Figure 15: Media expenditures by quarter over 5 years
- Figure 16: Distribution of media expenditures by quarter over 5 years
- Official languages
- Ethnic and Indigenous media
- International audiences
- COVID-19
This section provides information on advertising expenditures for all media placement made through the Agency of Record (AOR), on behalf of Government of Canada (GC) institutions. Amounts represent net media costs paid to media suppliers for the purchase of advertising space and time. Fees paid to the AOR to perform the media placement, as well as media planning and creative production expenditures are excluded.
Figures 3 to 6 provide total media expenditures and the distribution by media type. Figures 7 to 14 provide details on digital and traditional media expenditures, and tables 1 to 7 provide details on media expenditures for all media placement in English and French, and in ethnic, Indigenous and international media. Additionally, a special section provides details on media expenditures of COVID-19 campaigns.
Note
Values are rounded to the nearest whole number. The sum of values may not add up exactly to the totals indicated due to rounding.
Total media expenditures
Figure 3: Media expenditures over 5 years
Image description
This vertical bar graphic presents an overview of total media expenditures in digital and traditional media, in millions of dollars over five years, from fiscal year 2017 to 2018 to fiscal year 2021 to 2022. The graphic is provided for illustration purposes. The information illustrated by the graphic is the following:
| Media | 2017 to 2018 | 2018 to 2019 | 2019 to 2020 | 2020 to 2021 | 2021 to 2022 |
|---|---|---|---|---|---|
| Digital | $18,153,526 | $22,927,081 | $24,711,751 | $50,972,886 | $64,052,570 |
| Traditional | $9,610,188 | $20,115,347 | $20,147,394 | $55,994,827 | $56,604,884 |
| Total | $27,763,715 | $43,042,428 | $44,859,145 | $106,967,712 | $120,657,455 |
Figure 4: Distribution of media expenditures over 5 years
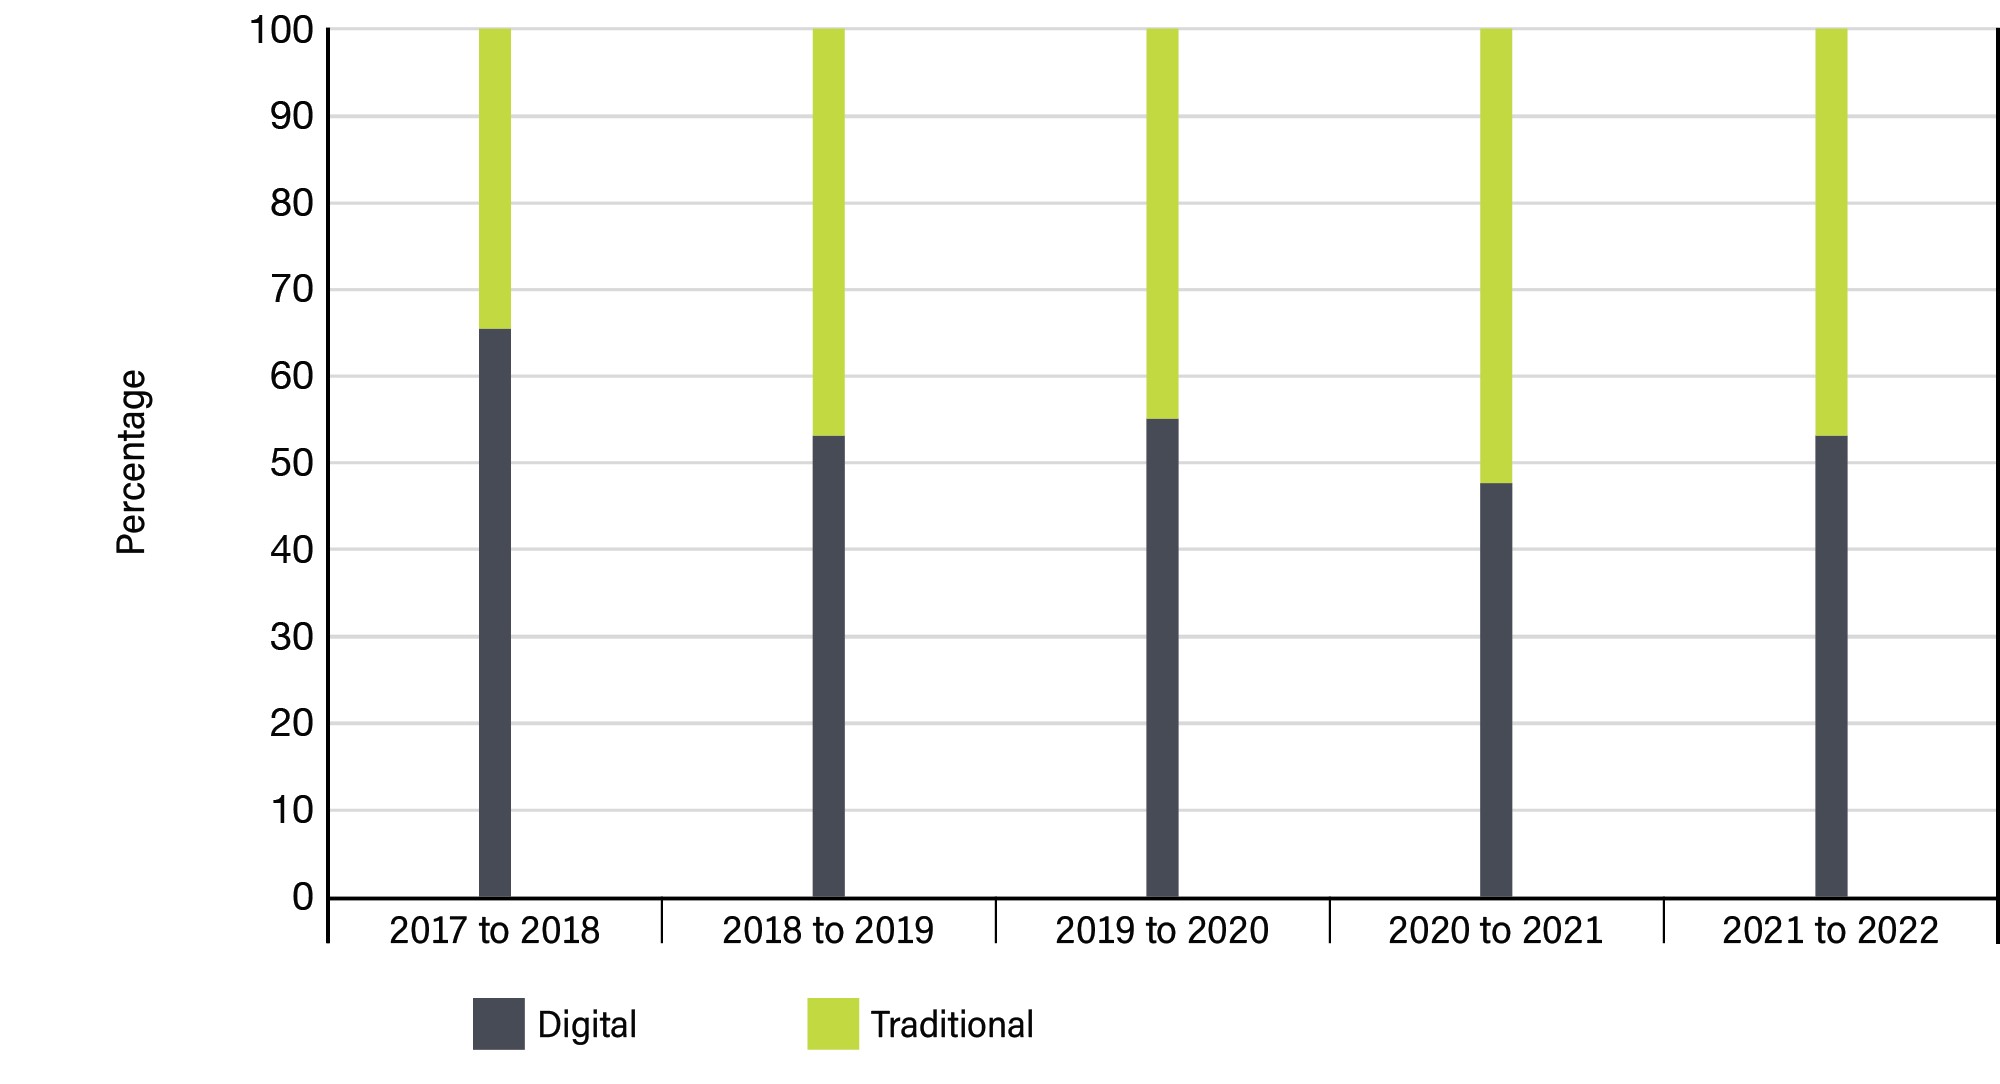
Image description
This vertical bar graphic presents the percentage distribution of total media expenditures in digital and traditional media over five years, from fiscal year 2017 to 2018 to fiscal year 2021 to 2022. The graphic is provided for illustration purposes. The information illustrated by the graphic is the following:
| Media | 2017 to 2018 | 2018 to 2019 | 2019 to 2020 | 2020 to 2021 | 2021 to 2022 |
|---|---|---|---|---|---|
| Digital | 65% | 53% | 55% | 48% | 53% |
| Traditional | 35% | 47% | 45% | 52% | 47% |
| Total | 100% | 100% | 100% | 100% | 100% |
Figure 5: Media expenditures by media type over 5 years
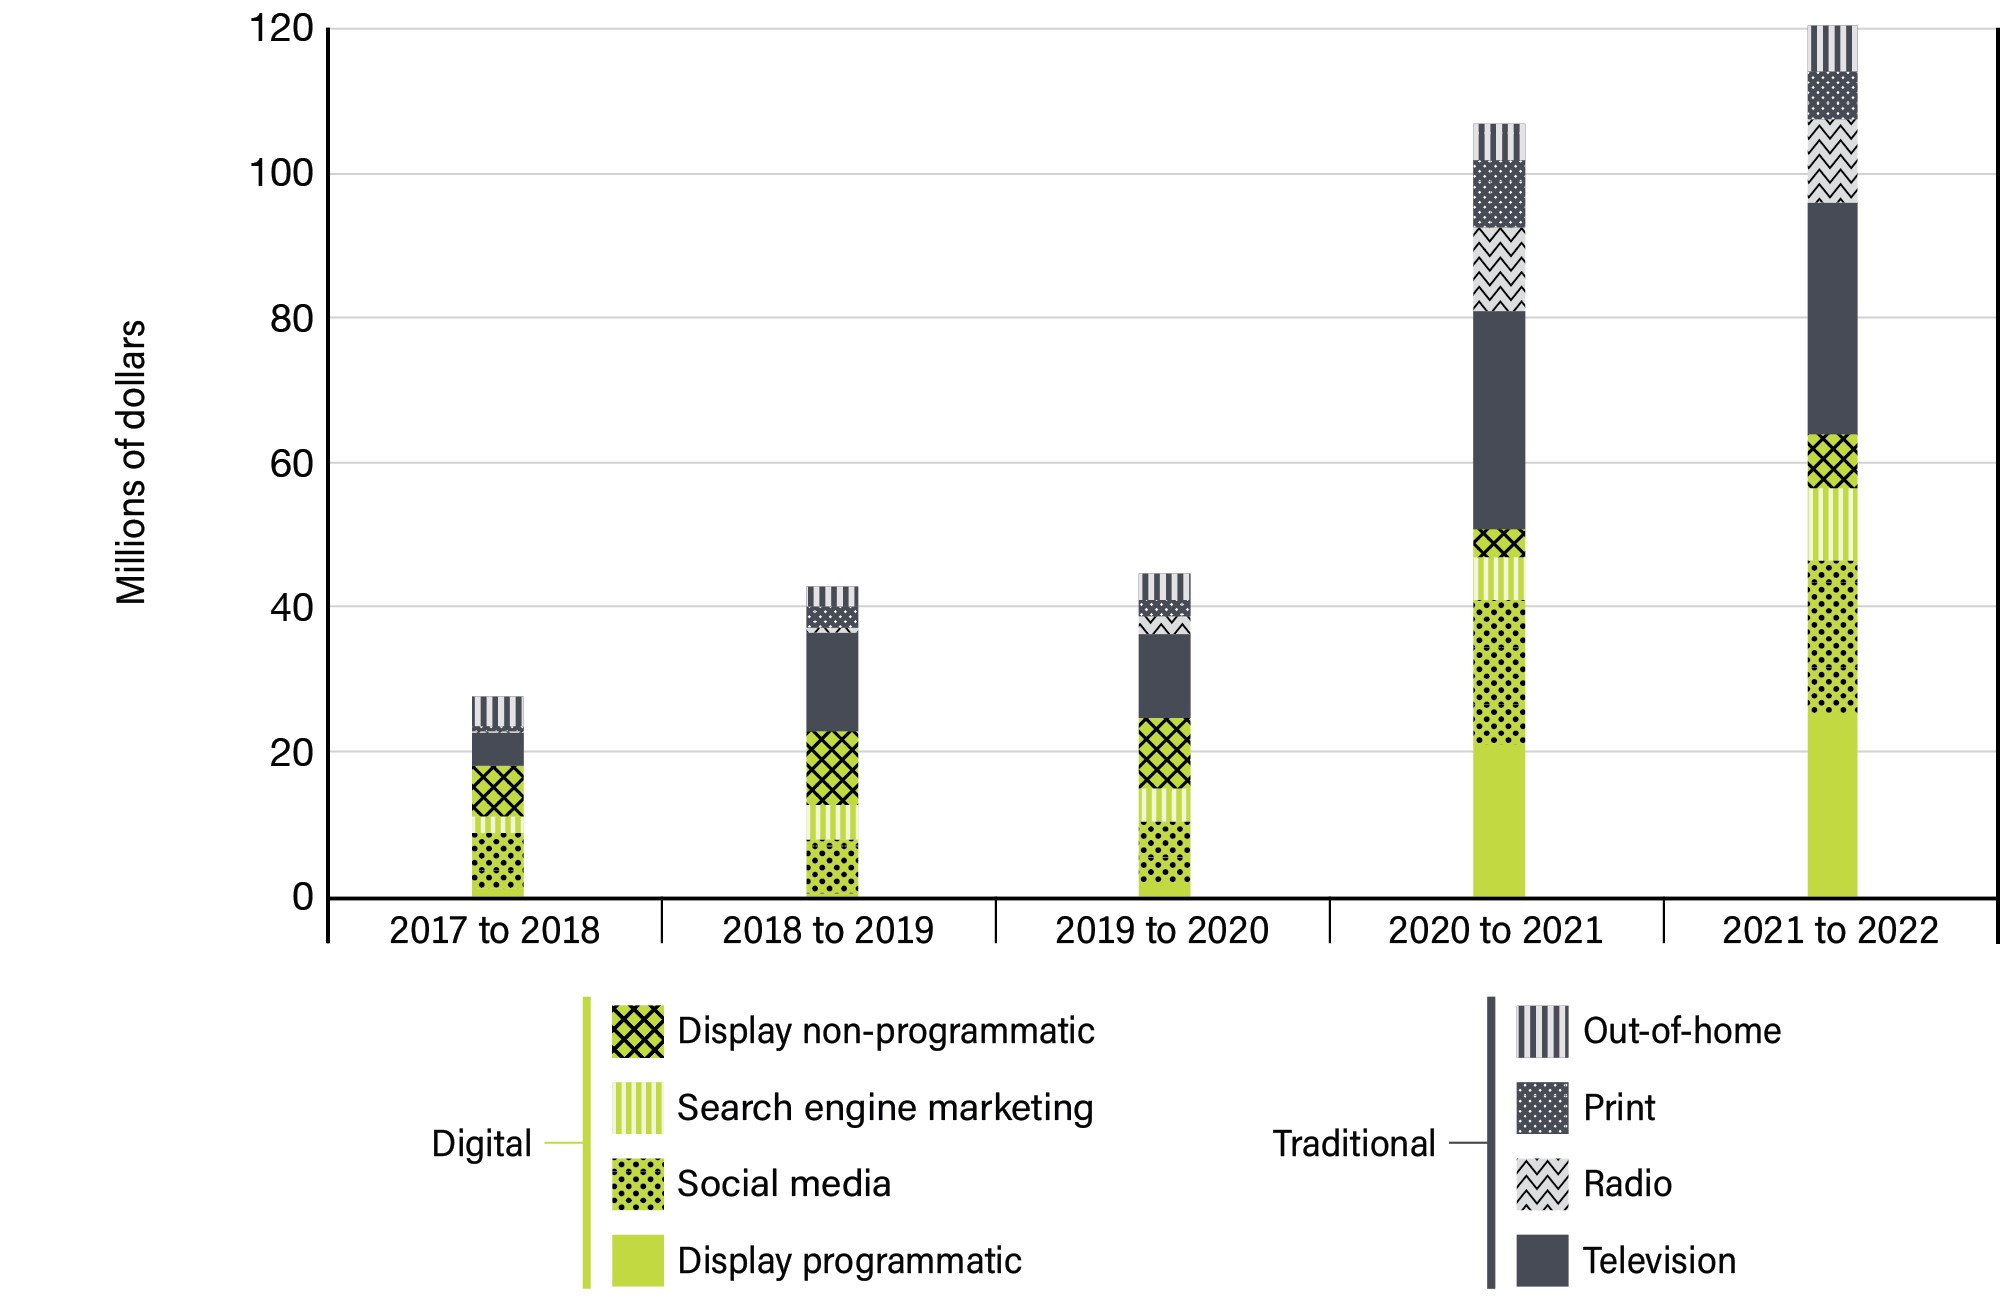
Image description
This vertical bar graphic presents total media expenditures in digital and traditional media by media type in millions of dollars over five years, from fiscal year 2017 to 2018 to fiscal year 2021 to 2022. The digital media types are display programmatic, social media, search engine marketing and display non-programmatic. The traditional media types are television, radio, print and out-of-home. The graphic is provided for illustration purposes. The information illustrated by the graphic is the following:
| Media | 2017 to 2018 | 2018 to 2019 | 2019 to 2020 | 2020 to 2021 | 2021 to 2022 |
|---|---|---|---|---|---|
| Digital | |||||
| Display programmatic | $1,074,858 | $435,430 | $1,955,100 | $21,144,891 | $25,457,511 |
| Social media | $7,755,521 | $7,617,926 | $8,561,088 | $19,905,460 | $21,205,519 |
| Search engine marketing | $2,258,743 | $4,739,636 | $4,570,668 | $5,883,032 | $9,904,297 |
| Display non-programmatic | $7,064,404 | $10,134,089 | $9,624,895 | $4,039,503 | $7,485,244 |
| Traditional | |||||
| Television | $4,470,942 | $13,575,701 | $11,737,577 | $30,125,369 | $32,065,753 |
| Radio | $391,916 | $799,671 | $2,352,370 | $11,590,073 | $11,669,182 |
| $570,196 | $2,921,078 | $2,385,990 | $9,312,472 | $6,511,880 | |
| Out-of-home | $4,177,134 | $2,818,896 | $3,671,456 | $4,966,913 | $6,358,070 |
| Total | $27,763,715 | $43,042,428 | $44,859,145 | $106,967,712 | $120,657,455 |
Figure 6: Distribution of media expenditures by media type over 5 years
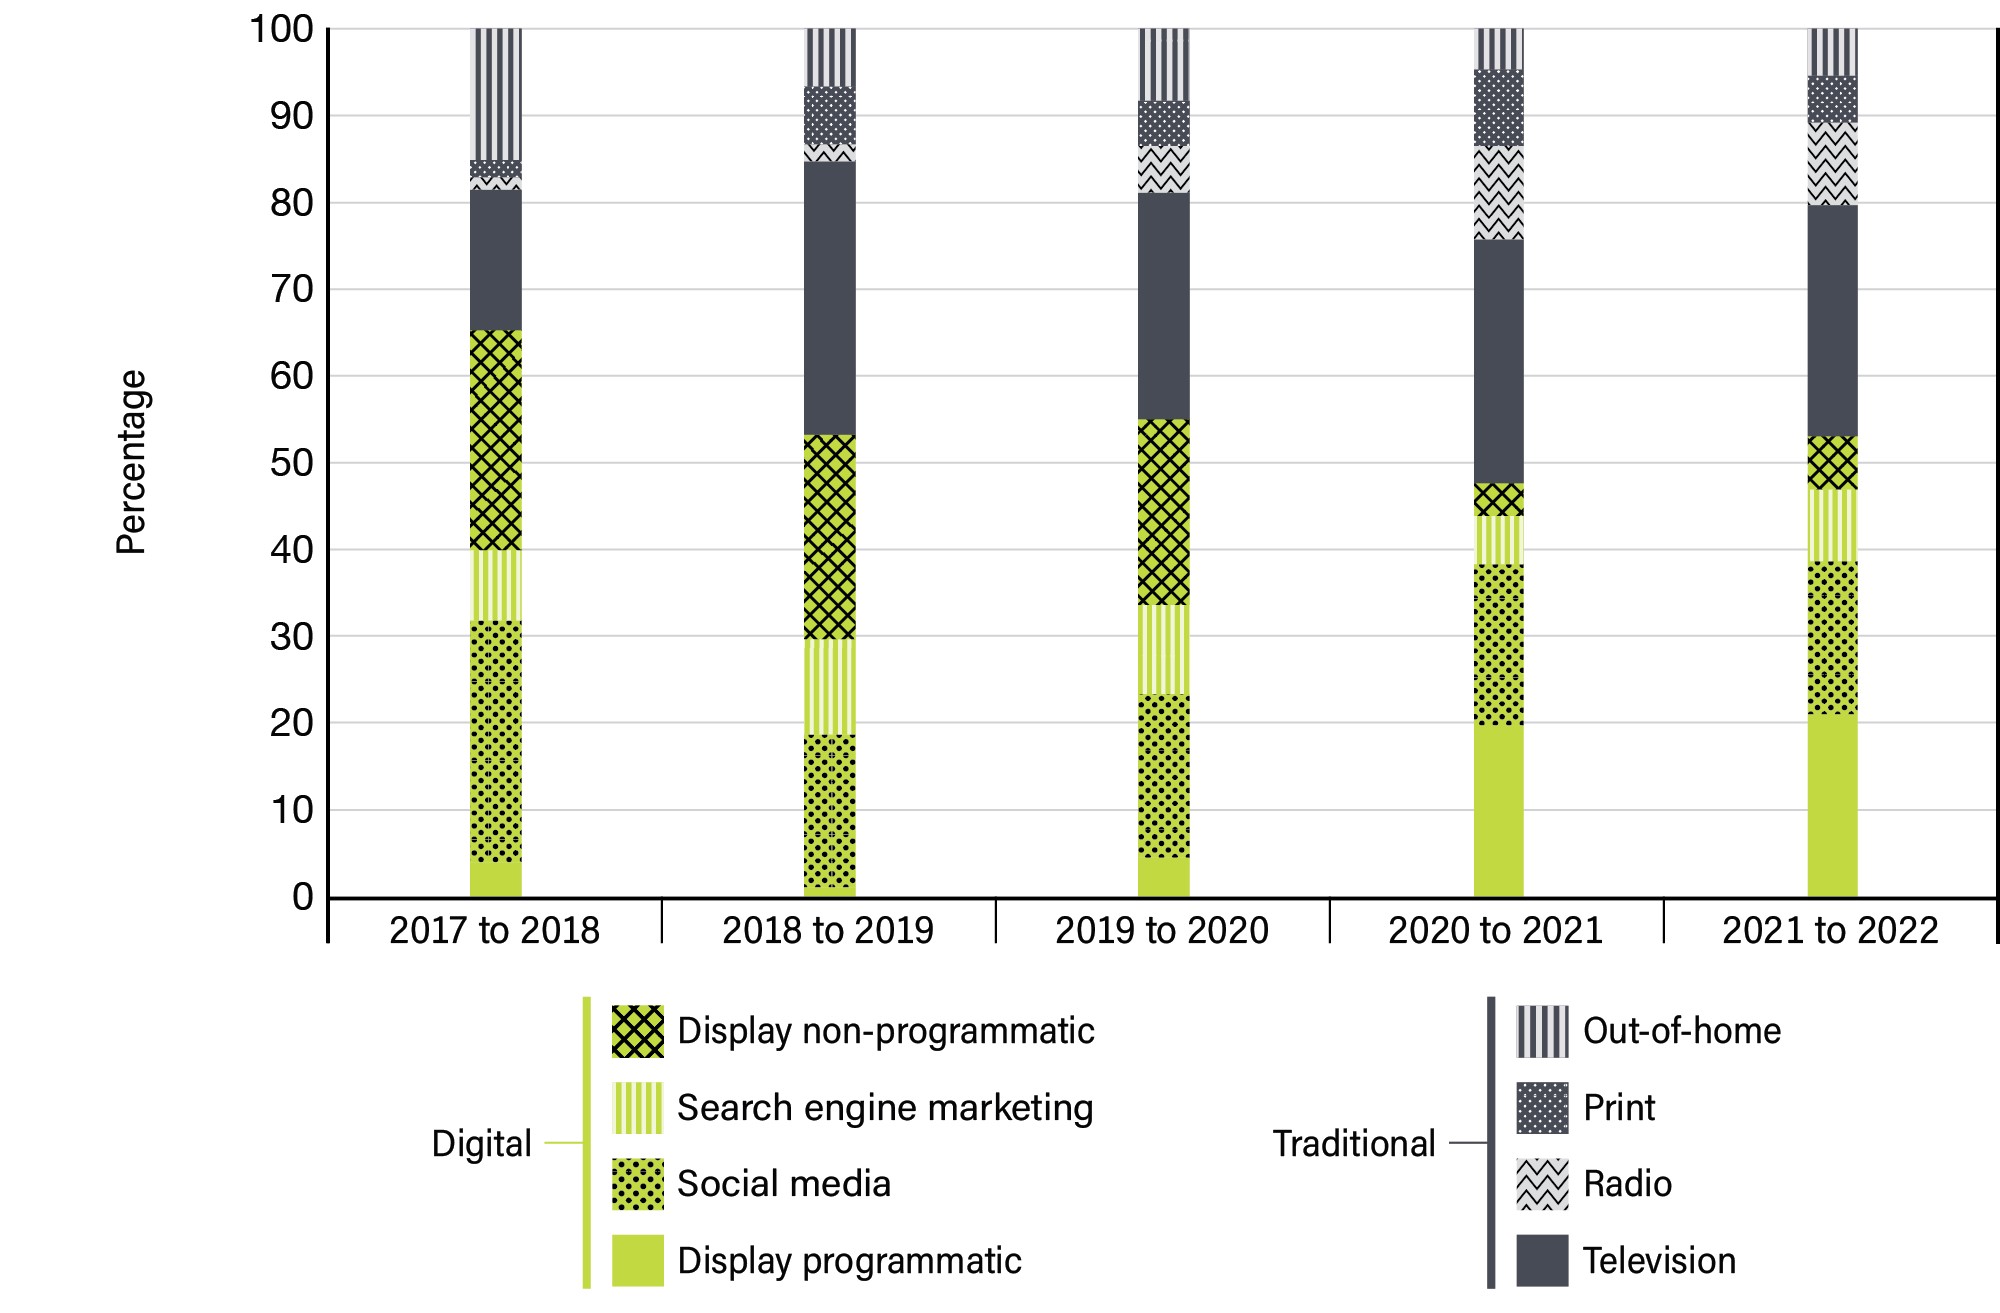
Image description
This vertical bar graphic presents the percentage distribution of total media expenditures in digital and traditional media by media type over five years, from fiscal year 2017 to 2018 to fiscal year 2021 to 2022. The digital media types are display programmatic, social media, search engine marketing and display non-programmatic. The traditional media types are television, radio, print and out-of-home. The graphic is provided for illustration purposes. The information illustrated by the graphic is the following:
| Media | 2017 to 2018 | 2018 to 2019 | 2019 to 2020 | 2020 to 2021 | 2021 to 2022 |
|---|---|---|---|---|---|
| Digital | |||||
| Display programmatic | 4% | 1% | 4% | 20% | 21% |
| Social media | 28% | 18% | 19% | 19% | 18% |
| Search engine marketing | 8% | 11% | 10% | 5% | 8% |
| Display non-programmatic | 25% | 24% | 21% | 4% | 6% |
| Traditional | |||||
| Television | 16% | 32% | 26% | 28% | 27% |
| Radio | 1% | 2% | 5% | 11% | 10% |
| 2% | 7% | 5% | 9% | 5% | |
| Out-of-home | 15% | 7% | 8% | 5% | 5% |
| Total | 100% | 100% | 100% | 100% | 100% |
Figure 7: Digital media expenditures over 5 years
Media placement on YouTube is included under Display programmatic.
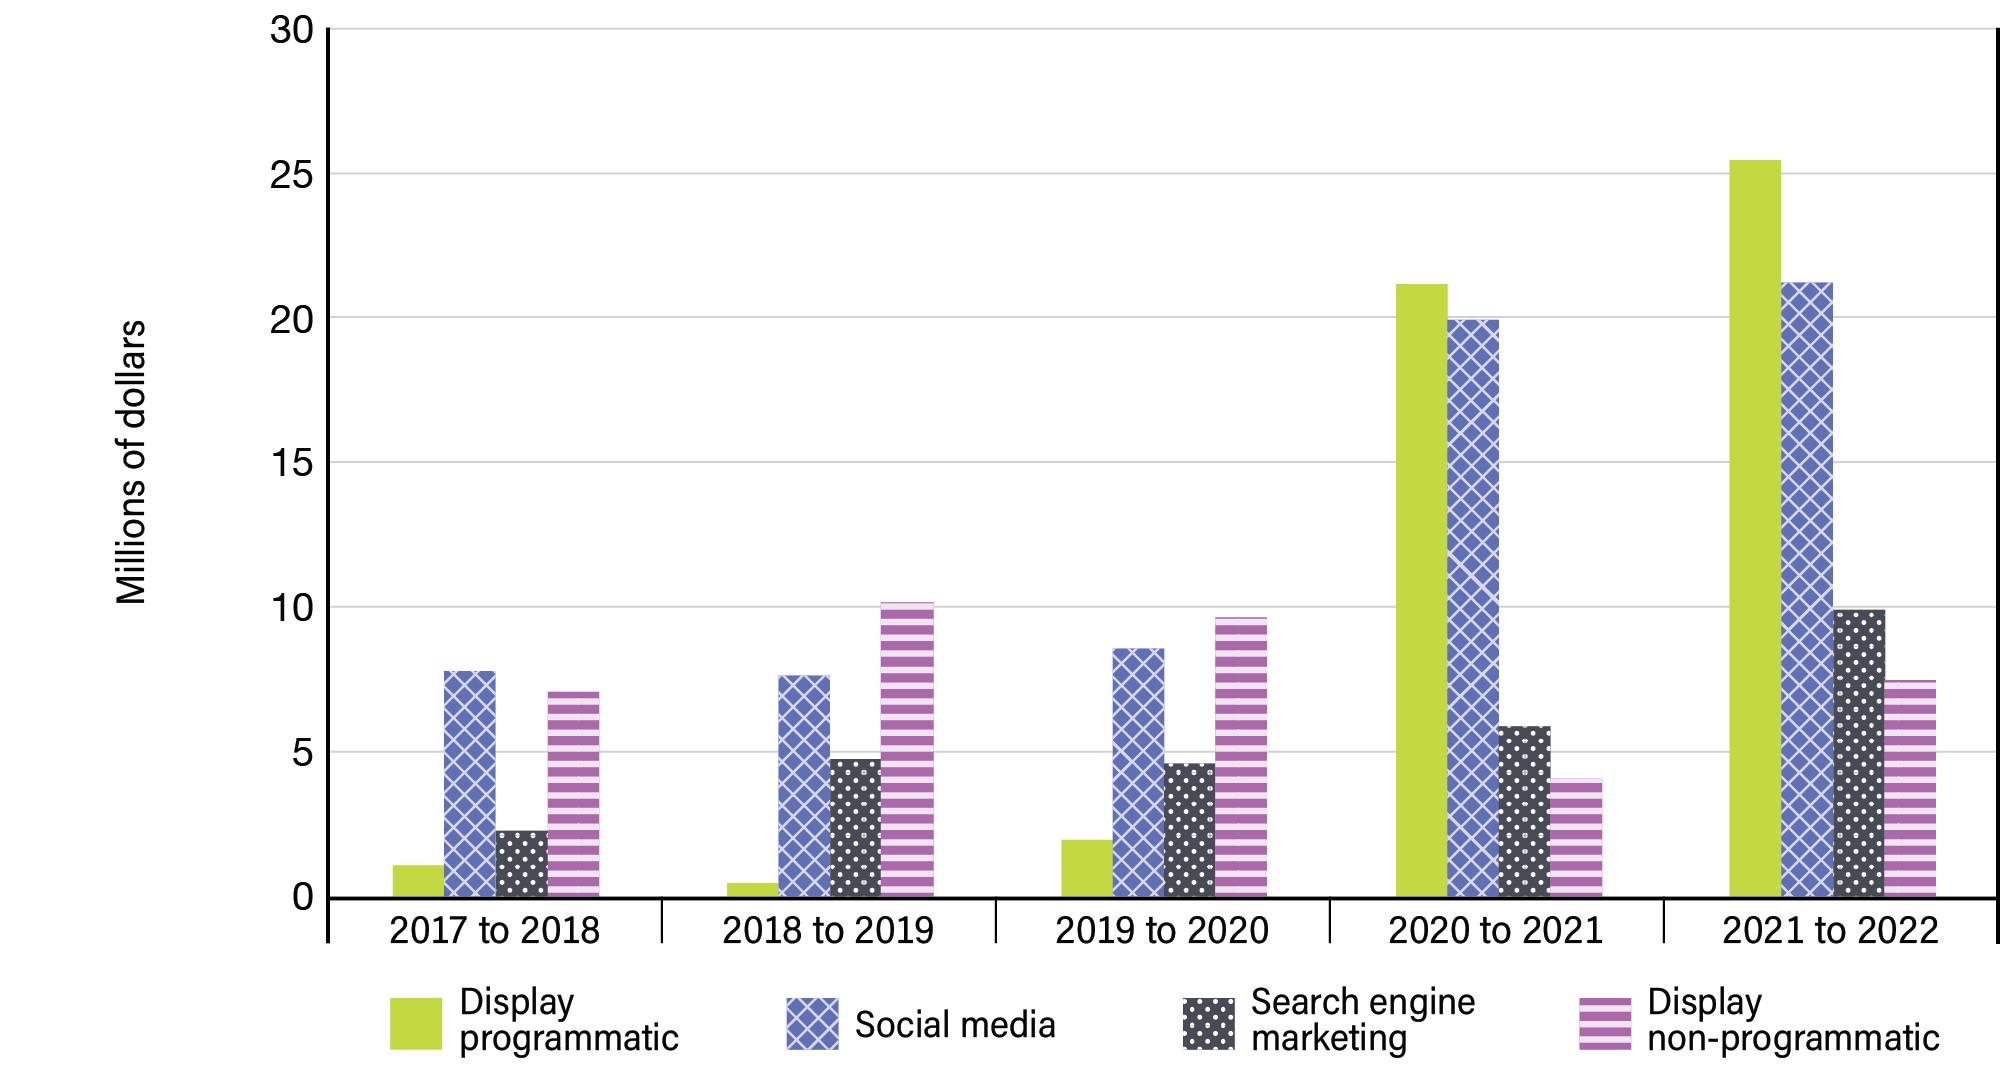
Image description
This vertical bar graphic presents digital media expenditures by media type in millions of dollars over five years, from fiscal year 2017 to 2018 to fiscal year 2021 to 2022. The media types are display programmatic, social media, search engine marketing and display non-programmatic. The graphic is for illustration purposes. The information illustrated by the graphic is the following:
| Media | 2017 to 2018 | 2018 to 2019 | 2019 to 2020 | 2020 to 2021 | 2021 to 2022 |
|---|---|---|---|---|---|
| Display programmatic | $1,074,858 | $435,430 | $1,955,100 | $21,144,891 | $25,457,511 |
| Social media | $7,755,521 | $7,617,926 | $8,561,088 | $19,905,460 | $21,205,519 |
| Search engine marketing | $2,258,743 | $4,739,636 | $4,570,668 | $5,883,032 | $9,904,297 |
| Display non-programmatic | $7,064,404 | $10,134,089 | $9,624,895 | $4,039,503 | $7,485,244 |
| Total | $18,153,526 | $22,927,081 | $24,711,751 | $50,972,886 | $64,052,570 |
Figure 8: Distribution of digital media expenditures over 5 years
Media placement on YouTube is included under Display programmatic.
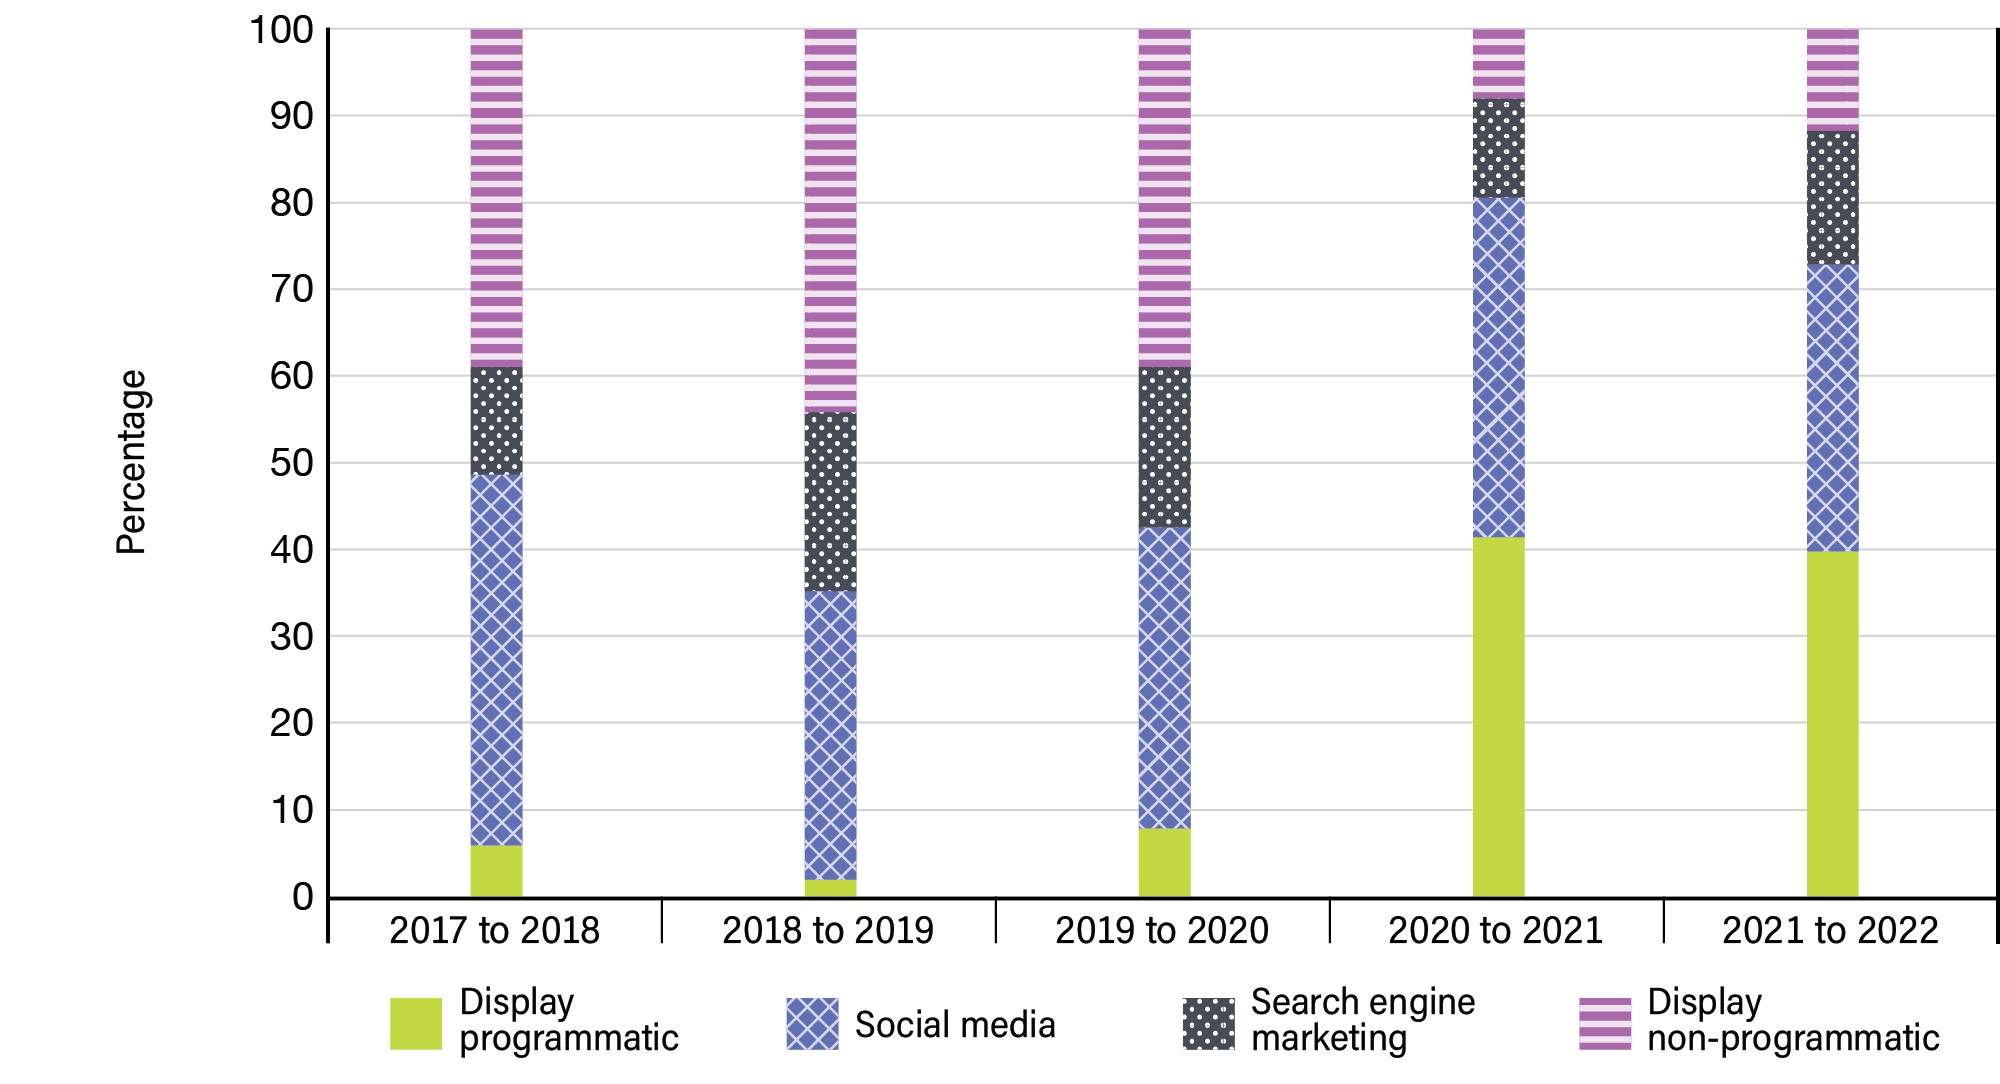
Image description
This vertical bar graphic presents the percentage distribution of digital media expenditures by media type over five years, from fiscal year 2017 to 2018 to fiscal year 2021 to 2022. The media types are daily programmatic, social media, search engine marketing and display non-programmatic. The graphic is for illustration purposes. The information illustrated by the graphic is the following:
| Media | 2017 to 2018 | 2018 to 2019 | 2019 to 2020 | 2020 to 2021 | 2021 to 2022 |
|---|---|---|---|---|---|
| Display programmatic | 6% | 2% | 8% | 41% | 40% |
| Social media | 43% | 33% | 35% | 39% | 33% |
| Search engine marketing | 12% | 21% | 18% | 12% | 15% |
| Display non-programmatic | 39% | 44% | 39% | 8% | 12% |
| Total | 100% | 100% | 100% | 100% | 100% |
Figure 9: Social media expenditures over 5 years
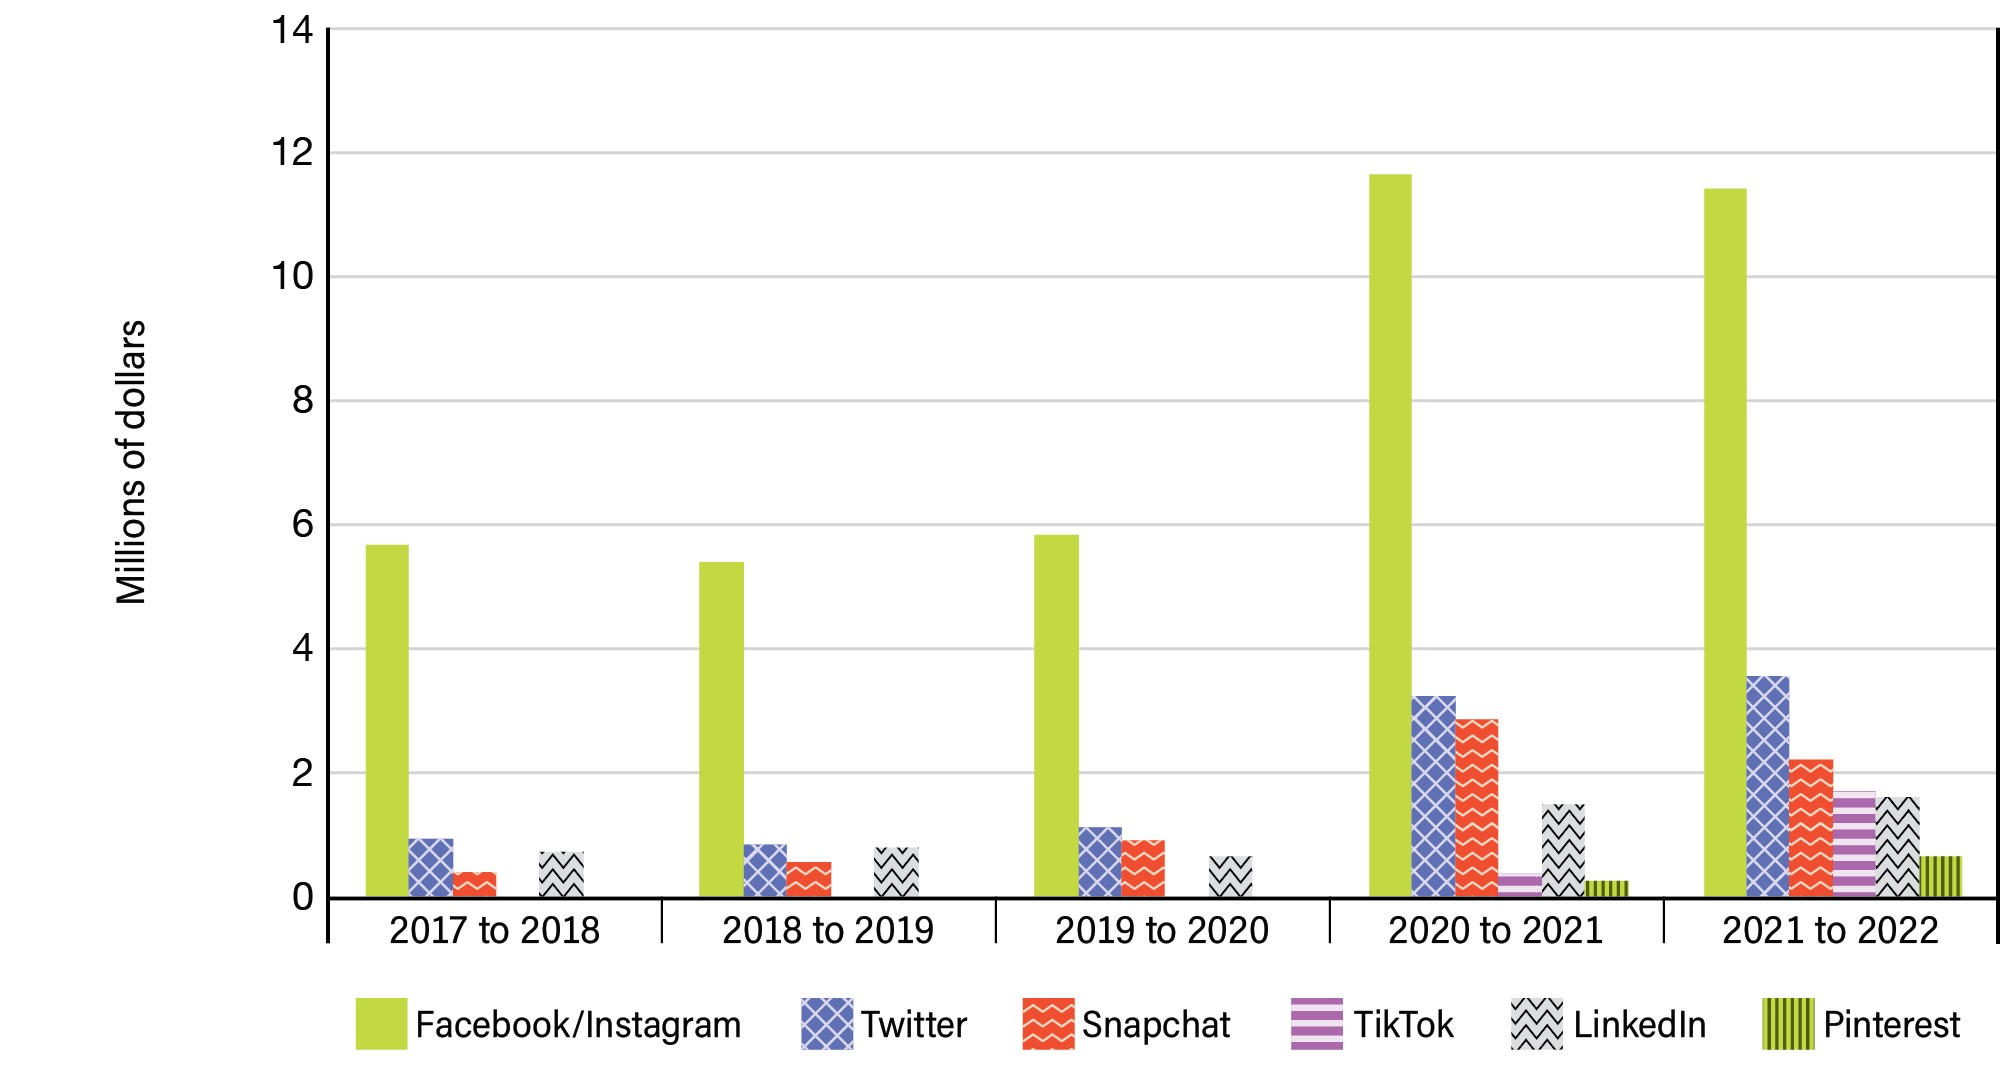
Image description
This vertical bar graphic presents social media expenditures by platform in millions of dollars over five years, from fiscal year 2017 to 2018 to fiscal year 2021 to 2022. The platforms are Facebook/Instagram, Twitter, Snapchat, TikTok, LinkedIn and Pinterest. The graphic is provided for illustration purposes. The information illustrated by the graphic is the following:
| Platform | 2017 to 2018 | 2018 to 2019 | 2019 to 2020 | 2020 to 2021 | 2021 to 2022 |
|---|---|---|---|---|---|
| Facebook/Instagram | $5,684,613 | $5,399,912 | $5,854,469 | $11,649,636 | $11,423,728 |
| $941,505 | $839,447 | $1,119,479 | $3,244,935 | $3,560,440 | |
| Snapchat | $406,845 | $565,814 | $920,635 | $2,867,196 | $2,223,055 |
| TikTok | $0 | $0 | $0 | $377,019 | $1,717,617 |
| $722,559 | $812,753 | $666,505 | $1,501,624 | $1,615,981 | |
| $0 | $0 | $0 | $265,048 | $664,698 | |
| Total | $7,755,521 | $7,617,926 | $8,561,088 | $19,905,460 | $21,205,519 |
Figure 10: Distribution of social media expenditures over 5 years
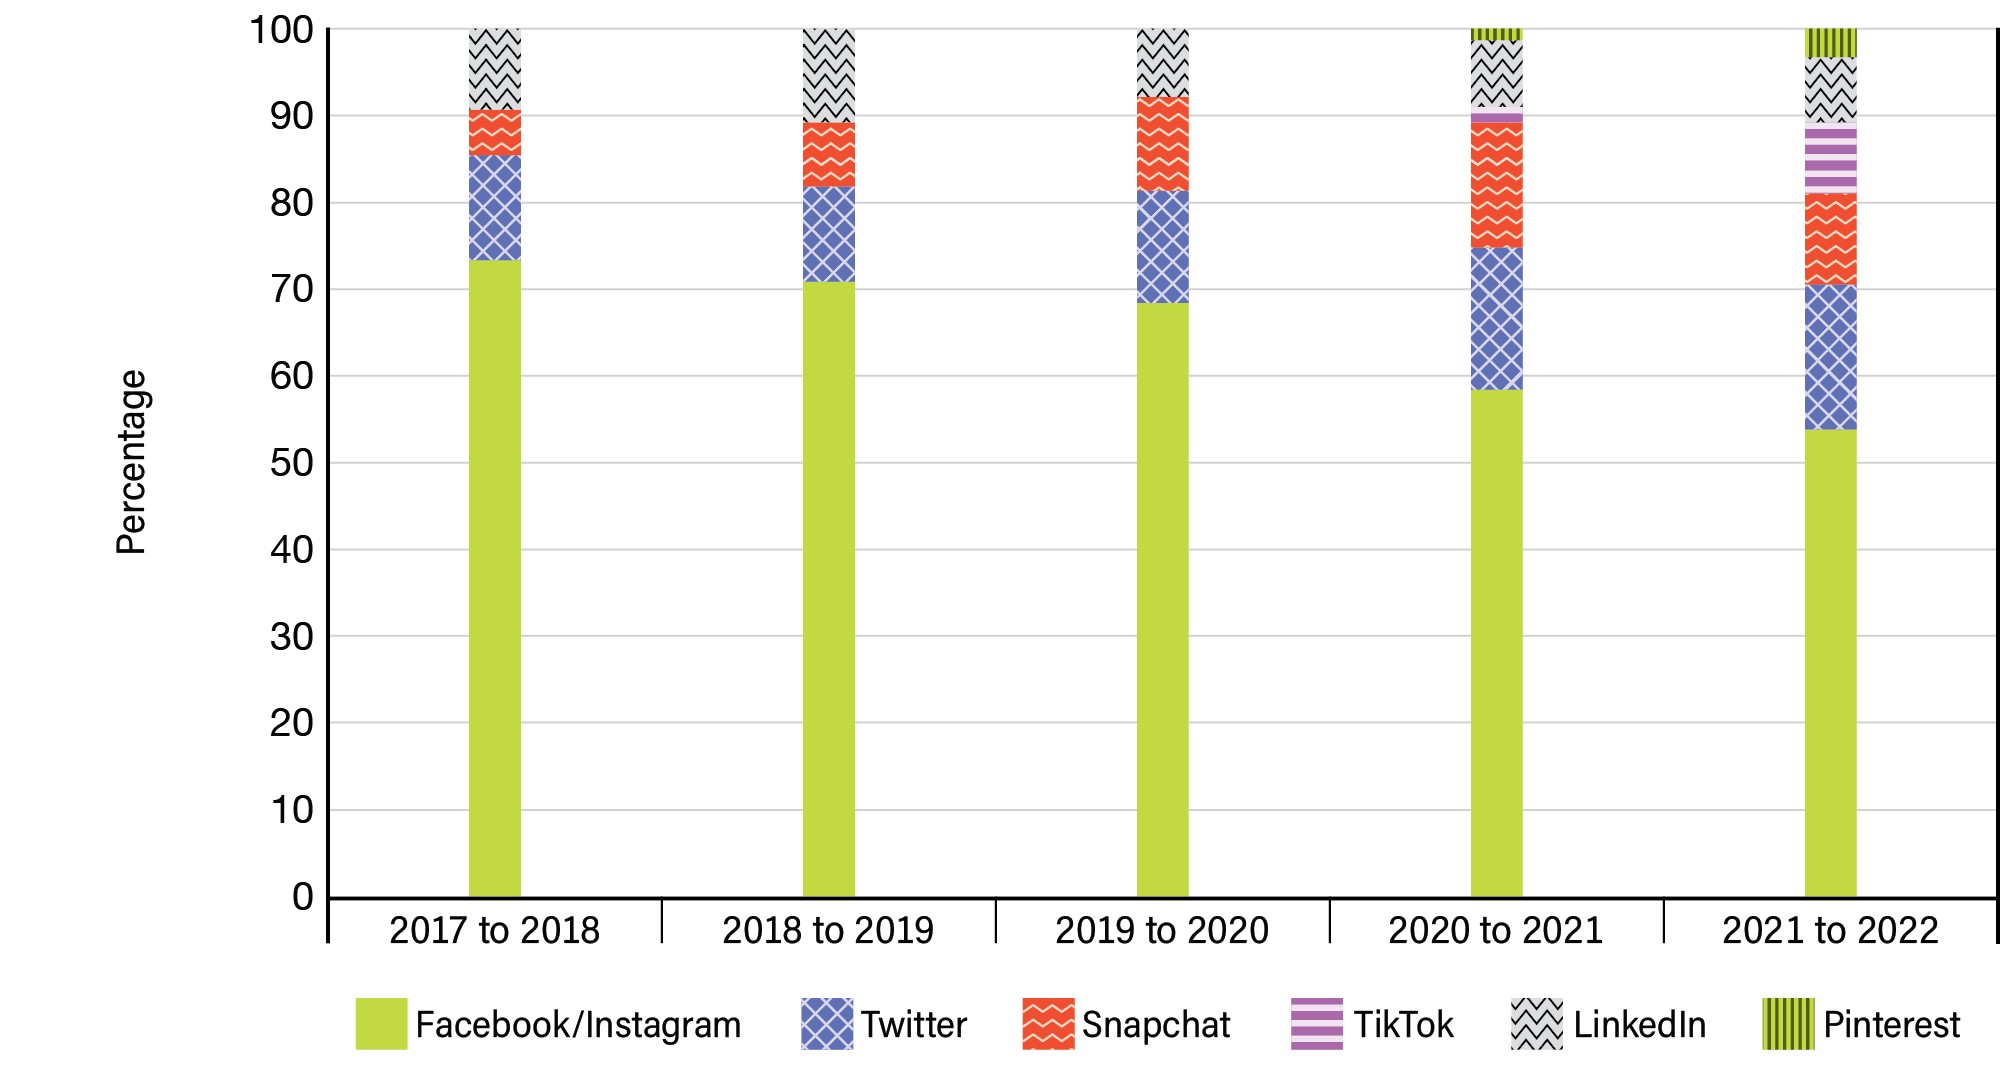
Image description
This vertical bar graphic presents the percentage distribution of social media expenditures by platform over five years, from fiscal year 2017 to 2018 to fiscal year 2021 to 2022. The platforms are Facebook/Instagram, Twitter, Snapchat, TikTok, LinkedIn and Pinterest. The graphic is provided for illustration purposes. The information illustrated by the graphic is the following:
| Platform | 2017 to 2018 | 2018 to 2019 | 2019 to 2020 | 2020 to 2021 | 2021 to 2022 |
|---|---|---|---|---|---|
| Facebook/Instagram | 73% | 71% | 68% | 59% | 54% |
| 12% | 11% | 13% | 16% | 17% | |
| Snapchat | 5% | 7% | 11% | 14% | 10% |
| TikTok | 0% | 0% | 0% | 2% | 8% |
| 9% | 11% | 8% | 8% | 8% | |
| 0% | 0% | 0% | 1% | 3% | |
| Total | 100% | 100% | 100% | 100% | 100% |
Figure 11: Search engine marketing media expenditures over 5 years
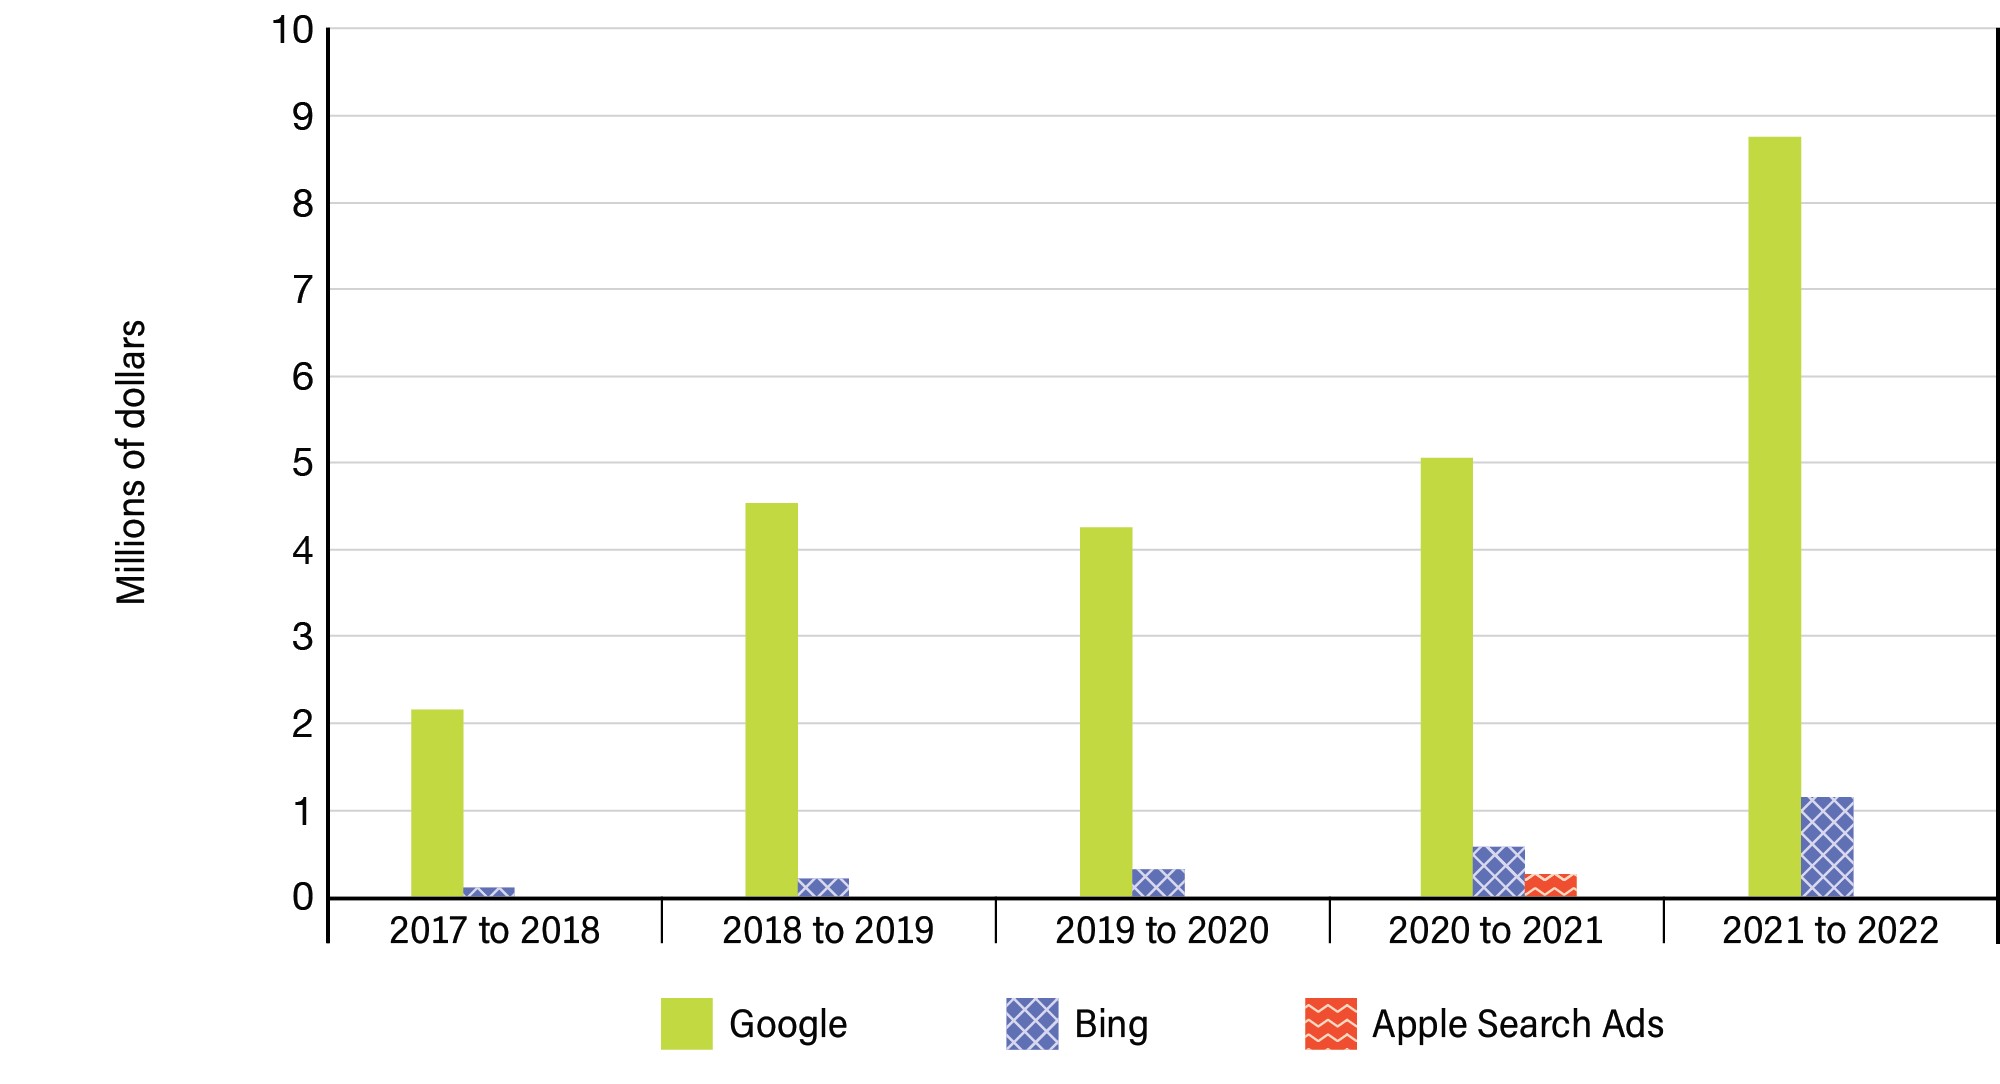
Image description
This vertical bar graphic presents search engine marketing media expenditures by platform in millions of dollars over five years, from fiscal year 2017 to 2018 to fiscal year 2021 to 2022. The platforms are Google, Bing and Apple Search Ads. The graphic is provided for illustration purposes. The information illustrated by the graphic is the following:
| Platform | 2017 to 2018 | 2018 to 2019 | 2019 to 2020 | 2020 to 2021 | 2021 to 2022 |
|---|---|---|---|---|---|
| $2,160,430 | $4,531,536 | $4,265,187 | $5,051,618 | $8,757,234 | |
| Bing | $98,312 | $208,100 | $305,482 | $573,370 | $1,147,062 |
| Apple Search Ads | $0 | $0 | $0 | $258,044 | $0 |
| Total | $2,258,743 | $4,739,636 | $4,570,668 | $5,883,032 | $9,904,297 |
Figure 12: Distribution of search engine marketing media expenditures over 5 years
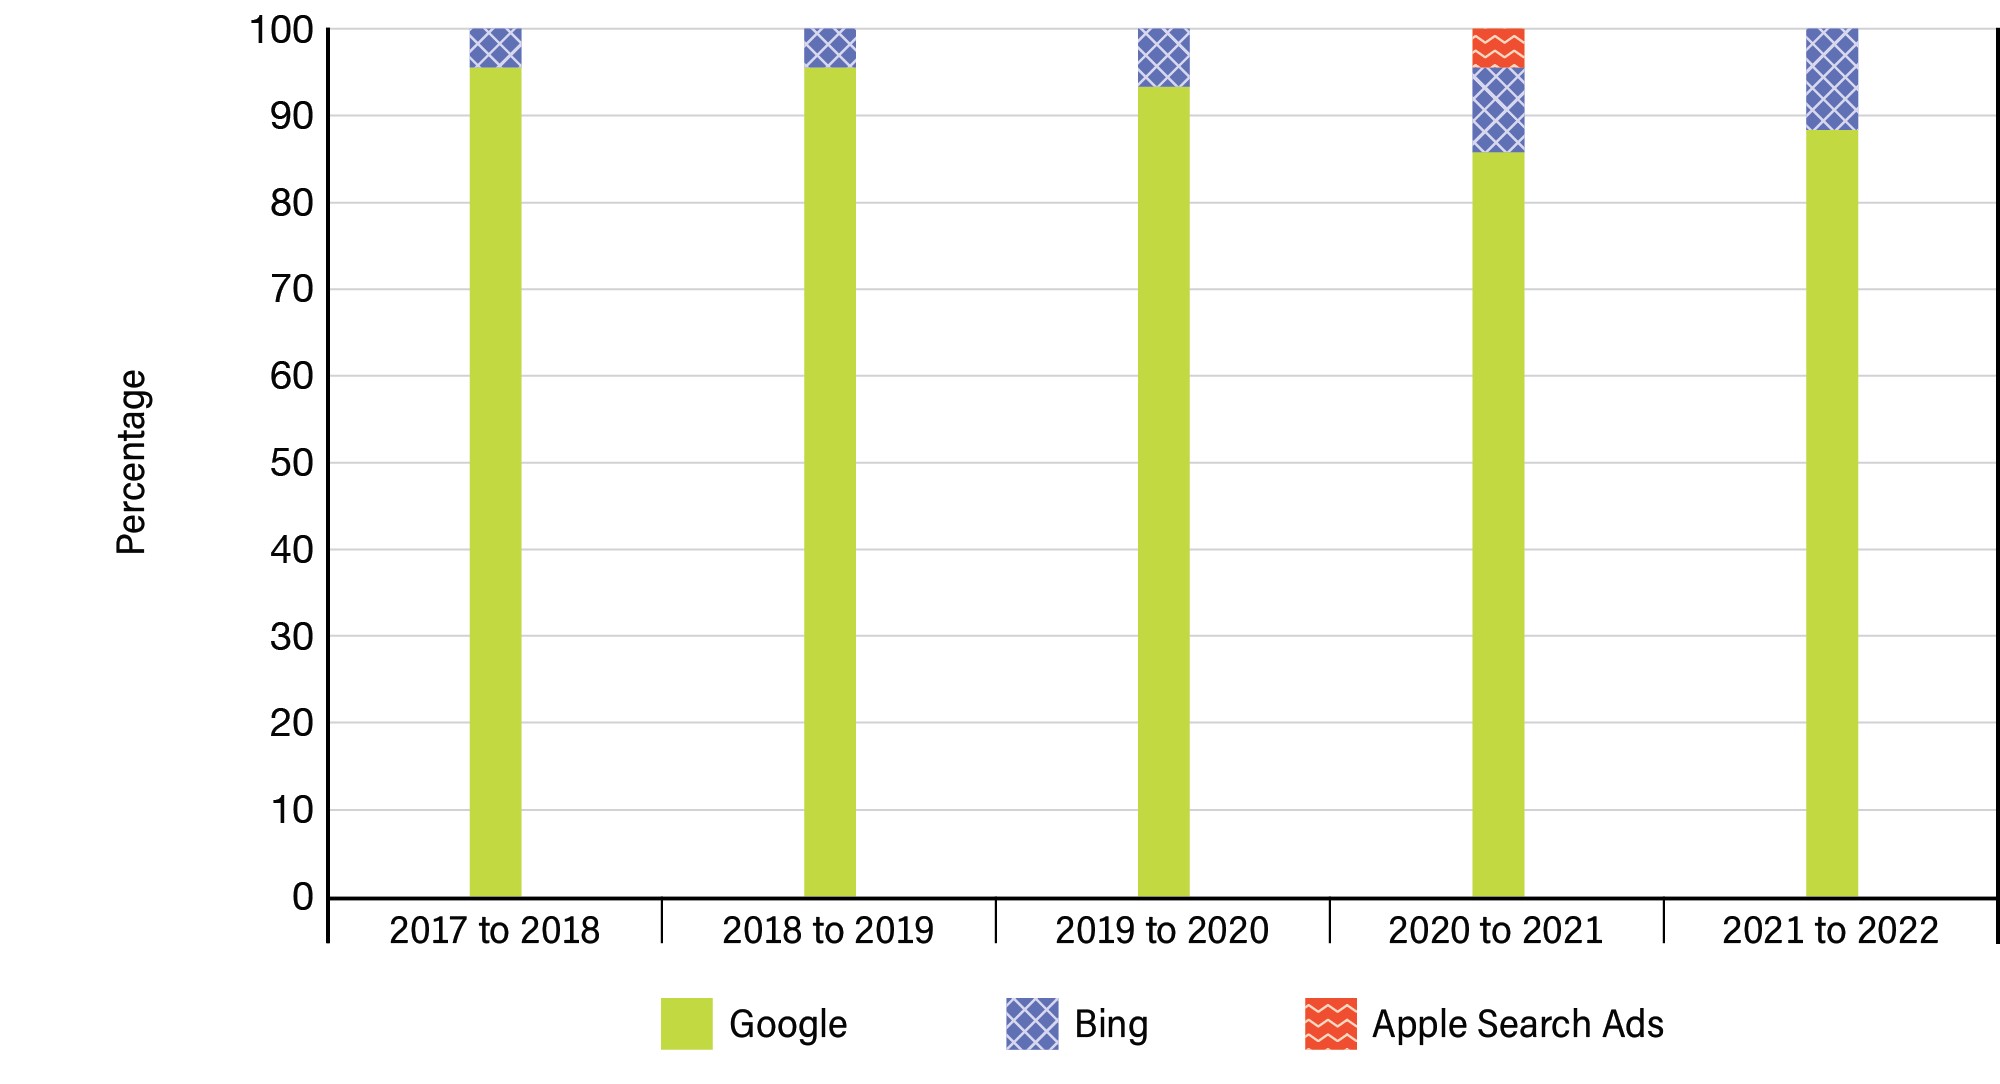
Image description
This vertical bar graphic presents the percentage distribution of search engine marketing media expenditures by platform over five years, from fiscal year 2017 to 2018 to fiscal year 2021 to 2022. The platforms are Google, Bing and Apple Search Ads. The graphic is provided for illustration purposes. The information illustrated by the graphic is the following:
| Platform | 2017 to 2018 | 2018 to 2019 | 2019 to 2020 | 2020 to 2021 | 2021 to 2022 |
|---|---|---|---|---|---|
| 96% | 96% | 93% | 86% | 88% | |
| Bing | 4% | 4% | 7% | 10% | 12% |
| Apple Search Ads | 0% | 0% | 0% | 4% | 0% |
| Total | 100% | 100% | 100% | 100% | 100% |
Figure 13: Traditional media expenditures over 5 years
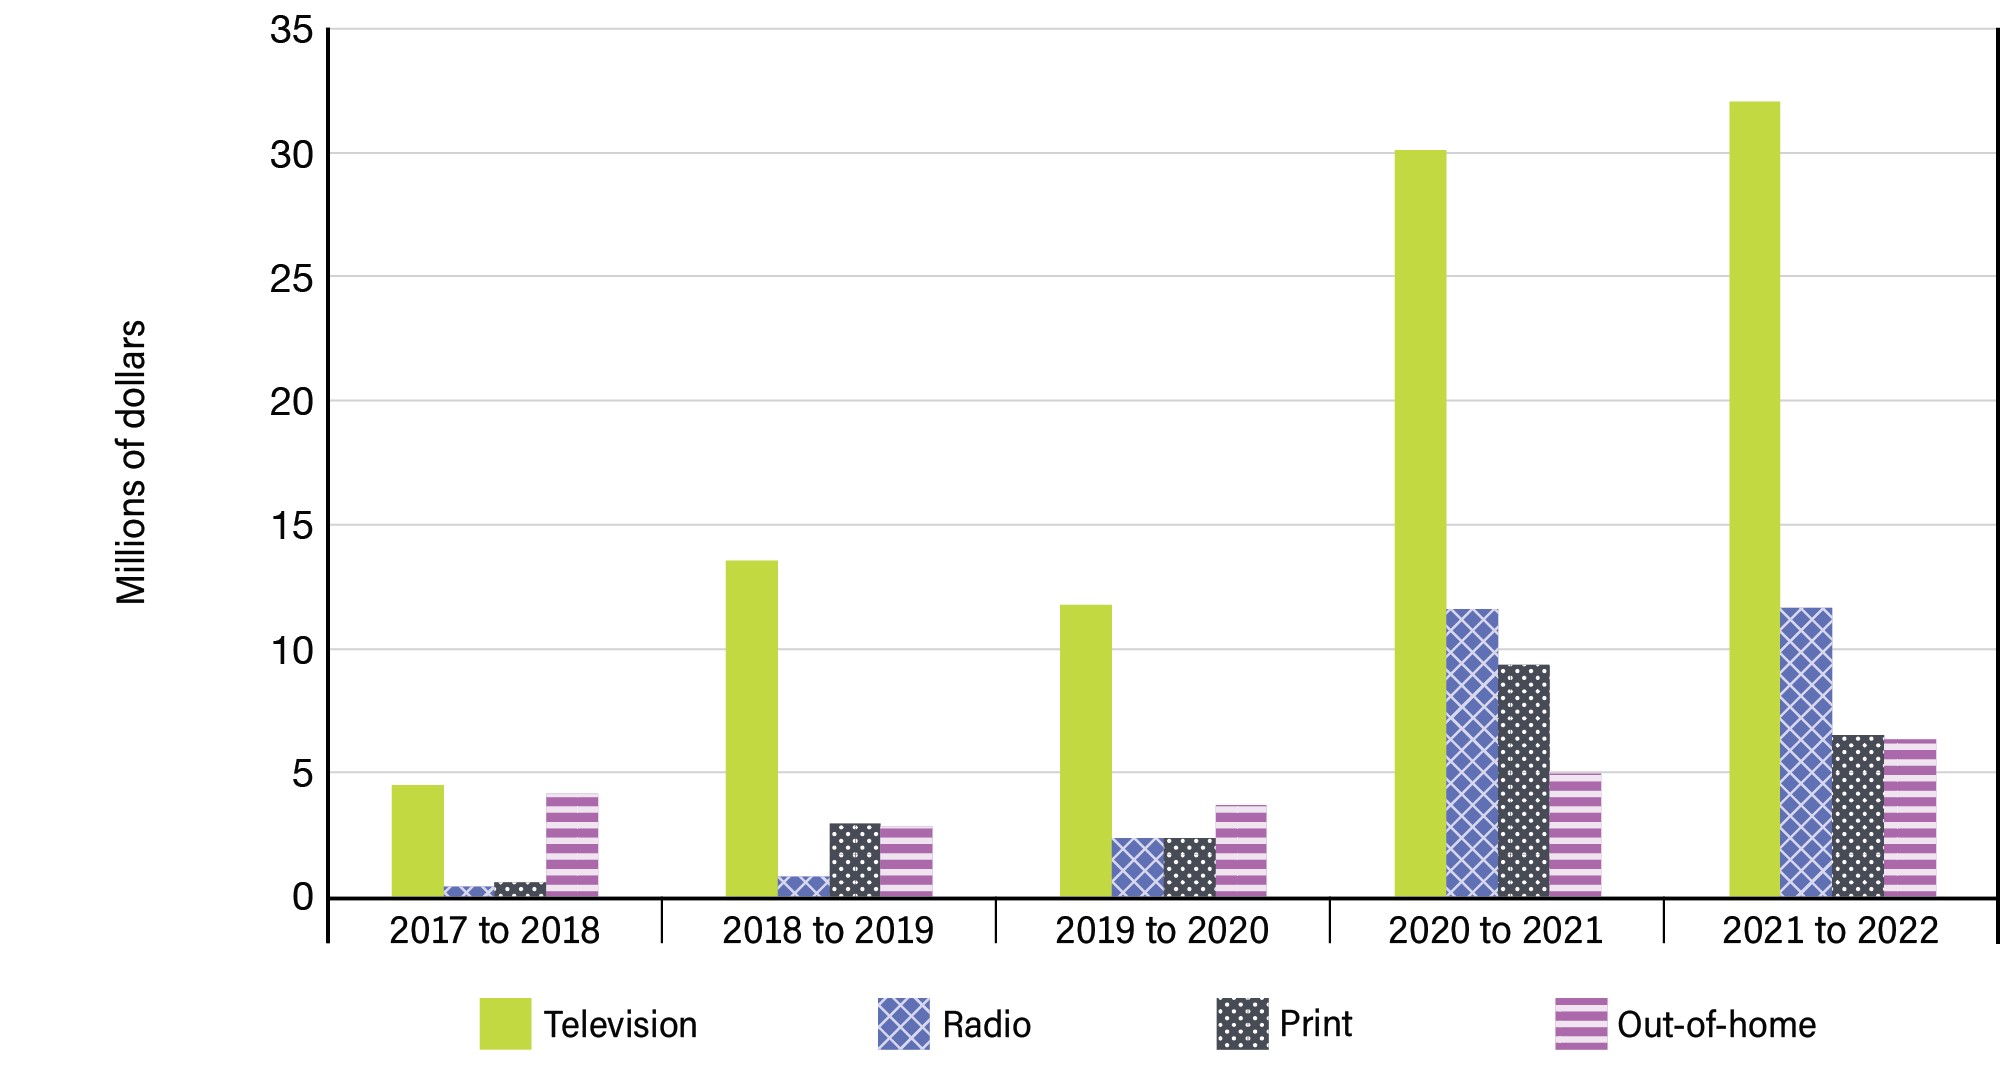
Image description
This vertical bar graphic presents traditional media expenditures by media type in millions of dollars over five years, from fiscal year 2017 to 2018 to fiscal year 2021 to 2022. The media types are television, radio, print and out-of-home. The graphic is provided for illustration purposes. The information illustrated by the graphic is the following:
| Media | 2017 to 2018 | 2018 to 2019 | 2019 to 2020 | 2020 to 2021 | 2021 to 2022 |
|---|---|---|---|---|---|
| Television | $4,470,942 | $13,575,701 | $11,737,577 | $30,125,369 | $32,065,753 |
| Radio | $391,916 | $799,671 | $2,352,370 | $11,590,073 | $11,669,182 |
| $570,196 | $2,921,078 | $2,385,990 | $9,312,472 | $6,511,880 | |
| Out-of-home | $4,177,134 | $2,818,896 | $3,671,456 | $4,966,913 | $6,358,070 |
| Total | $9,610,188 | $20,115,347 | $20,147,394 | $55,994,827 | $56,604,884 |
Figure 14: Distribution of traditional media expenditures by quarter over 5 years
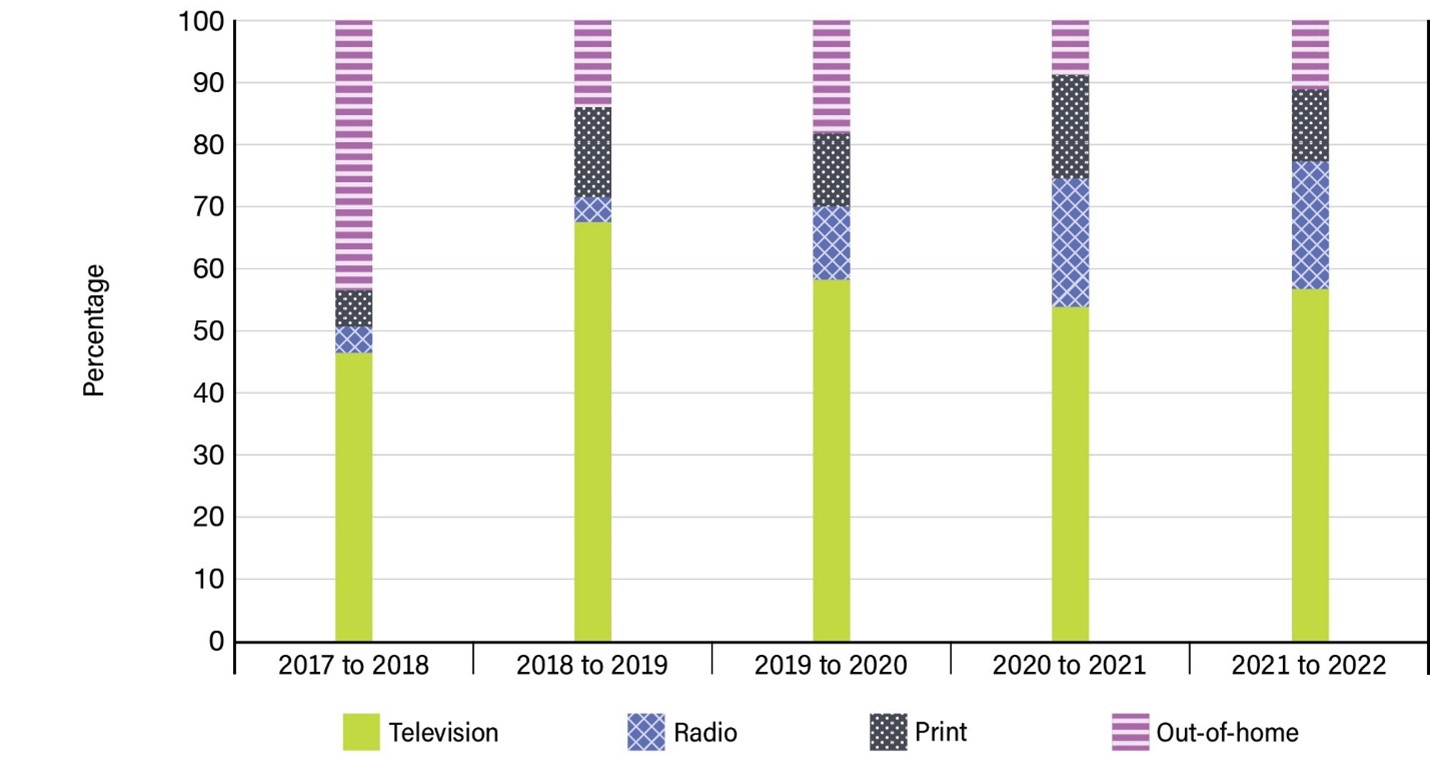
Image description
This vertical bar graphic presents the percentage distribution of traditional media expenditures by media type over five years, from fiscal year 2017 to 2018 to fiscal year 2021 to 2022. The media types are television, radio, print and out-of-home. The graphic is provided for illustration purposes. The information illustrated by the graphic is the following:
| Media | 2017 to 2018 | 2018 to 2019 | 2019 to 2020 | 2020 to 2021 | 2021 to 2022 |
|---|---|---|---|---|---|
| Television | 47% | 67% | 58% | 54% | 57% |
| Radio | 4% | 4% | 12% | 21% | 21% |
| 6% | 15% | 12% | 17% | 12% | |
| Out-of-home | 43% | 14% | 18% | 9% | 11% |
| Total | 100% | 100% | 100% | 100% | 100% |
Figure 15: Media expenditures by quarter over 5 years
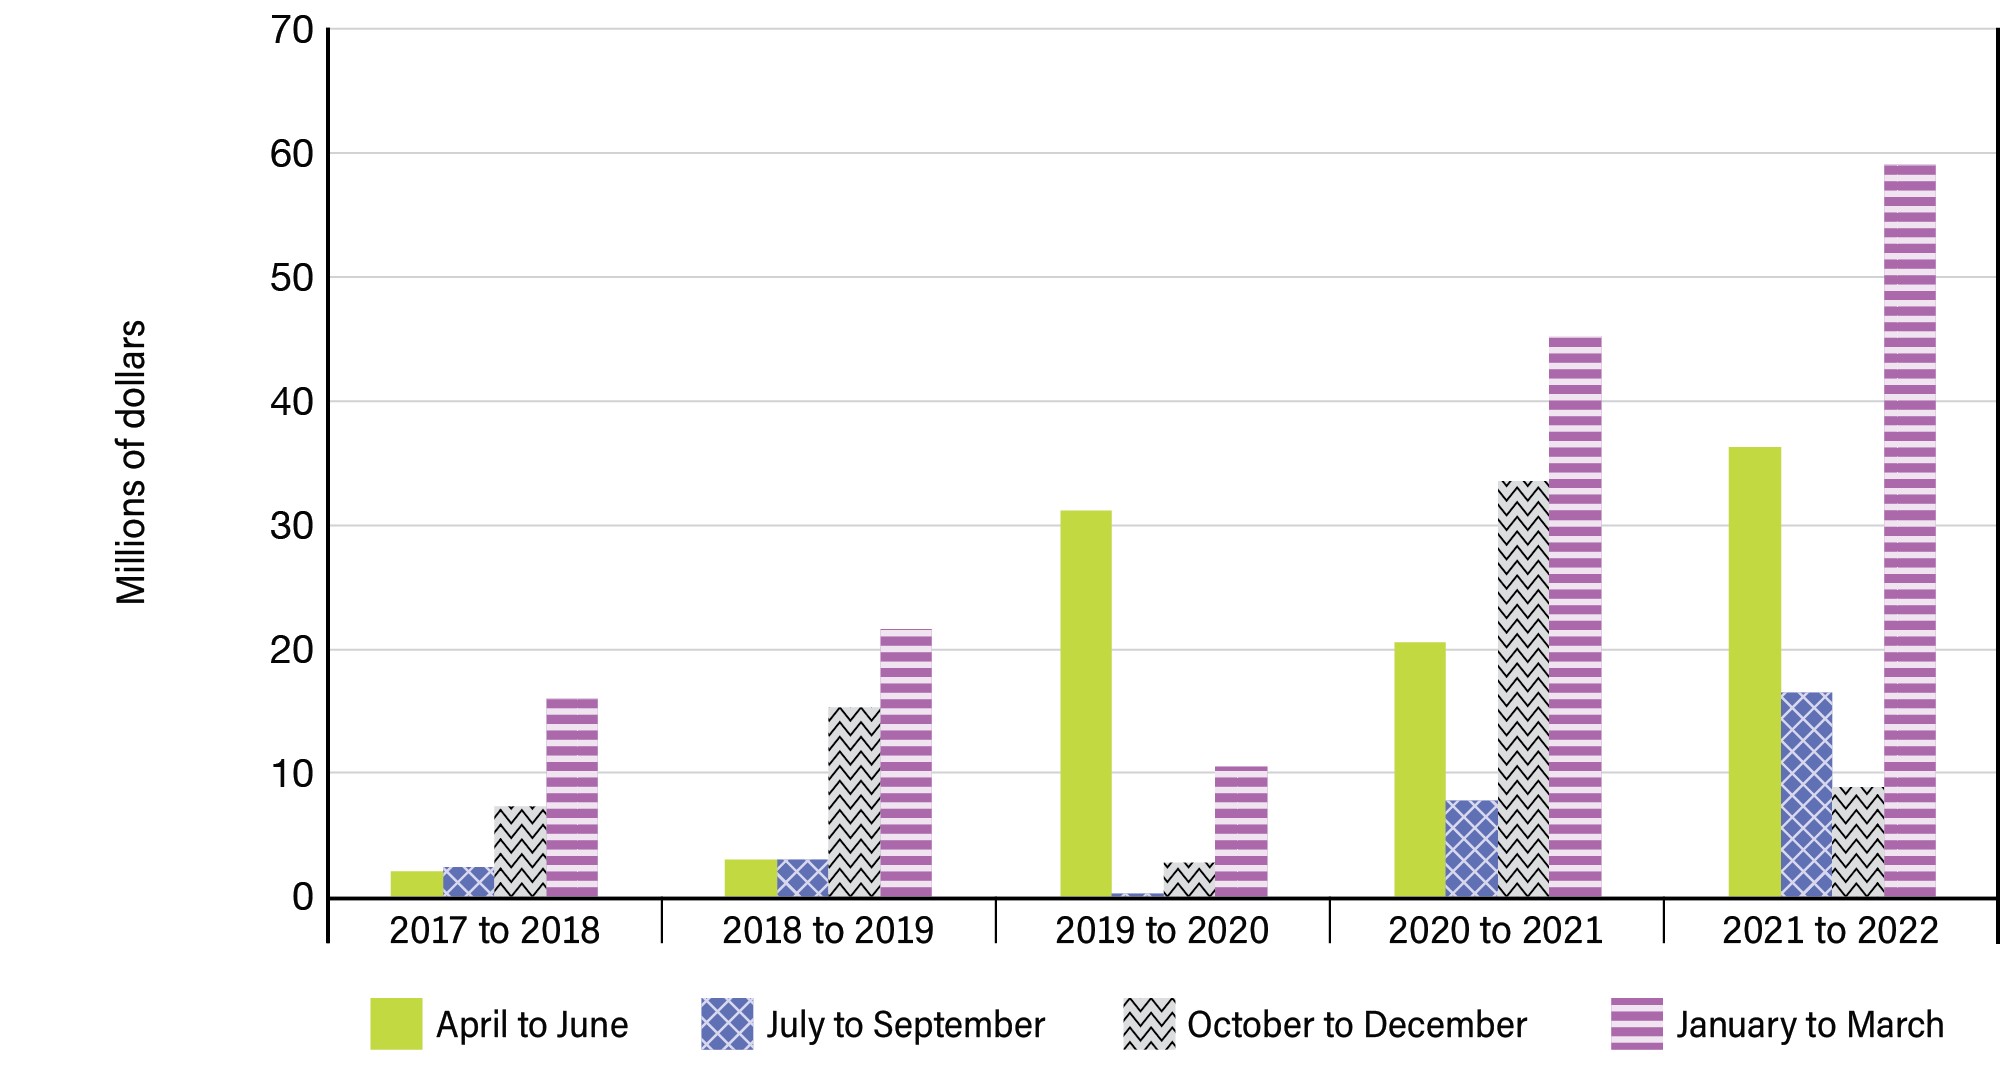
Image description
This vertical bar graphic presents total media expenditures by fiscal year quarter over five years, from fiscal year 2017 to 2018 to fiscal year 2021 to 2022. The fiscal year quarters are April to June, July to September, October to December and January to March. The graphic is provided for illustration purposes. The information illustrated by the graphic is the following:
| Fiscal year quarter | 2017 to 2018 | 2018 to 2019 | 2019 to 2020 | 2020 to 2021 | 2021 to 2022 |
|---|---|---|---|---|---|
| April to June | $2,024,184 | $2,991,500 | $31,189,476 | $20,495,792 | $36,304,752 |
| July to September | $2,412,338 | $3,051,747 | $277,813 | $7,787,842 | $16,509,445 |
| October to December | $7,353,217 | $15,346,757 | $2,808,375 | $33,501,262 | $8,832,678 |
| January to March | $15,973,975 | $21,652,423 | $10,583,481 | $45,182,816 | $59,010,581 |
| Total | $27,763,715 | $43,042,428 | $44,859,145 | $106,967,712 | $120,657,455 |
Figure 16: Distribution of media expenditures by quarter over 5 years
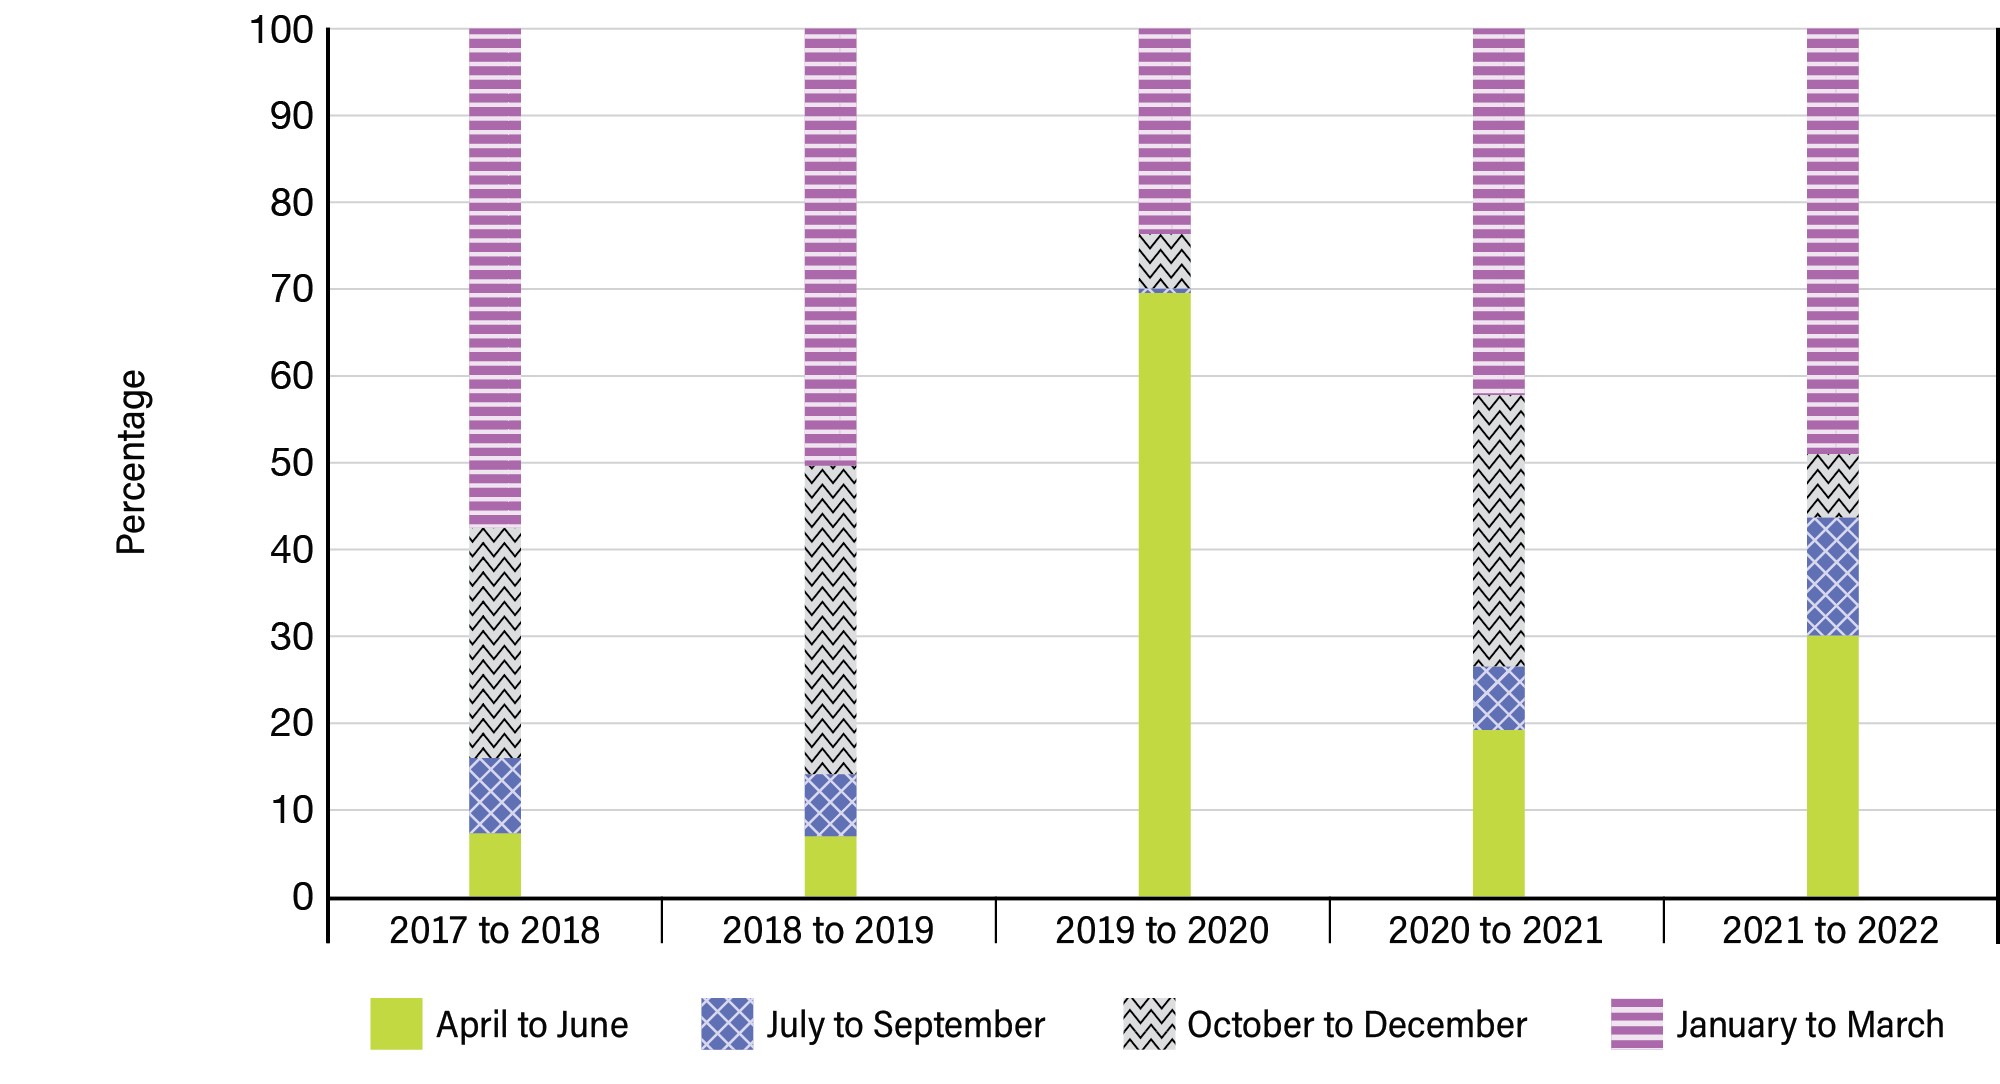
Image description
This vertical bar graphic presents the percentage distribution total media expenditures by fiscal year quarter over five years, from fiscal year 2017 to 2018 to fiscal year 2021 to 2022. The fiscal year quarters are April to June, July to September, October to December and January to March. The graphic is provided for illustration purposes. The information illustrated by the graphic is the following:
| Fiscal year quarter | 2017 to 2018 | 2018 to 2019 | 2019 to 2020 | 2020 to 2021 | 2021 to 2022 |
|---|---|---|---|---|---|
| April to June | 7% | 7% | 70% | 19% | 30% |
| July to September | 9% | 7% | 1% | 7% | 14% |
| October to December | 26% | 36% | 6% | 31% | 7% |
| January to March | 58% | 50% | 24% | 42% | 49% |
| Total | 100% | 100% | 100% | 100% | 100% |
Official languages
Reaching Canadians in the official language of their choice, regardless of where they reside, is a mandatory requirement for GC advertising. All media plans are developed, reviewed and approved in accordance with this requirement. Amounts in the tables below include media expenditures for all media placement in English and French. Table 1 provides an overview and tables 2 and 3 provide details on digital and traditional media expenditures.
Media expenditures by official language are based on ad language. Media expenditures for bilingual ads are divided equally between English and French.
| English | Distribution | French | Distribution | Total | |
|---|---|---|---|---|---|
| Media | Expenditures | Expenditures | |||
| Digital | $46,963,288 | 74% | $16,444,423 | 26% | $63,407,711 |
| Traditional | $43,070,428 | 80% | $10,482,750 | 20% | $53,553,178 |
| Total | $90,033,716 | 77% | $26,927,173 | 23% | $116,960,889 |
| English | Distribution | French | Distribution | Total | |
|---|---|---|---|---|---|
| Media | Expenditures | Expenditures | |||
| Display programmatic | $18,587,320 | 73% | $6,833,499 | 27% | $25,420,819 |
| Social media | $15,791,295 | 75% | $5,143,680 | 25% | $20,934,975 |
| Search engine marketing | $6,987,013 | 73% | $2,623,727 | 27% | $9,610,740 |
| Display non-programmatic | $5,597,661 | 75% | $1,843,517 | 25% | $7,441,177 |
| Total | $46,963,288 | 74% | $16,444,423 | 26% | $63,407,711 |
| English | Distribution | French | Distribution | Total | |
|---|---|---|---|---|---|
| Media | Expenditures | Expenditures | |||
| Television | $27,217,761 | 88% | $3,841,627 | 12% | $31,059,388 |
| Radio | $7,954,188 | 75% | $2,607,430 | 25% | $10,561,618 |
| Out-of-home | $3,265,693 | 51% | $3,092,377 | 49% | $6,358,070 |
| $4,632,787 | 83% | $941,316 | 17% | $5,574,103 | |
| Total | $43,070,428 | 80% | $10,482,750 | 20% | $53,553,178 |
Ethnic and Indigenous media
Ethnic and Indigenous media are also used to reach ethnic and Indigenous audiences. The media are multilingual and can include ads in various languages as well as English and French. Amounts in the tables below include media expenditures for all media placement in ethnic and Indigenous media. Table 4 provides an overview and tables 5 and 6 provide details on traditional and digital media expenditures.
| Ethnic | Distribution | Indigenous | Distribution | |
|---|---|---|---|---|
| Media | Expenditures | Expenditures | ||
| Traditional | $7,259,135 | 81% | $4,260,069 | 75% |
| Digital | $1,672,087 | 19% | $1,382,572 | 25% |
| Total | $8,931,223 | 100% | $5,642,642 | 100% |
| Ethnic | Distribution | Indigenous | Distribution | |
|---|---|---|---|---|
| Media | Expenditures | Expenditures | ||
| Radio | $2,187,977 | 30% | $3,226,778 | 76% |
| Television | $3,453,894 | 48% | $806,400 | 19% |
| $1,617,265 | 22% | $226,892 | 5% | |
| Total | $7,259,135 | 100% | $4,260,069 | 100% |
| Ethnic | Distribution | Indigenous | Distribution | |
|---|---|---|---|---|
| Media | Expenditures | Expenditures | ||
| Display programmatic | $1,157,528 | 69% | $372,039 | 27% |
| Social media | $416,529 | 25% | $806,042 | 58% |
| Display non-programmatic | $98,030 | 6% | $138,661 | 10% |
| Search engine marketing | $0 | 0% | $65,831 | 5% |
| Total | $1,672,087 | 100% | $1,382,572 | 100% |
International audiences
International media are also used to reach audiences outside Canada. The media are multilingual and can include ads in various languages as well as English and French. Amounts in table 7 below include media expenditures for all media placement outside Canada, which this year consisted only of digital media.
| Media | Expenditures | Distribution |
|---|---|---|
| Display programmatic | $1,769,379 | 42% |
| Search engine marketing | $1,340,560 | 32% |
| Social media | $936,676 | 22% |
| Display non-programmatic | $122,489 | 3% |
| Total | $4,169,104 | 100% |
COVID-19
This section provides information that has been compiled for the annual report on an exceptional basis given the unique and historical situation with the pandemic.
The tables below provide information on media expenditures in COVID-19 campaigns that ran during fiscal year 2021 to 2022. This includes all media placement made through the AOR, on behalf of GC institutions, including the Public Health Agency of Canada, the Department of Finance Canada and Global Affairs Canada. Table 8 provides an overview and tables 9 and 10 provide details on traditional and digital media expenditures.
Advertising associated with the COVID-19 pandemic was initially launched in fiscal year 2019 to 2020 and continued over the last two fiscal years. For more information on advertising expenditures reported in the previous two fiscal years, consult the sections dedicated to this topic in the 2019 to 2020 Annual report on Government of Canada advertising activities and the 2020 to 2021 Annual Report on Government of Canada Advertising Activities.
Values in the tables below represent net media costs paid to suppliers for the purchase of advertising space and time. Fees paid to the AOR to perform the media placement, as well as media planning and creative production expenditures are excluded.
| Media | Expenditures | Distribution |
|---|---|---|
| Traditional | $32,726,189 | 53% |
| Digital | $29,286,752 | 47% |
| Total | $62,012,941 | 100% |
| Media | Expenditures | Distribution |
|---|---|---|
| Television | $20,122,902 | 61% |
| Radio | $5,172,263 | 16% |
| Out-of-home | $4,248,525 | 13% |
| $3,182,499 | 10% | |
| Total | $32,726,189 | 100% |
| Media | Expenditures | Distribution |
|---|---|---|
| Display programmatic | $11,461,021 | 39% |
| Social media | $9,509,611 | 32% |
| Search engine marketing | $4,888,330 | 17% |
| Display non-programmatic | $3,427,790 | 12% |
| Total | $29,286,752 | 100% |
Government of Canada advertising expenditures
This section provides information on advertising expenditures reported by Government of Canada (GC) institutions. Amounts represent total advertising expenditures, which encompasses media planning, media placement with and without the Agency of Record (AOR), as well as creative production. A total of 42 institutions undertook advertising activities, which also involved one AOR and 10 creative agencies.
All GC advertising campaigns with a budget over $250,000 undergo a mandatory external review, the Advertising Oversight Mechanism (non-partisan review process), to ensure that all advertising creatives meet the criteria for non-partisan communications. Results are available online.
Note
Values are rounded to the nearest whole number. The sum of values may not add up exactly to the totals indicated due to rounding.
| Institution | With the AOR | Without the AOR | Total |
|---|---|---|---|
| Public Health Agency of Canada | $61,779,631 | $97,523 | $61,877,154 |
| Statistics Canada | $11,903,781 | $15,337 | $11,919,118 |
| Department of Finance Canada | $8,951,386 | $19,731 | $8,971,117 |
| Employment and Social Development Canada | $8,005,390 | $15,421 | $8,020,811 |
| Canada Revenue Agency | $7,925,884 | $8,002 | $7,933,886 |
| Public Safety Canada | $7,284,987 | $0 | $7,284,987 |
| National Defence | $6,420,619 | $100,818 | $6,521,438 |
| Immigration, Refugees and Citizenship Canada | $4,313,086 | $9,263 | $4,322,348 |
| Global Affairs Canada | $4,046,561 | $242,051 | $4,288,612 |
| Environment and Climate Change Canada | $4,050,232 | $72,637 | $4,122,869 |
| Veterans Affairs Canada | $3,707,685 | $28,814 | $3,736,498 |
| Innovation, Science and Economic Development Canada | $3,053,391 | $91,821 | $3,145,212 |
| Health Canada | $2,023,550 | $22,825 | $2,046,375 |
| Canadian Food Inspection Agency | $1,286,158 | $64,403 | $1,350,561 |
| Parks Canada | $885,682 | $432,636 | $1,318,318 |
| Financial Consumer Agency of Canada | $964,980 | $0 | $964,980 |
| Indigenous Services Canada | $788,232 | $16,793 | $805,025 |
| National Film Board | $0 | $640,213 | $640,213 |
| Transport Canada | $85,153 | $216,113 | $301,266 |
| Public Services and Procurement Canada | $35,530 | $226,147 | $261,676 |
| Impact Assessment Agency of Canada | $0 | $128,469 | $128,469 |
| Fisheries and Oceans Canada | $0 | $124,673 | $124,673 |
| The National Battlefields Commission | $0 | $112,875 | $112,875 |
| Agriculture and Agri-Food Canada | $95,356 | $0 | $95,356 |
| Natural Resources Canada | $0 | $89,053 | $89,053 |
| Communications Security Establishment Canada | $52,387 | $0 | $52,387 |
| Canadian Grain Commission | $0 | $43,051 | $43,051 |
| Canadian Centre for Occupational Health and Safety | $38,300 | $0 | $38,300 |
| Office of the Superintendent of Financial Institutions Canada | $0 | $34,256 | $34,256 |
| Canadian Heritage | $0 | $33,913 | $33,913 |
| National Research Council Canada | $0 | $33,380 | $33,380 |
| Crown-Indigenous Relations and Northern Affairs Canada | $0 | $28,924 | $28,924 |
| Canadian Northern Economic Development Agency | $0 | $26,013 | $26,013 |
| Public Service Commission of Canada | $0 | $24,709 | $24,709 |
| Administrative Tribunals Support Service of Canada | $0 | $20,420 | $20,420 |
| Canadian Institutes of Health Research | $0 | $20,275 | $20,275 |
| Correctional Service Canada | $0 | $12,460 | $12,460 |
| Transportation Safety Board of Canada | $0 | $2,166 | $2,166 |
| Canada Energy Regulator | $0 | $2,158 | $2,158 |
| Royal Canadian Mounted Police | $0 | $1,573 | $1,573 |
| Accessibility Standards Canada | $0 | $809 | $809 |
| Immigration and Refugee Board of Canada | $0 | $34 | $34 |
| Total | $137,697,959 | $3,059,757 | $140,757,716 |
Appendices
In this section
Appendix I: Glossary
This section provides definitions of terms used in this report related to Government of Canada (GC) advertising, for clarity and to ensure common understanding. The terms may have a broader meaning beyond this report and therefore, these definitions should only be applied in the context of this report.
- Advertising
-
In the context of all GC advertising activities, “advertising” is defined as (Policy on Communications and Federal Identity, Appendix: Definitions):
Any message conveyed in Canada or abroad and paid for by the Government for placement in media, including but not limited to newspapers, television, radio, cinema, billboards and other out-of-home media, mobile devices, the Internet, and any other digital medium.
- Advertising expenditures
- Total of all expenditures, including media planning, media placement and creative production.
- Agency of Record (AOR)
- Private sector supplier selected by the GC following a rigorous, open and transparent procurement process, as sole supplier responsible for planning, negotiation, placement, verification and consolidation of GC advertising media placement.
- Digital
- All advertising on the Internet, including display programmatic and non-programmatic, social media and search engine marketing.
- Display
- Advertising on the Internet through banners, including various formats made up of text, images, video and audio.
- Display non-programmatic
- Display advertising purchased through direct buys where media suppliers receive insertion orders or contracts and billing takes place between the suppliers and the AOR.
- Display programmatic
- Display advertising purchased and served in real time through demand-side platforms, supply-side platforms and an ad server, managed by the AOR using programmed algorithms and where billing is managed through the ad server. This includes, but is not limited to, all media placement on YouTube.
- Media expenditures
- Net media costs paid to suppliers for advertising space and time. Fees paid to the AOR to perform the media placement, as well as media planning and creative production costs are excluded.
- Media placement
- The purchase of advertising space and time from media suppliers, such as websites, social media platforms, television networks or stations, radio stations, newspapers, magazines, etc.
- Non-partisan communications
-
In the context of all GC communications products and activities, “non-partisan” means (Policy on Communications and Federal Identity, Appendix: Definitions):
- objective, factual and explanatory;
- free from political party slogans, images, identifiers, bias, designation or affiliation;
- the primary colour associated with the governing party is not used in a dominant way, unless an item is commonly depicted in that colour; and
- advertising is devoid of any name, voice or image of a minister, member of Parliament or senator.
- Out-of-home
- Advertising in various media outside of people’s homes, such as billboards, signs, street furniture, such as bus shelters or benches, in-transit areas like airports or train stations, location-based advertising, such as stadiums, cinema, etc.
- Search engine marketing
- Advertising on search engine platforms on the Internet.
- Social media
- All advertising on social media platforms on the Internet, including Facebook/Instagram, Twitter, Snapchat, LinkedIn, TikTok and Pinterest.
Appendix II: Process
The Government of Canada (GC) has an obligation to inform Canadians about policies, programs, services, rights and responsibilities, as well as to alert them of dangers to health, safety or the environment. Advertising is one means of communications used to achieve this.
Rigorous annual planning and reporting mechanisms are in place to ensure that advertising activities align to government priorities, comply with applicable laws, policies and related instruments, and meet the information needs of Canadians.
GC advertising is conducted in accordance with the Policy on Communications and Federal Identity and its supporting instruments. Many organizations are involved, including institutions, the Privy Council Office (PCO), the Treasury Board of Canada Secretariat (TBS) and Public Services and Procurement Canada (PSPC). Their relationships and primary responsibilities are described below:
Institutions
Departments and other portions of the federal public administration operating under Schedules I, I.1 and II of the Financial Administration Act develop advertising plans based on the priorities of the institutions and the Government.
Once approval is obtained, institutions work with PSPC for the procurement of advertising services as needed. Creative services are provided by creative agencies, and media planning and buying services are provided by the Agency of Record (AOR). Heads of communications can decide to purchase media space directly from media outlets for campaigns that have a total media buy of $25,000 or less, in accordance with the Directive on the Management of Communications.
Institutions are responsible for managing all aspects of their advertising activities and for ensuring that campaigns reach their target audiences using the appropriate media with the appropriate message at the correct time. Along with this, they are responsible for ensuring that all communications adhere to the Official Languages Act, and for evaluating the effectiveness of their advertising activities.
Institutions are also required to record all their advertising activities in the GC Advertising Management System (AdMIS), which is maintained by PSPC and used to produce the Annual Report on Government of Canada Advertising Activities.
Privy Council Office
PCO sets broad government communications themes that reflect government priorities, as determined by the Prime Minister, Cabinet, Cabinet committees and the Clerk of the Privy Council.
Institutions are required to submit their advertising plans to PCO, which then works with the Prime Minister’s Office to develop the GC annual advertising plan. Once the plan is approved by the Prime Minister, PCO prepares relevant documentation so that institutions receive funding from the central advertising fund; institutions can also fund their advertising activities from their own budgets.
PCO also provides government-wide oversight of GC advertising activities and coordinates GC advertising to ensure that the overall approved budget levels are respected and that evaluation results are used to help inform the development of future advertising activities.
Treasury Board of Canada Secretariat
TBS issues administrative policies, including the Policy on Communications and Federal Identity, which governs communications activities, including advertising. The Policy aligns GC communications practices with today’s digital environment and includes a requirement that all communications products and activities, including advertising, be non-partisan.
TBS oversees the non-partisan advertising review process for campaigns over $250,000. It also monitors the effectiveness of the process and publishes the review results and decisions on Canada.ca.
TBS also manages the Treasury Board submission process to secure advertising funding for institutions.
Public Services and Procurement Canada
Three directorates at PSPC are involved, including the Advertising Services Directorate (ASD), the Communications and Advertising Procurement Directorate (CAPD) and the Public Opinion Research Directorate (PORD):
ASD:
- provides technical advice and advisory and coordination services to GC institutions on the government advertising process, best practices, and relevant laws, policies and related instruments;
- manages the AOR contract;
- works with the CAPD to develop advertising services procurement tools for use by GC institutions, which align with current industry best practices and today’s environment;
- provides training to the government advertising community to ensure that their knowledge and abilities remain up to date;
- maintains AdMIS and issues project registration numbers for advertising activities and advertising numbers (ADV) for media placement to GC institutions to record all their advertising activities and expenditures; and
- produces the Annual Report on Government of Canada Advertising Activities.
CAPD:
- sole authority responsible for the procurement of advertising and public opinion research services, including pre- and post-campaign testing and evaluation for advertising activities;
- manages the procurement process to select advertising services suppliers for GC institutions; and
- works with ASD to develop advertising services procurement tools for use by GC institutions.
PORD:
- advises institutions about the public opinion research process, research methodologies, and compliance with relevant laws, policies and related instruments; and
- reviews research projects related to advertising pretesting and evaluation, a mandatory process for campaigns with media buys over $1 million.
Appendix III: Laws and policies
Laws
- Financial Administration Act
- The purpose of this Act is to provide for the financial administration of the GC, the establishment and maintenance of the accounts of Canada and the control of Crown corporations.
- Official Languages Act
-
The purpose of this Act is to:
- ensure respect for English and French as the official languages of Canada and ensure equality of status and equal rights and privileges as to their use in all federal institutions, in particular with respect to their use in parliamentary proceedings, in legislative and other instruments, in the administration of justice, in communicating with or providing services to the public and in carrying out the work of federal institutions;
- support the development of English and French linguistic minority communities and generally advance the equality of status and use of the English and French languages within Canadian society; and
- set out the powers, duties and functions of federal institutions with respect to the official languages of Canada.
Policies
- Common Services Policy
- This policy sets out common services that GC institutions must use to fulfill their requirements. Public Services and Procurement Canada (PSPC) is identified as a mandatory common service organization for the coordination of, and contracting for all advertising services requirements.
- Policy on Communications and Federal Identity
- This policy gives context and rules for how the GC enables communication with the public about policies, programs, services and initiatives, including the administration of the GC official symbols.
- Directive on the Management of Communications
- This directive provides rules for managing and coordinating communications, including procedures for advertising, public opinion research, social media and web communications.
- Appendix B: Mandatory Procedures for Advertising
- These procedures are an appendix to the Directive on the Management of Communications. They provide procedural rules for planning and coordination, contracting, production and media planning, as well as pretesting and evaluation of GC advertising activities.
- Advertising Oversight Mechanism
- The Directive on the Management of Communications requires that GC advertising comply with the oversight mechanism for non-partisan advertising. The mechanism is an external review process that supports the Government’s commitment to ensure that all communications, including advertising, are non-partisan.
Information contained in this publication may be reproduced, in part or in whole, and by any means, for personal or public non-commercial purposes, without charge or further permission. Commercial reproduction and distribution are prohibited except with written permission from Public Services and Procurement Canada (PSPC). For more information, consult the terms and conditions on PSPC's website concerning copyright ownership and restrictions.
For additional information, contact:
Advertising Services Directorate
PSPC
Ottawa ON K1A 0S5
Email: tpsgc.dgsidcpprapportpub-isbacpdadvreport.pwgsc@tpsgc-pwgsc.gc.ca
© His Majesty the King in Right of Canada, as represented by the Minister of Public Works and Government Services, 2023.
Cat. No.: P100-2E-PDF (electronic PDF, English)
International Standard Serial Number (ISSN): 1925-8887
Cat. No.: P100-2F-PDF (electronic PDF, French)
International Standard Serial Number (ISSN): 1925-6833