Program financial performance: The Long Term Vision and Plan for the Parliamentary Precinct—Annual Report 2020 to 2021
On this page
Fiscal year financial highlights
Note
The content of this report highlighted several projects and initiatives outside the scope of the 2020 to 2021 fiscal year. However, all financial tables reflect expenditures up to March 31, 2021.
Significant progress was made in 2020 to 2021 to advance the Long Term Vision and Plan (LTVP), as well as the planning of future projects. The LTVP’s total expenditures were $354.9 million, (as seen in Figure 1), where 73% of the total expenditure seen was for the advancement of the Centre Block Rehabilitation Program and the East Block Rehabilitation Phase 1 Project.
Figure 1. Long Term Vision and Plan expenditures in fiscal year 2020 to 2021
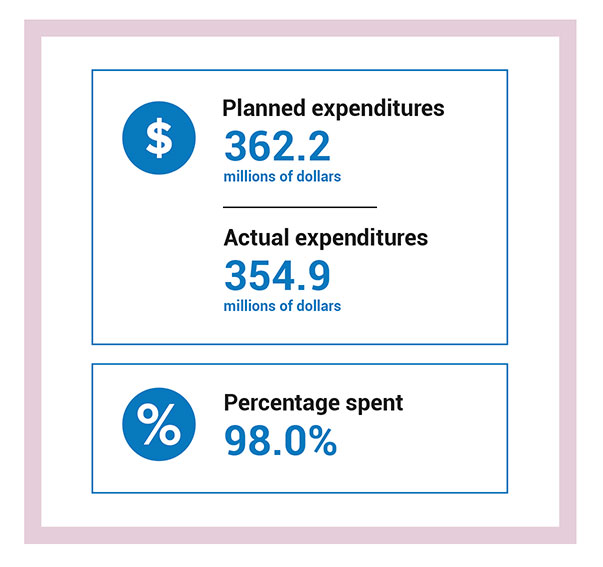
Image description of figure 1
Planned expenditures
- 362.2 millions of dollars
Actual expenditures
- 354.9 millions of dollars
Percentage spent
- 98%
A breakdown of the 5 program components is shown in Figure 2. The Major Capital Program (MCP) represented 81.7% of all LTVP expenditures, while the Planning Program (4.9%), the Building Components and Connectivity Program (BCC) (4.7%), and the Recapitalization Program (RECAP) (8.7%) represented much smaller portions of expenditures. There was no spending for the Security Infrastructure Program in 2020 to 2021.
Figure 2. Total Long Term Vision and Plan expenditures by program for the fiscal year 2020 to 2021 (in millions of dollars)
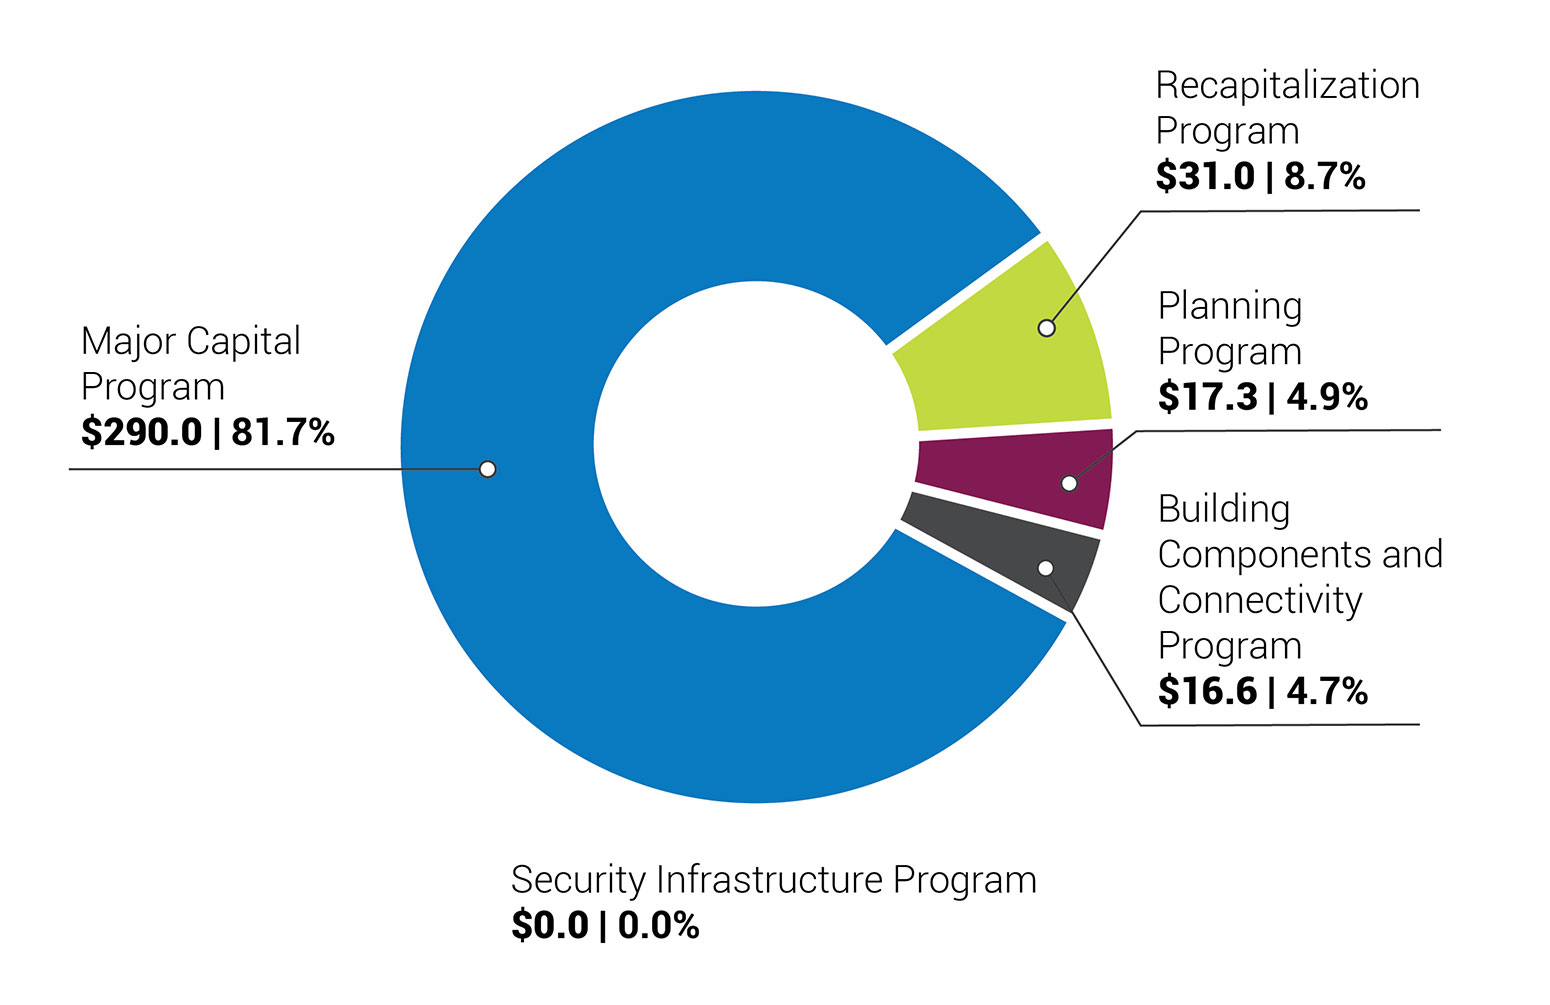
Image description of figure 2
Major Capital Program
- Annual expenditures: $290.0
- Percentage spent: 81.7%
Recapitalization Program
- Annual expenditures: $31.0
- Percentage spent: 8.7%
Planning Program
- Annual expenditures: $17.3
- Percentage spent: 4.9%
Building Components and Connectivity Program
- Annual expenditures: $16.6
- Percentage spent: 4.7%
Security Infrastructure Program
- Annual expenditures: $0.0
- Percentage spent: 0.0%
Figure 3. Total Long Term Vision and Plan planned expenditures by program for the fiscal year 2020 to2021 (in millions of dollars)
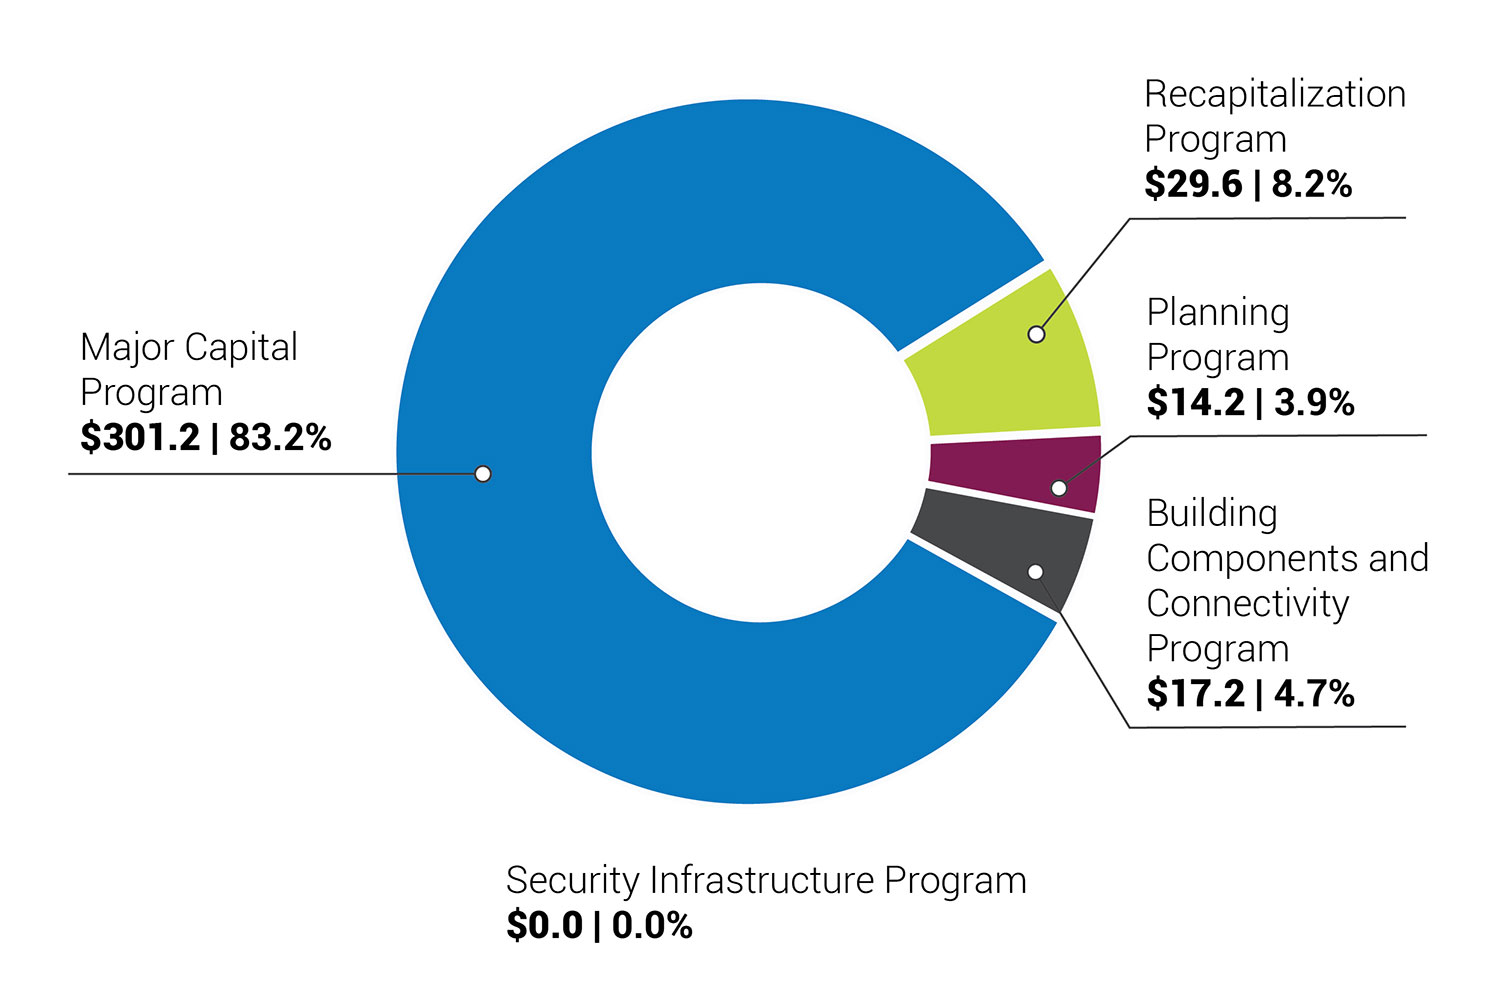
Image description of figure 3
Major Capital Program
- Annual expenditures: $301.2
- Percentage spent: 83.2%
Recapitalization Program
- Annual expenditures: $29.6
- Percentage spent: 8.24%
Planning Program
- Annual expenditures: $14.2
- Percentage spent: 3.9%
Building Components and Connectivity Program
- Annual expenditures: $17.2
- Percentage spent: 4.7%
Security Infrastructure Program
- Annual expenditures: $0.0
- Percentage spent: 0.0%
Major Capital Program
The Major Capital Program (MCP) manages rehabilitation and new construction projects. This includes the construction and fit-up of all buildings in the Precinct for interim and permanent accommodations.
Financial performance
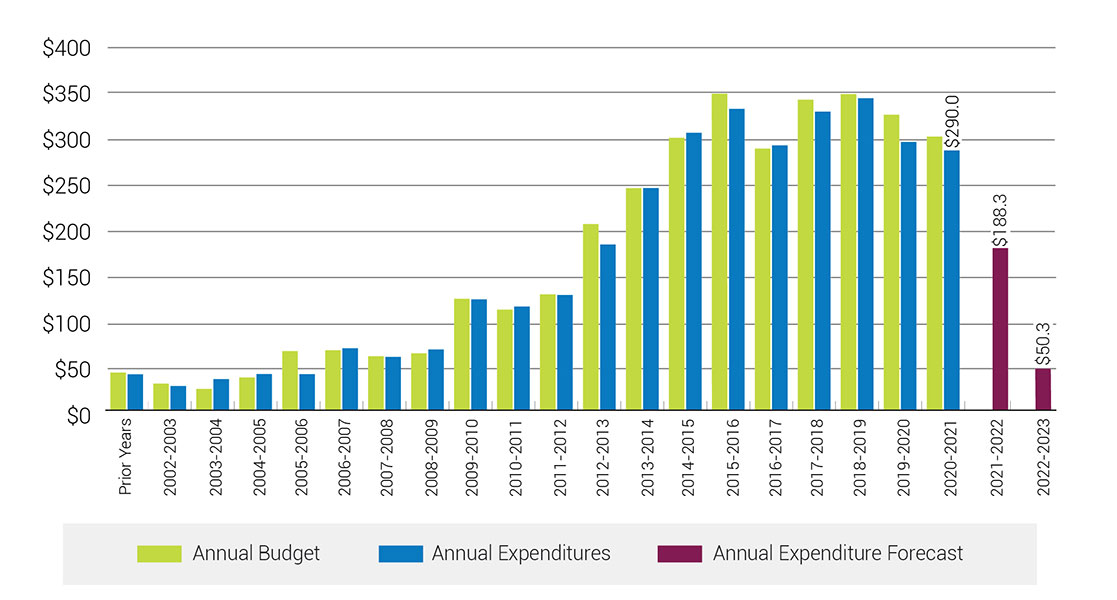
- MCP expenditures were $290 million, a decrease from expenditures in the previous fiscal year. This had been expected due to the fact that major projects were completed ahead of the implementation of the next rolling program of work (Figure 4).
- All MCP projects came in on time, on scope, and on budget.
- Looking ahead, the total annual expenditures within MCP are expected to be considerably higher due to increased work planned for the Centre Block Rehabilitation and the Parliament Welcome Centre Complex projects, and the addition of the Block 2 Rehabilitation project.
Figure 4. Long Term Vision and Plan Major Capital Program annual expenditures, forecasts and budgets for the fiscal year 2020 to 2021 (in millions of dollars)
Text version of figure 4
| Year | Annual budget | Annual expenditures | Annual expenditure forecast |
|---|---|---|---|
| Prior years | $46.0 | $44.1 | N/A |
| 2002 to 2003 | $29.1 | $26.5 | N/A |
| 2003 to 2004 | $23.4 | $38.8 | N/A |
| 2004 to 2005 | $40.6 | $44.4 | N/A |
| 2005 to 2006 | $64.5 | $44.2 | N/A |
| 2006 to 2007 | $65.4 | $67.5 | N/A |
| 2007 to 2008 | $58.9 | $58.2 | N/A |
| 2008 to 2009 | $62.1 | $66.3 | N/A |
| 2009 to 2010 | $121.3 | $120.7 | N/A |
| 2010 to 2011 | $109.6 | $112.9 | N/A |
| 2011 to 2012 | $126.2 | $125.5 | N/A |
| 2012 to 2013 | $202.8 | $180.4 | N/A |
| 2013 to 2014 | $246.6 | $246.8 | N/A |
| 2014 to 2015 | $301.4 | $306.9 | N/A |
| 2015 to 2016 | $346.6 | $328.0 | N/A |
| 2016 to 2017 | $289.7 | $293.1 | N/A |
| 2017 to 2018 | $342.8 | $336.9 | N/A |
| 2018 to 2019 | $349.0 | $346.4 | N/A |
| 2019 to 2020 | $321.7 | $299.4 | N/A |
| 2020 to 2021 | $301.2 | $290.0 | N/A |
| 2021 to 2022 | N/A | N/A | $188.3 |
| 2022 to 2023 | N/A | N/A | $50.3 |
Figures for fiscal year 2020 to 2021 represent planned expenditures, instead of budget.
Recapitalization Program
The Recapitalization Program (RECAP) addresses projects in buildings that are occupied and operational but have not yet been fully rehabilitated.
Financial performance
- RECAP expenditures were $31 million (Figure 5), an increase due to work planned for the East Block Rehabilitation Phase 1 Project, the West Block lighting implementation, the North Slope vegetation management, and the Queen’s Gate accessibility projects.
- All RECAP projects finished on time, on scope, and on budget.
- Going forward, the total annual expenditures within RECAP are also expected to increase as more of the buildings are fully rehabilitated and the program begins to implement grounds improvement, for example, West Block Lighting implementation and North Slope vegetation management.
Figure 5. Long Term Vision and Plan Recapitalization Program annual expenditures, forecasts and budgets for the fiscal year 2020 to 2021 (in millions of dollars)
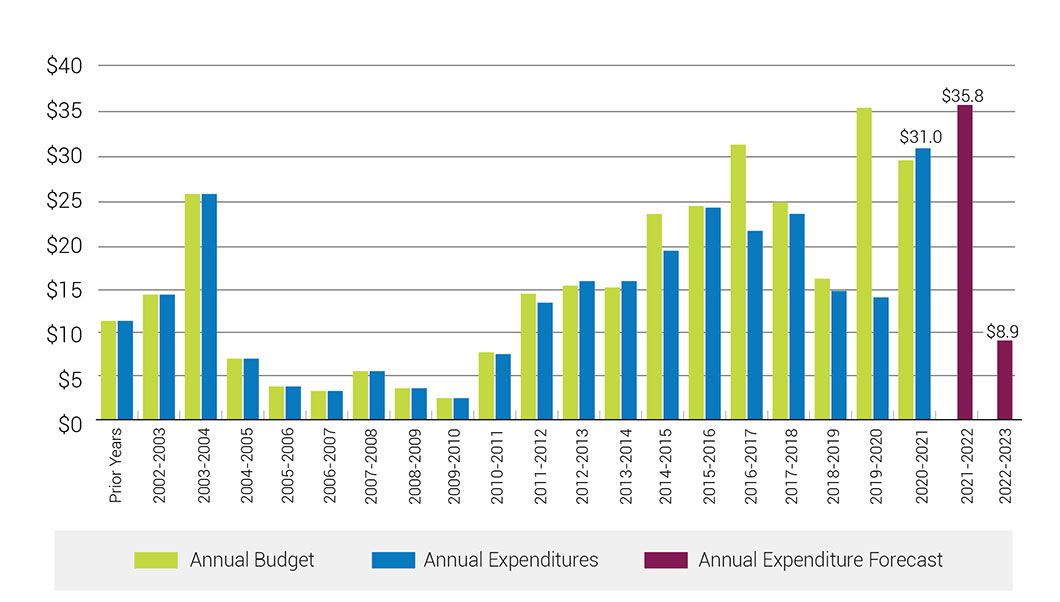
Text version of figure 5
| Year | Annual budget | Annual expenditures | Annual expenditure forecast |
|---|---|---|---|
| Prior years | $11.0 | $11.0 | N/A |
| 2002 to 2003 | $14.4 | $14.4 | N/A |
| 2003 to 2004 | $25.6 | $25.6 | N/A |
| 2004 to 2005 | $6.8 | $6.8 | N/A |
| 2005 to 2006 | $3.7 | $3.7 | N/A |
| 2006 to 2007 | $3.2 | $3.2 | N/A |
| 2007 to 2008 | $5.4 | $5.4 | N/A |
| 2008 to 2009 | $3.5 | $3.5 | N/A |
| 2009 to 2010 | $2.4 | $2.4 | N/A |
| 2010 to 2011 | $7.5 | $7.3 | N/A |
| 2011 to 2012 | $14.5 | $13.5 | N/A |
| 2012 to 2013 | $15.4 | $15.9 | N/A |
| 2013 to 2014 | $15.2 | $15.9 | N/A |
| 2014 to 2015 | $22.9 | $18.8 | N/A |
| 2015 to 2016 | $23.8 | $23.6 | N/A |
| 2016 to 2017 | $31.1 | $21.5 | N/A |
| 2017 to 2018 | $24.7 | $23.4 | N/A |
| 2018 to 2019 | $15.7 | $14.8 | N/A |
| 2019 to 2020 | $35.2 | $14.1 | N/A |
| 2020 to 2021 | $29.6 | $31.0 | N/A |
| 2021 to 2022 | N/A | N/A | $35.8 |
| 2022 to 2023 | N/A | N/A | $8.9 |
Figures for fiscal year 2020 to 2021 represent planned expenditures, instead of budget.
Building Components and Connectivity Program
The Building Components and Connectivity Program (BCC) consists of the modernization of campus-wide communication and information technology (IT) infrastructure for more than 30 buildings within the Precinct in order to meet the modern business needs of parliamentarians.
Financial performance
- BCC expenditures were $16.6 million, a decrease from expenditures in the previous fiscal year (Figure 6).
- All BCC projects were completed on time, on scope, and on budget.
- The total annual expenditures within BCC are expected to increase slightly as the work progresses mainly due to the increased work planned for the datacentre disaster recovery project.
Figure 6. Long Term Vision and Plan Building Connectivity and Components Program annual expenditures, forecasts and budgets for the fiscal year 2020 to 2021 (in millions of dollars)
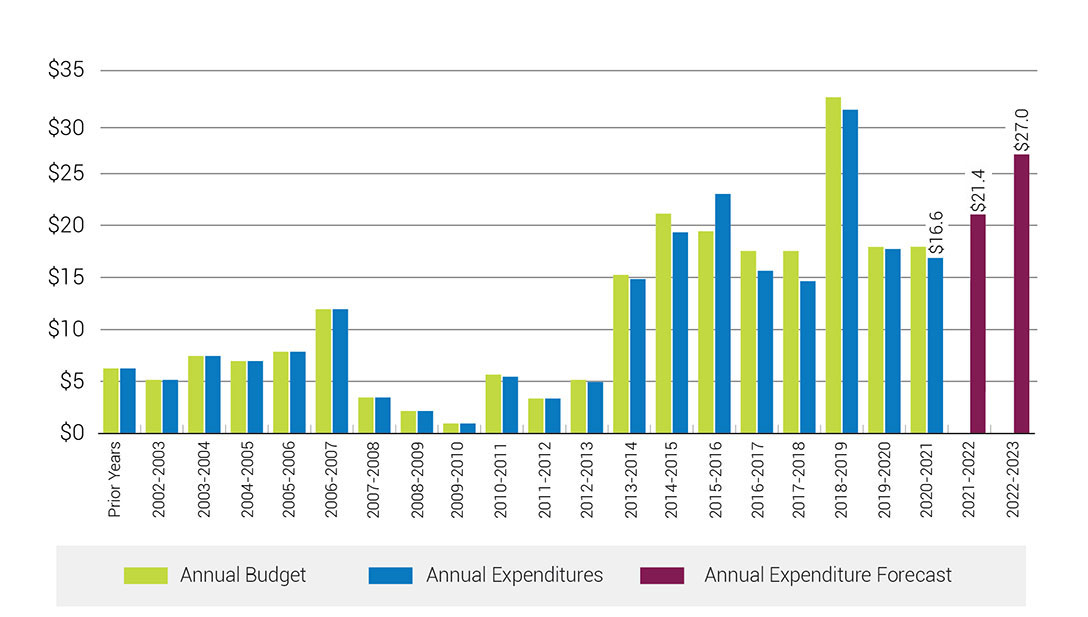
Text version of figure 6
| Year | Annual budget | Annual expenditures | Annual expenditure forecast |
|---|---|---|---|
| Prior years | $6.3 | $6.3 | N/A |
| 2002 to 2003 | $5.2 | $5.2 | N/A |
| 2003 to 2004 | $7.5 | $7.5 | N/A |
| 2004 to 2005 | $7.0 | $7.0 | N/A |
| 2005 to 2006 | $7.9 | $7.9 | N/A |
| 2006 to 2007 | $12.0 | $12.0 | N/A |
| 2007 to 2008 | $3.5 | $3.5 | N/A |
| 2008 to 2009 | $2.2 | $2.2 | N/A |
| 2009 to 2010 | $1.0 | $1.0 | N/A |
| 2010 to 2011 | $5.7 | $5.5 | N/A |
| 2011 to 2012 | $3.4 | $3.4 | N/A |
| 2012 to 2013 | $5.2 | $5.0 | N/A |
| 2013 to 2014 | $15.3 | $14.9 | N/A |
| 2014 to 2015 | $21.2 | $19.4 | N/A |
| 2015 to 2016 | $19.5 | $23.1 | N/A |
| 2016 to 2017 | $17.6 | $15.7 | N/A |
| 2017 to 2018 | $17.6 | $14.7 | N/A |
| 2018 to 2019 | $32.4 | $31.2 | N/A |
| 2019 to 2020 | $18.0 | $17.8 | N/A |
| 2020 to 2021 | $17.2 | $16.6 | N/A |
| 2021 to 2022 | N/A | N/A | $21.4 |
| 2022 to 2023 | N/A | N/A | $27.0 |
Figures for fiscal year 2020 to 2021 represent planned expenditures, instead of budget.
Planning Program
The Planning Program involves the development of strategic master plans, implementation plans, and enabling studies to guide investment decisions and the prioritization of future projects. This initiative provides overall coordination between active projects to ensure they dovetail and contribute to the broader objectives of the LTVP vision and principles. Once projects have been identified and the pre-planning and planning work is complete, projects are transferred to the MCP and RECAP programs for delivery.
Financial performance
- Planning Program expenditures were $17.3 million, a decrease from expenditures in the previous fiscal year (Figure 7).
- In future, the total annual expenditures within the Planning Program are expected to continue to decrease due to the reduction in campus planning and program support activities.
Figure 7. Long Term Vision and Plan Planning Program annual expenditures, forecasts and budgets for the fiscal year 2020 to 2021 (in millions of dollars)
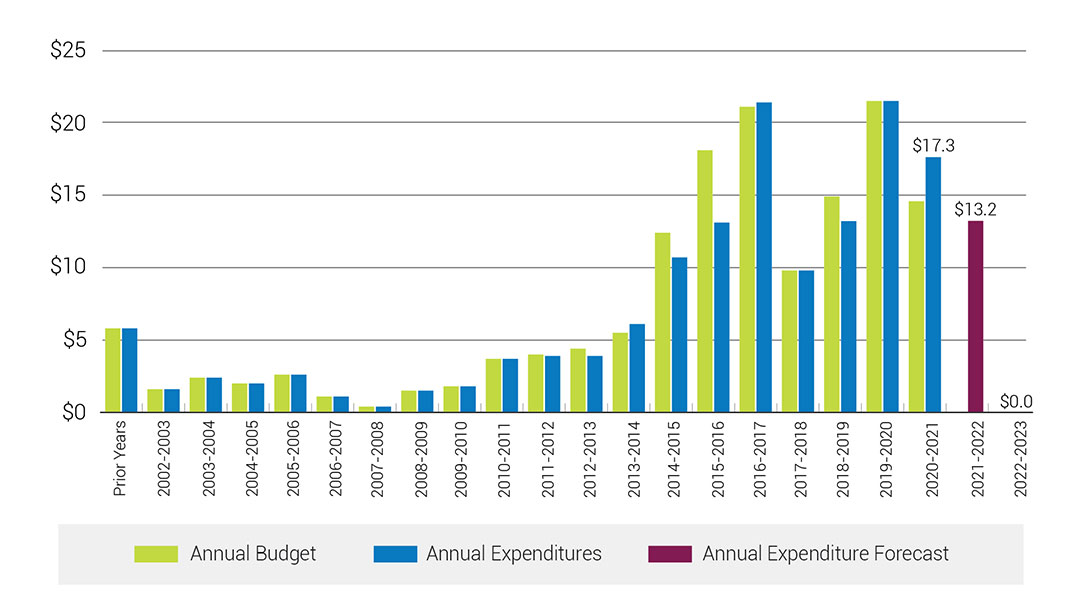
Text version of figure 7
| Year | Annual budget | Annual expenditures | Annual expenditure forecast |
|---|---|---|---|
| Prior years | $5.8 | $5.8 | N/A |
| 2002 to 2003 | $1.6 | $1.6 | N/A |
| 2003 to 2004 | $2.4 | $2.4 | N/A |
| 2004 to 2005 | $2.0 | $2.0 | N/A |
| 2005 to 2006 | $2.6 | $2.6 | N/A |
| 2006 to 2007 | $1.1 | $1.1 | N/A |
| 2007 to 2008 | $0.4 | $0.4 | N/A |
| 2008 to 2009 | $1.5 | $1.5 | N/A |
| 2009 to 2010 | $1.8 | $1.8 | N/A |
| 2010 to 2011 | $3.7 | $3.7 | N/A |
| 2011 to 2012 | $4.0 | $3.9 | N/A |
| 2012 to 2013 | $4.4 | $3.9 | N/A |
| 2013 to 2014 | $5.5 | $6.1 | N/A |
| 2014 to 2015 | $12.4 | $10.7 | N/A |
| 2015 to 2016 | $18.1 | $13.1 | N/A |
| 2016 to 2017 | $21.1 | $21.4 | N/A |
| 2017 to 2018 | $9.8 | $9.8 | N/A |
| 2018 to 2019 | $14.9 | $13.2 | N/A |
| 2019 to 2020 | $21.5 | $21.5 | N/A |
| 2020 to 2021 | $14.2 | $17.3 | N/A |
| 2021 to 2022 | N/A | N/A | $13.2 |
| 2022 to 2023 | N/A | N/A | $0.0 |
Figures for fiscal year 2020 to 2021 represent planned expenditures, instead of budget.
Security Infrastructure Program
The Security Infrastructure Program (security, material handling, etc.) focuses on the implementation of improved and modernized security measures in the Precinct.
Financial performance
- As projected, there were no expenditures for the Security Infrastructure Program this year (Figure 8).
- Looking ahead, the total annual expenditures within the Security Infrastructure Program are expected to remain at 0. There are no planned projects specific to this program because security projects are being rolled up under MCP or IT BCC initiatives.
Figure 8. Long Term Vision and Plan Security Infrastructure Program annual expenditures, forecasts and budgets for the fiscal year 2020 to 2021 (in millions of dollars)
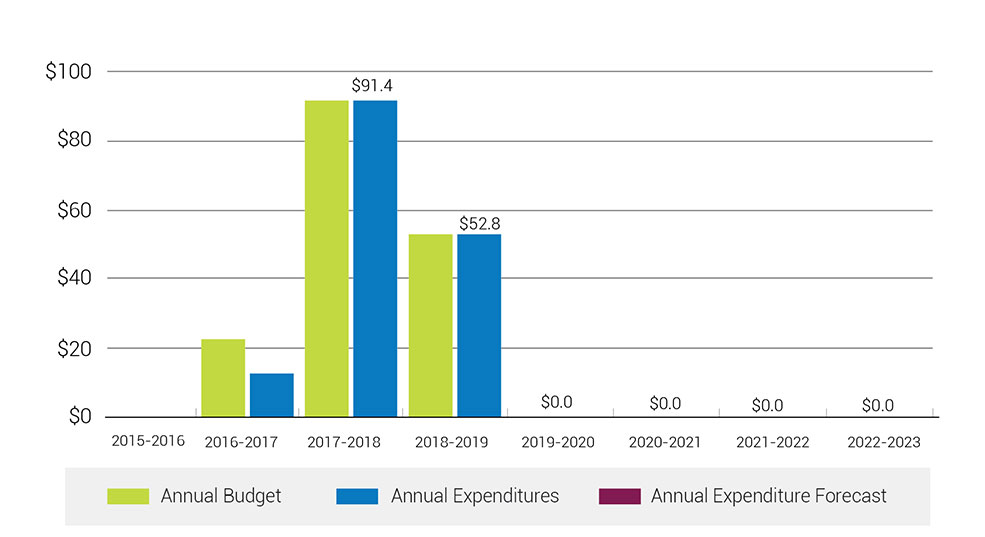
Text version of figure 8
| Year | Annual budget | Annual expenditures | Annual expenditure forecast |
|---|---|---|---|
| 2015 to 2016 | $0.0 | $0.0 | N/A |
| 2016 to 2017 | $22.5 | $12.6 | N/A |
| 2017 to 2018 | $91.4 | $91.4 | N/A |
| 2018 to 2019 | $52.8 | $52.8 | N/A |
| 2019 to 2020 | $0.0 | $0.0 | N/A |
| 2020 to 2021 | $0.0 | $0.0 | N/A |
| 2021 to 2022 | N/A | N/A | $0.0 |
| 2022 to 2023 | N/A | N/A | $0.0 |
Figures for fiscal year 2020 to 2021 represent planned expenditures, instead of budget.