
Modelling of greenhouse gas projections
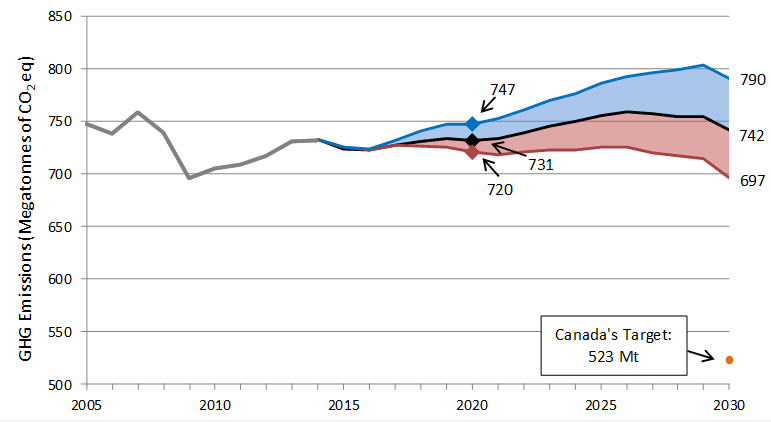
Environment and Climate Change Canada prepares the Government of Canada’s official projections of greenhouse gas emissions (GHG) on an annual basis and has released its 2016 emissions projections to 2030 in Canada’s 2016 Greenhouse Gas Emissions Reference Case. The report provides a “reference case” projection of emissions through 2030 and shows that, with policies and measures in place as of November 1, 2016, total Canadian GHG emissions would be 731 megatonnes of carbon dioxide equivalent (Mt CO2eq) in 2020 and 742 Mt in 2030.
ECCC uses a recognized energy and macroeconomic modeling framework in the estimation of emissions and economic interactions, using its Energy, Emissions and Economy Model for Canada (E3MC) to prepare scenarios of emissions projections. E3MC has two components: Energy 2020, which incorporates Canada’s energy supply and demand structure, and a macroeconomic model of the Canadian economy. (For more information on the models and methodology, please see Canada’s Emissions Trends 2014).
Each year, ECCC updates its models using the most recent historical data available from Statistics Canada’s Report on Energy Supply and Demand in Canada and Environment and Climate Change Canada’s National Inventory Report on Greenhouse Gas Sources and Sinks in Canada. For the 2016 projections, the most recent historical data available are for 2014. The projections are also based on the latest energy and economic data including: National Energy Board views on energy prices, oil and gas production and large-scale energy projects; economic growth from Finance Canada’s November 2016 Update of Economic and Fiscal Projections; and Statistics Canada’s population growth projections. The reference case includes new federal, provincial and territorial policies and measures that have legislated or funding certainty and that are in place as of November 1st, 2016.
There is considerable uncertainty surrounding energy price and economic growth assumptions, particularly over the medium to long term. As such, a range of emissions is presented under different economic and energy price and production scenarios (see report for details). The graph below shows the expected range of emissions in 2020 and 2030 based on high and low GDP growth as well as high and low oil prices and production levels. These scenarios suggest that the expected emission range could be between 697 Mt in the lowest emissions scenario and 790 Mt in the highest emissions scenario.
Of note, the projections do not include emissions or sequestrations from land use, land-use change and forestry.
Projections and underlying assumptions for the 2016 projections have been through a consultation process with key stakeholders, including provincial/territorial officials. A more detailed examination of methodological approaches is performed periodically by leading external experts on economic modeling and GHG emissions projections.
Canada’s Domestic Emissions Projections in 2020 and 2030 (Mt CO2 eq)
Pathway to Meeting Canada’s 2030 Target
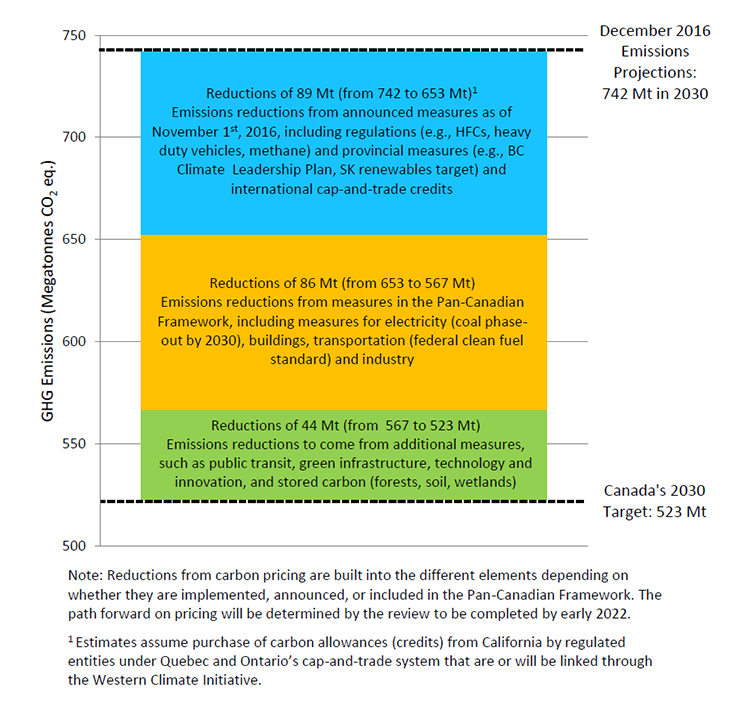
ECCC has also modeled the estimated impacts of policies and measures that have been announced but are not included in the 2016 reference case projections. The GHG impacts in 2030 are shown in the chart below and are estimated reductions in Mt CO2eq as measured from the 2016 reference case baseline of 742 Mt in 2030 (represented by the top dotted line).
The first blue bar reflects measures announced by all levels of government as of November 1, 2016 but which do not yet have sufficient certainty to include in the reference case. These include: federal regulations for hydrofluorocarbons, heavy-duty vehicles; and federal and Alberta proposed regulations to reduce methane emissions in the oil and gas sector. BC’s Climate Leadership Plan and Saskatchewan’s plan to increase renewables for electricity generation are also included to the extent that sufficiently detailed information was available to model. The 89 Mt of reductions also include estimates of purchases of carbon allowances (credits) by entities covered under Ontario and Quebec’s Western Climate Initiative (WCI) cap-and-trade program, as noted below. This reduces projected emissions to 653 Mt in 2030.
The second yellow bar reflects measures in the Pan-Canadian Framework on Clean Growth and Climate Change that are estimated to reduce emissions by 86 Mt including from: coal phase-out by 2030; clean fuel standard; and additional measures for electricity, buildings, transportation and industry. These measures reduce projected emissions to 567 Mt in 2030.
The third green bar reflects reductions to come from additional measures, which have not yet been modelled, such as public transit and green infrastructure; innovation and technological improvement resulting from investments in research, development and deployment of clean technologies; increases in carbon sequestration in forests, soils and wetlands; and any future actions by governments.
The table below presents more detailed information on the pathway to meeting Canada’s 2030 target.
| Blank | Incremental Reduction (Mt) | Total Emissions in 2030 (Mt) | Notes on Modeling Assumptions |
|---|---|---|---|
| Canada’s Second Biennial Report to UNFCCC | – | 815 | See Annex 3 of Canada’s Second Biennial Report on Climate Change for more details. |
| December 2016 Reference Case (dotted line in graph) | 73 | 742 |
Updated GDP (Finance Canada) and energy price and production (National Energy Board) assumptions are revised downwards Federal measures included:
Provincial measures included:
See Canada’s 2016 Greenhouse Gas Emissions Reference Case, December 2016 for more details. |
| FPT Announced Measures (as of November 1st) (blue bar in graph) | 89 | 653 |
Federal measures included:
Provincial measures included:
Assumes Ontario and Quebec meet their legislated emissions targets through international purchases of WCI allowances. |
| Measures in Pan-Canadian Framework (yellow bar in graph) | 86 | 567 |
Measures included in Pan-Canadian Framework in all sectors. Also includes federal measures announced in November 2016 (coal phase-out by 2030 and clean fuel standard). |
| Additional Measures (green bar in graph) | 44 | 523 |
Including emissions reductions to come from a combination of:
|
| Sector 2 | Reductions from December 2016 Reference Case to Pan-Canadian Framework (742 Mt to 567 Mt in 2030) |
|---|---|
| Electricity | 17 Mt (from 34 to 17 Mt) |
| Buildings | 28 Mt (from 94 to 66 Mt) |
| Transportation | 15 Mt (from 157 to 142 Mt) |
| Heavy Industry (including oil and gas) | 56 Mt (from 330 to 274 Mt) |
| Agriculture, Waste and Others | 4 Mt (from 127 to 123 Mt) |
| Purchase of WCI Allowances (Ontario and Quebec) | 55 Mt |
1 Reductions in this table correspond to federal, provincial and territorial announced measures as of November 1, 2016 (blue bar) and measures contained in the Pan-Canadian Framework on Clean Growth and Climate Change (yellow bar).
2 Sectors as defined in Canada’s 2016 Greenhouse Gas Emissions Reference Case