
Biomonitoring Equivalents as a Screening Tool for Population Level Biomonitoring Data: A Health Canada Perspective
Download the alternative format
(PDF format, 730 KB, 37 pages)
Organization: Health Canada
Published: December 2016
Cat.: H129-66/2016E-PDF
ISBN: 978-0-660-06288-4
Prepared by the Task Force on Scientific Risk Assessment (TFSRA)'s Biomonitoring Equivalents Working Group:
- Annie St-Amand, Chemical Surveillance BureauFootnote 1, Environmental and Radiation Health Sciences Directorate (ERSHD), Healthy Environments and Consumer Safety Branch (HECSB)
- Kristin Macey, Existing Substances Risk Assessment Bureau, Safe Environments Directorate, HECSB
- Andy Nong, Environmental Health Sciences and Research Bureau, ERHSD, HECSB
- Mark Feeley, Bureau of Chemical Safety, Food Directorate, Health Products and Food Branch (HPFB)
- Kim Irwin, Pest Management Regulatory Agency, Health Canada
- Victoria Honeyman, Pest Management Regulatory Agency, Health Canada
- Michelle Deveau, Water and Air Quality Bureau, Safe Environments Directorate, HECSB
Reviewers:
- Stephanie Wille, Existing Substances Risk Assessment Bureau, Safe Environments Directorate, HECSB
- Meredith Curren, Chemical Surveillance BureauFootnote 1, ERHSD, HECSB
- Gurusankar Saravanabhavan, Chemical Surveillance BureauFootnote 1, EHRSD, HECSB
- Kate Werry, Chemical Surveillance BureauFootnote 1, ERHSD, HECSB
- Nellie Roest, Chemical Surveillance BureauFootnote 1, ERHSD, HECSB
- Doug Haines, Chemical Surveillance BureauFootnote 1, ERHSD, HECSB
Acknowledgements:
- Bette Meek, McLaughlin Centre for Population Health Risk Assessment, University of Ottawa. This paper uses elements from an unpublished report by Meek, B. (2012)
- Lesa Aylward and Sean Hays, Summit Toxicology. This paper uses elements from an unpublished report by Aylward and Hays (2012)
- Stephanie Wille, Health Canada. This paper uses elements from an unpublished internal report, by Willie et al. (June 29, 2011).
- Janine Murray, Health Canada
- Monique D’Amour, Health Canada
December 2015
Table of Contents
- Acknowledgements:
- Summary
- 1. Introduction
- 2. Purpose and Scope
- 3. Background
- 4. Methods
- 4.1 Derivation Steps
- 4.1.1 Step 1 – Identifying the relevant dose and identifying the target analyte (biomarkers)
- 4.1.2 Step 2 – Assessing the available pharmacokinetic (PK) data and models
- 4.1.3 Step 3 – Calculating the BEPOD and the BE
- 4.1.4 Step 4 – Assessing the variability and uncertainty of the data and derivation
- 4.2 Components Needed
- 4.3 Approaches for Deriving BEs
- 4.1 Derivation Steps
- 5. Development and Peer-Review Process
- 6. Application of BEs
- 7. Advantages and Limitations
- 8. International Perspective
- 9. References
- Appendix A – Summary of Derived BEs
- Appendix B – External Peer Reviews
Summary
The availability of biomonitoring data for the general population in Canada is increasing. These data provide baseline concentrations of environmental contaminants in Canadians and have the potential to inform priority setting for assessment and management of exposures to chemical substances. Due to the lack of guidance values for interpreting biomonitoring data for most environmental contaminants, these data are typically presented without comparison to health risks. As such, it is difficult to determine if exposure levels measured in Canadians may result in potential health risks. One useful tool for interpreting biomonitoring data is the biomonitoring equivalent (BE). By definition, a BE is a calculated concentration of a biomarker (e.g. chemical in blood or urine) consistent with a health protective guidance value for the general population (e.g. tolerable daily intakes, chronic reference doses). BEs were developed principally as screening tools to interpret biomonitoring data in a population health risk context and as such, have potential applications for Health Canada. Specifically, direct comparison of BEs with results from Canadian population biomonitoring studies has the potential to inform decision makers if current exposures are approaching or exceeding tolerable levels for the general population. This exercise can contribute to priority setting for risk assessment and risk management of environmental contaminants by Health Canada.
1. Introduction
Biomonitoring is the measurement of chemicals or their reaction products in human tissues and fluids, most commonly blood, urine and breast milk. Consistent with initiatives in other countries, biomonitoring of the general population in Canada is being conducted as part of the Canadian Health Measures Survey (CHMS) and other studies, such as the Maternal-Infant Research on Environmental Chemicals (MIREC), the First Nations Biomonitoring Initiative (FNBI) and the Northern Contaminants Program (NCP). In addition to establishing baseline levels of environmental contaminants in Canadians, one of the stated objectives of the CHMS is to help identify priority chemicals for which further action should be taken to protect the public’s health.
Over the next few years, the availability of biomonitoring results will increase for a broad range of chemicals. Thus, it is timely to consider how Health Canada can use these biomonitoring data to help identify potential priority chemicals for which further action should be taken. For a few substances including lead and mercury, time- and resource-intensive epidemiological studies have been used to define a direct, quantitative relationship between biomarker measurements and health effects. However, a definitive correlation between health effects and exposure of a population to relatively low levels of an environmental contaminant (as measured by biomonitoring) is unlikely for most chemicals. Therefore other approaches for putting biomonitoring data into a health risk context need to be considered. These options may be descriptive (e.g., comparisons to other biomonitoring datasets) or risk-based approaches that describe the degree of risk associated with a given biomonitoring result (National Research Council [NRC], 2006).
The biomonitoring equivalents approach would help to identify potentially important exposures (NRC, 2007).
2. Purpose and Scope
The specific objective of this report is to outline the utility of BEs as a useful screening tool for interpreting biomonitoring data from the CHMS and other Health Canada biomonitoring initiatives.
In this report, derivation methods for BEs are described in relation to their potential application for Health Canada programs. Initially, background information on BEs is presented. This information is followed by a description of the objectives and nature of guidance for the development of BEs. The relevance and potential application are subsequently considered followed by a discussion of the current international context, including precedent for the use of BEs in interpreting biomonitoring data. Finally, recommendations from the working group are presented.
3. Background
A BE is defined as the concentration of a chemical in a biological medium (e.g., blood, urine, human milk) consistent with chronic exposure at a guideline value and calculated using pharmacokinetic (PK) data (Hays et al., 2008a). BEs can be used as a screening tool to interpret population biomonitoring data in a health risk context (e.g., Aylward et al., 2001a; Kirman et al., 2012).
Screening is defined as “the application of simple tools or procedures that can be applied rapidly to delineate populations that may be at some degree of increased health risk from those that may not” (Hays et al., 2007). The definition further indicates that depending on outcome, screening procedures require detailed confirmatory follow-up before definitive conclusions can be reached.
BEs are principally intended as screening values to be used by environmental and health professionals to assist in the evaluation of general population or specific population biomonitoring data. Hays et al. (2007) describe BEs as “not intended to be used for assessing biomonitoring data from individuals, or for diagnostic purposes.”
Screening values have been used for some time in occupational exposure assessments. Biomonitoring-based reference values such as the biological exposure indices (BEIs) developed by the American Conference of Governmental Industrial Hygienists (ACGIH) typically represent the level of an analyte in biological media which is consistent with exposure at a guideline value (e.g., the threshold limit value).
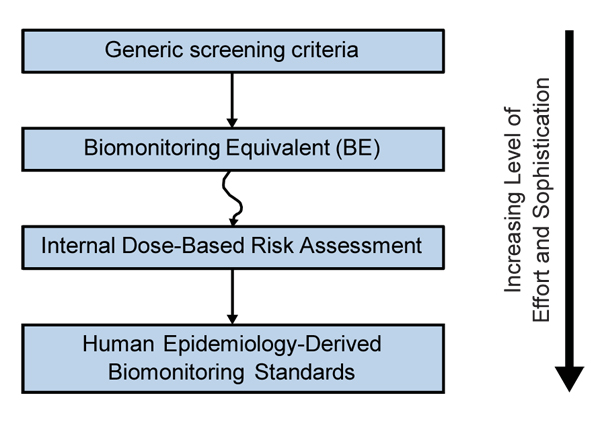
Along a continuum of increasingly data informed approaches, BEs are considered to be less informed than a comprehensive internal dose-based risk assessment, which in turn, is considered less certain than values based on epidemiological studies including biomonitoring (e.g., blood lead) (Hays et al., 2008a) (Figure 1). A BE draws from exposure guidance values and available information on PK in animals or humans. An internal dose-based risk assessment quantitatively relates the toxicological point of departure (POD) in animals to a critical dose metric (the tissue concentration of the active chemical form causing the toxicity) that is then scaled to humans. The human epidemiological biomonitoring derived standards are based on a quantitative understanding of the relationship between biomonitoring levels in humans and an observed biological/toxicological response (e.g., lead and mercury).
Figure 1. Increasingly data informed approaches to interpreting biomonitoring data (adapted from Hays et al., 2008a).
Text description
The flow chart depicts various approaches to the interpretation of biomonitoring data in a continuum, from top to bottom. With increasing levels of effort and sophistication required along the continuum, these approaches include (1) Generic screening criteria, (2) Biomonitoring Equivalent (BE), (3) Internal Dose-Based Risk Assessment and (4) Human Epidemiology-Derived Biomonitoring Standards.
4. Methods
4.1 Derivation Steps
The derivation of BEs consists of four steps:
- Step 1 – Identifying the relevant dose and identifying the target analyte;
- Step 2 – Assessing the available pharmacokinetic (PK) data and models;
- Step 3 – Calculating the biomarker concentration at the human equivalent POD (BEPOD) and the BE; and,
- Step 4 – Assessing the variability and uncertainty of the data and derivation.
These steps are applied for the derivation of most BEs; however, some exceptions have occurred.
4.1.1 Step 1 – Identifying the relevant dose and identifying the target analyte (biomarkers)
The initial step in the derivation of a BE is the search for a dose exposure of effect which can originate from an existing reference dose or a relevant toxicity point-of-departure in animals or humans.
Relevant target analytes or biomarkers are identified from biomonitoring studies and human health surveillance programs. The advantages and disadvantages of target analytes are characterized. For example, levels of the parent chemical found in blood or urine are rated based upon their ability to properly describe exposure of the chemical related to its toxicity or mode of action.
4.1.2 Step 2 – Assessing the available pharmacokinetic (PK) data and models
The second step is to assess PK data and to investigate the possibility of calculating a target tissue value that is consistent with the POD or relevant exposure level. PK relationships can be as simple as a ratio between exposure and an internal dose metric and as complex as a physiological model describing complex biological processes. As guidance values are generally representative of chronic exposure, simple steady-state PK relationships are often applied to derive an internal dose metric. Various PK applications and approaches for BE derivation are describe in detail later on.
4.1.3 Step 3 – Calculating the BEPOD and the BE
The third step consists of calculating a BEPOD value by applying the uncertainty factor to convert the animal POD to the human equivalent. In the case of BEs derived based on human data, this step is not required. The BE value is then calculated based on the combination of POD and PK data or modelling. The level of confidence of the estimated BE value will depend on the uncertainty surrounding the POD and PK data of different species. Uncertainty factors (UF) can be applied which are also generally consistent with those used to derive the exposure guidance value underlying the BE. Although in some cases, the use of chemical specific PK data can replace the PK portion of the inter- or intra-species uncertainty factor (e.g., toluene).
4.1.4 Step 4 – Assessing the variability and uncertainty of the data and derivation
The fourth step is to assess variability and uncertainty of all the data (PK, mode of action, toxicological study, etc.). This process allow for the qualitative classification of the level of confidence in the calculated BE as low, medium or high.
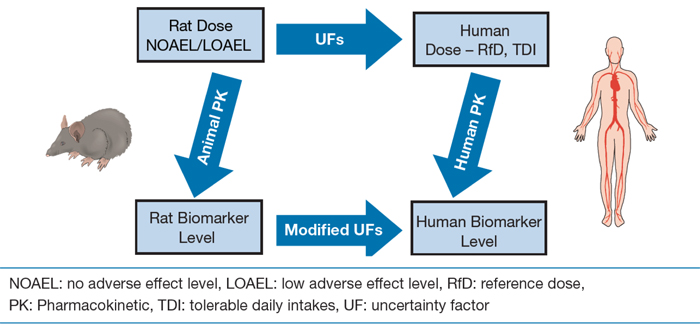
In summary, BEs are based on similar considerations as human health guidance values but may sometimes incorporate additional information on pharmacokinetics in both animals and humans (Figure 2).
Figure 2. Parallelogram approach—biomonitoring equivalents (adapted from Hays et al, 2009).
Text description
This flow chart depicts the process of deriving human biomarker levels, incorporating both animal and human pharmacokinetic data.
The first pathway includes the following steps: (1) Determine no and low-adverse effect levels (NOAEL/LOAEL), (2) Taking uncertainty factors into consideration, determine "safe" human dose (e.g. tolerable daily intake and reference doses), (3) In consideration of human pharmacokinetic data, determine human biomarker level.
The second pathway includes the following steps: (1)Determine no and low-adverse effect levels (NOAEL/LOAEL), (2) In consideration of animal pharmacokinetic data, determine rat biomarker level, (3) Taking into consideration modified uncertainty factors, determine human biomarker level.
4.2 Components Needed
The development of BEs is contingent on the availability of three key components:
- Component 1—Appropriate Exposure Guidance Value
- Component 2—Relevant Target Analyte (biomarker)
- Component 3—Pharmacokinetic (PK) Data
The required components are described in the following sections.
4.2.1 Component 1 – Appropriate Exposure Guidance Value
For BE development, appropriate tolerable intakes or reference doses designed for protection of the general population, including sensitive subpopulations under chronic exposure conditions, are required. These values include, but are not limited to, reference doses (RfDs) and reference concentrations (RfCs), minimum risk levels (MRLs) and tolerable daily intakes (TDIs) from Health Canada, the United States Environmental Protection Agency (US EPA), United States Agency for Toxic Substances and Disease Registry (ATSDR) or World Health Organization (WHO) (Hays et al., 2009). Preference is given to exposure guidance values based on more recent toxicological evaluations, which are more likely to consider all relevant data. Selection of appropriate human health guidance values also takes into account the geographic location and population.
A BE can also be derived from a provisional POD identified from an assessment that did not result in a guidance value. Such a derivation falls outside the traditional definition of a BE, but can be applied since guidance values are based on POD that indicates a threshold for toxicity including uncertainty surrounding the value (e.g. species differences, population inter-individual variability). A POD or any form of dose exposure for an effect is no different and can be modified to be applied for a BE derivation (Hays et al., 2014). Modifications in the derivation process from a guidance value might include additional factors such as species extrapolation or a LOAEL conversion to a NOAEL.
4.2.2 Component 2 – Relevant Target Analyte (biomarker)
Considerations for selection of the relevant target analyte for BE derivation are primarily data-driven and based upon the biomarker measured in biomonitoring studies. The BEs are not always based on the toxic moiety of the compound. One example of this is for phthalates. Although the measurement of the parent substance in blood is more closely linked with toxicity, the BE is based on the urinary metabolites, which are most commonly measured in biomonitoring studies. The selection of biomarkers in biomonitoring studies and health surveillance programs includes consideration of the availability of analytical methods, specificity of the biomarker, relevance to toxicity and/or exposure, stability, invasiveness of collection procedures and ease of interpretation (Hays et al., 2008a).
4.2.3 Component 3 – Pharmacokinetic (PK) Data
Deriving BE values requires chemical-specific PK data relating the biomarker concentration to either external exposure levels of the parent compound or to internal target tissue concentrations associated with critical effects underlying the risk assessment. Thus, the nature of PK data required varies. For many chemicals, there is an abundance of PK data in animals and/or humans. For others, there is little PK information. The derivation of BE values involves explicit judgement to compensate for data gaps, to address variability in the PK data, and to make assumptions about steady-state exposure. The assumptions regarding pharmacokinetics of the chemical required to derive the BE and confidence in the PK database are characterized for transparency.
4.3 Approaches for Deriving BEs
The methods for deriving BEs fall into three basic conceptual approaches. These approaches range from less data informed (urinary mass balance) to most data informed (internal dose-based extrapolation):
- Urinary Mass Balance Approach
- Steady-state Blood Concentrations Approach
- Internal Dose-based Extrapolation Approach
The range of derivation approaches are described in the following sections, and a summary is presented in Table 1.
In these examples, animal PODs are used to derive BE values. However different forms of dose exposure such as a human POD or even recommended daily intake can be used to derive a provisional BE (Hays et al., 2014). Since health agency-generated guidance values are typically dose exposure limits for a specific endpoint, any form of dose can be used as a comparable value for a provisional BE. This is important for chemicals which either do not have defined guidance values or have limited data to imply a POD. At the same time, provisional BEs can be derived for various endpoints for the same chemical and screened at different levels of concern. This open interpretation of the provisional BE is a powerful tool to evaluate exposure of chemicals without limiting the assessment to known guidance values.
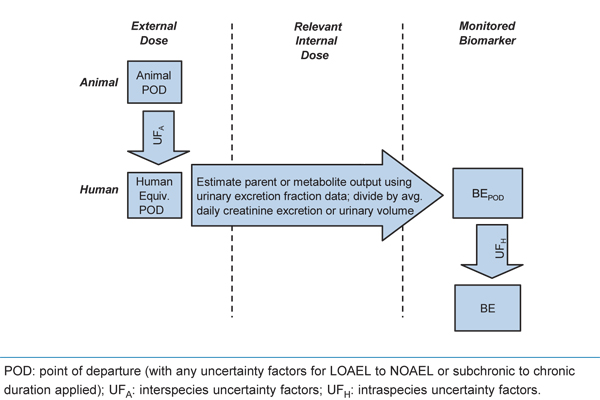
4.3.1 Urinary Mass Balance Approach
Steady-state urinary excretion rate of either the parent compound or a specific metabolite or metabolites is predicted based on human data on the PK of the chemical of interest (Figure 3). BE values derived in this fashion provide information directly based on toxicologically relevant internal dose levels and as a result, there are no implications for reconsideration of factors for interspecies differences and human variability incorporated in Tolerable Intakes or Reference Doses on which the BE is based.
Figure 3. Derivation of urinary BE values based on the urinary mass balance (adapted from Angerer et al., 2011).
Text description
This flow chart depicts the process of deriving urinary BE values based on the urinary mass balance. Text boxes are displayed under the following three columns, from left to right: external dose, relevant internal dose, and monitored biomarker.
In the external dose column, the following three steps are depicted in descending order: (1) Animal point of departure, (2) Interspecies uncertainty factors, and (3) Human equivalent point of departure. From this point, an arrow crosses the middle (relevant internal dose) column, noting the following: Estimate parent or metabolite output using urinary excretion fraction data; divide by average daily creatinine excretion or urinary volume.
This arrow crosses into the monitored biomarker column, where the following three steps are depicted in descending order: (1) BE point of departure, (2) intraspecies uncertainty factors, and (3) BE.
4.3.2 Steady-state Blood Concentrations Approach
This approach involves the estimation of steady-state blood, serum or plasma concentrations in humans consistent with the tolerable exposure level using a simple PK relationship (Figure 4). Much like the urinary approach, data on correlations between exposure and concentrations of the chemical or metabolite in blood (e.g., correlating concentration of benzene in air and blood) are applied to derive steady-state estimates.
Figure 4. Derivation of blood-based BEs based on simple PK or physiologically based pharmacokinetic (PBPK) models for humans (adapted from Angerer et al., 2011).
Text description
This flow chart depicts the process of deriving of blood-based BEs based on simple PK or PBPK models for humans. Text boxes are displayed under the following three columns, from left to right: external dose, relevant internal dose, and monitored biomarker.
In the external dose column, the following three steps are depicted in descending order: (1) Animal point of departure, (2) Interspecies uncertainty factors, and (3) Human equivalent point of departure. From this point, an arrow crosses the middle (relevant internal dose) column, noting the following: Estimate steady-state concentration of blood-based biomarker using simple PK or PBPK model. This arrow crosses into the monitored biomarker column, where the following three steps are depicted in descending order: (1) BE point of departure, (2) intraspecies uncertainty factors, and (3) BE.
4.3.3 Internal Dose-based Extrapolation Approach
In this approach the POD derives from a toxicity study in animals and there are sufficient PK or tissue concentration data from the critical study on which the POD is based or supplemental studies in the same animal species. Alternatively, a PK or physiologically based pharmacokinetic (PBPK) model is available for the species of interest. The BE value can be derived by reconstructing the animal-to-human extrapolation on the basis of internal dose and biomarker concentrations in order to estimate a value (usually a blood, serum or plasma value) consistent with the external dose risk assessment. This may involve PK data from the laboratory animal and/or human, and PK components of inter- and intraspecies uncertainty factors may be re-evaluated (Figure 5).
Figure 5. Derivation of BE values for blood-based biomarkers on an internal dose basis if the biomarker is distinct from the toxicologically relevant target tissue dose (adapted from Angerer et al., 2011).
Text description
This flow chart depicts the process of deriving BE values for blood-based biomarkers on an internal dose basis if the biomarker is distinct from the toxicologically relevant target tissue dose.
Text boxes are displayed under the following three columns, from left to right: external dose, relevant internal dose, and monitored biomarker.
In the external dose column, the first text box displays "Animal point of departure". From this text box, an arrow indicating "Data or PK model" crosses over to the center column (relevant internal dose). From here, the following three steps are depicted in descending order: (1) POD Tissue concentrations, (2) Interspecies uncertainty factors, and (3) Human equivalent point of departure tissue concentration. From this point, a second arrow indicating "Data or PK model" crosses over to the final (monitored biomarker) column, where the following three steps are depicted in descending order: (1) BE point of departure, (2) intraspecies uncertainty factors, and (3) BE.
A special case is when blood or plasma concentrations of the biomarker are expected to be directly and closely related to the target tissue concentration (Figure 6). In this case, blood biomarker concentrations measured in laboratory animals can be extrapolated directly on an internal dose basis to human biomarker concentrations. When a relevant internal dose metric is used as the basis for interspecies extrapolation, the application of an interspecies uncertainty factor component for PK differences between species may not be necessary.
Figure 6. Derivation of BE values for blood-based biomarkers on an internal dose basis if the biomarker is directly related to or equivalent to the toxicologically relevant target tissue dose.
Text description
This flow chart depicts the process of deriving BE values for blood-based biomarkers on an internal dose basis if the biomarker is directly related to or equivalent to the toxicologically relevant target tissue dose.
Text boxes are displayed under the following three columns, from left to right: external dose, relevant internal dose, and monitored biomarker.
In the external dose column, the first text box displays "Animal point of departure". From this text box, an arrow indicating "Data or PK model" crosses to the right. From here, the following five steps are depicted in descending order, mid-way between the final two (relevant internal dose and monitored biomarker) columns: (1) POD biomarker concentrations, (2) Interspecies uncertainty factors, (3) BE point of departure, (4) intraspecies uncertainty factors, and (5) BE.
A summary of the nature of information required for development of various types of BEs and associated examples is presented in Table 1.
| Derivation Approach (from less to more data informed) | Data Elements | Chemicals (reference) |
|---|---|---|
| Derivation of urinary BE values based on the urinary mass balance (Figure 3) | Human data on the pharmacokinetics of the chemical of interest | Triclosan (Krishnan et al., 2010a) |
| Direct translation of tolerable exposure level to blood biomarker concentration (Figure 4) | Human simple PK or PBPK model, or data correlating the chemical in blood with external exposure (oral dose or concentration in air) | 38 volatile organic compounds (Aylward et al., 2010c); 2,4-dichlorophenoxyacetic acid in plasma (Aylward and Hays, 2008) |
| Reconstruction of risk assessment on internal dose basis—tissue concentration (Figure 5) | Understanding the dosimetry (i.e. concentration in target tissue) |
Cadmium (Hays et al., 2008b) |
| Data or model to estimate relevant dosimetry at POD in species/study underlying tolerable intake derivation | Acrylamide (Hays and Aylward, 2008) | |
| Data or model relating dosimetry to blood biomarker concentration | Trihalomethanes (Aylward et al., 2008a) | |
| Reconstruction of risk assessment on internal dose basis—biomarker concentration (Figure 6) | Understanding of relevant dose metric (i.e. average tissue concentration in sensitive tissue) | Toluene (Aylward et al., 2008b) |
| Understanding the relationship between blood and target tissue concentration | Hexachlorobenzene (Aylward et al., 2010a) |
5. Development and Peer-Review Process
5.1 Development of the BE Concept
The concept of the BE as a tool for interpretation of general population biomonitoring data was originated and proposed by Hays et al. (2007). The BE Pilot Project came about as a collaborative effort to develop an initial set of guidelines for deriving BEs and to implement the concept and apply the approach to certain chemical case studies. The BE Pilot Project was led by Summit Toxicology and was sponsored by a range of government agencies (including Health Canada) and industry associations. A panel consisting of experts in pharmacokinetics, risk assessment, medical ethics and risk communication from a broad range of government, academic and industrial backgrounds took part in the Biomonitoring Equivalents Expert Workshop in June 2007. The workshop participants were tasked with considering the technical and communications issues identified in the derivation of the BEs. Among the meeting’s objectives were to develop and publish guidelines for the derivation and communication of BEs (Hays et al., 2008a; Lakind et al., 2008). Following the Biomonitoring Equivalents Expert Workshop, BEs for five substances were derived and published: acrylamide, 2,4-dichloroacetic acid (2,4-D), cadmium, trihalomethanes, and toluene (Hays and Aylward, 2008; Aylward and Hays, 2008; Hays et al., 2008b; Aylward et al., 2008a; Aylward et al., 2008b). These BEs were based on existing exposure guidance values from several regulatory agencies, including Health Canada, US EPA and WHO.
Under a three year contract (2008–2011) with Health Canada, Summit Toxicology developed BEs for an additional 13 chemicals. A team at Health Canada including risk assessors from HPFB, HECSB and PMRA were involved in the nomination and selection of chemicals, and in the review of the BE derivations. Nomination criteria included chemicals which were measured and detected in the CHMS and had Health Canada exposure guidance values (TDIs, ADIs, or cancer slope factors). Most of the chemicals selected met these criteria. Chemicals included: cyfluthrin (metabolite 4-F-3-PBA), di-2-ethylhexyl phthalate (DEHP), diethyl phthalate (DEP), benzylbutyl phthalate (BzBP), dibutyl phthalate (DBP), hexachlorobenzene, triclosan, bisphenol A (BPA), arsenic, dichlorodiphenyltrichloroethane (DDT) (and its metabolite dichlorodiphenyldichloroethylene [DDE]), deltamethrin (metabolite cis-DBCA), polybrominated diphenyl ether-99 (PBDE 99), and di-isononyl phthalate (DINP). These BE derivations were published in Regulatory Toxicology and Pharmacology (Aylward et al., 2009a; Aylward et al., 2009b; Aylward et al., 2010b; Aylward et al., 2011; Hays et al., 2009; Hays et al., 2010; Hays et al., 2011; Kirman et al., 2011; Krishnan et al., 2010a; Krishnan et al., 2010b; Krishnan et al., 2011).
BEs for many other substances including dioxins, volatile organic compounds (VOCs), and uranium have been published or are currently being developed. There are approximately 80 BE values that have now been published covering more than 100 analytes. A list of substances for which BEs have been derived and for which CHMS data are or will be available from cycles 1-6 is available in Appendix A.
Published manuscripts have compared BE values with biomonitoring data from CHMS (St-Amand et al., 2014) and the US National Health and Nutrition Examination Survey (NHANES) (Aylward et al., 2013). Several other publications have compared biomonitoring data to BE values including concentrations of 2-4 D in different biomonitoring cohorts (Aylward et al., 2010c), volatile organic compounds (VOCs) in blood from the US National Health and Nutrition Examination Survey (NHANES) study (Kirman et al., 2012), and concentrations of HBCD in blood in various populations (Aylward and Hays, 2011).
5.2 Peer-Review Process
The concept of BEs was proposed by Hays et al. (2007) as a tool for evaluation of biomonitoring data for the general population. The BE concept was an extension of similar tools already in use in the occupational arena (for example, the ACGIH Biological Exposure Indices).
In June 2007, a Biomonitoring Equivalents Expert Workshop was convened with a range of international experts in PK, risk assessment, occupational medicine, and risk communication to develop guidelines for the derivation and communication of BEs (Hays et al., 2008a; LaKind et al., 2008). Most of the BEs that have been derived by Health Canada have undergone two rounds of independent peer-review.
The first peer-review was undertaken to address the following questions:
- Do the BEs adhere to the principles of the Guidelines for Derivation of Biomonitoring Equivalents as outlined in Hays et al. (2008a)?
- Do the BE communication materials adhere to the principles of the Guidelines for communication of BEs as outlined in LaKind et al. (2008)?
- Is the chemical-specific modeling on which each BE is based consistent with, or based on, best available practice and data?
These peer-reviews were conducted by independently selected experts including at least one individual who was part of the committee that developed the derivation and communication guidelines and another who is a recognized expert in the pharmacokinetics of the compound of interest. The second round of independent peer-review was conducted by the journal in which each BE manuscript is published.
BEsFootnote 2 developed in support of Health Canada evaluations were also peer reviewed and conducted based on independence, transparency, appropriate expertise and robust process. These principles and practices evolve from experience in the management of peer input on various aspects of a large Health Canada regulatory program (i.e., Existing Substances) in consultation with notable partners in the area. For these BEs, reviewers were asked to address a list of questions as part of their review (Appendix B).
As BEs continue to be developed, they are subjected to internal Health Canada peer review prior to being peer reviewed through the publishing journal.
6. Application of BEs
Screening Tools for Interpreting Biomonitoring Data in a Risk Context
The BEs paired with biomonitoring data provide a screening tool to help inform if current exposures to environmental contaminants are approaching or exceeding tolerable levels for the general population (Figure 7). This tool can contribute to priority setting for risk assessment and risk management of environment contaminants by Health Canada.
Figure 7. Prioritizing scheme to interpret biomonitoring data based on BE values (adapted from LaKind et al. 2008).
Text description
This diagram depicts the prioritization scheme for interpretation of biomonitoring data based on BE values for a single chemical. High, medium and low priority boxes are depicted from top to bottom. The BE is at the intersection of the low and medium priority boxes and the BEPOD is at the intersection of the medium and high priority boxes. An upwards arrow to the right of these boxes indicates an increasing priority for follow-up from low to high.
In addition to direct comparison of biomonitoring data to BE values, other approaches can be used to compare these data. In a conventional risk assessment, estimates of exposure levels in mg/kg-d or mg/m3 are compared to tolerable exposure levels such as RfDs or TDIs. This comparison can take the form of calculation of a hazard quotient (HQ), defined as the ratio of the estimated dose to the exposure guidance value. Under this framework, HQ values less than 1 indicate that estimated exposures do not exceed a tolerable intake level. In cases where HQ values approach or exceed 1, measured exposures are approaching or exceed tolerable intake levels and further action is considered including refinement to the risk assessment, risk mitigation or risk management.
Similar approaches can be used to compare biomonitoring data to the BE values. A screening exercise can be conducted across the set of chemicals measured in CHMS. A relative ranking of hazard quotients (HQ) can provide an indication of which chemicals should be a higher priority for further evaluation or need of additional research (St-Amand et al., 2014).
HQ can be calculated as the ratio of the biomarker concentration from the geometric mean (GM) to 95th percentiles to the chemical-specific BE value. It is also possible to express this as the inverse which is the ratio of a BE value over the biomarker concentrations from the geometric mean (GM) to the 95th percentiles.
BE values can be used to assess biomonitoring data in a health risk context to assist in evaluating which chemicals are present at relatively low levels compared to the BE values (lower HQ values). This approach is analogous to the way that the underlying exposure guidance values (including tolerable dietary intake guidelines, drinking water guidelines, or soil quality guidelines) are used in evaluating external estimates of exposures. Interpretation of an exceedance of BE is also similar to the interpretation of exceedance of an exposure guidance value. Exceedance of an exposure guidance value lessens the safety margin built into the guideline but does not necessarily result in an appreciable health risk to Canadians. BEs are a screening tool, and are not intervention levels.
Following screening of biomonitoring data with BEs, exceedances should result in further investigation by the Department to determine if a given chemical should be a priority for further assessment or risk management. Actions could include revisiting the literature, more in-depth data analyses, or development of tissue-based guidance values.
7. Advantages and Limitations
7.1 Advantages of BEs as a Screening Tool
BEs are intended to be a screening tool to provide context to biomonitoring data in a health risk framework. They allow for comparison of observed levels of biomarkers in human blood or urine with health-based guidelines for intake levels considered ‘safe’ or ‘acceptable’. They are informative for substance prioritization in terms of risk assessment and risk management; but their use does not preclude the development and use of additional, complementary tools for interpreting biomonitoring data.
The BEs build upon existing risk assessments by using previously identified toxicological PODs and uncertainty factors, thereby leveraging work that has already been done. If a risk assessment is updated (for example if a different critical endpoint is identified), an updated BE could be generated with relative ease. For many of the chemicals for which BEs have been developed, several reference values were considered in parallel, resulting in a BE for each of these values. In contrast to approaches in which traditional exposure estimates are used to calculate anticipated tissue concentrations; or in which a biomonitoring dataset is used to estimate intake, a BE represents a single reference value that can be compared to multiple biomonitoring datasets. It therefore avoids the process of repeated calculations and analysis for each individual exposure scenario or biomonitoring dataset.
The BE approach was developed with input from a panel of experts in diverse fields, who discussed many aspects of BE derivations at the workshop in 2007 (Hays et al., 2008a). The individual BEs that have been derived to date have been peer reviewed and published in scientific journals. The BEs generated under the Health Canada contract were additionally peer reviewed in the context of adherence to the BE derivation guidelines. Thus the process of BE derivation is science-based, robust and has support from the scientific community.
7.2 Limitations of BEs as a Screening Tool
BEs are only applicable at the population level, not the individual level. BEs will be relevant to the population in which the analyte(s) was collected, and use of a BE as a screening tool for other populations should be considered carefully. For example, due to limited data collection in young children under the age of 6 in the CHMS (regarding kinetics, urine volumes and creatinine excretion) urinary analytes were not measured in 3-5 year olds, and BEs for these chemicals may not be applicable to this subpopulation. BEs are not meant to be used as diagnostic criteria for evaluation of the risk of adverse health effects. Rather, they represent a screening value for biomonitoring measurements which is based on a previously identified reference value. As BEs are tied to existing reference values, all the assumptions and uncertainties associated with the underlying reference value also apply to the BE. The BE reflects the toxicological endpoint selected for the derivation of the reference value; even if more relevant or more sensitive toxicological endpoints are identified after the reference value is derived, these are not incorporated into the BE derivation. Similarly, as the RfDs, TDIs and other criteria may apply to a single substance, from a single route of exposure, the associated BE also represents a substance-specific level, without consideration of aggregate or cumulative exposure (i.e., multiple chemicals with similar pathways or modes of action of toxicity).
By definition, the development of a BE for a particular chemical requires that an exposure guideline such as a TDI or a RfD from a regulatory agency exists for that chemical. Unfortunately, for many of the substances of interest in biomonitoring studies including CHMS, no such guidelines have been derived. If only substances with Health Canada exposure guidelines are considered, the number of potential BEs is reduced further. In some cases, a BE based on a guidance value from a jurisdiction other than Health Canada may be appropriate; however this would need to be evaluated on a case-by-case basis prior to use as a screening tool by the department. Furthermore, many screening-level assessment programs in Health Canada establish critical effect levels to assess risk, but TDIs are not derived. Mechanisms to incorporate these critical effect levels into provisional BEs have been explored (Aylward and Hays, 2011; Hays et al., 2014) and interpretation of biomonitoring data for chemicals without guidance values based on a margin of exposure (BEPOD (or animal POD)/biomarker concentration) has been described (Becker et al., 2012).
There are two basic sources of uncertainty for BEs; knowledge of chemical-specific pharmacokinetics and the characteristics of the biomarker as a measure or representative of the external exposure of interest.
7.2.1 Pharmacokinetic Uncertainties
Development of a BE is limited by the availability and reliability of pharmacokinetic data. Without some knowledge of the relationship between external dose, the internal dose metric, and the mode of action of toxicity, it is not possible to derive a BE with any degree of confidence. While sufficient data exists to derive BEs for well-studied environmental contaminants (e.g., POPs, flame retardants, pesticides), for other emerging contaminants, little data may be available on pharmacokinetics and mode of action of toxicity. Even for those chemicals for which the pharmacokinetics and mode of action of toxicity are relatively well understood, there is still uncertainty associated with the BE value, and this uncertainty needs to be recognized and characterized when the BE is applied as a screening level.
The derivation of BE values involves explicit judgement as to the confidence in the PK database and qualitative classification of the confidence in the BE as low, medium or high. Given that interpretation of human biomonitoring data using these BEs is designed to be a screening exercise to help prioritize chemicals for further evaluation, having some uncertainty in PK data used to derive BEs does not preclude their utility. If a compound with a low confidence in PK approaches has a high HQ, program areas would need to investigate further.
7.2.2 Biomarker Reliability
In order for a BE to be useful as a screening tool, the analytical methods and biomarkers used in the biomonitoring study need to be comparable to those considered in the BE derivation. For example, if a BE is based on a conjugated metabolite, the method must be able to separate the free and conjugated forms of that metabolite and report them separately; similarly, if the BE refers to several metabolites or speciated forms, the method must be able to quantify and report those individual substances.
For various reasons (including non-invasive sampling, availability of biomarkers, short plasma half-lives), many of the BEs that have been generated to date have been based on urinary metabolites. These BEs come with their own set of issues and limitations, many of which are described in detail in the paper on the DEHP BE derivation (Aylward et al., 2009b). For example, for metabolites with a short urinary half-life, spot samples (as in CHMS) may not be reflective of continuing exposure, and may over- or under-represent actual ‘steady-state’ exposure. Therefore, without knowledge of the timing and degree of exposure, the utility of the BE is limited. Therefore, for those BEs, comparisons should only be made with measures of central tendency (i.e., the geometric mean), rather than the tails of distribution for the population.
An additional issue related to biomarker reliability is the specificity of the biomarker. In most cases, analytes included in CHMS and other national biomonitoring programs are specific to a unique chemical exposure. However, there are some exceptions to this. In the pesticide arena, urinary analytes that are metabolites of the parent compound may arise, in some cases, from exposure directly to that metabolite present in foods or the environment as an environmental degradate of the parent compound. For example, 3,5,6-trichloro-2-pyridinol (TCPy) is a specific metabolite and environmental degradate of chlorpyrifos. Urinary TCPy was originally interpreted as a specific marker of exposure to chlorpyrifos. However, analyses of foods and environmental media demonstrate that the majority of human urinary TCPy in the general population likely arises from direct exposure to TCPy, which is relatively non-toxic. Data suggest that TCPy is absorbed and excreted unchanged in human urine (Morgan et al., 2011; Timchalk et al., 2007). Thus, urinary TCPy levels are not necessarily meaningful as markers of chlorpyrifos exposure.
Consideration of the robustness of the biomarker as a measure of exposure to the parent compound is important in a detailed evaluation of the biomonitoring data.
Generally, derivation of BE values based on tolerable intake levels is based on the assumption that a balance between intake and concentration/excretion (i.e., steady state) has been reached in the body matrix. In this regard, BE values are estimates consistent with the theoretical chronic tolerable intake values underlying the derivation, rather than an attempt to estimate actual intakes or predict biomarker concentrations arising from real world exposure conditions, which are likely to be variable and intermittent. Exposure to chemicals in the real world is not continuous, and likely to vary within a day and across days. This disconnect between assumptions used in the derivation of BE values compared to exposure patterns in the real world results in the need for caution in the process of interpretation of biomonitoring data.
7.3 Communications Issues
With data from CHMS cycle 1 (2007–2009), cycle 2 (2009–2011) and cycle 3 (2012–2013) released between 2010 and 2015, and data from cycles 4 to 6 (2014–2019) to follow, Health Canada could focus on identifying and implementing tools to put the CHMS data into context in terms of health risk. BEs do not represent a definite point between ‘safe’ and ‘unsafe’ levels, are not intended for use as intervention or action levels, and are not intended for comparison with individual biomonitoring levels; rather, the BEs are intended to be used as screening level values, providing an indication of how exposure in the general population compares to a health-based exposure guideline.
When using BEs as a screening tool, the uncertainties and confidence associated with both the BE and the biomonitoring data should be included.
BEs may be used in other context (e.g., risk assessment) and it is the responsibility of any author to define BEs and their limitations within the context that they are being used.
8. International Perspective
BEs are not a new concept, but their derivation in the context of environmental health contaminants was only first developed in the 2000s. Although few regulatory bodies are using them now, there is a growing interest in them. There is potential for international collaboration in this area and Health Canada could play a major role in this field since few countries have such extensive biomonitoring program as CHMS, and experience deriving and applying BEs.
The German Human Biomonitoring Commission has developed human biomonitoring (HBM) values for cadmium, mercury, thallium, pentachlorophenol, DEHP metabolites, polychlorinated biphenyl (PCBs) and BPA. Two levels of HBM values exist: the HBM-I which is regarded as a control level; and the HBM-II, which is an action level. For all of the substances except DEHP and BPA, the HBM values were determined based on adequate studies of health effects in humans. Conceptually, HBM-I and BEs are identical. Biomarker values below HBM-I are regarded as levels at which no adverse effects would be expected and are thus consistent with the BE value definition and the definitions of tolerable intakes. However, German HBM Commission HBM-II values are defined explicitly in terms of interpretation of individual biomonitoring data and represent levels which, if exceeded, may be expected to cause an adverse health effect which is to be regarded as relevant for the person affected, thus are more similar to Health Canada’s blood mercury guidelines. The Commission is considering using published BEs as HBM-I values for other substances (Angerer et al., 2011).
For the most part, the Centers for Disease Control and Prevention (CDC) analysis of biomonitoring results from its NHANES is focused on the descriptive approach, which is generating reference values at the 95th percentile (CDC, 2009). Generally, the CDC’s message on biomonitoring data is that the measurement of a chemical in blood or urine does not mean that the chemical causes disease. Advances in analytical methods allow for the measurement of low levels of environmental chemicals in people but separate studies of varying exposure levels and health effects are needed to determine whether such blood or urine levels cause disease. For most environmental chemicals (other than lead), more research to assess health risks from different blood or urine levels is required (CDC, 2009). CDC has not officially endorsed the use of BEs as a screening tool for biomonitoring data.
Senior staff of program offices within the US EPA were contacted to enquire about the extent to which BEs or considerations on which they are based are currently integrated in decision making in setting priorities for risk assessment. These offices included the Office of Pollution Prevention and Toxics, the Office of Pesticide Programs and the Office of Water. In essence, most programs embrace the concepts and principles on which BEs are based (i.e., reducing uncertainty through incorporation wherever possible of increasingly data informed approaches incorporating toxicokinetic and toxicodynamic information), but have yet to formally endorse and/or use BEs per se in their programs (Meek, 2012).
In Europe, REACH (Registration, Evaluation, Authorisation and Restriction of Chemical substances) is a European Union Regulation which entered into force in 2007. REACH addresses the production and use of chemicals, and potential impacts on both human health and the environment. REACH requires characterization of risk to chemicals via exposure from the environment. At least two recent papers authored by industry examine how BEs could be applied to interpret biomonitoring data to characterize health risk under REACH (Boogaard et al. 2012, Boogaard et al. 2011).
The French Agency for Food, Environmental and Occupational Health and Safety (ANSES) is also exploring ways to interpret biomonitoring data such as the results of ongoing biomonitoring surveys in France (ANSES 2014).
9. References
- Angerer J, Aylward LL, Hays SM, Heinzow B, and Wilhelm M. (2011). Human biomonitoring assessment values: Approaches and data requirements. International Journal of Hygiene and Environmental Health, 214(5), 348–360.
- ANSES (alimentation, environnement, travail). (2014). Orientations de l’Anses dans le domaine de la santé environnment pour 2014. Available at: www.anses.fr/fr/system/files/ANSES-Ft-OrientStrat2014-SantEnv.pdf.
- Arnold SM, Morriss A, Velovitch J, Juberg D, Burns CJ, Bartels M, Aggarwal M, Poet T, Hays S, and Price P. (2015). Derivation of human biomonitoring guidance values for chlorpyrifos using a physiologically based pharmacokinetic and pharmacodynamic model of cholinesterase inhibition. Regulatory Toxicology and Pharmacology, 71(2), 235–243.
- Aylward LL, and Hays SM. (2008). Biomonitoring equivalents (BE) dossier for 2,4-dichlorophenoxyacetic acid (2,4-D) (CAS no. 94–75–7). Regulatory Toxicology and Pharmacology, 51(3 SUPPL.), S37–S48.
- Aylward LL, LaKind JS, and Hays SM. (2008a). Biomonitoring equivalents (BE) dossier for trihalomethanes. Regulatory Toxicology and Pharmacology, 51(3 SUPPL.), S68–S77.
- Aylward LL, Barton HA, and Hays SM. (2008b). Biomonitoring equivalents (BE) dossier for toluene (CAS no. 108–88–3). Regulatory Toxicology and Pharmacology, 51(3 SUPPL.), S27–S36.
- Aylward LL, LaKind JS, and Hays SM. (2008c). Derivation of biomonitoring equivalent (BE) values for 2,3,7,8-tetrachlorodibenzo-p-dioxin (TCDD) and related compounds: A screening tool for interpretation of biomonitoring data in a risk assessment context. Journal of Toxicology and Environmental Health—Part A: Current Issues, 71(22), 1499–1508.
- Aylward LL, Hays SM, Gagné M, and Krishnan K. (2009a). Derivation of biomonitoring equivalents for di(2-ethylhexyl) phthalate (CAS no. 117–81–7). Regulatory Toxicology and Pharmacology, 55(3), 249–258.
- Aylward LL, Hays SM, Gagné M, and Krishnan K. (2009b). Derivation of biomonitoring equivalents for di-n-butyl phthalate (DBP), benzylbutyl phthalate (BzBP), and diethyl phthalate (DEP). Regulatory Toxicology and Pharmacology, 55(3), 259–267.
- Aylward LL, Kirman CR, Blount BC, and Hays SM. (2010a). Chemical-specific screening criteria for interpretation of biomonitoring data for volatile organic compounds (VOCs)—application of steady-state PBPK model solutions. Regulatory Toxicology and Pharmacology, 58(1), 33–44.
- Aylward LL, Hays SM, Gagné M, Nong A, and Krishnan K. (2010b). Biomonitoring equivalents for hexachlorobenzene. Regulatory Toxicology and Pharmacology, 58(1), 25–32.
- Aylward LL, Morgan MK, Arbuckle TE, Barr DB, Burns CJ, Alexander BH, and Hays SM. (2010c). Biomonitoring data for 2,4-dichlorophenoxyacetic acid in the United States and Canada: Interpretation in a public health risk assessment context using biomonitoring equivalents. Environmental Health Perspectives, 118(2), 177–181.
- Aylward LL, and Hays SM. (2011). Biomonitoring-based risk assessment for hexabromocyclododecane (HBCD). International Journal of Hygiene and Environmental Health, 214(3), 179–187.
- Aylward LL, Krishnan K, Kirman CR, Nong A, and Hays SM. (2011). Biomonitoring equivalents for deltamethrin. Regulatory Toxicology and Pharmacology, 60(2), 189–199.
- Aylward LL, and Hays SM. (2012). Interpretation of Biomonitoring Data from the Canadian Health Measure Survey in a risk Assessment context: Use of biomonitoring Equivalents. Report Prepared under Health Canada contract number 4500278933.
- Aylward LL, Kirman CR, Schoeny R, Portier CJ, and Hays SM. (2013). Evaluation of biomonitoring data from the CDC national exposure report in a risk assessment context: Perspectives across chemicals. Environmental Health Perspectives, 121(3), 287–294.
- Aylward LL, Hays SM, Vezina A, Deveau M, St-Amand A, and Nong A. (2015). Biomonitoring equivalents for interpretation of urinary fluoride. Regulatory Toxicology and Pharmacology, 72(1), 158–167.
- Becker RA, Hays SM, Robison S, and Aylward LL. (2012). Development of screening tools for the interpretation of chemical biomonitoring data. Journal of Toxicology, 2012, Article ID 941082.
- Boogaard PJ, Hays SM, and Aylward LL. (2011). Human biomonitoring as a pragmatic tool to support health risk management of chemicals—examples under the EU REACH programme. Regulatory Toxicology and Pharmacology, 59(1), 125–132.
- Boogaard PJ, Aylward LL, and Hays SM. (2012). Application of human biomonitoring (HBM) of chemical exposure in the characterisation of health risks under REACH. International Journal of Hygiene and Environmental Health, 215(2), 238–241.
- CDC (Centers for Disease Control and Prevention). 2009. Fourth National Report on Human Exposure to Environmental Chemicals. Atlanta (GA).
- Hays SM, Becker RA, Leung HW, Aylward LL, and Pyatt DW. (2007). Biomonitoring equivalents: A screening approach for interpreting biomonitoring results from a public health risk perspective. Regulatory Toxicology and Pharmacology, 47(1), 96–109.
- Hays SM, and Aylward LL. (2008). Biomonitoring equivalents (BE) dossier for acrylamide (AA) (CAS no. 79–06–1). Regulatory Toxicology and Pharmacology, 51(3 SUPPL.), S57–S67.
- Hays SM, Aylward LL, LaKind JS, Bartels MJ, Barton HA, Boogaard PJ, Brunk C, DiZio S, Dourson M, Goldstein DA, Lipscomb J, Kilpatrick ME, Krewski D, Krishnan K, Nordberg M, Okino M, Tan Y-M, Viau C, and Yager JW. (2008a). Guidelines for the derivation of biomonitoring equivalents: Report from the biomonitoring equivalents expert workshop. Regulatory Toxicology and Pharmacology, 51(3 SUPPL.), S4–S15.
- Hays SM, Nordberg M, Yager JW, and Aylward LL. (2008b). Biomonitoring equivalents (BE) dossier for cadmium (Cd) (CAS no. 7440–43–9). Regulatory Toxicology and Pharmacology, 51(3 SUPPL.), S49–S56.
- Hays SM, Aylward LL, Gagné M, and Krishnan K. (2009). Derivation of biomonitoring equivalents for cyfluthrin. Regulatory Toxicology and Pharmacology, 55(3), 268–275.
- Hays SM, Aylward LL, Gagné M, Nong A, and Krishnan K. (2010). Biomonitoring equivalents for inorganic arsenic. Regulatory Toxicology and Pharmacology, 58(1), 1–9.
- Hays SM, Aylward LL, Kirman CR, Krishnan K, and Nong A. (2011). Biomonitoring equivalents for di-isononyl phthalate (DINP). Regulatory Toxicology and Pharmacology, 60(2), 181–188.
- Hays SM, Pyatt DW, Kirman CR, and Aylward LL. (2012). Biomonitoring equivalents for benzene. Regulatory Toxicology and Pharmacology, 62(1), 62–73.
- Hays SM, Macey K, Nong A, and Aylward LL. (2014). Biomonitoring equivalents for selenium. Regulatory Toxicology and Pharmacology, 70(1), 333–339.
- HBM (Human Biomonitoring) Commission. (2011). Stoffmonographie Thallium-Referenz- und Human-Biomonitoring-(HBM)- Werte für Thallium im Urin. Bundesgesundheitsbl. Gesundheitsforsch. Gesundheitsschutz 54, 516–524. (As cited in Schulz et al., 2012)
- Kirman CR, Aylward LL, Hays SM, Krishnan K, and Nong A. (2011). Biomonitoring equivalents for DDT/DDE. Regulatory Toxicology and Pharmacology, 60(2), 172–180.
- Kirman CR, Aylward LL, Blount BC, Pyatt DW, and Hays SM. (2012). Evaluation of NHANES biomonitoring data for volatile organic chemicals in blood: Application of chemical-specific screening criteria. Journal of Exposure Science and Environmental Epidemiology, 22(1), 24–34.
- Krishnan K, Gagné M, Nong A, Aylward LL, and Hays SM. (2010a). Biomonitoring equivalents for triclosan. Regulatory Toxicology and Pharmacology, 58(1), 10–17.
- Krishnan K, Gagné M, Nong A, Aylward LL, and Hays SM. (2010b). Biomonitoring equivalents for bisphenol A (BPA). Regulatory Toxicology and Pharmacology, 58(1), 18–24.
- Krishnan K, Adamou T, Aylward LL, Hays SM, Kirman CR, and Nong A. (2011). Biomonitoring equivalents for 2,2’,4,4’,5-pentabromodiphenylether (PBDE-99). Regulatory Toxicology and Pharmacology, 60(2), 165–171.
- LaKind JS, Aylward LL, Brunk C, DiZio S, Dourson M, Goldstein DA, Kilpatrick ME, Krewski D, Bartels MJ, Barton HA, Boogaard PJ, Lipscomb J, Krishnan K, Nordberg M, Okino M, Tan Y-M, Viau C, Yager JW, and Hays SM. (2008). Guidelines for the communication of biomonitoring equivalents: Report from the biomonitoring equivalents expert workshop. Regulatory Toxicology and Pharmacology, 51(3 SUPPL.), S16–S26.
- Meek B. (2012). McLaughlin Centre for Population Health Risk Assessment, University of Ottawa. March 30, 2012. Relevance of Biomonitoring Equivalents to Health Canada Chemical Risk Assessment Programs Report Prepared under Health Canada contract number 4500279187.
- Morgan, M.K., Sheldon, L.S., Jones, P.A., Croghan, C.W., Chuang, J.C., and Wilson, N.K. (2011). The reliability of using urinary biomarkers to estimate children’s exposures to chlorpyrifos and diazinon. Journal of Exposure Science and Environmental Epidemiology, 21(3), 280–290.
- NRC (National Research Council). (2006). Human Biomonitoring for Environmental Chemicals. Washington, DC: National Academies Press.
- NRC (National Research Council). (2007). Toxicity Testing in the 21st Century: A Vision and a Strategy. Washington, DC: National Academies Press.
- Schulz C, and Butte W. (2007). Revised reference value for pentachlorophenol in morning urine. International Journal of Hygiene and Environmental Health, 210(6), 741–744.
- Schulz C, Wilhelm M, Heudorf U, and Kolossa-Gehring M. (2012). Reprint of “Update of the reference and HBM values derived by the German Human Biomonitoring Commission”. International Journal of Hygiene and Environmental Health, 215(2), 150–158.
- St-Amand A, Werry K, Aylward LL, Hays SM, and Nong A. (2014). Screening of population level biomonitoring data from the Canadian health measures survey in a risk-based context. Toxicology Letters, 231(2), 126–134.
- Timchalk C, Busby A, Campbell JA, Needham LL, and Barr DB. (2007). Comparative pharmacokinetics of the organophosphorus insecticide chlorpyrifos and its major metabolites diethylphosphate, diethylthiophosphate and 3,5,6-trichloro-2-pyridinol in the rat. Toxicology, 237(1–3), 145–157.
Appendix A – Summary of Derived BEs
| Environmental Chemical | Reference |
|---|---|
| Acrylamide | |
| Acrylamide | Hays and Aylward, 2008 |
| Chlorophenols | |
| Pentachlorophenol | Schulz and Butte, 2007 |
| Dioxins and furans | |
| Dioxin TEQ | Aylward et al., 2008c |
| Environmental phenols | |
| Bisphenol AFootnote 1Footnote 2 | Krishnan et al., 2010b |
| TriclosanFootnote 2 | Krishnan et al., 2010a |
| Flame retardants | |
| HexabromocyclododecaneFootnote 1Footnote 3 | Aylward and Hays, 2011 |
| PBDE-99Footnote 2 | Krishnan et al., 2011 |
| Metals and trace elements | |
| ArsenicFootnote 1Footnote 2 | Hays et al., 2010 |
| AntimonyFootnote 2 | In development |
| BoronFootnote 2 | In development |
| FluorideFootnote 1Footnote 2 | Aylward et al., 2015 |
| ManganeseFootnote 2 | In development |
| NickelFootnote 2 | In development |
| SeleniumFootnote 2 | Hays et al., 2014 |
| Thallium | HBM 2011 |
| UraniumFootnote 2 | In development |
| Cadmium | Hays et al., 2008b |
| Organochlorine compounds | |
| DDT/DDEFootnote 1Footnote 2 | Kirman et al., 2011 |
| HexachlorobenzeneFootnote 1Footnote 2 | Aylward et al., 2010b |
| Pesticides | |
| CyfluthrinFootnote 1Footnote 2 | Hays et al., 2009 |
| DeltamethrinFootnote 2 | Aylward et al., 2011 |
| 3-Phenoxybenzoic acidFootnote 2Footnote 3 | In development |
| Chlorpyrifos | Arnold et al., 2015 |
| Malathion | In development |
| 2,4-Dichlorophenoxyacetic acid (2-4D) | Aylward and Hays, 2008 |
| Phthalates | |
| Di-2(ethylhexyl) phthalateFootnote 1Footnote 2 | Aylward et al., 2009b |
| Diisononyl phthalateFootnote 1Footnote 2 | Hays et al., 2011 |
| Dibutyl phthalateFootnote 1Footnote 2 | Aylward et al., 2009a |
| Diethyl phthalateFootnote 1Footnote 2 | Aylward et al., 2009a |
| Benzyl butyl phthalateFootnote 1Footnote 2 | Aylward et al., 2009a |
| Diisobutyl phthalateFootnote 2 | In development |
| Diisodecyl phthalateFootnote 2Footnote 3 | In development |
| Dicyclohexyl phthalateFootnote 2Footnote 3 | In development |
| Volatile organic compounds (VOCs) | |
| Benzene | Hays et al., 2012 |
| Toluene | Aylward et al., 2008b |
| Trihalomethanes: chloroform, bromoform, bromodichloromethane, dibromochloromethane | Aylward et al., 2008a |
| Other VOCs | Aylward et al., 2010c |
| Environmental Chemical | CHMS Cycle | |||
|---|---|---|---|---|
| 1 (2007–2009) |
2 (2009–2011) |
3 and 4 (2012–2015) |
5 and 6 (2016–2019) |
|
| Acrylamide | ||||
| Acrylamide | No data | No data | ■ | ■ |
| Dioxins and furans | ||||
| Dioxins and Furans | ■ | No data | ■ | ■ |
| Environmental phenols | ||||
| Bisphenol A | ■ | ■ | ■ | ■ |
| Triclosan | No data | ■ | ■ | No data |
| Flame retardants | ||||
| HexabromocyclododecaneFootnote 1 | ■ | No data | ■ | ■ |
| PBDE 99 | ■ | No data | ■ | ■ |
| Metals and trace elements | ||||
| Antimony | * | * | No data | No data |
| Arsenic, inorganic (speciated) | No data | ■ | ■ | ■ |
| Boron | No data | No data | No data | * |
| Cadmium | ■ | ■ | ■ | ■ |
| Fluoride | No data | ■ | ■ | No data |
| Manganese | * | * | No data | No data |
| Nickel | * | * | No data | No data |
| Selenium | * | * | No data | * |
| Thallium | No data | * | No data | No data |
| Uranium | * | * | No data | No data |
| Organochlorine compounds | ||||
| DDT | ■ | No data | No data | No data |
| Hexachlorobenzene | ■ | No data | ■ | ■ |
| Pesticides | ||||
| Chlorpyrifos | No data | No data | ■ | No data |
| Cyfluthrin | ■ | ■ | No data | ■ |
| 2,4-D | ■ | ■ | No data | No data |
| Deltamethrin | ■ | ■ | No data | ■ |
| Malathion | No data | No data | * | No data |
| 3-Phenoxybenzoic acidFootnote 1 | * | * | No data | ■ |
| Phthalates | ||||
| Benzyl butyl phthalate | ■ | ■ | No data | ■ |
| Dibutyl phthalate | ■ | ■ | No data | ■ |
| Dicyclohexyl phthalateFootnote 1 | * | * | No data | ■ |
| Di(2-ethylhexyl) phthalate | ■ | ■ | No data | ■ |
| Diethyl phthalate | ■ | ■ | No data | ■ |
| Diisobutyl phthalate | No data | ■ | No data | ■ |
| Diisononyl phthalate | ■ | * | No data | ■ |
| VOCs | ||||
| Benzene | No data | No data | ■ | ■ |
| Bromodichloromethane | No data | No data | ■ | ■ |
| Bromoform | No data | No data | ■ | ■ |
| Chloroform | No data | No data | ■ | ■ |
| Dibromochloromethane | No data | No data | ■ | ■ |
| Ethylbenzene | No data | No data | ■ | ■ |
| Styrene | No data | No data | ■ | ■ |
| Tetrachloroethene | No data | No data | ■ | ■ |
| Toluene | No data | No data | ■ | ■ |
| Trichloroethene | No data | No data | ■ | ■ |
| Xylenes, mixed | No data | No data | ■ | ■ |
Appendix B – External Peer Reviews
Reviewers were asked to address a list of questions for a subset of the BEs developed for Health Canada which were: phthalates, cyfluthrin, inorganic arsenic, HCB, BPA, DDT, triclosan, deltamethrin and PBDE-99.
- Has all critical information relevant to derivation of the BE been identified? For example, have all relevant reference/guidance values as a potential basis for BEs been identified and considered? If not, please provide a copy of the relevant document/reference(s) omitted.
- Is the critical information presented in sufficient detail to support adequate characterization of the basis for the BE (for example, relevance of the target analyte to toxicity based on mode of action?) Is there sufficient critical discussion of aspects of supporting information and the approach to derivation of the BEs? If not, what would you suggest be additionally included?
- Are you aware of any limitations of the critical information which forms the basis for the BE(s) that have not been presented?
- Does the derivation of the BEs conform with the principles outlined in Hays et al. (2008a) and based on best available practice? Are the conclusions sound based on the information reviewed/presented? For example,
- Has the appropriate Target Analyte been selected? In responding, please consider the following criteria (see Hays et al., 2008a):
- specificity
- relevance to toxicity (based on understanding of mode of action)
- stability
- acceptability
- ease of interpretation
- adequacy of pharmacokinetic data
- Has the most appropriate pathway of derivation of the BEs been selected (as highlighted in Figures 3, 4, and 6 in Hays et al., 2008a)?
- Is the inclusion or replacement of default uncertainty factors for interspecies differences and human variability in toxicokinetics consistent with guidance in Table 1 from Hays et al. (2008a)?
- Has the appropriate Target Analyte been selected? In responding, please consider the following criteria (see Hays et al., 2008a):
- Is the Uncertainty/Degree of Confidence in various components and the resulting BE(s) adequately considered and presented?
- Would modifications of presentation improve understanding? Please suggest specific revisions.