
Analysis of trends in spending and human resources - 2016–17 Departmental Results Report - Treasury Board of Canada Secretariat
Analysis of trends in spending and human resources
Actual expenditures
Departmental spending breakdown
The Secretariat spent a total of $3.1 billion toward achieving its Strategic Outcome. Approximately 10% of its total spending was directly related to operating expenditures.
The balance is primarily related to the Secretariat’s role in supporting the Treasury Board as employer of the core public administration (see Figure 1).
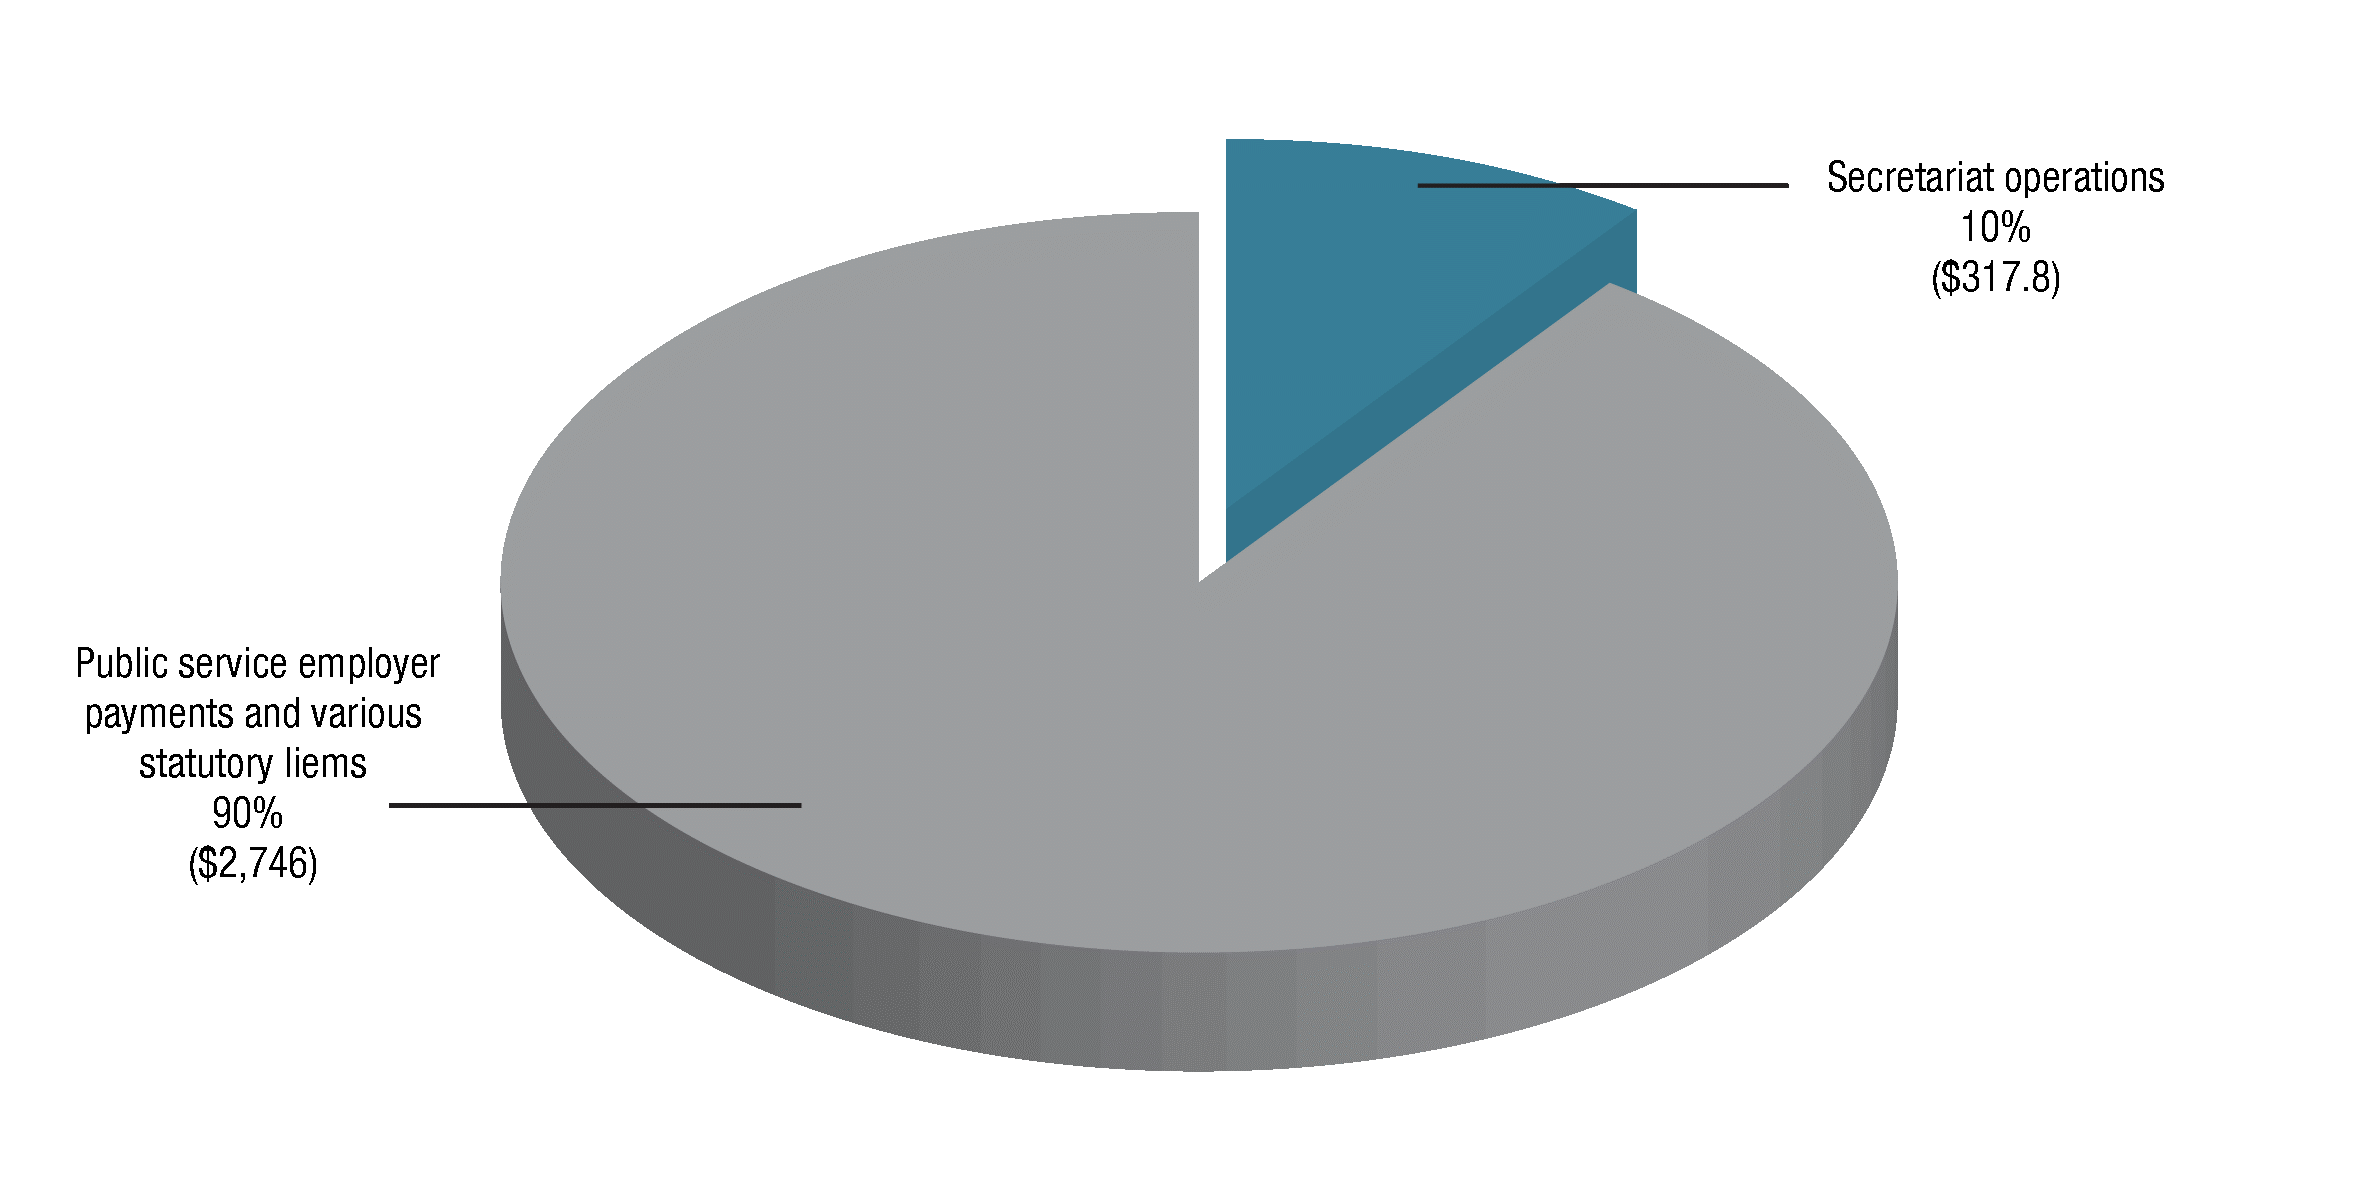
Figure 1 - Text version
This pie chart shows the breakdown of the Treasury Board of Canada Secretariat’s actual spending for 2016–17 in two categories: public service employer payments and various statutory items, which accounted for 90 per cent of actual spending, or $2,746 million; and Secretariat operations, which accounted for 10 per cent of actual spending, or $317.8 million).
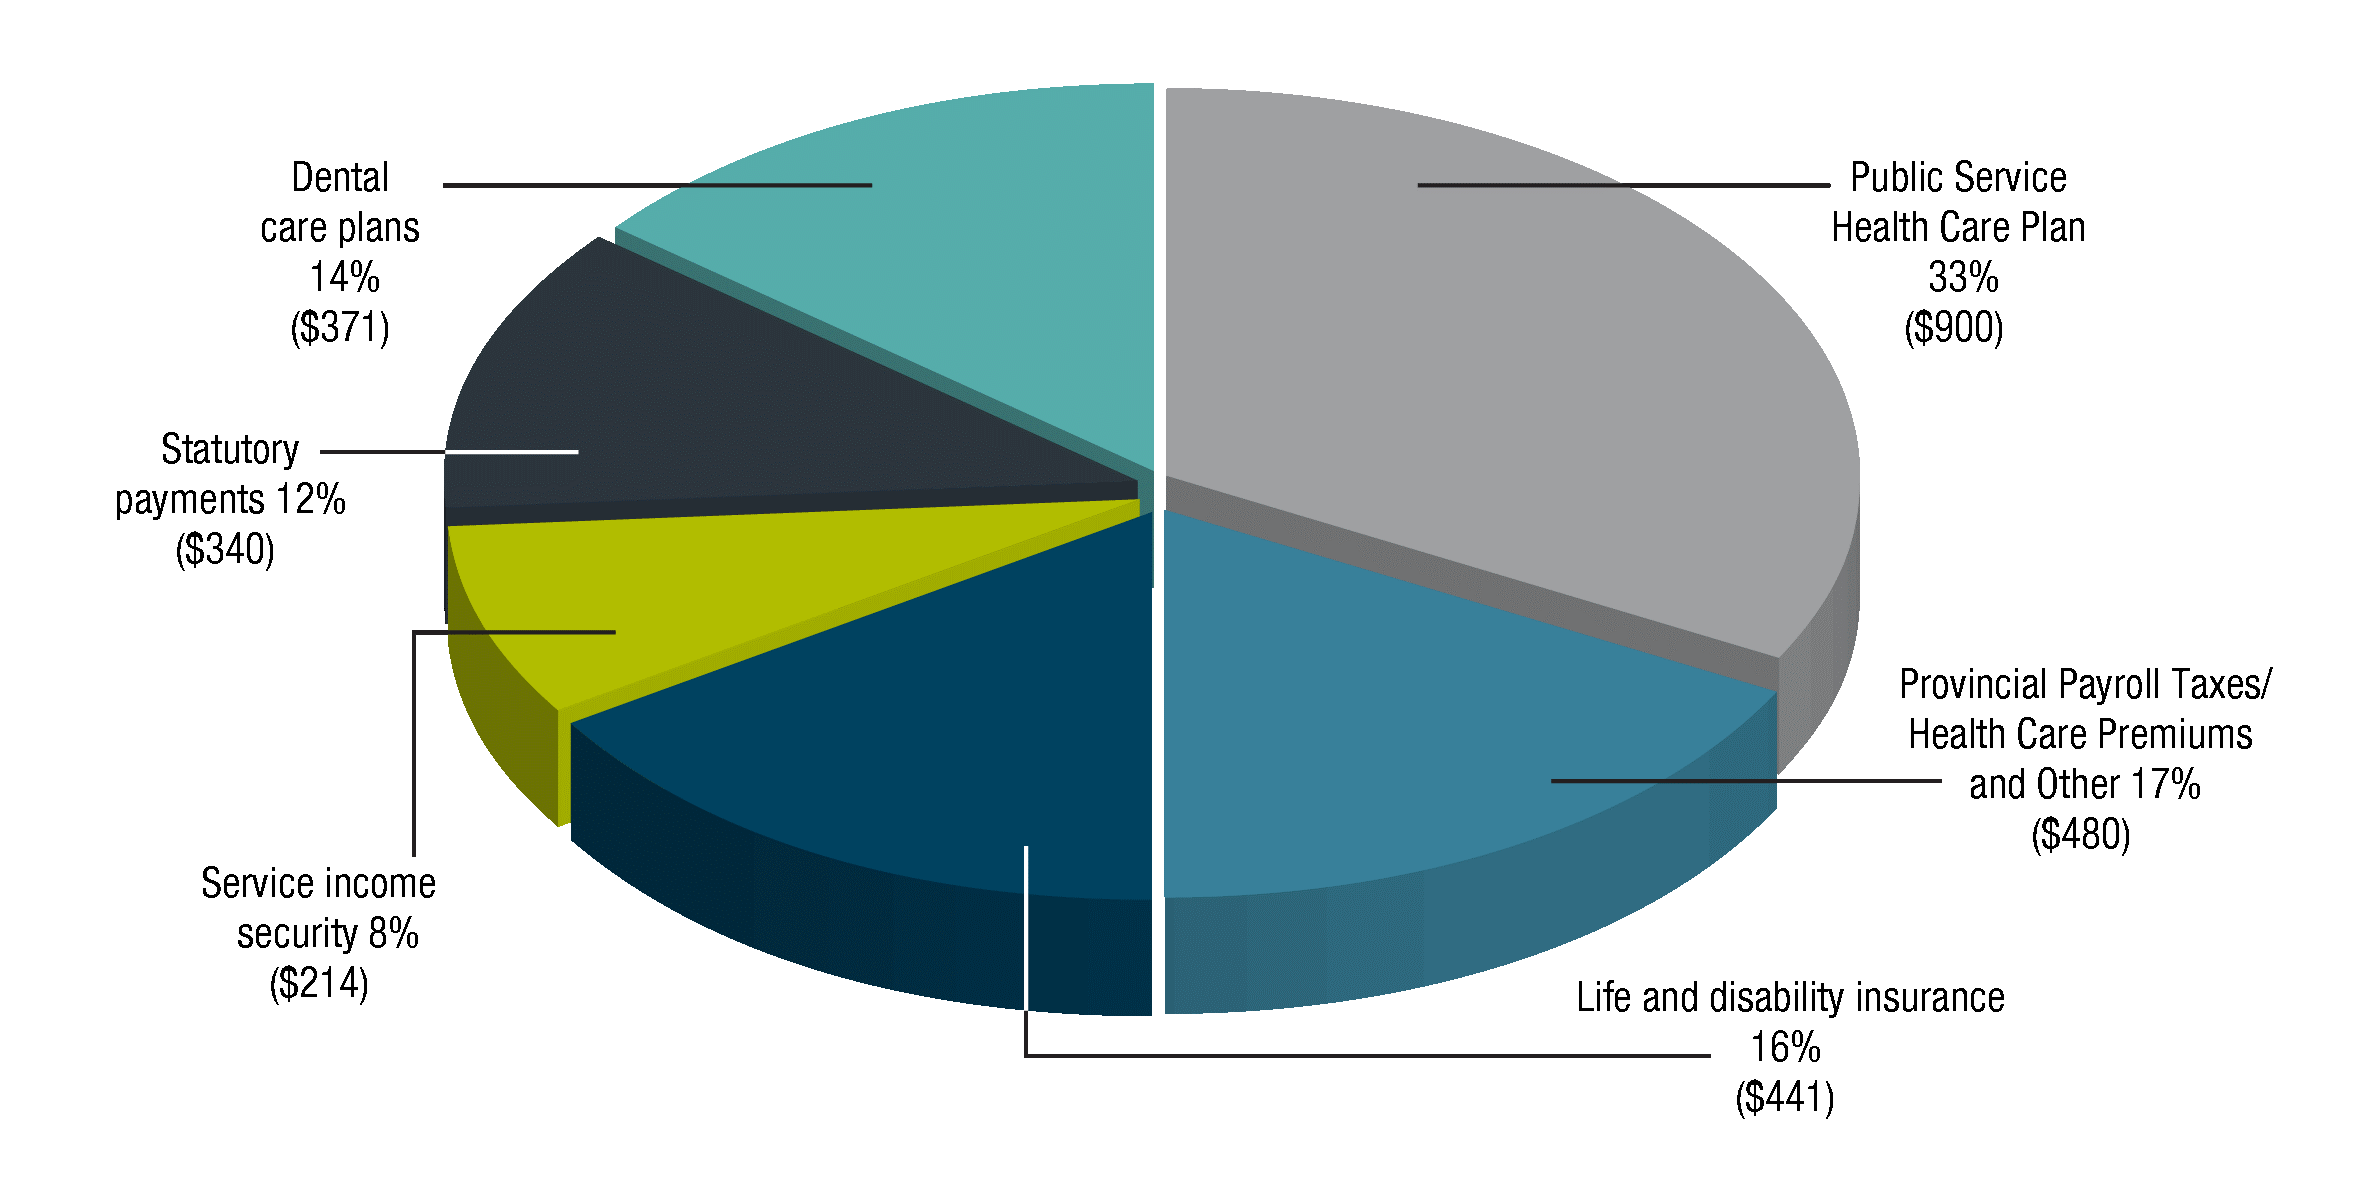
Figure 2 - Text version
This pie chart shows the breakdown of the Treasury Board of Canada Secretariat’s actual spending on public service employer payments and various statutory items for 2016–17. The pie chart is divided into six spending categories, broken down as follows:
Category |
Amount |
Percentage of total |
|---|---|---|
Public Service Health Care Plan |
$900 million |
33% |
Provincial Payroll Taxes / Health Care Premiums and Other |
$480 million |
17% |
Life and disability insurance |
$441 million |
16% |
Dental care plans |
$371 million |
14% |
Statutory payments |
$340 million |
12% |
Service income security |
$214 million |
8% |
Total spending for Public Service Employer Payments was $2.7 billion in 2016–17. The amount includes payments made under public service benefit plans, legislated amounts payable to provinces and associated administrative expenditures. In addition, statutory payments, which relate to the employer contributions made under the Public Service Superannuation Act and other retirement acts and the Employer Insurance Act totalled $340 million (see Figure 2).
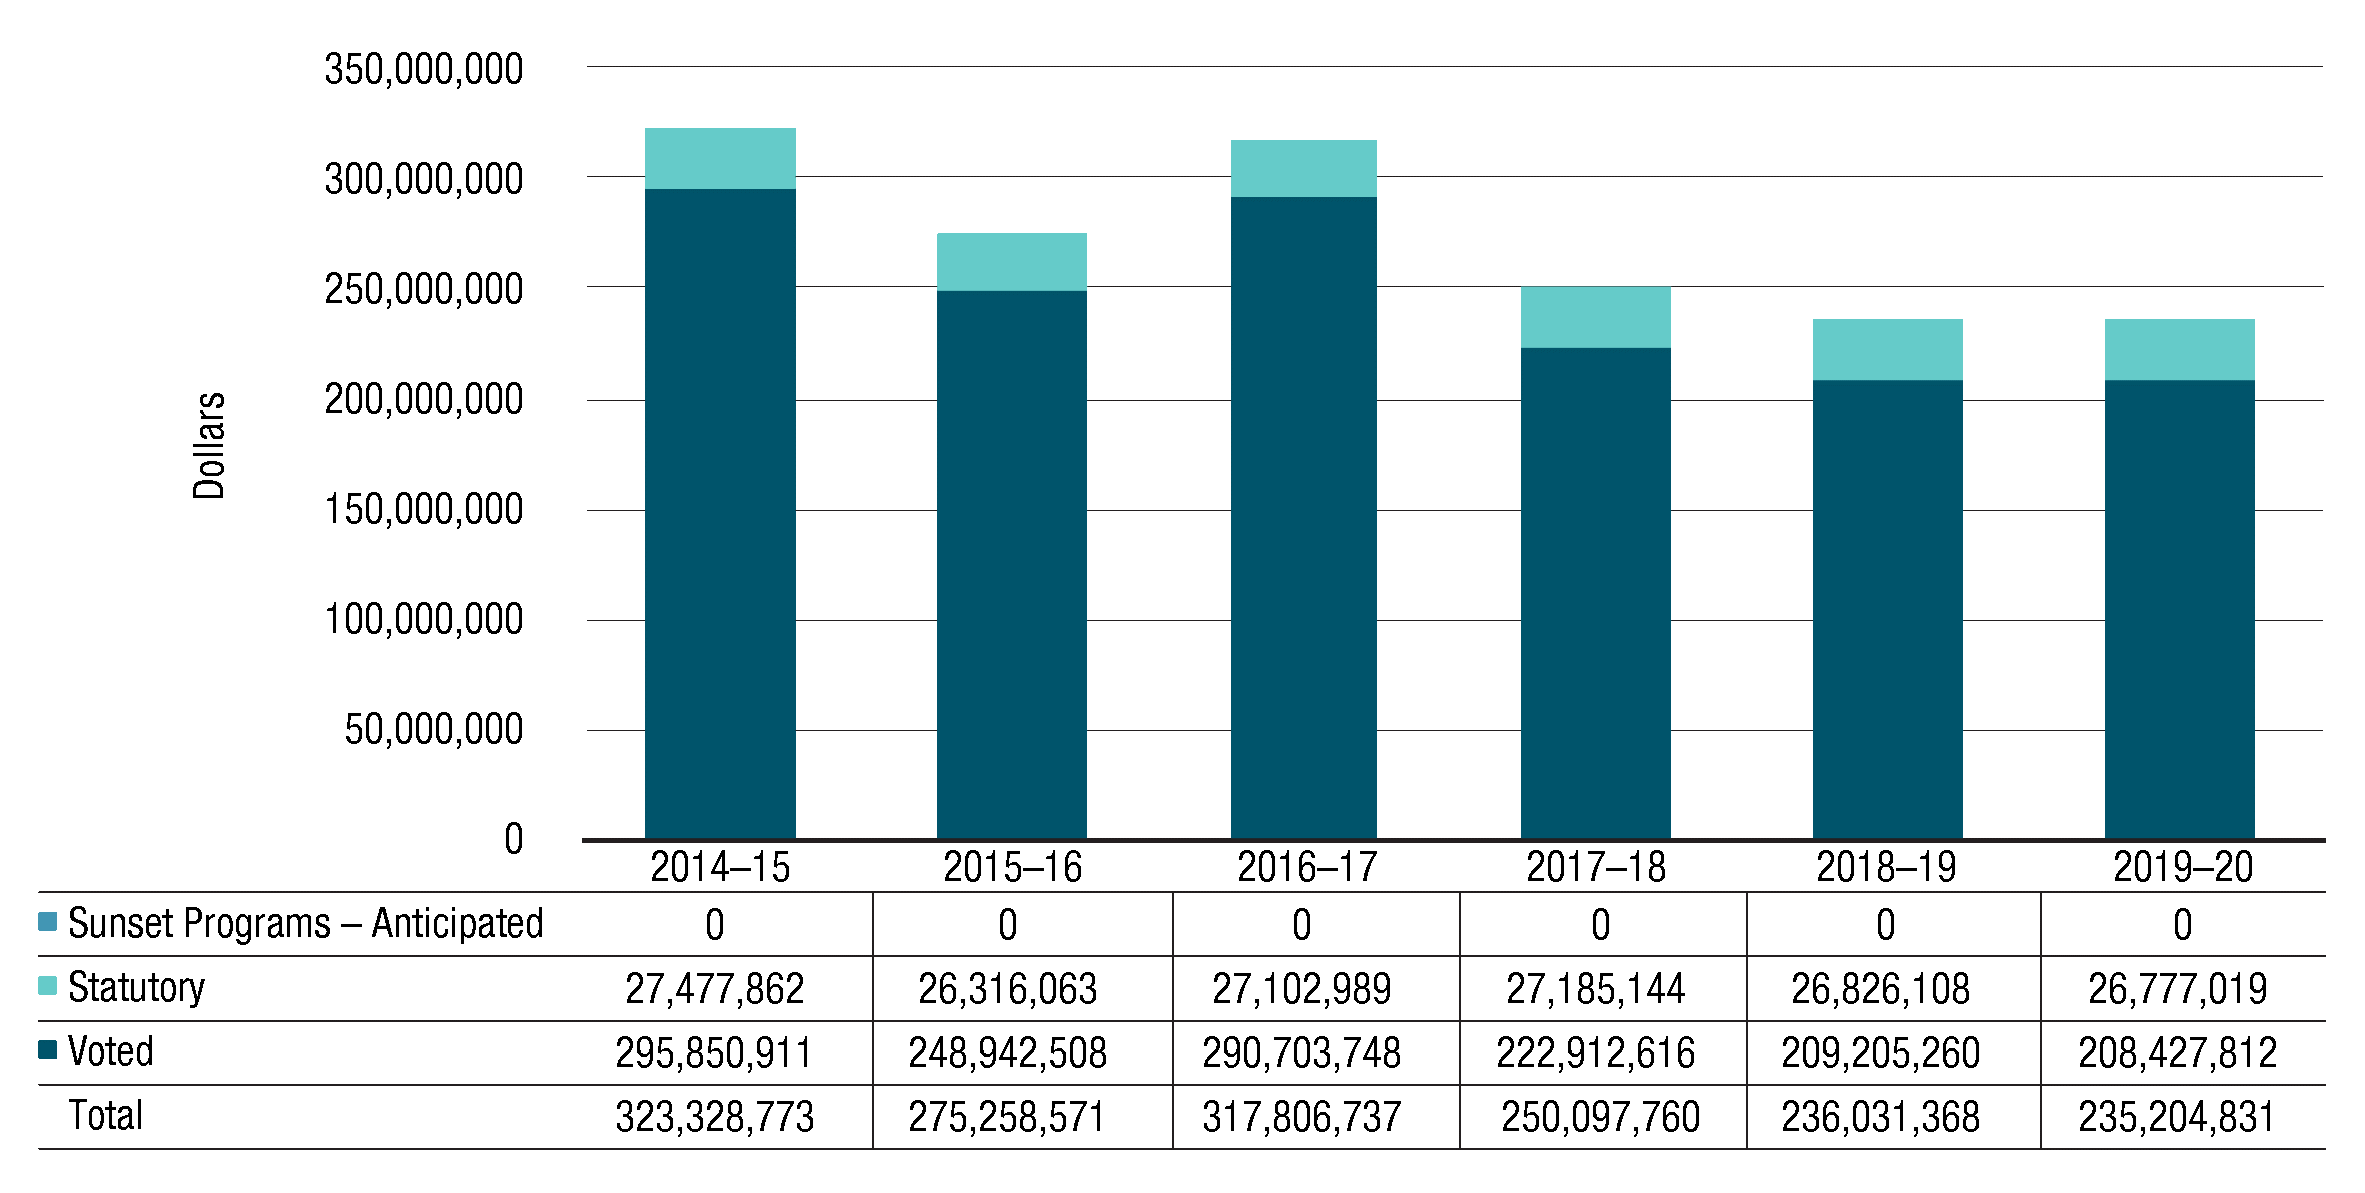
Figure 3 - Text version
This bar graph illustrates the Secretariat’s actual spending (Vote 1) for fiscal years 2014-15, 2015-16 and 2016-17 and planned spending for fiscal years 2017-18, 2018-19 and 2019-20. Financial figures are presented in dollars along the y axis, increasing by $50 million and ending at $350 million. These are graphed against fiscal years 2014-15 to 2019-20 on the x axis
For each fiscal year, amounts for the Secretariat’s program expenditures (Vote 1), statutory vote (largely comprised of contributions to employee benefit plans), and anticipated sunset programs are identified.
No amount is reported in 2014-15 to 2019-20 as sunset programs - anticipated.
In 2014-15, actual spending was $27,477,862 for statutory items, $295,850,911 for program expenditures for a total of $323,328,773.
In 2015-16, actual spending was $26,316,063 for statutory items and $248,942,508 for program expenditures for a total of $275,258,571.
In 2016-17, actual spending was $27,102,989 for statutory items and $290,703,748 for program expenditures for a total of $317,806,737.
Planned spending for statutory items goes from $27,185,144 in 2017-18, to $26,826,108 in 2018-19 and to $26,777,019 in 2019-20.
Planned spending for program expenditures goes from $222,912,616 in 2017-18, to $209,205,260 in 2018-19, and to $208,427,812 in 2019-20.
Total planned spending goes from $250,097,760 in 2017-18, to $236,061,368 in 2018-19, and to $235,204,831 in 2019-20.
Budgetary performance summary for Programs and Internal Services (dollars)
The Secretariat’s operating expenditures include salaries, non-salary costs to deliver programs and statutory items related to the employer’s contributions to the Secretariat’s employee benefit plans.
The decrease of $48 million between 2014–15 and 2015–16 actual spending resulted mostly from reduced expenditures in 2015–16 related to the settlement in the White class action lawsuit and a decrease in spending related to the Workspace Renewal Initiative (phase I). Those decreases were partially offset by expenditures incurred to support the Secretariat-led government-wide Enabling Functions Transformation.
The increase of $42.5 million between 2015–16 and 2016–17 is mostly attributed to implementing the Secretariat’s Government of Canada’s Budget 2016 initiatives to make progress on government-wide Enabling Functions Transformation, the plan to enhance access to information, and to develop a client-first service strategy and expand open data across the Government of Canada.
A decrease of $67.7 million between 2016–17 and 2017–18 is mostly attributed to one-time funding received to accelerate the Enabling Functions Transformation, as announced in Budget 2016.
Program expenditures are anticipated to further decrease by $14.9 million from 2017–18 to 2019–20, as phase II of the Workspace Renewal Initiative is expected to be completed with more than 800 Secretariat employees expected to move into their new workspace at 219 Laurier by winter 2018.
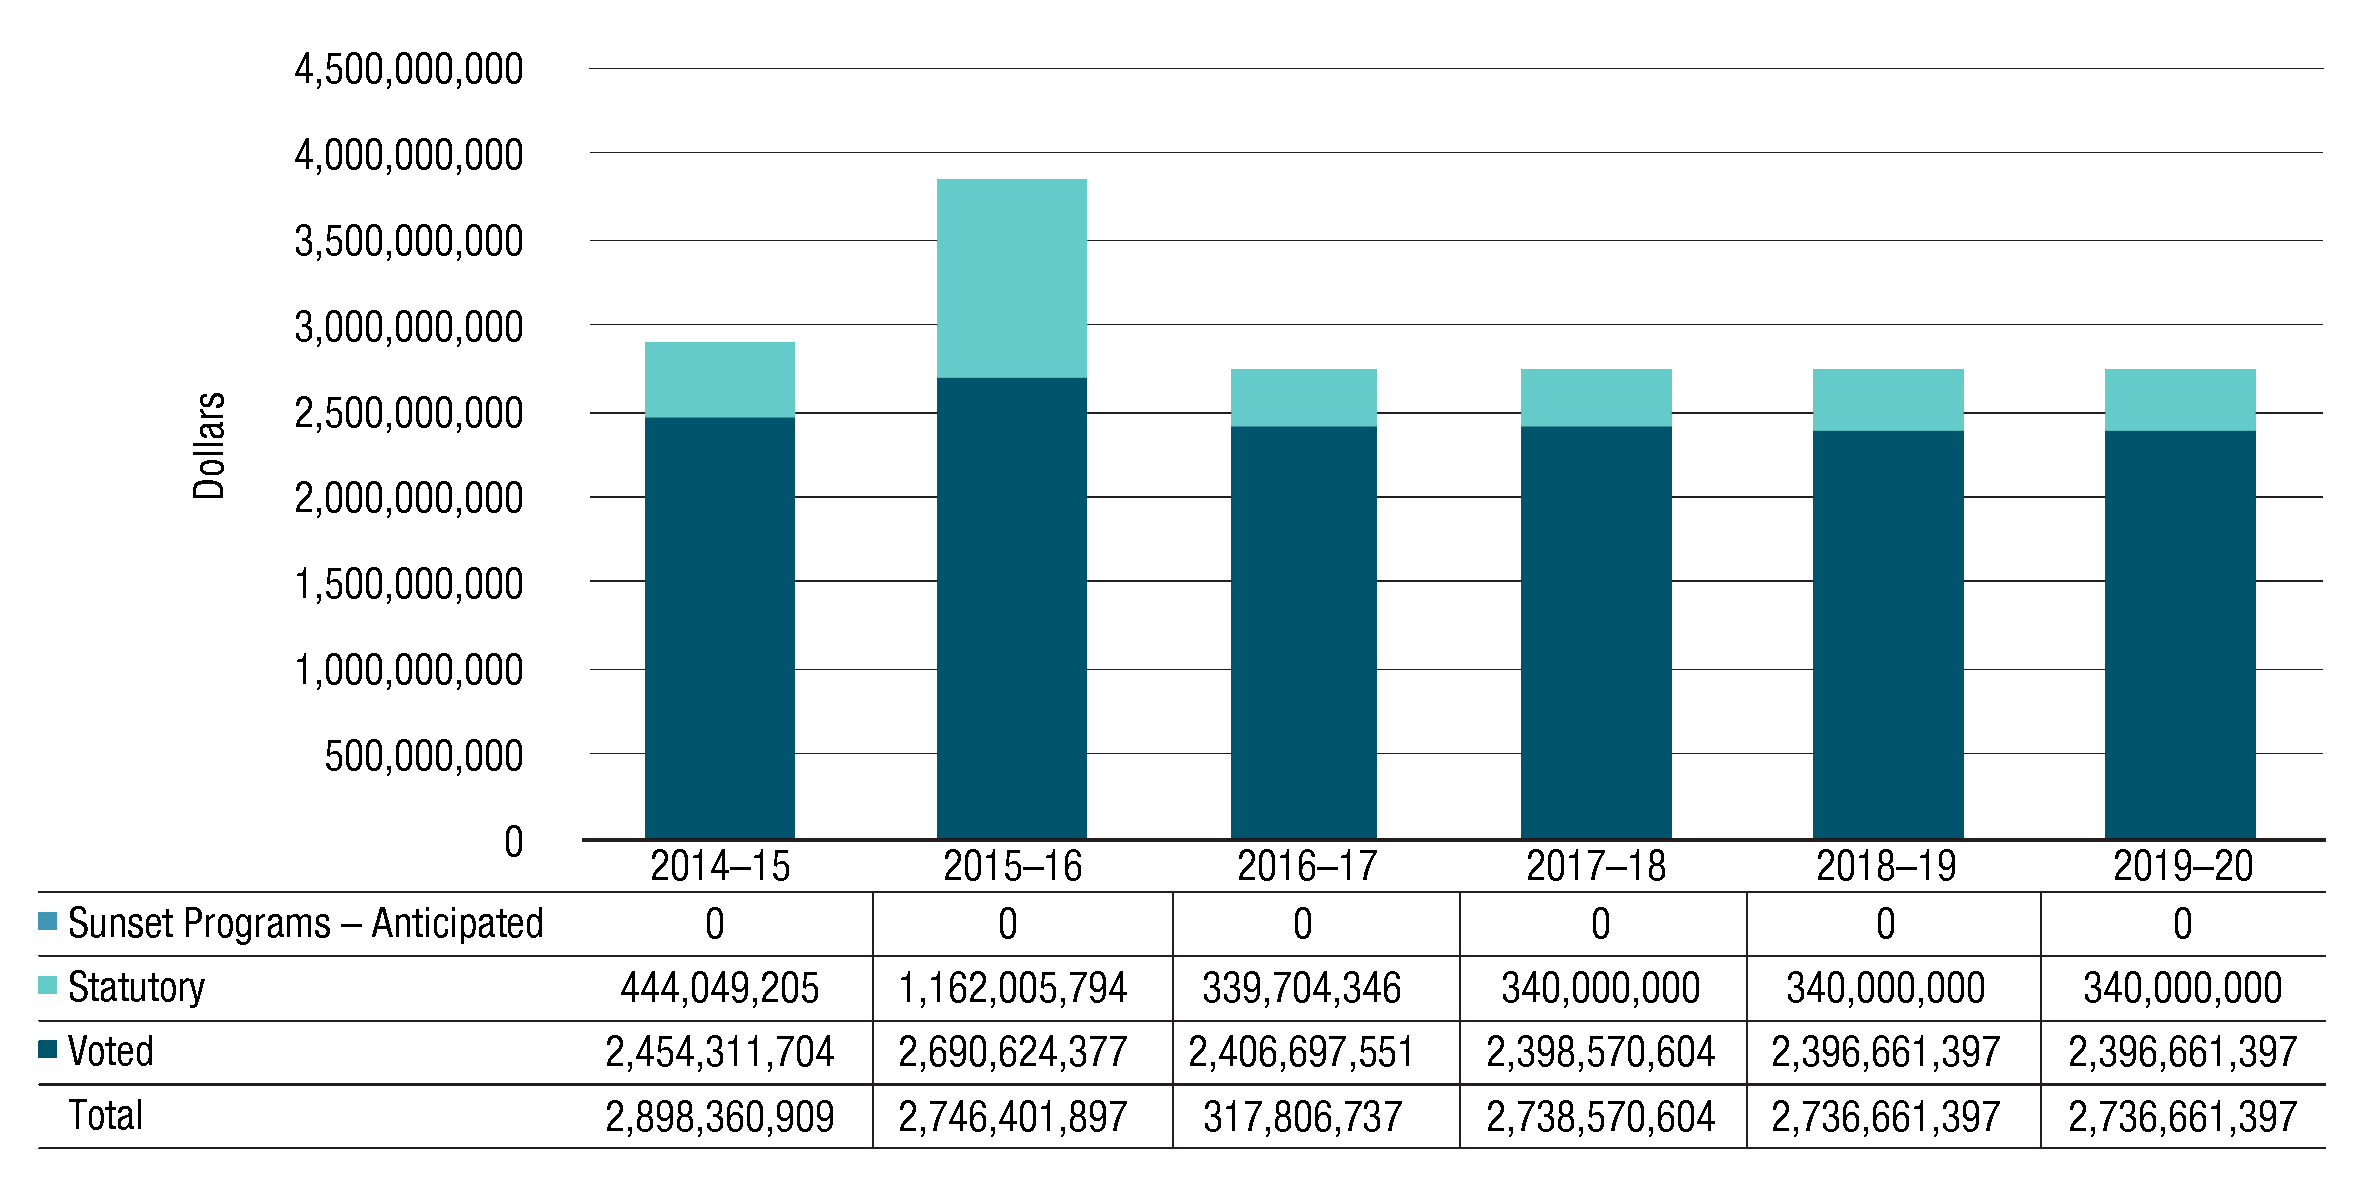
Figure 4 - Text version
This bar graph illustrates the Secretariat’s actual spending for the public service employer payments (Vote 20) and various statutory items for fiscal years 2014-15, 2015-16 and 2016-17 and planned spending for fiscal years 2017-18, 2018-19 and 2019-20. Financial figures are presented in dollars along the y axis, increasing by $500 million and ending at $4.5 billion. These are graphed against fiscal years 2014-15 to 2019-20 on the x axis.
For each fiscal year, amounts for the Secretariat’s public service employer payments (Vote 20), statutory items (largely comprised of payments under the Public Service Pension Adjustment Act), and anticipated sunset programs are identified.
No amount is reported in 2014-15 to 2019-20 as sunset programs - anticipated.
In 2014-15, actual spending was $444,049,205 for statutory items and $2,454,311,704 for public service employer payments for a total of $2,898,360,909.
In 2015-16, actual spending was $1,162,005,794 for statutory items and $2,690,624,377 for public service employer payments for a total of $3,852,630,171.
In 2016-17, actual spending was $339,704,346 for statutory items and $2,406,697,551 for public service employer payments for a total of $2,746,401,897.
Planned spending for statutory items will remain the same for fiscal years 2017-18 to 2019-20 in the amount of $340,000,000.
Planned spending for public service employer payments goes from $2,398,570,604 in 2017-18, to $2,396,661,397 in 2018-19, and will remain the same for fiscal years 2019-20.
Total planned spending for public service employer payments goes from $2,738,570,604 in 2017-18, to $2,736,661,397 in 2018-19, and will remain the same for fiscal years 2019-20.
Expenditures for public service employer payments and statutory items represent the employer’s share of contributions required by the insurance plans sponsored by the Government of Canada. These amounts also include statutory items for payments under the Public Service Pension Adjustment Act and employer contributions made under the Public Service Superannuation Act, the Employment Insurance Act and related acts.
The increase of $954 million from 2014–15 to 2015–16 is attributed to statutory items of $718 million, which is largely due to an actuarial adjustment made in relation to the Public Service Superannuation Act, and an increase of $236 million related to public service employer payments to incrementally restore the financial health of the Service Income Security Insurance Plan.
The decrease of $1,106 million from 2015–16 to 2016–17 is largely attributed to the one-time payments made last fiscal year for the actuarial adjustment and the Service Income Security Insurance Plan noted above. These were offset by an increase mainly due to a one-time payment to the Royal Canadian Mounted Police Disability Insurance Plan to eliminate the current deficit and to restore the plan to sound financial health.
Planned spending for fiscal years 2017–18 to 2019–20 is expected to remain mostly unchanged.
Programs and Internal Services |
2016–17 Main Estimates |
2016–17 Planned spending |
2017–18 Planned spending |
2018–19 Planned spending |
2016–17 Total authorities available for use |
2016–17 Actual spending (authorities used) |
2015–16 Actual spending (authorities used) |
2014–15 Actual spending (authorities used) |
|---|---|---|---|---|---|---|---|---|
Decision-Making Support and Oversight |
49,543,385 |
50,579,535 |
45,643,416 |
45,580,561 |
47,860,798 |
46,426,488 |
41,781,563 |
45,973,078 |
Management Policies Development and Monitoring |
67,614,269 |
68,090,606 |
68,980,686 |
67,203,962 |
73,070,813 |
70,832,094 |
65,041,366 |
71,248,693 |
Government-Wide Program Design and Delivery |
53,732,931 |
53,256,595 |
57,333,552 |
55,931,994 |
192,795,583 |
127,193,033 |
90,757,746 |
128,464,156 |
Government-wide Funds and Public Service Employer Payments |
6,333,254,397 |
6,333,254,397 |
6,291,763,604 |
6,289,854,398 |
4,936,924,721 |
2,746,401,897 |
3,852,630,170 |
2,898,360,909 |
Internal Services |
66,661,047 |
65,624,896 |
78,140,106 |
67,314,850 |
80,224,405 |
73,355,122 |
77,677,897 |
77,642,846 |
Total |
6,570,806,029 |
6,570,806,029 |
6,541,861,364 |
6,525,885,765 |
5,330,876,320 |
3,064,208,634 |
4,127,888,742 |
3,221,689,682 |
In 2017–18, the Secretariat has transitioned from its Strategic Outcome and Program Alignment Architecture, which was required under the previous Policy on Management Resources and Results Structures, to a Departmental Results Framework, which is required under the new Policy on Results. The planned spending for 2017–18 and 2018–19 were prepared as per the Departmental Results Framework and restated to the Program Alignment Architecture for illustration purposes only.
The budgetary performance summary table above provides the following:
- Main Estimates for 2016–17
- Planned spending for 2016–17, as reported in the Secretariat’s 2016–17 Report on Plans and Priorities
- Planned spending for 2017–18 and 2018–19, as reported in the Secretariat’s 2017–18 Departmental Plan (restated as noted above)
- Total Authorities Available for use in 2016–17 which reflects the authorities received to date, including in-year contributions from other government departments (OGDs) for the Enabling Functions Transformation
- Actual spending for 2016–17, 2015–16 and 2014–15 as reported in the Public Accounts
For additional details on planned spending, see the section “Supporting information on lower-level programs” in Supplementary Information.
The Government-Wide Funds and Public Service Employer Payments program is the largest portion of the Secretariat’s planned spending. On average, the Treasury Board approves transfers of approximately 56% of this program’s funding to other federal organizations for items such as government contingencies, government-wide initiatives, compensation requirements, operating and capital budget carry forward, and paylist expenditures (Central Votes 5, 10, 15, 25, 30 and 33). The Secretariat’s total funding available for use is reduced accordingly. The remaining 44% of this program pertains to statutory payments, used to pay the employer’s share of contributions to employee pension plan, and to public service employer payments, used to pay the employer’s share of contributions to employee insurance and benefits plans.
Overall, planned spending is expected to decrease by $45 million by 2018–19, mainly due to the actuarial adjustment referenced above and offset by additional ongoing funding related to the premium rate increase for the Service Income Security Insurance Plan. The decrease is also due to the sunsetting of the Workspace Renewal Initiative (phase II), and the one-time funding received to accelerate the Enabling Functions Transformation, as announced in Budget 2016.
Actual spending decreased by $1,064 million in 2016–17, primarily because of the one-time payments no longer required for the actuarial adjustment and the Service Income Security Insurance Plan. These decreases were offset by an increase in the Secretariat’s operating expenditures used for:
- Budget 2016 initiatives to accelerate the Enabling Functions Transformation, to enhance access to information, to develop a client-first service strategy, and to expand open data
- establishing a Centre for Greening Government at the Secretariat
- the additional claims related to the White class action lawsuit
- the third-party Shared Services Canada resource alignment review
- the transfer of the Regulatory Cooperation Council Secretariat from the Privy Council Office to the Secretariat
As reported in the Secretariat’s 2015–16 Departmental Performance Report, actual spending increased by $906 million from 2014–15 to 2015–16. Most of that increase, $718 million can be attributed to statutory items, largely due to the actuarial adjustment made in relation to the Public Service Superannuation Act discussed above. The rest of the increase, $236 million, related to public service employer payments to incrementally restore the financial health of the Service Income Security Insurance Plan. This plan is providing benefits to an increased number of medically released Canadian Armed Forces members who served in the Afghanistan mission. These increases were offset by a $48-million decrease in the Secretariat’s operating expenditures, mostly related to the sunset of funding received in 2014–15 for the payout of an out-of-court settlement under the White class action lawsuit launched against the Crown in 2014.
Actual human resources
Programs and Internal Services |
2014–15 Actual |
2015–16 Actual |
2016–17 Planned |
2016–17 Actual |
2017–18 Planned |
2018–19 Planned |
|---|---|---|---|---|---|---|
Decision-Making Support and Oversight |
346 |
332 |
343 |
337 |
338 |
337 |
Management Policies Development and Monitoring |
486 |
466 |
498 |
506 |
504 |
490 |
Government-Wide Program Design and Delivery |
413 |
428 |
383 |
498 |
452 |
443 |
Government-Wide Funds and Public Service Employer Payments |
N/A | N/A | N/A | N/A | N/A | N/A |
Internal Services |
590 |
581 |
578 |
581 |
581 |
579 |
Total |
1,835 |
1,807 |
1,802 |
1,922 |
1,875 |
1,849 |
The decrease of 28 full-time equivalents between 2014–15 and 2015–16 relates mostly to the return of funding to the Fiscal Framework for the National Managers’ Community and the Regional Federal Councils and to the transfer of administration of the National Managers’ Community to the Canada School of Public Service, and the full time equivalents related to the funding transferred from the Secretariat to Public Services and Procurement Canada for the consolidation of pay services in Miramichi, New Brunswick.
The increase of 115 full-time equivalents between 2015–16 and 2016–17 relates primarily to the new staff hired to implement Budget 2016 initiatives to accomplish the Enabling Functions Transformation, enhance access to information, develop a client-first service strategy and expand open data. Full-time equivalents also increased because employees who worked in the Regulatory Cooperation Council Secretariat at the Privy Council Office and in the Centre for Greening Government at Public Services and Procurement Canada were transferred to the Secretariat in 2016.
Planned full-time equivalents are expected to decrease by 73 between 2016–17 and 2018–19. This decrease is mostly attributable to the full-time equivalents related to the reduction in funding to:
- implement the Secretariat’s Workspace Renewal Initiative (phase II) as employees will have already moved to their new workspace at 219 Laurier by winter 2018
- advance the Enabling Functions Transformation (as announced in Budget 2016)
Expenditures by vote
For information on the Secretariat’s organizational voted and statutory expenditures, consult the Public Accounts of Canada 2017.
Alignment of spending with the whole-of-government framework
Program |
Spending area |
Government of Canada activity |
2016–17 Actual spending |
|---|---|---|---|
Decision-Making Support and Oversight |
Government Affairs |
Well-managed and efficient government operations |
46,426,488 |
Management Policies Development and Monitoring |
Government Affairs |
Well-managed and efficient government operations |
70,832,094 |
Government-Wide Program Design and Delivery |
Government Affairs |
Well-managed and efficient government operations |
127,193,033 |
Government-Wide Funds and Public Service Employer Payments |
Government Affairs |
Well-managed and efficient government operations |
2,746,401,897 |
Spending area |
Total planned spending |
Total actual spending |
|---|---|---|
Economic affairs |
N/A | N/A |
Social affairs |
N/A | N/A |
International affairs |
N/A | N/A |
Government affairs |
6,505,181,133 |
2,990,853,512 |
Note: The figures above do not include Internal Services.
Financial statements and financial statements highlights
Financial statements
The Treasury Board of Canada Secretariat financial statements [unaudited] for the year ended March 31, 2017, are available on the Secretariat’s website.
Financial statements highlights
The highlights presented in this section are drawn from the Secretariat’s financial statements. The financial statements were prepared using Government of Canada accounting policies, which are based on Canadian public sector accounting standards.
The figures provided in other sections were prepared on an expenditure basis, while the figures in this section were prepared on an accrual basis. The difference relates to accrual entries such as the recognition of services without charge received from other government departments, acquisition of capital assets and related amortization expenses, and accrued liability adjustments.
Financial information |
2016–17 Planned results |
2016–17 Actual |
2015–16 Actual |
Difference (2016–17 actual minus 2016–17 planned) |
Difference (2016–17 actual minus 2015–16 actual) |
|---|---|---|---|---|---|
Total expenses |
3,046,425,303 |
3,077,669,086 |
4,152,291,564 |
31,243,783 |
(1,074,622,479) |
Total net revenues |
11,848,562 |
10,890,100 |
11,701,966 |
(958,462) |
(811,866) |
Net cost of operations before government funding and transfers |
3,034,576,741 |
3,066,778,986 |
4,140,589,598 |
32,202,245 |
(1,073,810,613) |
Note: Refer to the Secretariat’s 2016–17 Future-Oriented Statement of Operations for additional information on planned results.
The Secretariat’s total expenses of $3.1 billion in 2016–17 included approximately $2.7 billion related to public service employer payments for government-wide benefits programs, such as the employer’s share of the Public Service Health Care Plan (PSHCP), the Public Service Dental Care Plan (PSDCP) and other insurance and pension programs. The Secretariat’s total net revenues of $10.9 million in 2016–17 mainly resulted from revenues collected from internal support services that the Secretariat provided to other government departments and the recovery of Public Service Pension Plan administration costs.
The decrease of $1.1 billion in actual net cost of operations before government funding and transfers in 2016–17 is mostly due to a decrease in public service employer payments. This included a decrease of $822 million related to one-time actuarial adjustments to the Public Service Pension Plan made in 2015–16 in accordance with the Public Service Superannuation Act in order to align with the triennial valuation tabled in Parliament in January 2016, as well as a decrease of $290 million mostly related to a one-time payment made in 2015–16 to restore the financial health of the Service Income Security Insurance Plan.
The increase of $32 million to the net cost of operations before government funding and transfers between 2016–17 planned and actual results is mostly due to additional funding approved for the Enabling Functions Transformation Initiative, partially offset by the revised actuarial adjustments.
Financial information |
2016–17 |
2015–16 |
Difference (2016–17 minus 2015–16) |
|---|---|---|---|
Total liabilities |
714,404,674 |
459,800,454 |
254,604,220 |
Total net financial assets |
642,232,112 |
376,944,154 |
265,287,958 |
Departmental net debt |
72,172,562 |
82,856,300 |
(10,683,738) |
Total non-financial assets |
33,511,879 |
27,414,380 |
6,097,499 |
Departmental net financial position |
(38,660,683) |
(55,441,920) |
16,781,237 |
The Secretariat’s liabilities consist mainly of accounts payable to other government organizations related to employer contributions to employee benefit plans (EBP) and to accrued employee claims for health and dental benefits under the PSHCP and the PSDCP. The increase of $255 million in total liabilities is mostly due to an increase in accounts payable to other government organizations to adjust their share of employer contributions to EBP as well as an account payable to address a shortfall under the RCMP Disability Insurance Plan.
The Secretariat’s assets consist mainly of accounts receivable from other government departments and agencies to pay for their share of employer contributions to employee benefit plans, as well as amounts due from the Consolidated Revenue Fund (CRF) that may be disbursed from the CRF without further charges to the Secretariat’s authorities. The increase of $265 million in total net financial assets is mostly due to an increase in amounts due from the CRF.
The departmental net debt is mainly comprised of accrued liabilities to be paid from authorities in future years. The decrease of $11 million is mostly due to a reduction of $6 million to the accrued liability associated with a legal settlement and a decrease of $3 million in accrued severance benefits due to a change in the estimated future obligation.
The Secretariat’s non-financial assets consist mainly of tangible capital assets. The increase of $6 million is mostly due to the capitalization of software development costs.
The increase of $17 million to the departmental net financial position, which is the difference between the total non-financial assets and the departmental net debt, is thus attributable to the increase in tangible capital assets and the reduction in accrued liabilities to be paid from future authorities.