
Organizational Expenditure Overview - 2013–14 Departmental Performance Report - Treasury Board of Canada Secretariat
Section I: Organizational Expenditure Overview
Organizational Profile
Appropriate Minister: The Honourable Tony Clement, President of the Treasury Board
Institutional Head: Yaprak Baltacioğlu, Secretary of the Treasury Board
Ministerial Portfolio: The Treasury Board of Canada Secretariat and the Canada School of Public Service. Operating at arm’s length and reporting to Parliament through the President of the Treasury Board are the Public Sector Pension Investment Board, the Office of the Commissioner of Lobbying of Canada and the Office of the Public Sector Integrity Commissioner of Canada.
Enabling Instruments:
Year of Commencement: 1966
Organizational Context
Treasury Board Roles
The Treasury Board is a Cabinet committee of ministers established in 1867. It oversees the government’s financial and human resources and administrative responsibilities, and establishes policies that govern each of these areas. In addition, the Prime Minister has designated the Treasury Board to act as the committee of the Queen’s Privy Council to consider and approve regulations and most orders-in-council. The Treasury Board, as the management board for the government, has three principal roles:
- It acts as the government’s Management Office by promoting improved performance. It also approves policies to support the prudent and effective management of the government’s assets and financial, information and technology resources.
- It acts as the government’s Budget Office by examining and approving the proposed spending plans of government departments and by reviewing the development of approved programs.
- It acts as the human resources office and the employer or People Management Office by managing compensation and labour relations for the core public administration. It also sets foundational values for the public sector and people management policies for the core public administration (including determining the terms and conditions of employment) to ensure coherence and consistency, where needed.
Raison d’être
The Treasury Board of Canada Secretariat (Secretariat) is the administrative arm of the Treasury Board, and the President of the Treasury Board is the Minister responsible for the Secretariat. This organization supports the Treasury Board by making recommendations and providing advice on program spending, regulations and management policies and directives, while respecting the primary responsibility of deputy heads in managing their organizations, and their roles as accounting officers before Parliament. In this way, the Secretariat strengthens the way government is managed and helps to ensure value for money in government spending and results for Canadians.
Responsibilities
The Secretariat supports the Treasury Board in each of its roles (see text box “Treasury Board Roles”). Within the Secretariat, the Comptroller General of Canada provides government-wide leadership, direction, oversight and capacity building for financial management, internal audit and the management of assets and acquired services. The Chief Human Resources Officer provides government-wide leadership on people management through policies, programs and strategic engagements and by centrally managing labour relations, compensation, pensions and benefits and contributing to the management of executives. The Chief Information Officer provides government-wide leadership, direction, oversight and capacity building for information management, information technology, government security (including identity management) and access to information, privacy, and internal and external service delivery.
The Treasury Board Portfolio consists of the Secretariat and the Canada School of Public Service. The Public Sector Pension Investment Board, the Office of the Commissioner of Lobbying of Canada and the Office of the Public Sector Integrity Commissioner of Canada are arm’s-length organizations that report to Parliament through the President of the Treasury Board.
When working with federal departments, agencies and Crown corporations, the Secretariat plays three central agency roles:
- A leadership role in driving and modelling excellence in public sector management and in identifying and launching government-wide horizontal initiatives that target administrative efficiencies;
- A challenge and oversight role that includes reporting on the government’s management and budgetary performance and developing government-wide management policies and standards; and
- A community enabling role to help organizations improve management performance.
Strategic Outcome and Program Alignment Architecture
In 2013–14, the Secretariat’s Program Alignment Architecture (PAA) included six programs that contributed to the achievement of its Strategic Outcome, “Government is well managed and accountable, and resources are allocated to achieve results.” Detailed information about the Secretariat’s Strategic Outcome and about each program can be found in Section II: Analysis of Programs by Strategic Outcome.
- 1.1 Management Frameworks
- 1.1.1 Strategic Management and Governance
- 1.1.2 Sound Management and Decision Making
- 1.1.3 Service Modernization
- 1.1.4 Information Management, Access and Privacy
- 1.1.5 Management of Information Technology
- 1.1.6 Government Security
- 1.1.7 Communications and Corporate Identity
- 1.1.8 Regulatory Management
- 1.2 People Management
- 1.3 Expenditure Management
- 1.4 Financial Management
- 1.5 Government-Wide Funds and Public Service Employer Payments
- 1.6 Internal Services
Organizational Priorities
In its 2013–14 Report on Plans and Priorities, the Secretariat established four organizational priorities that contribute to its Strategic Outcome.
- Priority 1: Strengthen government financial and expenditure management to support value for money, including ongoing cost-containment and increased operational efficiency;
- Priority 2: Continue to support departments in improving their people management practices, to ensure comprehensive management of compensation and to improve government-wide human resources systems and service delivery;
- Priority 3: Provide leadership in the strategic use of information technology (IT) to enable more efficient and effective delivery of government programs and services; and
- Priority 4: Renew the Secretariat’s workplace to enhance internal efficiency and effectiveness.
The results achieved under each priority are summarized below. Further information on results can be found in the Performance Analysis and Lessons Learned section of each of the Secretariat’s programs in Section II: Analysis of Programs by Strategic Outcome.
| Type1 | Programs |
|---|---|
| Ongoing | |
| Summary of Progress | |
| In 2013–14, the Secretariat:
|
|
| Type | Programs |
|---|---|
| Ongoing | |
| Summary of Progress | |
| In 2013–14, the Secretariat:
|
|
| Type | Programs |
|---|---|
| Ongoing | |
| Summary of Progress | |
| In 2013–14, the Secretariat:
|
|
| Type | Programs |
|---|---|
| Ongoing | Internal Services |
| Summary of Progress | |
| In 2013–14, the Secretariat:
|
|
Risk Analysis
The Secretariat actively monitors its operating environment to identify and manage risks that could affect progress toward strategic outcome and organizational priorities. Key risks are captured in the Secretariat’s Corporate Risk Profile (CRP), which is updated annually.
Risk management is integrated into all aspects of internal operations and is a fundamental element of the Secretariat’s integrated business planning process to support effective decision making, resource allocation and the achievement of results.
Key Risks
| Risk | Risk Response Strategy | Link to Program Alignment Architecture |
|---|---|---|
| 1. Challenges in standardizing and consolidating government-wide systems and processes that are needed to achieve more efficient government administration and greater productivity in the public service. | Developed and completed multiple planned policy instruments, including guidance, standards and directives, in the areas of information technology (IT), information management (IM) and people management. | |
| 2. Inability to effectively adapt to unpredictable changes in the fiscal environment. | Continued to work with departments to proactively identify potential issues and challenges. Assessed departmental practices through the Management Accountability Framework (MAF) to ensure compliance, and provided advice as required. | 1.4 Financial Management |
| 3. Challenges in aligning the Secretariat’s tools and processes to provide the appropriate level of oversight without creating barriers to innovation, productivity and efficiency in government. | Made significant changes to processes such as the MAF to reduce the burden on departments. Worked toward achieving the One-for-One Rule targets to reduce regulatory burden. | 1.1 Management Frameworks |
| 4. Challenges in transforming the Secretariat’s administrative and business processes. | Established clear priorities and allocated resources to planning and governance initiatives, including communications. | 1.6 Internal Services |
| 5. Security of the Secretariat’s data and information. | Focused on the integrity of the Secretariat’s IT systems, including through employee awareness and training activities, and strengthened IM systems. | 1.6 Internal Services |
In 2013–14, the Secretariat identified, assessed, and monitored risks and factors that create uncertainty. The CRP identified five key risks in two broad categories.
Central Agency Risks (risks 1–3)
The Secretariat, as the administrative arm of the Treasury Board, oversees expenditures, budgets, and management policies and initiatives. It is the driver of excellence and accountability within the public service. Risks in this category were driven by external factors such as the increased complexity of whole-of-government systems, the current environment of fiscal restraint and the unintended consequences of change.
The Secretariat’s response to these risks included measures to bolster the Treasury Board policy regime to support IM and IT modernization. The Secretariat also enhanced oversight of IT investment planning and established a government-wide framework to improve the management of IT applications while eliminating redundant applications. Central agency risks were successfully managed by setting clear expectations for departments; reducing unnecessary administrative requirements; strengthening the capacity of functional communities; and improving governance mechanisms related to people management.
Departmental Risks (risks 4–5)
Risks in the second category relate to the internal management and administration of the Secretariat and were driven by its capacity to implement change. Risk factors identified in this category included the need to have the right tools and processes to enable transformation and permit the Secretariat to respond rapidly to emerging issues while ensuring the integrity of data and information systems.
Departmental risks were managed by focusing on information and data as strategic assets for enabling efficiencies and higher productivity. Specifically, to combat cyber threats the Secretariat responded by ensuring the integrity of its IT security systems, strengthening its IM practices and reinforcing public sector values and ethics.
Overall, the Secretariat’s ongoing improvement in the area of risk management can be attributed to its strategies for managing the two broad categories of risks, described above, as well as to its effective monitoring activities.
Actual Expenditures
| Main Estimates | Planned Spending | Total Authorities Available for Use | Actual Spending (authorities used) | Difference (actual minus planned) |
|---|---|---|---|---|
| 5,662,899,768 | 5,662,899,768 | 4,399,919,524 | 2,892,520,949 | -2,770,378,819 |
| Planned | Actual | Difference (actual minus planned) |
|---|---|---|
| 1,847 | 1,834 | -13 |
| Strategic Outcome, Programs and Internal Services | 2013–14 Main Estimates |
2013–14 Planned Spending |
2014–15 Planned Spending |
2015–16 Planned Spending |
2013–14 Total Authorities Available for Use | 2013–14 Actual Spending (authorities used) |
2012–13 Actual Spending (authorities used) |
2011–12 Actual Spending (authorities used) |
|---|---|---|---|---|---|---|---|---|
| Notes: The figures for actual spending in 2011–12 have been restated due to program realignment, as identified in the 2013–14 Report on Plans and Priorities. Any minor numerical differences are due to rounding. |
||||||||
| Strategic Outcome: Government is well managed and accountable, and resources are allocated to achieve results | ||||||||
| Management Frameworks | 53,841,513 | 53,841,513 | 51,725,463 | 51,404,826 | 58,648,770 | 57,875,343 | 58,544,372 | 72,944,230 |
| People Management | 51,859,283 | 51,859,283 | 64,550,201 | 64,786,456 | 58,581,776 | 57,834,089 | 60,974,838 | 65,443,623 |
| Expenditure Management | 32,866,405 | 32,866,405 | 31,791,958 | 31,791,872 | 36,724,338 | 35,573,464 | 31,046,559 | 50,893,368 |
| Financial Management | 32,613,027 | 32,613,027 | 32,235,681 | 32,235,681 | 32,869,903 | 31,291,934 | 30,866,718 | 28,829,749 |
| Government-Wide Funds and Public Service Employer Payments | 5,420,474,397 | 5,420,474,397 | 7,106,195,208 | 6,646,263,604 | 4,124,513,261 | 2,629,221,633 | 2,500,372,808 | 2,192,868,962 |
| Subtotal | 5,591,654,625 | 5,591,654,625 | 7,286,498,511 | 6,826,482,439 | 4,311,338,048 | 2,811,796,463 | 2,681,805,295 | 2,410,979,931 |
| Internal Services Subtotal | 71,245,143 | 71,245,143 | 78,425,603 | 57,988,583 | 88,581,476 | 80,724,486 | 80,220,719 | 93,528,245 |
| Total | 5,662,899,768 | 5,662,899,768 | 7,364,924,114 | 6,884,471,022 | 4,399,919,524 | 2,892,520,949 | 2,762,026,013 | 2,504,508,177 |
The above table provides the Main Estimates, the planned spending, the total authorities available for use, and the actual spending (authorities used) for 2013–14. These amounts are discussed by program in Section II: Analysis of Programs by Strategic Outcome. For comparison purposes, the planned spending is provided for two future years, and the actual spending (authorities used) for two prior years.
Approximately 60 per cent of the planned spending for Government-Wide Funds and Public Service Employer Payments is transferred to, and spent by, other departments and agencies for items such as operating and capital budget carry-forward, severance, parental benefits, and requirements. The Secretariat’s total authorities available for use are reduced accordingly. The most significant difference between planned and actual spending (on average $3 billion per year) relates to the amounts distributed from the corresponding Votes to other organizations; expenditures appear in the operating Votes of these organizations. The balance of funding in this program is for public service employer payments.
Overall, planned spending increased by $1.7 billion from 2013–14 to 2014–15 primarily due to an increase in central Votes (paylist expenditures and operating budget carry-forward) of $1.3 billion and to a statutory item for an actuarial adjustment made in virtue of the Public Service Superannuation Act of $443 million.
Planned spending decreased by $480 million from 2014–15 to 2015–16, mainly due to a reduction of $450 million in paylist expenditures related to severance payments. Following the ratification of 25 new collective agreements between 2010 and 2013, more than 175,000 represented, excluded and unrepresented employees in the core public administration accepted the elimination of severance benefits for voluntary separation. Eliminating these benefits has brought public service compensation more in line with the private sector.
Overall, actual spending increased by $257.5 million from 2011–12 to 2012–13. Actual spending related to public service employer payments increased by $307.5 million, largely as a result of the statutory item noted above, offset by a decrease due to the one-time payment for long-term disability benefits provided under the Service Income Security Insurance Plan. Actual spending for the Secretariat’s operations decreased by $50 million largely as a result of one-time expenditures related to professional service costs; payouts to employees resulting from the revision of specific collective agreements; reductions related to Economic Action Plan 2012 cost-containment measures; project delays; and the deferral of staffing plans.
The increase in actual spending of $130.5 million from 2012–13 to 2013–14 was largely as a result of an increase in disability and health care expenditures and a decrease in revenues from revolving funds and special accounts, related to public service employer payments.
Alignment of Spending With the Whole-of-Government Framework
| Strategic Outcome | Program | Spending Area | Government-Wide Outcome | 2013-14 Actual Spending |
|---|---|---|---|---|
| Government is well managed and accountable, and resources are allocated to achieve results. | 1.1 Management Frameworks | Government Affairs | Well-managed and efficient government operations | 57,875,343 |
| 1.2 People Management | Government Affairs | Well-managed and efficient government operations | 57,834,089 | |
| 1.3 Expenditure Management | Government Affairs | Well-managed and efficient government operations | 35,573,464 | |
| 1.4 Financial Management | Government Affairs | Well-managed and efficient government operations | 31,291,934 | |
| 1.5 Government-Wide Funds and Public Service Employer Payments | Government Affairs | Well-managed and efficient government operations | 2,629,221,633 |
| Spending Area | Total Planned Spending | Total Actual Spending |
|---|---|---|
| Note: The figures above do not include Internal Services. |
||
| Economic Affairs | N/A | N/A |
| Social Affairs | N/A | N/A |
| International Affairs | N/A | N/A |
| Government Affairs | 5,591,654,625 | 2,811,796,463 |
Departmental Spending Trend
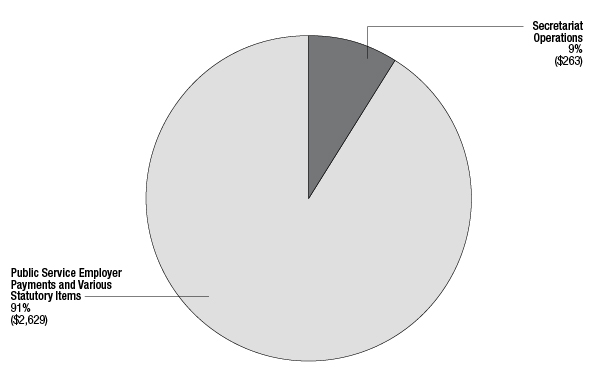
Figure 1. Treasury Board of Canada Secretariat 2013–14 Actual Spending ($ millions) - Text version
This graphic is a pie chart that illustrates the actual spending breakdown of $2.89 billion for the Secretariat in 2013-14. The pie chart is broken down into two spending areas as follows: 9 per cent ($263 million) of total spending is attributed to the Secretariat’s operations, and 91 per cent ($2,629 million) of total spending is attributed to centrally managed funds.
Any minor differences are due to rounding.
The Secretariat spent a total of $2.89 billion toward achieving its strategic outcome. Approximately 9 per cent of total spending was directly related to expenditures for its operations. The remainder related to public service employer payments that the Secretariat manages for the core public administration in its role as the People Management Office.
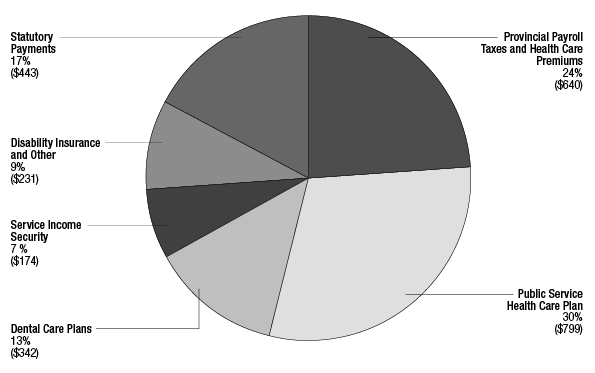
Figure 2. Treasury Board of Canada Secretariat Public Service Employer Payments and Various Statutory Items 2013–14 Actual Spending ($ millions) - Text version
This graphic is a pie chart that illustrates the actual spending breakdown of $2.6 billion under public service employer payments in 2013-14. The pie chart is divided into six spending areas, broken down as follows: 24 per cent is attributed to provincial payroll taxes and health care premiums ($640 million); 30 per cent is attributed to the Public Service Health Care Plan ($799 million); 13 per cent is attributed to dental care plans ($342 million); 7 per cent is attributed to service income security ($174 million); 9 per cent is attributed to disability insurance, and other payments ($231 million); and the remaining 17 per cent is attributed to statutory payments ($443 million).
Any minor differences are due to rounding.
Total spending in 2013–14 for public service employer payments was $2.6 billion. This included payments under 16 public service benefit plans and associated expenditures, and statutory items. The latter include the Secretariat’s employer contributions made under the Public Service Superannuation Act, the Employment Insurance Act and other related acts.
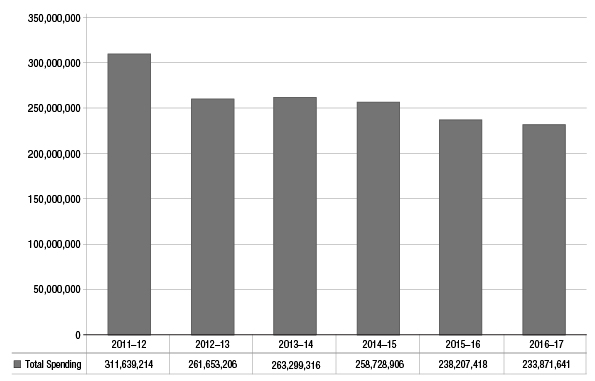
Figure 3. Departmental Operations Spending Trend Graph (dollars) - Text version
This graphic is a bar graph that illustrates the spending trend for Secretariat program expenditures (Vote 1) for actual spending and planned spending, including the statutory items for contributions to employee benefit plans for its own employees, as well as other statutory payments. Financial figures are presented in dollars along the y axis, increasing by increments of $50 million starting at $50 million and ending at $350 million. The financial figures are graphed against fiscal years from 2011–12 to 2016-17 along the x axis.
The graph demonstrates that actual spending decreased from 2011–12 ($311.6 million) to 2012–13 ($261.7 million) and increased in 2013-14 at $263.3 million. The graph also demonstrates that planned spending is expected to decrease each year for the next three fiscal years as follows: from $258.7 million in 2014-15 including $31.6 million in sunset programs to $238.2 million in 2015-16 including $12 million in sunset programs, followed by $233.9 million in 2016-17 including $7.7 million in sunset programs.
The Secretariat’s operating expenditures include salaries, non-salary costs that support its operations, and contributions to employee benefit plans and other statutory items for its own employees.
Decreased spending in 2012–13 compared with the previous year is largely as a result of one-time expenditures for professional services to support the review of departmental spending across government; payouts to employees due to the revision of specific collective agreements; reductions related to Economic Action Plan 2012 cost-containment measures; savings from project delays; and the deferral of staffing plans.
Decreases in program expenditures are expected to continue to 2016–17 due to the implementation of Economic Action Plan 2012 cost-containment measures and the sunsetting of initiatives such as the Workspace Renewal Initiative, the Joint Learning Program, Cyber Security II and the Federal Contaminated Sites Action Plan.
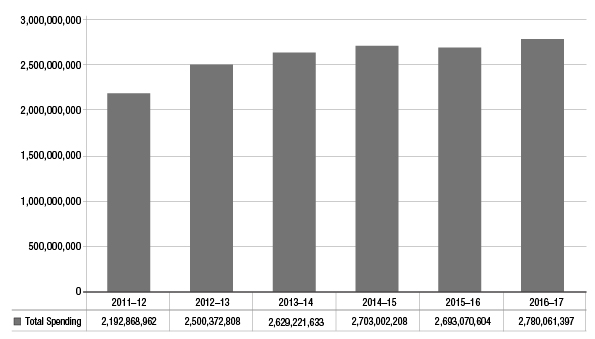
Figure 4. Public Service Employer Payments (Vote 20) and Various Statutory Item – Spending Trend Graph (dollars) - Text version
This graphic is bar graph that illustrates the spending trend for public service insurance (Vote 20) and various statutory items from 2011–12 to 2016-17. Financial figures are presented in dollars along the y axis and are graphed against the fiscal years from 2011-12 to 2016-17 along the x axis.
The graph demonstrates the following:
- Actual spending increased from 2011-12 ($2.2 billion) to 2012-13 ($2.5 billion).
- Actual spending increased from 2012-13 ($2.5 billion) to 2013-14 ($2.6 billion) including sunset program of $918 thousand.
- Actual spending increased from 2013-14 ($2.6 billion) including $918 thousand in sunset program to 2014-15 planned spending ($2.7 billion) including sunset program of $1.6 million.
- Planned spending decreased from 2014-15 ($2.7 billion) to ($2.69 billion) in 2015-16, including $1.9 million in sunset program.
- Planned spending increased from $2.69 billion in 2015-16 to $2.78 billion in 2016-17.
Expenditures for public service employer payments and statutory items represent the employer’s share of contributions required by the insurance plans sponsored by the Government of Canada. These amounts also include statutory items for payments under the Public Service Pension Adjustment Act and employer contributions made under the Public Service Superannuation Act (PSSA), the Employment Insurance Act and related acts.
Public service employer payments increased by $307.5 million from 2011–12 to 2012–13, primarily as a result of a $443-million actuarial adjustment to employer contributions made under the PSSA. The actuarial adjustment, offset by a decrease of $129 million resulting from a one-time payment under the Service Income Security Insurance Plan and a decrease in payroll taxes, is reflected in planned spending each year from 2013–14 to 2016–17.
Expenditures for public service insurance increased by $129 million from 2012–13 to 2013–14 following a premium rate increase for the Disability Insurance Plan; the cessation of a premium holiday for long-term disability insurance under the Royal Canadian Mounted Police Life and Disability Insurance Plan; higher usage of the Public Service Health Care Plan (PSHCP); and a decrease in recoveries of the employer’s share of insurance plans from other government departments related to Special Accounts and Revolving Funds.
Planned spending between 2014–15 and 2016–17 will increase by $77 million largely as a result of an expected rise in PSHCP usage per member, increased unit costs under the Pensioners’ Dental Services Plan and Public Service Dental Care Plan, and higher employer contributions directly related to increases in payroll.
Estimates by Vote
For information on the Secretariat’s organizational Votes and statutory expenditures, consult the Public Accounts of Canada 2014 on the Public Works and Government Services Canada website.