
Treasury Board of Canada Secretariat's Quarterly Financial Report for the Quarter Ended December 31, 2013
Statement Outlining Results, Risks and Significant Changes in Operations, Personnel and Programs
Table of Contents
- 1. Introduction
- 2. Highlights of Fiscal Quarter and Fiscal Year-to-Date
- 3. Risks and Uncertainties
- 4. Significant Changes in Relation to Operations, Personnel and Programs
- 5. Savings measures
- 6. Economic Action Plan 2012 (Budget 2012) Implementation
- 7. Approval by Senior Officials
- Appendix
1. Introduction
This quarterly report has been prepared by management as required by section 65.1 of the Financial Administration Act(FAA) and in the form and manner prescribed by the Treasury Board (TB). This quarterly report should be read in conjunction with the Main Estimates and the Supplementary Estimates A and B as well as Canada’s Economic Action Plan 2012 (Budget 2012).
A summary description of the Treasury Board of Canada Secretariat (Secretariat) program activities can be found in Part II of the Main Estimates.
The quarterly report has not been subject to an independent audit or review.
1.1 Basis of Presentation
This quarterly report has been prepared by management using an expenditure basis of accounting. The accompanying Statement of Authorities includes the Secretariat’s spending authorities granted by Parliament and those used by the department, consistent with the Main Estimates and the Supplementary Estimates A and B for the 2013-14 fiscal year. This quarterly report has been prepared using a special purpose financial reporting framework designed to meet financial information needs with respect to the use of spending authorities.
The authority of Parliament is required before monies can be spent by the Government. Approvals are given in the form of annually approved limits through appropriation acts or through legislation in the form of statutory spending authority for specific purposes.
The Department uses the full accrual method of accounting to prepare and present its annual departmental financial statements that are part of the departmental performance reporting process. However, the spending authorities voted by Parliament remain on an expenditure basis.
As part of the Parliamentary business of supply, the Main Estimates must be tabled in Parliament on or before March 1 preceding the new fiscal year. Budget 2012 was tabled in Parliament on March 29, 2012 after the tabling of the Main Estimates on February 28, 2012. As a result the measures announced in the Budget 2012 could not be reflected in the 2012-13 Main Estimates.
In fiscal year 2012-13, frozen allotments were established by Treasury Board authority in departmental votes to prohibit the spending of funds identified as savings in Budget 2012. In 2013-14, the changes to departmental authorities were reflected in the 2013-14 Main Estimates tabled in Parliament.
1.2 The Secretariat Financial Structure
The Secretariat manages both departmental and government-wide expenditures. Its departmental operating revenues and expenditures are managed under Vote 1, Program Expenditures.
Government-wide expenditures are managed via seven different votes:
- Vote 5, Government Contingencies which serves to supplement other appropriations to provide the Government with sufficient flexibility to meet miscellaneous, urgent or unforeseen departmental expenditures between Parliamentary supply periods;
- Vote 10, Government-Wide Initiatives which supplements other appropriations in support of the implementation of strategic management initiatives in the Public Service of Canada;
- Vote 15, Compensation Adjustments which supplements the appropriations of other government departments and agencies that may need to be partially or fully augmented as a result of adjustments made to terms and conditions of service or employment of the federal public service, including members of the Royal Canadian Mounted Police and the Canadian Forces, Governor in Council appointees and Crown corporations as defined in section 83 of the Financial Administration Act;
- Vote 20, Public Service Insurance which covers revenues and expenses related to Treasury Board’s role as the employer of the core public administration. This includes revenues and expenses for the Public Service Health Care Plan, Public Service Dental Care Plan, Disability Insurance, Provincial Payroll Taxes (Manitoba, Newfoundland, Ontario and Quebec) and other programs;
- Vote 25, Operating Budget Carry Forward which supplements other appropriations for the carry forward of unused operating funds from the previous fiscal year;
- Vote 30, Paylist Requirements which covers paylist requirements for departments and agencies related to legal requirements for the government as employer for items such as parental benefits and severance payments; and
- Vote 33, Capital Budget Carry Forward which supplements other appropriations for the carry forward of unused capital funds from the previous fiscal year. This vote was created in 2011-12.
With the exception of Vote 20, these votes are approved by Parliament for the eventual transfer of funding to other government departments once specified criteria are met. The Secretariat does not incur any revenue or expenses related to these votes and thus they are not reflected in the Statement of Authorities or Planned Spending tables.
The Secretariat also incurs costs under Statutory Authorities, both for departmental and government-wide payments made under legislation approved previously by Parliament, which are not part of the Annual Appropriation Bills. These expenditures mainly reflect the employer’s share of Public Service Pension Plans, the Canada/Quebec Pension Plans, Employment Insurance premiums and Public Service Death Benefits. These expenditures are also initially charged to the accounts of the Secretariat but are eventually attributed to the statutory vote contributions to employee benefit plans of each department and agency, including the Secretariat.
2. Highlights of Fiscal Quarter and Fiscal Year-to-Date
This section highlights the significant items that contributed to the net increase or decrease in authorities available for the year and actual expenditures for the quarter ended December 31, 2013.
Statement of Authorities - Vote 1, Program Expenditures
The Program Expenditure Authorities decreased by $23.7 million from the fiscal year 2012-13 to 2013-14, or by 9%. The change is mainly due to the net effect of the factors below:
- Total decreases of $29.2 million in funding requirements in 2013-14 related to Budget announcements and key initiatives including:
- $10.2 million reduction in specific initiatives which have ended or are yet to be renewed - Classification Program ($4 million), and Modernization of Human Resources Data and Systems ($6.2 million);
- $7.4 million reduction in funding as part of the Economic Action Plan 2012;
- $5.3 million received from Treasury Board Secretariat Central Votes by Q3 in
2012-13 but not received as of Q3 in 2013-14 (Paylist Expenditures); - $2.9 million transferred to Other Government Departments including Public Works and Government Services Canada for the remaining activities related to the finalization of the human resource application, and Industry Canada for the Canadian Open Data Experience Challenge;
- $1.5 million reduction in funding as part of the 2010 Strategic Review;
- $1.2 million reduction in funding due to the transfer of the US-Canada Regulatory Cooperation Council to the Privy Council Office;
- Other miscellaneous decreases totaling $0.7 million.
- These decreases were offset by an increase in funding of $5.5 million comprised of:
- $2.8 million for the Workspace Renewal Initiative;
- $2.2 million for the incremental compensation associated with the recently signed collective agreements;
- Other increases totaling $0.5 million.
The Vote 1 expenditures to December 31, 2013 have increased by approximately $6.6 million or 4% when compared to the same period in fiscal year 2012-13. This is due to the following:
- $2.9 million for the Workspace Renewal Initiative, departmental investments, and licenses;
- $2.8 million for payment of claims for legal settlements;
- $0.9 million for personnel. This includes one-time severance payments of $5.9 million offset by an ongoing reduction in personnel expenditures of $5.0 million.
Graph 1 outlines the Net Budgetary Authorities for Vote 1, Program Expenditures, which represent the resources available for use for the year (blue bar) as well as the year-to-date expenditures (red bar).
Graph 1: Comparison of Net Budgetary Authorities and Expenditures for Vote 1 as of December 31, for fiscal years 2012-13 and 2013-14.
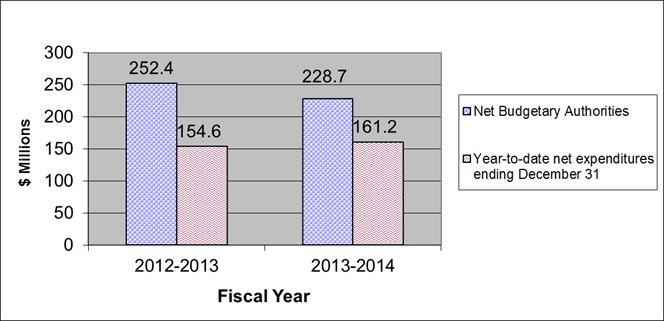
| Vote 1 (in millions $) | 2012-2013 | 2013-2014 |
|---|---|---|
| Net Budgetary Authorities | 252.4 | 228.7 |
| Year-to-date expenditures ending December 31 | 154.6 | 161.2 |
Statement of Authorities - Vote 20, Public Service Insurance
Public Service Insurance Payments include the employer share of the Public Service Health Care Plan (PSHCP), the largest such plan in Canada, as well as other benefit plans and provincial payroll taxes.
There was a small decrease in Vote 20 Authorities of $9 million from 2012-13 to 2013-14 mainly due to the 2008 Strategic Review.
The Vote 20 net expenditures have increased by $86 million, or 5.9%, when compared to the same period in 2012-13. This is comprised of the following increases:
- $31.6 million attributed to the Pensioners’ Dental Services Plan, Public Service Health Care Plan, and the Public Service Dental Plan. This includes $7 million for the Pensioners’ Dental Service Plan due to higher plan membership and increases to provincial dental fee rates that came into effect on January 1, 2013;
- $22.4 million in Provincial Payroll Taxes which is attributable to the ongoing workforce adjustment in the Public Service;
- $14.6 million for Quebec taxes on Insurance Premiums ($12.1 million due to timing differences and $2.5 million due to increases in plan expenditures);
- $12.1 million for the RCMP Life and Disability Insurance Plan. The increase reflects the end of the premium holiday in December 2012 under the long-term disability insurance line;
- $14.1 million reduction in revenues; and
- $7.5 million related to the Disability Insurance Plan as a result of a 20% premium rate increase effective February 1, 2013 ($24 million decrease due to timing differences and $31.5 million due to increases in plan expenditures).
The increases noted above are offset by the following net decreases:
$16.3 million for the Public Service Management Insurance Plan, the Service Income Security Insurance Program, and other insurance and benefit plans (a $19.3 million decrease attributed to timing differences offset by a $3 million increase in plan expenditures).
Graph 2 outlines the Net Budgetary Authorities for Vote 20, Public Service Insurance, which represent the resources available for use for the year (blue bar) as well as year-to-date expenditures (red bar).
Graph 2: Comparison of Net Budgetary Authorities and Expenditures for Vote 20 as of December 31, for fiscal years 2012-13 and 2013-14.
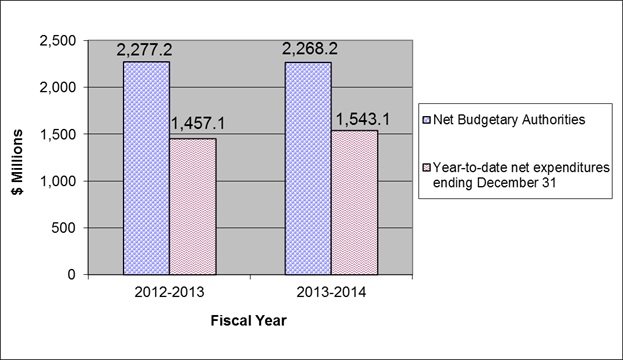
| Vote 20 (in millions $) | 2012-2013 | 2013-2014 |
|---|---|---|
| Net Budgetary Authorities | 2,277.2 | 2,268.2 |
| Year-to-date expenditures ending December 31 | 1,457.1 | 1,543.1 |
Statement of Authorities - Statutory Authorities
Statutory Authorities, which reflect the Secretariat’s share of pension and related benefits, have increased by $440.8 million when compared to the same period of 2012-13. The increase is due to the addition of a statutory item for employer contributions made under the Public Service Superannuation Act (PSSA). A recent evaluation of the Public Service Pension Plan identified a need for additional funding of $443 million to address the actuarial deficits in the Public Service Pension Fund. This funding is required for a period of thirteen years beginning in 2012-13. The next triennial actuarial evaluation could however change the figure for 2015-16 and beyond.
The Secretariat Statutory Authorities expenditures have a large credit balance at the end of the third quarter in both fiscal years. This is due to the timing of flow-through payments to Public Works and Government Services Canada (PWGSC) primarily related to employer contributions made under the PSSA, and is not reflective of any forecasted annual decrease. The Secretariat receives the employee contribution of the pension payments from Government departments and agencies and then transfers them to PWGSC to fund the PSSA. The net effect on the financial statements of the Secretariat will be zero at year-end.
Graph 3 outlines the Net Budgetary Authorities as well as actual expenditures for the Secretariat’s Statutory Authorities.
Graph 3: Comparison of Net Budgetary Authorities and Expenditures for Statutory Authorities as of December 31, for fiscal years 2012-13 and 2013-14
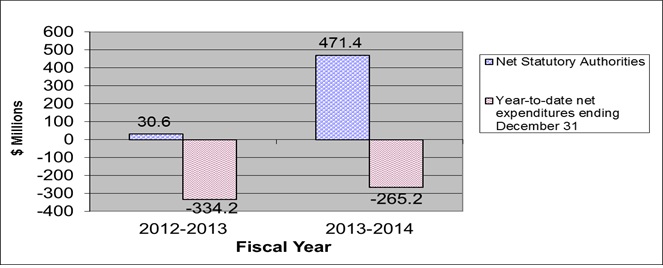
| Statutory Authorities (in millions $) | 2012-13 | 2013-14 |
|---|---|---|
| Net Budgetary Authorities | 30.6 | 471.4 |
| Year-to-date net expenditures ending September 30 | -334.2 | -265.2 |
Statement of Departmental Budgetary Expenditures by Standard Object
This section elaborates on variances in expenditures for Vote 1, Vote 20 and Statutory Authorities by standard object in order to explain changes in spending trends from the same quarter the previous fiscal year.
Year-to-date personnel expenditures have increased by $145 million resulting from an increase of $75.1 million in Vote 20, $69 million in Statutory Authorities and $0.9 million in Vote 1.
- The $75.1 million increase in Vote 20 personnel expenditures are detailed below:
- $33.5 million attributed to the Public Service Health Care Plan, Pensioners’ Dental Services Plan, and the Public Service Dental Plan;
- $22.4 million for Provincial Payroll Taxes which is attributable to the ongoing workforce adjustment in the Public Service;
- $15 million for Quebec Taxes on Insurance Premiums which is mainly related to accounting and timing issues;
- $12.1 million for the RCMP Life and Disability insurance benefit due to the end of the premium holiday in December 2012;
- $7.5 million related to the Disability Insurance plan as a result of a 20% premium rate increase effective February 1, 2013; and
- $0.3 million for Provincial Health Plan Premiums and other insurance and benefit plans.
- The $69 million increase in Statutory expenditures is related to the:
- $44.6 million decrease in recoveries due to timing differences;
- $26.2 million increase of pension contributions for periods of leave without pay, contributions for buying back service, contributions for regular employees and new contributions since January 2013;
- $1.8 million decrease as a result of reductions in salary expenses and the decrease in the EBP contribution rate.
- The $0.9 million increase in personnel expenditures for Vote 1 is mainly due to:
- one-time severance payments of $5.9 million pursuant to collective agreements eliminating future severance pay accumulation for voluntary departure or retirement, offset by
- $5 million in salary reductions as a result of a reduced workforce.
Year to date revenues for centrally managed items have decreased by $9 million mainly due to a reduction in revenues for special accounts and revolving funds offset by an increase in revenues for Pensioners Service Dental Plan and the Public Service Health Care Plan.
There were no significant variances to report in the other standard objects.
3. Risks and Uncertainties
The Secretariat maintains a Corporate Risk Profile which identifies and assesses high-level risks that could affect the achievement of the Secretariat objectives and priorities. Similar to most organizations, certain risks could have financial impacts should they materialize. Response strategies have been developed and measures are in place to minimize their likelihood. For example, in a context where the pace and complexity of efforts to standardize and consolidate back-office systems poses some challenge and risk, the Secretariat continues to focus on ensuring that appropriate policies, frameworks, tools and guidance are in place to support more efficient enterprise-wide approaches and operational savings.
The Secretariat is addressing reduced flexibility to its operating budget as a result of the expenditure restraint measures reported in the Economic Action Plan 2012 ($9.3 million in 2013-14), the 2010 Strategic Review reported in Budget 2011 ($1.5 million in 2013-14). The Secretariat is managing the implementation of these measures through reduced budget allocations to sectors and supported by rigorous monitoring of staffing and expenditures against financial and human resources targets.
As the Public Service Heath Care Plan is driven by many variables, there could be significant shifts from the budget in a given year as a result of changes in: plan membership, the cost of drugs and medical treatments, use of plan entitlements and provincial tax regulations. The Secretariat continues to closely monitor payment activity and trends.
4. Significant Changes in Relation to Operations, Personnel and Programs
This section highlights significant changes which impact the expenditures or approved resources available for the year or have impacted actual expenditures for the quarter ended
December 31, 2013.
Since the release of Budget 2012, the Secretariat has been implementing measures to increase efficiency and reduce expenditures in the department, as part of the Government’s efforts to reduce the deficit.
These measures are changing the way the Secretariat works. Through the creation of pooled administrative support services; delayering management levels; the increased use of risk-based delegations to ministers and departments; the more extensive use of expertise and experience in departments and agencies to guide, implement and monitor policies; and greater use and pooling of data and electronic publications, the Secretariat is reducing its operating costs and adjusting the organization of work.
To achieve the ongoing savings, the Secretariat has eliminated 178 positions across the department. As people retired or left the Secretariat, or as work was reorganized, vacancies were effectively managed to reduce the number of potentially affected employees.
5. Savings Measures
As a result of the 2010 Strategic Review reported in Budget 2011, the Secretariat found savings totaling $11.5 million, leading to the elimination of 84 positions (these positions are separate from the 178 positions eliminated as a result of Budget 2012) over three years (see page 230 of Budget 2011), starting in fiscal year 2011-12. Through this review, opportunities were identified to better align activities with core roles and to achieve internal efficiencies, and to cease operation of the Regional Communications Network located across Canada. The Secretariat has fully implemented its 2013-14 and on-going savings target of $11.5 million as laid out in the 2010 Strategic Review results.
6. Economic Action Plan 2012 (Budget 2012) Implementation
This section provides an overview of the savings measures announced in Budget being implemented in order to modernize government and programs, make it easier for Canadians and businesses to interact with government, and reduce back-office inefficiencies.
The Secretariat will achieve Budget 2012 savings of $23.6 million by the end of fiscal year 2014-15 by implementing efficiency measures and program reductions that align resources to its core mandate, transforming internal processes, and by streamlining and focusing internal operations. With these changes the Secretariat will focus on supporting management excellence and accountability across government.
In the first year of implementation, the Secretariat reference levels were reduced by approximately $7.6 million. Specifically, savings were achieved in 2012-13 by eliminating the Internal Audit Human Resource Management Framework ($3.2 million, including the employee benefit plan, (EBP) and the Financial Interoperability and Stewardship Initiative ($1.6 million); as well as reductions to the Departmental Audit Software Initiative ($1.5 million) and other miscellaneous savings. These savings will increase to $15.1 million in 2013-14 and will result in ongoing savings of $23.6 million by 2014-15.
There is a variance of $7.4 million in the Secretariat’s authorities between the third quarter of fiscal year 2012-13 and the third quarter of 2013-14 related to Budget 2012 initiatives.
Certain funding initiatives which have met project objectives will be eliminated in 2013-2014, such as:
- $2.47 million in savings by standardizing internal service delivery. Service improvements include consolidating publishing services, moving to a single financial software, standardizing work tools including printers, scanners and photocopiers, implementing HR service standards, and reducing internal communications services.
- $2.4 million in savings by eliminating redundancies in various administrative and corporate functions and centralizing processes in the areas of people management, expenditure management and corporate support, as well as reducing the number of EXs throughout the Secretariat thereby reducing executive overhead and their administrative support teams.
- $2.1 million for the Departmental Audit Software Initiative as program objectives have been achieved and work can be undertaken by departments and agencies without Secretariat funding.
- $1.1 million in savings achieved by transforming government-wide Information Management and Information Technology (IMIT) focusing on stewardship, policy, and IMIT horizontal initiatives that have a cross-government impact.
- $0.68 million in savings by modernizing the provision of policy support and advice to departments and agencies, leveraging existing community networks and making more systematic use of readily available collaborative Web 2.0 tools.
- $0.56 million reduction achieved by transforming strategic support to Treasury Board Ministers and Departments by: moving towards electronic formats for reports in order to make information available to Parliament and to Canadians in a more cost-effective, timely and efficient manner; streamlining oversight and accountability by consolidating the Management Accountability Framework; and, increasing delegation to deputy heads.
In addition to the reduction in authorities, expenditures to date have also decreased by approximately $3 million.
The balance of the 2013-14 Budget 2012 savings will be reflected in the Public Accounts for 2013-14 in the fall.
7. Approval by Senior Officials
Approved by,
Yaprak Baltacıoğlu, Secretary
Christine Walker, Chief Financial Officer
Ottawa, Canada
Date:
Appendix
For the quarter ended Dec 31, 2013
| Fiscal year 2012-2013 | Fiscal year 2013-2014 | |||||
|---|---|---|---|---|---|---|
| Planned expenditures for the year ending March 31, 20131 | Expended during the quarter ended Dec 31, 2012 | Year to date used at quarter-end | Planned expenditures for the year ending March 31, 2014 | Expended during the quarter ended Dec 31, 2013 | Year to date used at quarter-end | |
| 1 Planned expenditures does not reflect measures announced in Budget 2012 | ||||||
| 2 Government-Wide Expenses include Vote 20 and $20,000 statutory for Public Service Pension Adjustment Act | ||||||
| Expenditures: | ||||||
|
1 Personnel
|
2,930,591,028 | 535,169,095 | 1,514,711,657 | 3,354,681,612 | 467,935,357 | 1,659,707,806 |
|
2 Transportation and communications
|
6,173,413 | 515,965 | 1,526,301 | 3,495,388 | 496,355 | 1,082,751 |
|
3 Information
|
814,489 | 131,783 | 271,767 | 506,926 | 110,938 | 295,095 |
|
4 Professional and special services
|
61,469,722 | 20,386,173 | 44,876,527 | 55,480,286 | 22,000,673 | 48,187,680 |
|
5 Rentals
|
1,250,902 | 283,875 | 986,880 | 1,098,807 | 329,949 | 1,983,416 |
|
6 Repair and maintenance
|
2,488,240 | 43,559 | 667,149 | 1,256,362 | 98,244 | 288,480 |
|
7 Utilities, materials and supplies
|
2,150,839 | 147,876 | 475,876 | 1,092,025 | 100,365 | 341,546 |
|
9 Acquisition of machinery and equipment
|
6,903,512 | 205,995 | 950,979 | 10,013,559 | 256,197 | 1,243,799 |
|
10 Transfer payments
|
520,000 | 310 | 352,089 | 520,000 | 101,169 | 457,104 |
|
12 Other subsidies and payments
|
6,096,617 | 631,123 | 2,670,537 | 4,813,740 | 3,426,989 | 5,694,179 |
|
Total gross budgetary expenditures
|
3,018,458,762 | 557,515,754 | 1,567,489,762 | 3,432,958,705 | 494,856,237 | 1,719,281,858 |
| Less Revenues netted against expenditures: | ||||||
|
Vote Netted Revenues (VNR) - Centrally managed items
|
-445,197,000 | -106,342,504 | -284,605,445 | -450,980,664 | -99,936,185 | -275,605,046 |
|
Vote Netted Revenues (VNR) - Program expenditures
|
-13,044,094 | -2,206,500 | -5,414,149 | -13,680,699 | -1,188,345 | -4,569,110 |
|
Total Revenues netted against expenditures
|
-458,241,094 | -108,549,004 | -290,019,594 | -464,661,363 | -101,124,531 | -280,174,156 |
| Total net budgetary expenditures | 2,560,217,668 | 448,966,750 | 1,277,470,167 | 2,968,297,342 | 393,731,706 | 1,439,107,701 |
| 2,560,217,668 | 2,968,297,342 | |||||
| Note 1 | ||||||
| Government-Wide Expenses included above2 | ||||||
|
1 Personnel
|
2,719,958,397 | 484,075,222 | 1,359,840,631 | 2,717,742,061 | 417,773,601 | 1,505,837,216 |
|
2 Transportation and communications
|
3,991 | 12,909 | 60 | 11,634 | ||
|
4 Professional and special services
|
9,886,405 | 22,794,920 | 10,736,088 | 24,249,729 | ||
|
5 Rentals
|
0 | 0 | 0 | 1,995 | ||
|
10 Transfer payments
|
520,000 | 310 | 352,089 | 520,000 | 1,169 | 353,504 |
|
12 Other subsidies and payments
|
1,958,171 | 902,051 | 1,563,972 | 918,264 | 947,049 | 2,029,218 |
| Total | 2,722,436,568 | 494,867,979 | 1,384,564,521 | 2,719,180,325 | 429,457,967 | 1,532,483,296 |
| Fiscal year 2012-2013 | Fiscal year 2013-2014 | |||||
|---|---|---|---|---|---|---|
| Total available for use for the year ending March 31, 20133 | Used during the quarter ended Dec 31, 2012 | Year to date used at quarter-end | Total available for use for the year ending March 31, 20144 | Used during the quarter ended Dec 31, 2013 | Year to date used at quarter-end | |
| 3 Includes only Authorities available for use and granted by Parliament at quarter-end | ||||||
| 4 Includes only Authorities available for use and granted by Parliament at quarter-end | ||||||
| Vote 1 - Program Expenditures | 252,419,064 | 52,801,516 | 154,591,815 | 228,709,442 | 57,189,877 | 161,169,308 |
| Vote 20 - Public Service Insurance | 2,277,219,568 | 523,626,721 | 1,457,120,013 | 2,268,179,661 | 459,553,377 | 1,543,148,723 |
| Statutory Authorities | ||||||
|
A111 - President of the Treasury Board - Salary and motor car allowance
|
77,516 | 19,379 | 58,137 | 79,102 | 19,675 | 59,025 |
|
A140 - Contributions to employee benefit plans
|
30,481,520 | 7,620,380 | 22,861,140 | 28,309,137 | 7,000,373 | 21,001,118 |
|
A145 - Unallocated employer contributions made under the PSSA and other retirement acts and the Employment Act (EI)
|
-135,118,300 | -357,183,484 | 443,000,000 | -130,057,669 | -286,350,575 | |
|
A681 - Payments under the Public Service Pension Adjustment Act
|
20,000 | 310 | 943 | 20,000 | 2 | 3 |
|
A683 - Payments for the pay equity settlement pursuant to section 30 of the Crown Liability and Proceedings Act
|
16,744 | 21,605 | 26,072 | 80,099 | ||
| Total Statutory Authorities | 30,579,036 | -127,461,487 | -334,241,660 | 471,408,239 | -123,011,548 | -265,210,330 |
| Total authorities | 2,560,217,668 | 448,966,750 | 1,277,470,168 | 2,968,297,342 | 393,731,706 | 1,439,107,701 |