
Info Source Bulletin 37B - Federal Court Decision Summaries
Access to Information Act and Privacy Act 2013–2014
Table of Contents
Introduction
The Bulletin on Statistical Reporting is an annual compilation of statistical information about requests made under the Access to Information Act and the Privacy Actto federal institutions.
The Access to Information Act and the Privacy Act both came in to effect on July 1, 1983.
Section 70(1)(c.1) of the Access to Information Act assigns responsibility to the President of the Treasury Board, as the designated Minister, to collect statistics on an annual basis for the purpose of assessing compliance with the provisions of the Act.
Similarly, the President of the Treasury Board, as designated Minister, issues policy instruments and prescribed forms to support the Acts. Two such forms are the Statistical Report on the Access to Information Act and the Statistical Report on the Privacy Act, which are used to collect statistics annually for the purpose of assessing compliance.
The tables and figures that follow summarize the combined results of all institutions subject to the Access to Information Act and the Privacy Act that submitted reports for 2013‒14. Cumulative information from 1983 to 2014 is also presented.
Treasury Board of Canada Secretariat found certain reporting errors in the Access to Information Statistical Reporting 37B, 2013-14. These errors have since been resolved and an updated Bulletin is now posted.
Access to Information Act Statistics
The following is the collection of tables and figures that offer insights regarding requests made under the Access to Information Act and completed during the period April 1, 2013, to March 31, 2014. These figures are based on the statistical reports provided by government institutions subject to the Access to Information Act.
Requests Under the Access to Information Act: 2013–14
| Requests Under the Access to Information Act | Number of Requests |
|---|---|
| Received during 2013–14 reporting period | 60,105 |
| Outstanding from 2012–13 reporting period | 9,545 |
| Total | 69,650 |
| Closed during 2013–14 period | 58,475 |
| Carried over to 2014–15 reporting period | 11,175 |
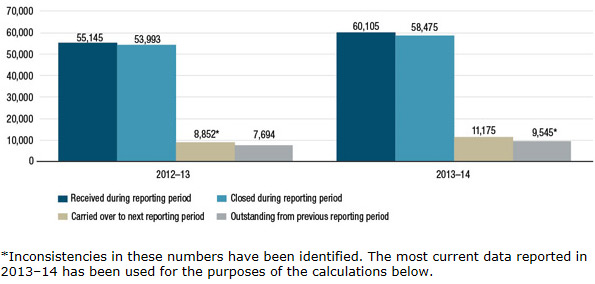
Figure 1: Requests Received Under the Access to Information Act: Comparison of 2012–13 and 2013–14 – Text version
This table compares the category of requestor for the 2012–2013 reporting period with 2013–2014.
| Requests under the Access to Information Act | 2012-13 | 2013-14 |
|---|---|---|
| Received during reporting period | 55,145 | 60,105 |
| Closed during reporting period | 53,993 | 58,475 |
| Carried over to next reporting period | 8,852 See footnote * | 11,175 |
| Outsatnding from previous reporting period | 7,694 | 9,545 See footnote * |
* Inconsistencies in these numbers have been identified. The most current data reported in 2013–14 has been used for the purposes of the calculations below.
The preceding figure depicts a 9% increase in Access to Information Act requests received in the 2013–14 reporting period as compared with the previous year. It also shows that, of the 69,650 requests to be processed, 84% of requests were completed. This a slight decrease of 2% when compared to the previous year.
| Source | Number of Requests |
|---|---|
| Business (private sector) | 23,129 |
| Public | 23,723 |
| Media | 8,421 |
| Organization | 2,898 |
| Academia | 1,934 |
| Total | 60,105 |
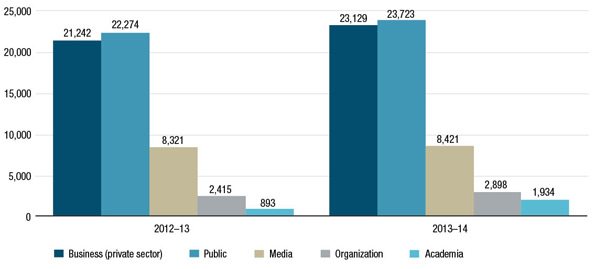
Figure 2: Source of Access to Information Act Requests Received: Comparison of 2012–13 and 2013–14 – Text version
This table compares the category of requestor for the 2012–2013 reporting period with 2013–2014.
| Category of requestor | 2012–13 | 2013–14 |
|---|---|---|
| Business | 21,242 | 23,129 |
| Public | 22,274 | 23,723 |
| Media | 8,321 | 8,421 |
| Organizations | 2,415 | 2,898 |
| Academics | 893 | 1,934 |
| Disposition of Requests Completed | Requests as Percentage | Number of Requests | ||
|---|---|---|---|---|
| 2012–13 | 2013–14 | 2012–13 | 2013–14 | |
| All disclosed | 21.6 | 26.8 | 11,681 | 15,684 |
| Disclosed in part | 52.8 | 50 | 28,534 | 29,250 |
| All exempted | 1.1 | 1.2 | 602 | 679 |
| All excluded | 0.5 | 0.9 | 278 | 521 |
| No records exist | 11.8 | 10.5 | 6,390 | 6,143 |
| Request transferred | 0.6 | 0.7 | 304 | 436 |
| Request abandoned | 9.7 | 7.7 | 5,256 | 4,520 |
| Treated informally Table note * | 1.8 | 2.1 | 948 | 1,242 |
| Total | 100.0 | 100.0 | 53,993 | 58,475 |
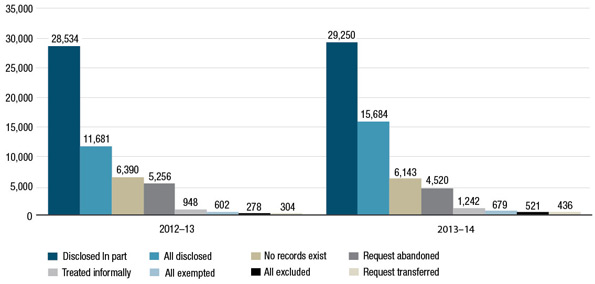
Figure 3: Disposition of Access to Information Act Requests Completed: Comparison of 2012–13 and 2013–14 – Text version
This table compares the disposition of completed requests for the 2012‒2013 reporting period with 2013‒2014.
| Disposition of Requests Completed | 2012‒2013 | 2013‒2014 |
|---|---|---|
| Disclosed in part | 28,534 | 29,250 |
| All disclosed | 11,681 | 15,684 |
| No records exist | 6,390 | 6,143 |
| Request abandoned | 5,256 | 4,520 |
| Treated informally | 948 | 1,242 |
| All exempted | 602 | 679 |
| All excluded | 278 | 521 |
| Request transferred | 304 | 436 |
| Completion Time | Requests as Percentage | Number of Requests | ||
|---|---|---|---|---|
| 2012–13 | 2013–14 | 2012–13 | 2013–14 | |
| 0 to 30 days | 64.8 | 61 | 34,997 | 35,653 |
| 31 to 60 days | 17.3 | 18 | 9,331 | 10,522 |
| 61 to 120 days | 9.8 | 10.4 | 5,294 | 6,053 |
| 121 to 180 days | 3.4 | 3.8 | 1,847 | 2,227 |
| 181 to 365 days | 2.8 | 4.9 | 1,542 | 2,892 |
| More than 365 days | 1.8 | 1.9 | 982 | 1,128 |
| Total | 100.0 | 100.0 | 53,993 | 58,475 |
The preceding table reveals a 1.9% increase in the number of requests that were completed in the first 30 days after they were received and a 4.7% increase in the completion of requests within a 181 to 365-day time period. The data reflects all requests completed, including requests for which extensions were required.
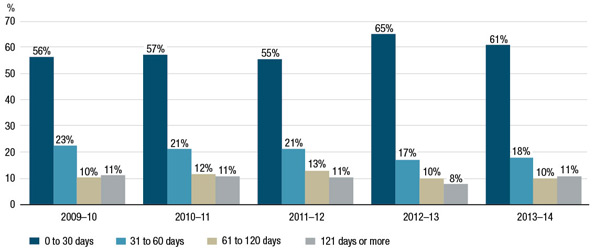
Figure 4: Five-Year Comparison of Time Required to Complete Access to Information Act Requests According to Time Period – Text version
This table compares the time required to complete requests according to time periods for the last 5 years between 2009–2014. Data is shown in percentages.
| Completion Time | 2009-10 | 2010-11 | 2011-12 | 2012-13 | 2013-14 |
|---|---|---|---|---|---|
| 0 to 30 days | 56% | 57% | 55% | 65% | 61% |
| 31 to 60 days | 23% | 21% | 21% | 17% | 18% |
| 61 to 120 days | 10% | 12% | 13% | 10% | 10% |
| 121 days or more | 11% | 11% | 11% | 8% | 11% |
| Disposition of Requests (including requests for which extensions were required) | Completion Time | ||||||
|---|---|---|---|---|---|---|---|
| 0 to 30 Days | 31 to 60 Days | 61 to 120 Days | 121 to 180 Days | 181 to 365 Days | More Than 365 Days | Total | |
| All disclosed | 11,267 | 3,107 | 852 | 176 | 252 | 30 | 15,684 |
| Disclosed in part | 13,984 | 6,407 | 4,361 | 1,661 | 2,012 | 825 | 29,250 |
| All exempted | 340 | 88 | 103 | 44 | 82 | 22 | 679 |
| All excluded | 163 | 146 | 78 | 64 | 64 | 6 | 521 |
| No records exist | 4,888 | 468 | 442 | 83 | 227 | 35 | 6,143 |
| Request transferred | 424 | 3 | 5 | 2 | 2 | 0 | 436 |
| Request abandoned | 3,417 | 251 | 205 | 189 | 251 | 207 | 4,520 |
| Treated informally | 1,170 | 52 | 7 | 8 | 2 | 3 | 1,242 |
| Total number of requests | 35,653 | 10,522 | 6,053 | 2,227 | 2,892 | 1,128 | 58,475 |
| Total as percentage | 61% | 18% | 10.4% | 3.8% | 4.9% | 1.9% | 100.0% |
The preceding table shows that 61% of the Access to Information Act requests were completed within the initial statutory deadline of 30 days.
| Disposition of Requests | Number of Pages Processed | Number of Pages Disclosed | Number of Requests |
|---|---|---|---|
| All disclosed | 1,129,242 | 1,052,434 | 15,684 |
| Disclosed in part | 6,326,261 | 4,098,946 | 29,250 |
| All exempted | 5,208,956 | 36 | 679 |
| All excluded | 62,914 | 0 | 521 |
| Request abandoned | 353,264 | 107,084 | 4,520 |
| Total | 13,080,637 | 5,258,500 | 50,654 |
| Disposition | Consultation Required | Assessment of Fees | Legal Advice Sought | Other | Total |
|---|---|---|---|---|---|
| All disclosed | 704 | 149 | 32 | 9,410 | 10,295 |
| Disclosed in part | 6,036 | 740 | 234 | 16,719 | 23,729 |
| All exempted | 241 | 21 | 19 | 73 | 354 |
| All excluded | 231 | 8 | 1 | 55 | 295 |
| Request abandoned | 286 | 477 | 11 | 553 | 1,327 |
| Total | 7,498 | 1,395 | 297 | 26,810 | 36,000 |
| Number of Requests Closed Past the Statutory Deadline or Not Within the Time Frame Covered by an Extension (deemed refusal) | Principal Reason | |||
|---|---|---|---|---|
| Workload | External Consultation | Internal Consultation | Other Table note * | |
| 8,197 | 6,106 | 694 | 676 | 721 |
| Status of Requests Closed | Requests as Percentage | Number of Requests | ||
|---|---|---|---|---|
| 2012–13 | 2013–14 | 2012–13 | 2013–14 | |
| Closed within the statutory deadline including extensions | 89.3 | 86.0 | 48,231 | 50,278 |
| Closed in deemed refusal | 10.7 | 14.0 | 5,762 | 8,197 |
| Total | 100.0 | 100.0 | 53,993 | 58,475 |
| Length of Extensions Footnote 4 | 9(1)(a) Interference With Operations | 9(1)(b) Consultation | 9(1)(c) Third-Party Notice | |
|---|---|---|---|---|
| Section 69 | Other Footnote 5 | |||
| 30 days or less | 2,338 | 25 | 674 | 159 |
| 31 to 60 days | 2,656 | 70 | 1,171 | 1,106 |
| 61 to 120 days | 1,816 | 420 | 1,415 | 340 |
| 121 to 180 days | 194 | 358 | 1,412 | 74 |
| 181 to 365 days | 163 | 94 | 407 | 94 |
| 365 days or more | 18 | 3 | 25 | 34 |
| Total | 7,185 | 970 | 5,104 | 1,807 |
Exemptions Applied Under the Access to Information Act
| Provision | Number of Requests |
|---|---|
| 13(1)(a) | 1,200 |
| 13(1)(b) | 338 |
| 13(1)(c) | 632 |
| 13(1)(d) | 283 |
| 13(1)(e) | 21 |
| Total | 2,474 |
| Provision | Number of Requests |
|---|---|
| 14(a) | 660 |
| 14(b) | 331 |
| Total | 991 |
| Provision | Number of Requests |
|---|---|
| 15(1) International Affairs | 2,354 |
| 15(1) Defence | 1,480 |
| 15(1) Subversive activities | 7,302 |
| Total | 11,136 |
| Provision | Number of Requests |
|---|---|
| 16(1)(a)(i) | 601 |
| 16(1)(a)(ii) | 380 |
| 16(1)(a)(iii) | 132 |
| 16(1)(b) | 651 |
| 16(1)(c) | 4,371 |
| 16(1)(d) | 119 |
| 16(2)(a) | 189 |
| 16(2)(b) | 25 |
| 16(2)(c) | 1,294 |
| 16(3) | 4 |
| 16.1(1)(a) | 26 |
| 16.1(1)(b) | 10 |
| 16.1(1)(c) | 49 |
| 16.1(1)(d) | 13 |
| 16.2(1) | 49 |
| 16.3 | 14 |
| 16.4(1)(a) | 5 |
| 16.4(1)(b) | 1 |
| 16.5 | 13 |
| Total | 7,946 |
| Provision | Number of Requests |
|---|---|
| 17 | 169 |
| Total | 169 |
| Provision | Number of Requests |
|---|---|
| 18(a) | 292 |
| 18(b) | 473 |
| 18(c) | 17 |
| 18(d) | 331 |
| 18.1(1)(a) | 51 |
| 18.1(1)(b) | 25 |
| 18.1(1)(c) | 1 |
| 18.1(1)(d) | 137 |
| Total | 1,327 |
| Provision | Number of Requests |
|---|---|
| 19(1) | 20,702 |
| Total | 20,702 |
| Provision | Number of Requests |
|---|---|
| 20(1)(a) | 233 |
| 20(1)(b) | 2,407 |
| 20(1)(b.1) | 47 |
| 20(1)(c) | 1,973 |
| 20(1)(d) | 642 |
| 20.1 | 5 |
| 20.2 | 0 |
| 20.4 | 1 |
| Total | 5,308 |
| Provision | Number of Requests |
|---|---|
| 21(1)(a) | 3,938 |
| 21(1)(b) | 4,224 |
| 21(1)(c) | 1,259 |
| 21(1)(d) | 570 |
| Total | 9,991 |
| Provision | Number of Requests |
|---|---|
| 22 | 326 |
| 22.1(1) | 38 |
| Total | 364 |
| Provision | Number of Requests |
|---|---|
| 23 | 2,248 |
| Total | 2,248 |
| Provision | Number of Requests |
|---|---|
| 24(1) | 2,019 |
| Total | 2,019 |
| Provision | Number of Requests |
|---|---|
| 26 | 128 |
| Total | 128 |
Exclusions Applied Under the Access to Information Act
| Provision | Number of Requests |
|---|---|
| 68(a) | 533 |
| 68(b) | 26 |
| 68(c) | 2 |
| 68.1 | 73 |
| 68.2(a) | 68 |
| 68.2(b) | 67 |
| Total | 769 |
| Provision | Number of Requests |
|---|---|
| 69(1)(a) | 203 |
| 69(1)(b) | 8 |
| 69(1)(c) | 54 |
| 69(1)(d) | 146 |
| 69(1)(e) | 622 |
| 69(1)(f) | 30 |
| 69(1)(g) re (a) | 759 |
| 69(1)(g) re (b) | 15 |
| 69(1)(g) re (c) | 425 |
| 69(1)(g) re (d) | 238 |
| 69(1)(g) re (e) | 486 |
| 69(1)(g) re (f) | 166 |
| 69.1(1) | 16 |
| Total | 3,168 |
| Consultations | Number of Requests | Number of Pages to Review | ||
|---|---|---|---|---|
| 2012–13 | 2013–14 | 2012–13 | 2013–14 | |
| Received during reporting period | 11,178 | 9,086 | 595,370 | 471,101 |
| Outstanding from the previous reporting period | 1,134 | 1,216 | 162,417 | 183,775 |
| Total | 12,312 | 10,302 | 757,787 | 654,876 |
| Closed during the reporting period | 11,262 | 9,515 | 632,007 | 547,748 |
| Pending at the end of the reporting period | 1,050 | 787 | 125,780 | 107,128 |
The preceding table shows a 16.3% decrease in the number of consultations by other government institutions.
| Consultations | Number of Requests | Number of Pages to Review | ||
|---|---|---|---|---|
| 2012–13 | 2013–14 | 2012–13 | 2013–14 | |
| Received during reporting period | 243 | 265 | 8,082 | 14,171 |
| Outstanding from the previous reporting period | 12 | 23 | 891 | 2,073 |
| Total | 255 | 288 | 8,973 | 16,244 |
| Closed during the reporting period | 241 | 252 | 8,089 | 12,143 |
| Pending at the end of the reporting period | 14 | 36 | 884 | 4,101 |
The preceding table shows an 13% increase in the number of consultations by other organizations.
| Recommendation | Number of Days Required to Complete Consultation Requests Footnote 6 | ||||||
|---|---|---|---|---|---|---|---|
| 1 to 30 Days | 31 to 60 Days | 61 to 120 Days | 121 to 180 Days | 181 to 365 Days | More Than 365 Days | Total | |
| Disclose entirely | 3,673 | 672 | 169 | 17 | 108 | 23 | 4,662 |
| Disclose in part | 1,982 | 1,037 | 547 | 138 | 89 | 36 | 3,829 |
| Exempt entirely | 180 | 55 | 32 | 4 | 0 | 0 | 271 |
| Exclude entirely | 30 | 6 | 4 | 0 | 0 | 0 | 40 |
| Consult other institutionFootnote 14 | 144 | 38 | 24 | 5 | 7 | 2 | 220 |
| Other | 397 | 43 | 23 | 12 | 17 | 7 | 499 |
| Total | 6,406 | 1,851 | 799 | 176 | 221 | 68 | 9,521 |
| Recommendation | Number of Days Required to Complete Consultation Requests | ||||||
|---|---|---|---|---|---|---|---|
| 1 to 30 Days | 31 to 60 Days | 61 to 120 Days | 121 to 180 Days | 181 to 365 Days | More Than 365 Days | Total | |
| Disclose entirely | 145 | 28 | 3 | 0 | 1 | 0 | 177 |
| Disclose in part | 39 | 12 | 6 | 1 | 0 | 1 | 59 |
| Exempt entirely | 3 | 0 | 0 | 0 | 0 | 0 | 3 |
| Exclude entirely | 0 | 0 | 0 | 0 | 0 | 0 | 0 |
| Consult other institutionFootnote 14 | 4 | 0 | 1 | 2 | 0 | 0 | 7 |
| Other | 6 | 0 | 2 | 0 | 1 | 0 | 9 |
| Total | 197 | 40 | 12 | 3 | 2 | 1 | 255 |
| Description of Fees and Costs | Amount |
|---|---|
| Cost of operations Footnote 7 | $62,585,847.00 |
| Requests completed | 58,475 |
| Average cost per completed request | $1,070.30 |
| Pages processed | 13,080,637 |
| Average cost per page processed | $4.78 |
| Fees collected | $331,782.00 |
| Average fees collected per completed request | $5.67 |
| Fees waived | $178,808.20 |
| Average fees waived per completed request | $3.06 |
| Rank | Name of Institution | Requests as Percentage | Number of Pages Processed | Number of Requests |
|---|---|---|---|---|
| 1 | Citizenship and Immigration Canada | 48.8% | 1,241,427 | 29,281 |
| 2 | Canada Border Services Agency | 7.8% | 386,072 | 4,671 |
| 3 | Canada Revenue Agency | 4.6% | 1,636,782 | 2,751 |
| 4 | National Defence | 3.7% | 234,134 | 2,231 |
| 5 | Royal Canadian Mounted Police | 2.9% | 505,610 | 1,730 |
| 6 | Health Canada | 2.6% | 206,812 | 1,563 |
| 7 | Environment Canada | 2.4% | 185,385 | 1,459 |
| 8 | Transport Canada | 1.8% | 202,969 | 1,091 |
| 9 | Privy Council Office | 1.5% | 58,409 | 907 |
| 10 | Foreign Affairs, Trade and Development Canada Table note * | 1.5% | 138,159 | 904 |
| 11 | Other institutions | 22.5% | 8,284,878 | 13,517 |
| Total | 100.0% | 13,080,637 | 60,105 | |
Access to Information Act Requests Since 1983
Please note that the statistics reflect adjustments made throughout the years.
| Requests Under the Access to Information Act | Number of Requests |
|---|---|
| Requests received | 637,816 |
| Requests completed | 622,630 |
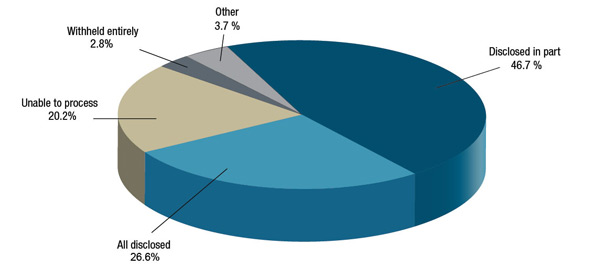
Figure 5: Disposition of Access to Information Act Requests Since 1983 – Text version
This table identifies the numbers of requests received and the dispositions of the completed requests since 1983. Data is shown in percentages.
| Disposition of Requests Completed | Requests as Percentage |
|---|---|
| Disclosed in part | 46.7% |
| All disclosed | 26.6% |
| Unable to process | 20.3% |
| Withheld entirely | 2.8% |
| Other | 3.7% |
In the preceding figure:
- “Withheld entirely” includes categories “all exempted” and “all excluded”
- “Other” includes the categories “treated informally” and “request transferred”
- “Unable to process” includes the categories “no records exist”, “requests abandoned” and “requests that could not be processed (1983-2011)”.
| Disposition of Requests Completed | Requests as Percentage | Number of Requests |
|---|---|---|
| Disclosed in part | 46.7% | 290,519 |
| All disclosed | 26.6% | 165,607 |
| No records exist Table note * | 2.8% | 17,692 |
| Treated informally | 2.3% | 14,057 |
| Abandoned Table note ** | 2.2% | 13,738 |
| All exempted | 2.1% | 13,322 |
| Transferred | 1.4% | 8,809 |
| All excluded | 0.7% | 4,180 |
| Requests that could not be processed (1983‒2011) Table note *** | 15.2% | 94,706 |
| Total | 100.0% | 622,630 |
| Completion Time (including requests for which extensions were required) | Requests as Percentage | Number of Requests |
|---|---|---|
| 0 to 30 days | 59.4% | 369,945 |
| 31 to 60 days | 18.3% | 113,671 |
| 61 days or more | 22.3% | 139,014 |
| Total | 100.0% | 622,630 |
| Description of Fees and Costs of Operations | Amount |
|---|---|
| Requests completed | 622,630 |
| Cost of operations7 | $670,470,779.70 |
| Average cost per request completed | $1,076.84 |
| Fees collected | $6,116,741.02 |
| Average fees collected per request completed | $9.82 |
| Fees waived | $3,105,579.94 |
| Average fees waived per request completed | $4.99 |
Treasury Board of Canada Secretariat found certain reporting errors in the previously posted Statistical Reporting 2013-14. These errors have since been resolved and the corrected data is now posted.
Privacy Act Statistics
The following is the collection of tables and figures that offer insights regarding requests made under the Privacy Act and completed during the period , to . These figures are based on the statistical reports provided by government institutions subject to the Privacy Act.
Requests Under the Privacy Act: 2013‒14
| Requests Under the Privacy Act | Number of Requests |
|---|---|
| Received during 2013‒14 reporting period | 56,338 |
| Outstanding from 2012‒13 reporting period | 10,010 |
| Total | 66,348 |
| Closed during 2013‒14 reporting period | 54,912 |
| Carried over to 2014‒15 reporting period | 11,436 |
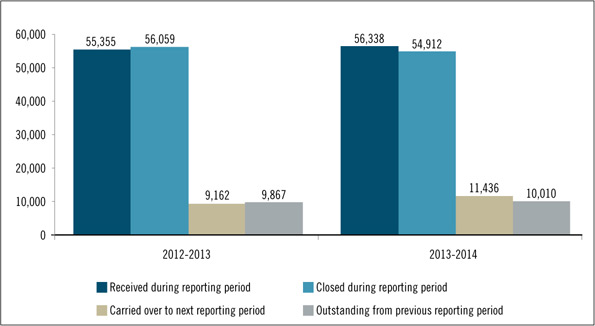
Figure 6: Requests Received Under the Privacy Act: Comparison of 2012‒13 and 2013‒14 – Text version
This table compares the number of requests under the Privacy Act received, completed and carried forward from the 2012-2013 reporting period with those from 2013-2014.
| Requests under the Privacy Act | 2012‒13 | 2013‒14 |
|---|---|---|
| Requests received during reporting period | 55,355 | 56,263 |
| Closed during reporting period | 56,059 | 54,839 |
| Carried over to next reporting period | 9,162 | 11,430 |
| Outstanding from previous reporting period | 9,867 | 10,006 |
The preceding figure depicts a 2% increase in the number of Privacy Act requests received in the 2013‒14 reporting period, when compared with the previous reporting period. It also shows that, of the 66,348 requests to be processed, 83% of requests were completed. This a slight decrease of 3% compared to the previous year.
| Disposition of Requests Completed | Requests as Percentage | Number of Requests | ||
|---|---|---|---|---|
| 2012‒13 | 2013‒14 | 2012‒13 | 2013‒14 | |
| Disclosed in part | 43.00 | 48.31 | 24,217 | 26,529 |
| All disclosed | 33.00 | 30.98 | 18,700 | 17,010 |
| No records exist | 16.00 | 13.24 | 9,013 | 7,271 |
| Request abandoned | 7.00 | 6.63 | 3,738 | 3,639 |
| All exempted | 1.00 | 0.83 | 389 | 456 |
| All excluded | 0.02 | 0.01 | 2 | 7 |
| Total | 100.00 | 100.00 | 56,059 | 54,912 |
The preceding table shows an approximately 3% increase in the number of Privacy Act requests where records were disclosed. It also depicts an approximately 3% decrease where no records exist.
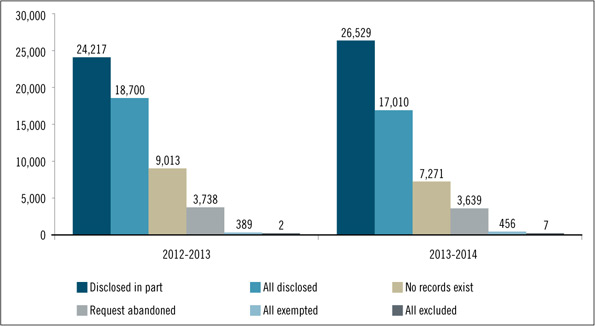
Figure 7: Disposition of Privacy Act Requests Completed: Comparison of 2012‒13 and 2013‒14 – Text version
This table compares the number of requests under the Access to Information Act received, completed and carried forward within the 2013-2014 reporting period with those from 2012-2013.
| Disposition of requests completed | 2012-2013 | 2013-2014 |
|---|---|---|
| Disclosed in part | 24,217 | 26,517 |
| All disclosed | 18,700 | 17,008 |
| No records exist | 9,013 | 7,230 |
| Request abandoned | 3,738 | 3,629 |
| All exempted | 389 | 448 |
| All excluded | 2 | 7 |
| Completion Time 2013‒14 (including requests for which extensions were required) | Requests as Percentage | Number of Requests | ||
|---|---|---|---|---|
| 2012‒13 | 2013‒14 | 2012‒13 | 2013‒14 | |
| 0 to 30 days | 51 | 65 | 29,027 | 35,552 |
| 31 to 60 days | 24 | 16 | 13,290 | 8,763 |
| 61 to 120 days | 12 | 6 | 6,704 | 3,200 |
| 121 to 180 days | 3 | 5 | 1,891 | 2,605 |
| 181 to 365 days | 7 | 4 | 3,535 | 2,484 |
| More than 365 days | 3 | 4 | 1,612 | 2,308 |
| Total | 100 | 100 | 56,059 | 54,912 |
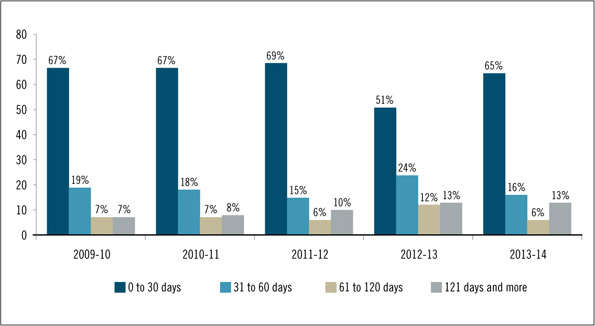
Figure 8: Five-Year Comparison of Time Required to Complete Privacy Act Requests According to Time Periods – Text version
This table compares the number of requests under the Access to Information Act received, completed and carried forward within the 2013-2014 reporting period with those from 2012-2013.
| Completion Time | 2009-10 | 2010-11 | 2011-12 | 2012-13 | 2013-14 |
|---|---|---|---|---|---|
| 0 to 30 days | 67% | 67% | 69% | 51% | 65% |
| 31 to 60 days | 19% | 18% | 15% | 24% | 16% |
| 61 to 120 days | 7% | 7% | 6% | 12% | 6% |
| 121 days or more | 7% | 8% | 10% | 13% | 13% |
| Disposition of Requests | Completion Time | ||||||
|---|---|---|---|---|---|---|---|
| 0 to 30 Days | 31 to 60 Days | 61 to 120 Days | 121 to 180 Days | 181 to 365 Days | More Than 365 Days | Total | |
| All disclosed | 13,210 | 2,248 | 584 | 594 | 265 | 109 | 17,010 |
| Disclosed in part | 14,189 | 5,644 | 2,117 | 1,741 | 1,774 | 1,064 | 26,529 |
| All exempted | 230 | 75 | 54 | 27 | 54 | 16 | 456 |
| All excluded | 2 | 0 | 0 | 1 | 3 | 1 | 7 |
| No records exist | 5,997 | 537 | 251 | 142 | 197 | 147 | 7,271 |
| Request abandoned | 1,924 | 259 | 194 | 100 | 191 | 971 | 3,639 |
| Total | 35,552 | 8,763 | 3,200 | 2,605 | 2,484 | 2,308 | 54,912 |
| Total percentage | 64.74 | 15.96 | 5.83 | 4.74 | 4.52 | 4.20 | 100 |
| Disposition of Requests | Number of Pages Processed | Number of Pages Disclosed | Number of Requests |
|---|---|---|---|
| All disclosed | 822,376 | 770,864 | 17,010 |
| Disclosed in part | 5,813,497 | 4,673,567 | 26,529 |
| All exempted | 581,449 | 0 | 456 |
| All excluded | 482 | 0 | 7 |
| Request abandoned | 109,712 | 8,819 | 3,639 |
| Total | 7,327,516 | 5,453,250 | 47,641 |
| Disposition | Consultation Required | Legal Advice Sought | Other Footnote 8 | Other | Total |
|---|---|---|---|---|---|
| All disclosed | 55 | 6 | 31 | 1,221 | 1,313 |
| Disclosed in part | 867 | 36 | 3,440 | 6,037 | 10,380 |
| All exempted | 5 | 4 | 13 | 13 | 35 |
| All excluded | 0 | 0 | 0 | 1 | 1 |
| Request abandoned | 14 | 1 | 35 | 188 | 238 |
| Total | 941 | 47 | 3,519 | 7,460 | 11,967 |
| Number of Requests Closed Past the Statutory Deadline or Not Within the Time Frame Covered by an Extension (deemed refusal) | Principal Reason | |||
|---|---|---|---|---|
| Workload | External Consultation | Internal Consultation | Other | |
| 12,948 | 10,174 | 809 | 908 | 1,057 |
| Status of Requests Closed | Requests as Percentage | Number of Requests | ||
|---|---|---|---|---|
| 2012‒13 | 2013‒14 | 2012‒13 | 2013‒14 | |
| Closed within the statutory deadline including extensions | 71.8 | 76.4 | 40,237 | 41,944 |
| Closed in deemed refusal | 28.2 | 23.6 | 15,822 | 12,968 |
| Total | 100.0 | 100.0 | 56,059 | 54,912 |
| Paragraph 8(2)(e) Footnote 9 | Paragraph 8(2)(m) Footnote 10 | Total |
|---|---|---|
| 3,891 | 65 | 3,956 |
| Disposition of Requests Where an Extension Was Taken | 15(a)(i) Interference With Operations | 15(a)(i) Consultation | 15(b) Translation or Conversion | |
|---|---|---|---|---|
| Section 70 Footnote 11 | Other Footnote 12 | |||
| All disclosed | 1,036 | 1 | 27 | 2 |
| Disclosed in part | 4,500 | 3 | 556 | 13 |
| All exempted | 71 | 0 | 1 | 0 |
| All excluded | 1 | 0 | 0 | 0 |
| No records exist | 443 | 0 | 3 | 1 |
| Request abandoned | 719 | 0 | 12 | 0 |
| Total | 6,770 | 4 | 599 | 16 |
| Length of Extensions | 15(a)(i) Interference With Operations | 15(a)(i) Consultation | 15(b) Translation Purposes | |
|---|---|---|---|---|
| Section 70 | Other | |||
| 1 to 15 days | 33 | 0 | 7 | 0 |
| 16 to 30 days | 6,737 | 4 | 592 | 16 |
| Total | 6,770 | 4 | 599 | 16 |
Exemptions Applied Under the Privacy Act
| Provision | Number of Requests |
|---|---|
| 18(2) | 9 |
| Total | 9 |
| Provision | Number of Requests |
|---|---|
| 19(1)(a) | 519 |
| 19(1)(b) | 69 |
| 19(1)(c) | 1,745 |
| 19(1)(d) | 1,219 |
| 19(1)(e) | 2 |
| 19(1)(f) | 0 |
| Total | 3,554 |
| Provision | Number of Requests |
|---|---|
| 20 | 1 |
| Total | 1 |
| Provision | Number of Requests |
|---|---|
| 21 | 4,406 |
| Total | 4,406 |
| Provision | Number of Requests |
|---|---|
| 22(1)(a)(i) | 2,568 |
| 22(1)(a)(ii) | 1,038 |
| 22(1)(a)(iii) | 27 |
| 22(1)(b) | 4,029 |
| 22(1)(c) | 1,681 |
| 22(2) | 4 |
| 22.1 | 35 |
| 22.2 | 1 |
| 22.3 | 12 |
| Total | 9,395 |
| Provision | Number of Requests |
|---|---|
| 23(a) | 11 |
| 23(b) | 0 |
| Total | 11 |
| Provision | Number of Requests |
|---|---|
| 24(a) | 44 |
| 24(b) | 679 |
| Total | 723 |
| Provision | Number of Requests |
|---|---|
| 25 | 96 |
| Total | 96 |
| Provision | Number of Requests |
|---|---|
| 26 | 23,569 |
| Total | 23,569 |
| Provision | Number of Requests |
|---|---|
| 27 | 885 |
| Total | 885 |
| Provision | Number of Requests |
|---|---|
| 28 | 38 |
| Total | 38 |
Exclusions Applied Under the Privacy Act
| Provision | Number of Requests |
|---|---|
| 69(1)(a) | 1 |
| 69(1)(b) | 0 |
| Total | 1 |
| Provision | Number of Requests |
|---|---|
| 69.1 | 0 |
| Total | 0 |
| Provision | Number of Requests |
|---|---|
| 70(1)(a) | 2 |
| 70(1)(b) | 0 |
| 70(1)(c) | 2 |
| 70(1)(d) | 0 |
| 70(1)(e) | 2 |
| 70(1)(f) | 0 |
| Total | 6 |
| Provision | Number of Requests |
|---|---|
| 70.1 | 0 |
| Total | 0 |
| Consultations | Number of Requests | Number of Pages to Review | ||
|---|---|---|---|---|
| 2012‒13 | 2013‒14 | 2012‒13 | 2013‒14 | |
| Received during reporting period | 1,132 | 1,139 | 44,501 | 55,219 |
| Outstanding from the previous reporting period | 84 | 31 | 19,270 | 1,666 |
| Total | 1,216 | 1,170 | 63,771 | 56,885 |
| Closed during the reporting period | 1,189 | 1,115 | 62,042 | 47,613 |
| Pending at the end of the reporting period | 27 | 55 | 1,729 | 9,272 |
The preceding table reveals a 24% increase in the number of pages to review for consultations received during the reporting period.
| Consultations | Number of Requests | Number of Pages to Review | ||
|---|---|---|---|---|
| 2012‒13 | 2013‒14 | 2012‒13 | 2013‒14 | |
| Received during reporting period | 163 | 35 | 6,026 | 457 |
| Outstanding from the previous reporting period | 3 | 0 | 45 | 0 |
| Total | 166 | 35 | 6,071 | 457 |
| Closed during the reporting period | 166 | 34 | 6,071 | 444 |
| Pending at the end of the reporting period | 0 | 1 | 0 | 13 |
The number of consultations received decreased by 79% when compared to the number reported in 2012‒13.
| Recommendation | Number of Days Required to Complete Consultation Requests | ||||||
|---|---|---|---|---|---|---|---|
| 1 to 30 Days | 31 to 60 Days | 61 to 120 Days | 121 to 180 Days | 181 to 365 Days | More Than 365 Days | Total | |
| Disclose entirely | 437 | 15 | 2 | 0 | 0 | 0 | 454 |
| Disclose in part | 491 | 63 | 11 | 2 | 5 | 0 | 572 |
| Exempt entirely | 37 | 5 | 3 | 0 | 0 | 0 | 45 |
| Exclude entirely | 1 | 2 | 0 | 0 | 0 | 0 | 3 |
| Consult other institution Footnote 14 | 19 | 0 | 1 | 0 | 0 | 0 | 20 |
| Other | 20 | 1 | 0 | 0 | 0 | 0 | 21 |
| Total | 1,005 | 86 | 17 | 2 | 5 | 0 | 1,115 |
| Recommendation | Number of Days Required to Complete Consultation Requests | ||||||
|---|---|---|---|---|---|---|---|
| 1 to 30 Days | 31 to 60 Days | 61 to 120 Days | 121 to 180 Days | 181 to 365 Days | More Than 365 Days | Total | |
| Disclose entirely | 15 | 0 | 0 | 0 | 0 | 0 | 15 |
| Disclose in part | 16 | 1 | 0 | 0 | 0 | 0 | 17 |
| Exempt entirely | 1 | 0 | 0 | 0 | 0 | 0 | 1 |
| Exclude entirely | 1 | 0 | 0 | 0 | 0 | 0 | 1 |
| Consult other institution Footnote 14 | 0 | 0 | 0 | 0 | 0 | 0 | 0 |
| Other | 0 | 0 | 0 | 0 | 0 | 0 | 0 |
| Total | 33 | 1 | 0 | 0 | 0 | 0 | 34 |
| Requests completed | 54,912 |
|---|---|
| Cost of operations Footnote 7 | $33,167,651 |
| Average cost per completed request | $604.01 |
| Rank | Name of Institution | Requests as Percentage | Number of Requests | Pages Processed |
|---|---|---|---|---|
| 1 | Canada Border Services Agency | 21.10% | 11,890 | 401,168 |
| 2 | Citizenship and Immigration Canada | 17.68% | 9,961 | 483,526 |
| 3 | Correctional Service of Canada | 15.10% | 8,508 | 913,213 |
| 4 | Employment and Social Development Canada | 12.94% | 7,286 | 544,239 |
| 5 | National Defence | 10.57% | 5,957 | 1,423,923 |
| 6 | Royal Canadian Mounted Police | 6.84% | 3,854 | 1,184,652 |
| 7 | Canada Revenue Agency | 2.75% | 1,548 | 626,822 |
| 8 | Immigration and Refugee Board | 1.84% | 1,038 | 102,822 |
| 9 | Canada Post Corporation | 1.40% | 789 | 73,912 |
| 10 | Veterans Affairs Canada | 1.16% | 654 | 252,030 |
| 11 | Other institutions | 8.61% | 4,853 | 1,321,209 |
| Total | 100.00% | 56,338 | 7,327,516 | |
Privacy Impact Assessments
Privacy Impact Assessments (PIAs) provide a framework to ensure that privacy is considered throughout the design or redesign of programs, activities or service delivery. The assessments will identify the extent to which proposals comply with all appropriate statutes. Assessments assist managers and decision makers in avoiding or mitigating privacy risks and promote fully informed policy, program and system design choices.
Article 6.3 of the Directive on Privacy Impact Assessments states the following:
The appropriate senior officials or executives are responsible for adhering to the following process for the completion of a privacy impact assessment:
…
6.3.15 Ensuring that the approved core PIA provided to [the Treasury Board of Canada Secretariat] is simultaneously provided to the Office of the Privacy Commissioner, along with any additional documentation that may be requested by that office.
| Privacy Impact Assessments | Amount |
|---|---|
| Number of PIAs completed Footnote 15 | 146 |
Personal Information Banks
Personal Information Banks (PIBs) provide a description of personal information about individuals that is held by federal institutions. The Privacy Act requires that PIBs describe all personal information that is organized and retrievable by a person's name or by an identifying number, symbol or other particular assigned only to that person. PIBs must include personal information that has been or is being used, or is available for use for an administrative purpose.
Institution-specific PIBs describe personal information that is contained in the records of a specific federal government institution, and standard PIBs describe personal information that may be found in records created, collected and maintained by most federal government institutions to support common internal functions, programs and activities such as communications, travel and employment. Standard PIBs are created by the Treasury Board of Canada Secretariat, and institutions can register against them. Central PIBs describe personal information about members of the general public and employees (current and former) from all or several government institutions and are maintained by central government departments and agencies.
| Personal Information Banks | Amount |
|---|---|
| Number of institutions registering new PIBs in 2013–14 | 32 |
| Number of new PIBs registered in 2013–14 | 183 |
| Number of new institution-specific PIBs registered in 2013–14 | 14 |
| Number of times standard PIBs were leveraged by institutions in 2013–14 Footnote 16 | 168 |
| Number of central PIBs registered 2013–14 | 1 |
Privacy Act Requests Since 1983
Please note that the statistics reflect adjustments made throughout the years.
| Requests Under the Privacy Act | Number of Requests |
|---|---|
| Requests received | 1,367,757 |
| Requests completed | 1,355,624 |
Disposition of Privacy Act Requests Completed Since 1983
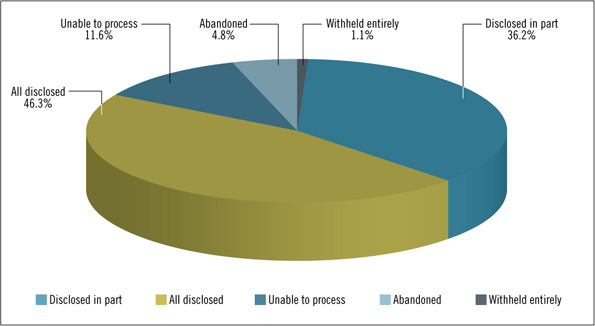
Figure 9: Disposition of Privacy Act Requests Completed Since 1983 – Text version
This table identifies the numbers of Privacy Act Requests received and the dispositions of the completed requests since 1983. Data is shown in percentages.
| Disposition of Requests Completed | Requests as Percentage |
|---|---|
| Disclosed in part | 36.2% |
| All disclosed | 46.3% |
| Unable to process | 11.6% |
| Abandoned | 4.8% |
| Withheld entirely | 1.1% |
In the preceding figure:
“Withheld entirely” includes categories “all exempted” and “all excluded”
“Unable to process” includes the categories “no records exist”, “transferred” and “requests that could not be processed (1983-2011)”.
| Disposition of Requests Completed | Requests as Percentage | Number of Requests |
|---|---|---|
| All disclosed | 46.28% | 627,402 |
| Disclosed in part | 36.18% | 490,412 |
| Abandoned | 4.80% | 65,024 |
| Transferred Table note * | 2.37% | 32,188 |
| No records exist Table note ** | 1.81% | 24,587 |
| All exempted | 1.01% | 13,721 |
| All excluded | 0.05% | 625 |
| Requests that could not be processed (1983–2011 Footnote 17) | 7.50% | 101,665 |
| Total | 100.00 | 1,355,624 |
| Completion Time (including requests for which extensions were required) | Requests as Percentage | Number of Requests |
|---|---|---|
| 0 to 30 days | 59.76% | 810,086 |
| 31 to 60 days | 18.13% | 245,727 |
| 61 days or more | 22.12% | 299,811 |
| Total | 100.00% | 1,355,624 |
| Description of Cost of Operations | Amount |
|---|---|
| Requests completed | 1,355,624 |
| Cost of operations Table note * | $424,306,774.12 |
| Average cost per completed request | $313.00 |
Cost of Operations Footnote 7 Relating to the Access to Information Act and the Privacy Act 1983‒2014
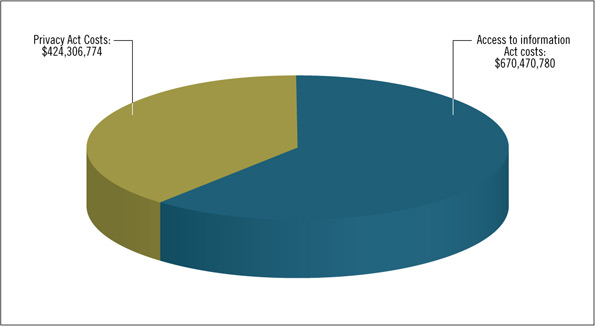
Figure 10: Cost of Operations Relating to the Access to Information Act and the Privacy Act 1983–2014 – Text version
This graph compares the costs of operations relating to the administration of the Access to Information Act and the Privacy Act in institutions for the period between 1983 and 2014.
| Access to Information Act Costs | 669,927,278.70 $ |
|---|---|
| Privacy Act Costs | 424,074,345.12 $ |
| Requests completed | 447,489 |
Page details
- Date modified: