Access to information and privacy statistical report, 2016-17
The Access to Information and Privacy Statistical Report is an annual report of statistical information about the Government of Canada’s access to information and privacy programs.
The Access to Information Act and the Privacy Act both came in to effect on July 1, 1983.
Section 70(1)(c.1) of the Access to Information Act assigns responsibility to the President of the Treasury Board, as the designated Minister, to collect statistics on an annual basis. These statistics are used to assess the performance of the Government of Canada’s access to information and privacy programs according to the provisions of the Acts.
The tables and figures that follow present data from the period of April 1, 2016, to March 31, 2017, provided by government institutions subject to the Acts. Cumulative data from 1983 to March 31, 2017 is also presented.
The complete statistical dataset will be made available in open format on the Government of Canada’s Open Data Portal.
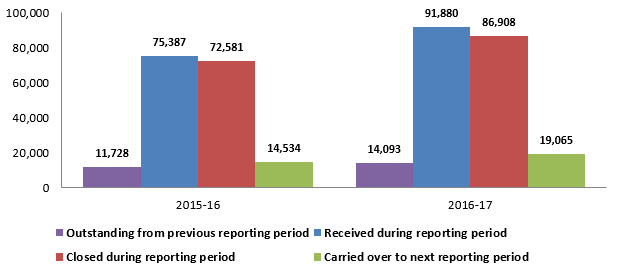
91,880 requests were received in 2016-17, an increase of 21.9 percent from 2015-16.
Of 105,973 requests that were received in 2016-17 or were outstanding from the previous period, 82 percent were closed. This is relatively consistent with 2015-16: out of 87,115 requests that were received in 2015-16 or were outstanding from the previous period, 83.3 percent were closed.
Ten government institutions received 82.8 percent of all new requests in 2016-17.
Requests received and closed under the Access to Information Act
Due to administrative errors, there are small inconsistencies between the 2015-16 statistical data and the 2016-17 statistical data regarding the number of requests or consultations left outstanding at the end of the 2015-16 reporting period.
Figure 01: Requests received and closed under the Access to Information Act: 2015-16 and 2016-17Figure 01: Text version
This table compares the number of requests under the Access to Information Act received, closed and carried forward from the 2015-16 reporting period with those from within 2016-17.
Requests under the Access to Information Act
2015-16
2016-17
Outstanding from previous reporting period
11,728
14,093
Received during reporting period
75,387
91,880
Closed during reporting period
72,581
86,908
Carried over to next reporting period
14,534
19,065
Access to Information Act requests by top ten institutions
Innovation, Science and Economic Development Canada
1.6%
1,476
1,947,063
10
Public Services and Procurement Canada
1.4%
1,295
240,567
Other Institutions
17.2%
15,758
5,557,742
Total
100.00%
91,880
16,047,246
Table 2 Notes
Table 2 Note 1
The number of pages processed per government institution represents the total processed pages for closed requests. This does not include the number of pages processed for requests that were carried over into the next reporting period.
The category “organization” includes, but is not limited to, associations, unions, non-for-profit and voluntary organizations, offices of Members of Parliament, political parties and non-government organizations. It also includes requesters that selected “organization” when submitting their request.
The category “decline to identify” includes requesters that selected “decline to identify” when submitting their request. It also includes instances where the requestor did not select any of the available categories when submitting a hard-copy application.
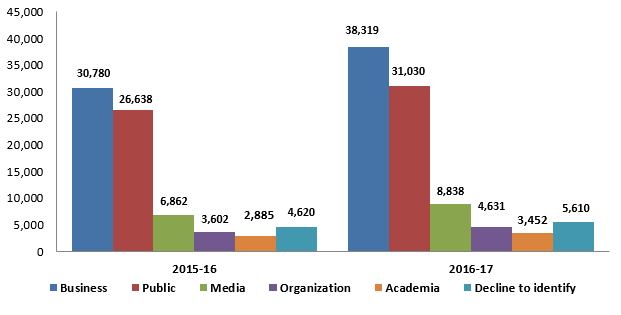
Figure 02: Sources of received Access to Information Act requests: 2015-16 and 2016-17Figure 02: Text version
This table compares requester types (the sources of requests) from the 2015-16 reporting period with those for the 2016-17.
Source
2015-16
2016-17
Business
30,780
38,319
Public
26,638
31,030
Media
6,862
8,838
Organization
3,602
4,631
Academia
2,885
3,452
Decline to identify
4,620
5,610
Timeliness
Of 86,908 requests closed in 2016-17, 56,084, or 64.5 percent, were closed within the initial statutory deadline of 30 days.
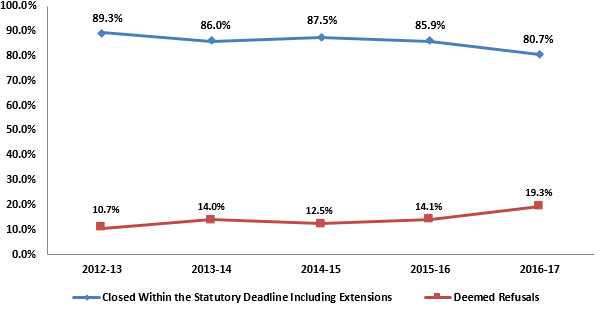
80.7 percent of requests were closed within established timelines (that is, closed within the statutory deadline of 30 days or within an extension period provided for in the Act). The comparable figure in 2015-16 was 85.9 percent.
Disposition and time required to close Access to Information Act requests
Disposition of requests (including requests for which extensions were required)
An abandoned request is a request that has been formally withdrawn by the requester, or the requester did not respond to a notice indicating that the request will be closed if they do not respond within a specified time period.
The category “neither confirmed nor denied” relate to requests for which subsection 10(2) of the Access to Information Act was invoked: “The head of a government institution may but is not required to indicate under subsection 10(1) whether a record exists.”
Time required to close Access to Information Act requests according to time period: 2015-16 and 2016-17 See table 5 note 1
Closure time
Requests as percentage
Number of requests
2015-16
2016-17
2015-16
2016-17
0 to 30 days
64.1%
64.5%
46,543
56,084
31 to 60 days
21.3%
18.0%
15,442
15,616
61 to 120 days
7.5%
9.5%
5,446
8,248
121 to 180 days
2.6%
2.7%
1,883
2,359
181 to 365 days
2.4%
2.6%
1,741
2,275
More than 365 days
2.1%
2.7%
1,526
2,326
Total
100.0%
100.0%
72,581
86,908
Table 5 Notes
Table 5 Note 1
The Access to Information Act provides for the extension of the time limit to respond to a request beyond 30 days if: (1) it involves a large number of records or necessitates a search through a large number of records AND meeting the original time limit would unreasonably interfere with the operations of the institution; (2) external consultations are necessary and cannot reasonably be expected to be closed within the original time limit; or (3) notice to a third party is required to advise the third party that their information is the subject of a request. The data in this table reflects all closed requests, including requests for which extensions were taken.
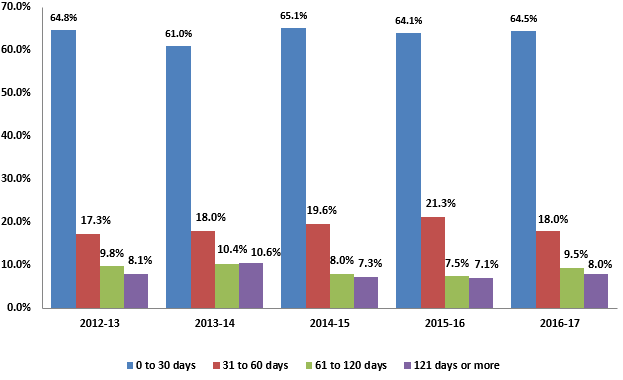
Figure 03: Time required to close Access to Information Act requests, 2012-13 to 2016-17 See Footnote 1Figure 03: Text version
This table compares the time required to close requests, listed according to time periods, for the last five years, from 2012 to 2017. Data is shown in percentages.
Closure time
2012-13
2013-14
2014-15
2015-16
2016-17
0 to 30 days
64.8%
61.0%
65.1%
64.1%
64.5%
31 to 60 days
17.2%
18.0%
19.6%
21.3%
18.0%
61 to 120 days
9.8%
10.4%
8.0%
7.5%
9.5%
121 days or more
8.1%
10.6%
7.3%
7.1%
8.0%
Status of closed Access to Information Act requests: 2015-16 and 2016-17
Status of closed requests
Requests as percentage
Number of requests
2015-16
2016-17
2015-16
2016-17
Closed within the statutory deadline including extensions
85.9%
80.7%
62,366
70,128
Closed in deemed refusal
14.1%
19.3%
10,215
16,780
Total
100.0%
100.0%
72,581
86,908
Figure 04: Access to Information Act requests closed within established timelines, 2012-13 to 2016-17Figure 04: Text version
This table compares the status of requests closed in the last five years, from 2012 to 2017. Data is shown in percentages.
Status of closed request
2012-13
2013-14
2014-15
2015-16
2016-17
Closed Within the Statutory Deadline Including Extensions
89.3%
86.0%
87.5%
85.9%
80.7%
Deemed Refusals
10.7%
14.0%
12.5%
14.1%
19.3%
Reasons for deemed refusals See table 6 note 1 regarding closed Access to Information Act requests
Total number of requests closed past the statutory deadline or not within the timeframe covered by an extension (deemed refusal)
The information in this table reflects requests that were neither closed in the initial 30 days nor closed within the timeframe covered by an extension. These requests are referred to as “deemed refusals.”
Number of days past deadline for Access to Information Act requests closed in deemed refusal
Number of days past deadline
Number of requests past deadline where no extension was taken
Number of requests past deadline where an extension was taken
Total deemed refusals
Total as percentage
1 to 30 days
7,176
923
8,099
48.3%
31 to 60 days
2,024
510
2,534
15.1%
61 to 120 days
1,510
595
2,105
12.5%
121 to 180 days
520
385
905
5.4%
181 to 365 days
795
601
1,396
8.3%
More than 365 days
947
794
1,741
10.4%
Total
12,972
3,808
16,780
100.0%
Disposition
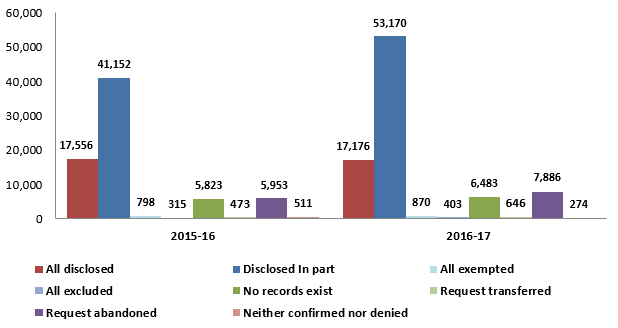
Records were disclosed either in full or in part for 81 percent of closed requests. This is stable, as compared with the previous period.
Disposition of closed Access to Information Act requests: 2015-16 and 2016-17
Disposition of closed requests
Requests as percentage
Number of requests
2015-16
2016-17
2015-16
2016-17
All disclosed
24.2%
19.8%
17,556
17,176
Disclosed in part
56.7%
61.2%
41,152
53,170
All exempted
1.1%
1.0%
798
870
All excluded
0.4%
0.5%
315
403
No records exist
8.0%
7.5%
5,823
6,483
Request transferred
0.7%
0.7%
473
646
Request abandoned
8.2%
9.1%
5,953
7,886
Neither confirmed nor denied
0.7%
0.3%
511
274
Total
100.0%
100.0%
72,581
86,908
Figure 05: Disposition of closed Access to Information Act requests: 2015-16 and 2016-17Figure 05: Text version
This table compares the disposition of closed requests from the 2015-16 reporting period with the disposition of those for the 2016-17.
Disposition of closed requests
2015-16
2016-17
All disclosed
17,556
17,176
Disclosed in part
41,152
53,170
All exempted
798
870
All excluded
315
403
No records exist
5,823
6,483
Request transferred
473
646
Request abandoned
5,953
7,886
Neither confirmed nor denied
511
274
Complexity
In 2016-17, Government institutions processed about 16 million pages for closed requests, an increase of about 7 million pages as compared to 2015-16; 62.3 percent of pages were disclosed either in full or in part.
Government institutions undertook outside consultations in 8.9 percent of all closed requests.
Relevant pages processed and disclosed regarding closed Access to Information Act requests: 2015-16 and 2016-17
The total number of requests for each reporting period reflects the total number of requests closed in each period with the exception of those categorized as “no records exist,” “request transferred” or “neither confirmed nor denied.”
Other considerations include requests for the contents of a database, requests to process audio or video recordings, high-profile subject matter, instances in which records are located in another region or country, instances in which the records are in a language other than English or French.
43.2 percent of all extensions taken for closed requests cited paragraph 9(1)(a) of the Access to Information Act as a reason for the extension, relating to interference with government operations. Furthermore, 30.4 percent of all extensions taken for closed requests were for 30 days or less, and 92.9 percent were for 120 days or less.
Reasons for and length of extensions regarding closed Access to Information Act requests
The “other” category includes consultations with one or more of the following: other federal government institutions, provincial and municipal governments, foreign states, international organizations of states, Aboriginal governments, non-governmental organizations or individuals.
The tables that follow indicate exclusions applied under the Access to Information Act for requests closed during the reporting period.
Act does not apply to certain materials
Provision
Number of requests
68(a)
562
68(b)
5
68(c)
5
68.1
122
68.2(a)
85
68.2(b)
21
Cabinet confidences
Provision
Number of requests
69(1)
91
69(1)(a)
246
69(1)(b)
20
69(1)(c)
92
69(1)(d)
164
69(1)(e)
487
69(1)(f)
66
69(1)(g) re (a)
998
69(1)(g) re (b)
29
69(1)(g) re (c)
578
69(1)(g) re (d)
316
69(1)(g) re (e)
658
69(1)(g) re (f)
278
Certificate under the Canada Evidence Act
Provision
Number of requests
69.1(1)
37
Consultations
The number of consultations between federal government institutions in 2016-17 was fairly consistent with 2015-16, an increase of 3.5 percent, however the number of pages to review increased by 24.9 percent.
Consultations by other government institutions regarding Access to Information Act requests: 2015-16 and 2016-17
Consultations
Number of consultations
Number of pages to review
2015-16
2016-17
2015-16
2016-17
Received during reporting period
8,099
8,532
397,689
533,526
Outstanding from the previous reporting period
687
564
123,076
117,101
Total
8,786
9,096
520,765
650,627
Closed during the reporting period
8,101
8,137
409,929
515,121
Pending at the end of the reporting period
685
959
111,736
135,506
Recommendations and closure time for consultations by other government institutions regarding Access to Information Act requests
Recommendation
Number of days required to close consultation requests
“Consult other institution” refers to a government institution’s recommendation that the institution that consulted them contact additional government institutions subject to the Access to Information Act.
The annual cost to administer the Government of Canada’s access to information program increased by 0.2 percent to $64.7 million in 2016-17, with the average cost per closed request declining by 16.3 percent to about $745 per request.
The increase in fees waived to $229,955 reflects that on May 5, 2016, the President of the Treasury Board issued the Interim Directive on the Administration of the Access to Information Act, directing government institutions to waive all fees apart from the initial $5 application fee.
Fees and costs of Access to Information Act operations: 2015-16 and 2016-17
Number of requests in which fees were waived or refunded
10,041
5,597
Fees waived or refunded
$138,070
$229,955
Average fees waived per request
$13.75
$41.09
Table 11 Notes
Table 11 Note 1
Cost of operations includes salaries, overtime, goods and services, contracts and all other expenses specific to Access to Information and Privacy offices. Costs associated with time spent by business areas searching for and reviewing records are not included here.
This calculation uses the total cost of operations in the reporting period to obtain the average cost per closed request. However, in actuality, the total cost of operations reflects processing costs of some requests that will be carried over into the next reporting period, in addition to closed requests, so the calculation is an approximation.
An informal request is a request for information made to a government institution subject to the Access to Information Act that is either not made or not processed under the Act. Unlike formal requests, fees cannot be charged under the Act for informal requests, and there are no deadlines for responding. In addition, the requester has no statutory right of complaint to the Information Commissioner.
Informal requests include formal requests that were discontinued in favour of providing information informally, in consultation with the requester. Other types of informal requests include advising requesters when information is already publicly available online, or the re-release of information made available through previously closed formal requests, summaries of which are found online. They do not include responses to Parliamentary Questions or media enquiries, or requests made internally within a government institution to share information between sectors.
In 2016-17, 61.2 percent of informal requests were closed within 30 days, as compared with 67.1 percent in 2015-16.
Time required to close informal requests
0 to 30 Days
31 to 60 days
61 to 120 days
121 to 180 days
181 to 365 days
More Than 365 days
Total
10,808
1,897
1,086
2,640
1,120
86
17,637
Access to Information Act requests since 1983
The statistics that follow reflect the best available data since 1983. The categories have been adjusted in some cases in order to compare data across the years.
Number of Access to Information Act Requests Since 1983
Requests under the Access to Information Act
Number of requests
Requests received
873,276
Requests closed
849,151
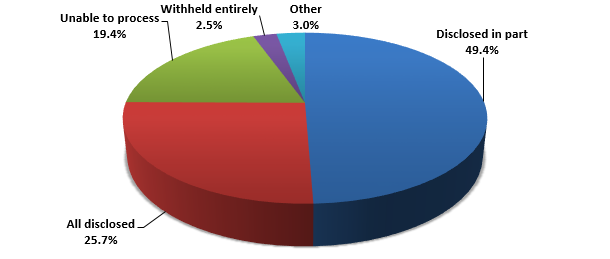
Figure 06: Disposition of closed Access to Information Act requests since 1983Figure 06: Text version
This table identifies the disposition of closed requests since 1983. Data is shown in percentages.
Disposition of closed requests
Requests as percentage
All disclosed
25.7%
Disclosed in part
49.4%
Unable to process
19.4%
Withheld entirely
2.5%
Other
3.0%
In the preceding figure:
“Withheld entirely” includes categories “all exempted” and “all excluded.”
“Other” includes the categories “transferred,” “neither confirmed nor denied” and “treated informally.”
This calculation uses the total cost of operations to obtain the average cost per closed request since 1983. However, in actuality, the total cost of operations reflects processing costs of some requests that will be carried over into the next reporting period, in addition to closed requests, so the calculation is an approximation.
This calculation uses the total amount of fees collected to obtain the average fees collected per closed request since 1983. However, in actuality, fees would not have been collected for every closed request.
This calculation uses the total amount of fees waived to obtain the average fees waived per closed request since 1983. However, in actuality, fees would not have been waived for every closed request.
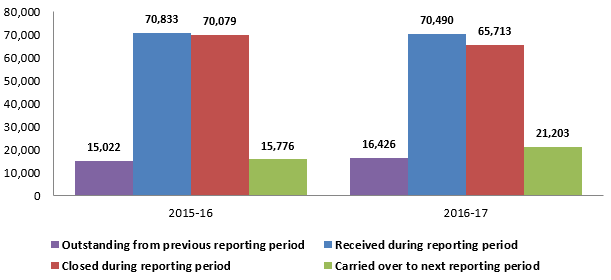
70,490 requests were received in 2016-17, a decrease of 0.5 percent from 2015-16.
Of 86,916 requests that were received in 2016-17 or were outstanding from the previous period, 75.6 percent were closed. This is a decrease from 2015-16: out of 85,855 requests that were received in 2015-16 or were outstanding from the previous period, 81.6 percent were closed.
Ten government institutions received 92.4 percent of all new requests in 2016-17.
Requests received and closed under the Privacy Act
Due to administrative errors, there are small inconsistencies between the 2015-16 statistical data and the 2016-17 statistical data regarding the number of requests or consultations left outstanding at the end of the 2015-16 reporting period.
Figure 07: Requests received and closed under the Privacy Act: 2015-16 and 2016-17Figure 07: Text version
This table compares the number of requests under the Privacy Act received, closed and carried forward from the 2015-16 reporting period with those within the 2016-17.
The number of pages processed per government institution represents the total processed pages for closed requests. This does not include the number of pages processed for requests that were carried over into the next reporting period.
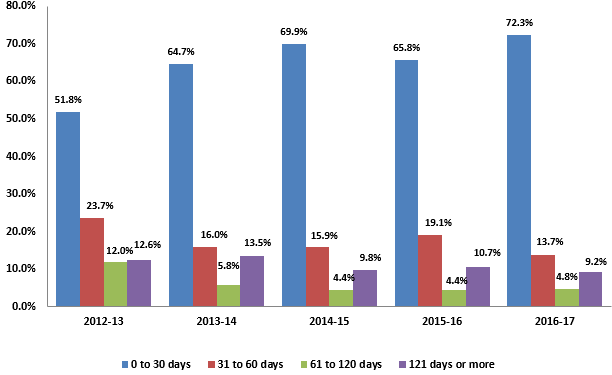
Of 65,713 requests closed in 2016-17, 47,524 requests, or 72.3 percent (a relative increase of 3.1 percent as compared with last year), were closed within the initial statutory deadline of 30 days.
80.4 percent of requests closed in 2016-17 were closed within established timelines (that is, closed within the statutory deadline of 30 days or within an extension period provided for in the Act). The comparable figure for 2015-16 was identical.
Disposition and time required to close Privacy Act requests
Disposition of requests (including requests for which extensions were required)
An abandoned request is a request that has been formally withdrawn by the requester, or the requester did not respond to a notice indicating that the request will be closed if they do not respond within a specified time period.
The category “neither confirmed nor denied” relates to requests for which subsection 16(1) of the Privacy Act was invoked: “The head of a government institution may but is not required to indicate under subsection 16(1) whether personal information exists.”
Time required to close Privacy Act requests according to time period: 2015-16 and 2016-17
Closure time
Requests as percentage
Number of requests
2015-16
2016-17
2015-16
2016-17
0 to 30 days
65.8%
72.3%
46,090
47,524
31 to 60 days
19.1%
13.7%
13,369
9,006
61 to 120 days
4.4%
4.8%
3,110
3,129
121 to 180 days
2.9%
3.0%
2,012
1,992
181 to 365 days
5.3%
2.7%
3,697
1,755
More than 365 days
2.6%
3.5%
1,801
2,307
Total
100.0%
100.0%
70,079
65,713
Figure 08: Time required to close Privacy Act requests, 2012-13 to 2016-17 See Footnote 7Figure 08: Text version
This table compares the time required to close requests, listed according to time periods, for the last five years, from 2012 to 2017. Data is shown in percentages.
Closure time
2012-13
2013-14
2014-15
2015-16
2016-17
0 to 30 days
51.8%
64.7%
69.9%
65.8%
72.3%
31 to 60 days
23.7%
16.0%
15.9%
19.1%
13.7%
61 to 120 days
12.0%
5.8%
4.4%
4.4%
4.8%
121 days or more
12.6%
13.5%
9.8%
10.7%
9.2%
Status of closed Privacy Act requests: 2015-16 and 2016-17
Status of closed requests
Requests as percentage
Number of requests
2015-16
2016-17
2015-16
2016-17
Closed within the statutory deadline including extensions
80.4%
80.4%
56,370
52,824
Closed in deemed refusal
19.6%
19.6%
13,709
12,889
Total
100.0%
100.0%
70,079
65,713
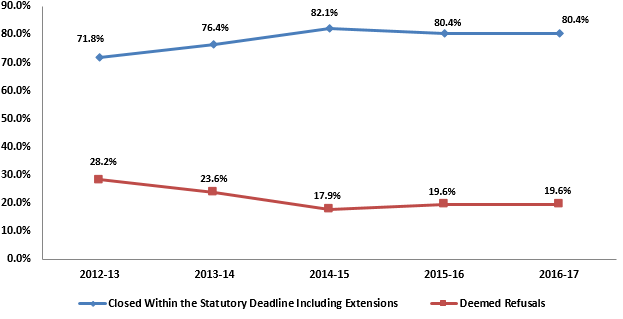
Figure 09: Privacy Act requests closed within established timelines, 2012-13 to 2016-17Figure 09: Text version
This table compares the status of requests closed in the last five years, from 2012 to 2017. Data is shown in percentages.
Status of closed request
2012-13
2013-14
2014-15
2015-16
2016-17
Closed Within the Statutory Deadline Including Extensions
71.8%
76.4%
82.1%
80.4%
80.4%
Deemed Refusals
28.2%
23.6%
17.9%
19.6%
19.6%
Reasons for deemed refusals See table 16 note 1 regarding closed Privacy Act requests
Total number of requests closed past the statutory deadline or not within the time frame covered by an extension (deemed refusal)
The information in this table reflects requests that were neither closed in the initial 30 days nor closed within the time period covered by an extension. These requests are referred to as “deemed refusals.”
Number of days past deadline for Privacy Act requests closed in deemed refusal
Number of days past deadline
Number of requests past deadline where no extension was taken
Number of requests past deadline where an extension was taken
Total deemed refusals
Total as percentage
1 to 30 days
3,993
504
4,497
34.89%
31 to 60 days
1,229
223
1,452
11.26%
61 to 120 days
1,922
274
2,196
17.04%
121 to 180 days
1,143
174
1,317
10.22%
181 to 365 days
912
441
1,353
10.50%
More than 365 days
940
1,134
2,074
16.09%
Total
10,139
2,750
12,889
100.0%
Disposition
Records were disclosed either in full or in part for 68.4 percent of closed requests. This is an 11.3 percent relative decrease, as compared with the previous period.
Disposition of closed Privacy Act requests: 2015-16 and 2016-17
Disposition of closed requests
Requests as percentage
Number of requests
2015-16
2016-17
2015-16
2016-17
All disclosed
25.1%
25.0%
17,577
16,426
Disclosed in part
47.2%
43.4%
33,093
28,524
All exempted
0.7%
0.6%
483
404
All excluded
0.0%
0.0%
11
6
No records exist
15.4%
20.4%
10,759
13,398
Request abandoned
10.6%
10.0%
7,418
6,595
Neither confirmed nor denied
1.1%
0.5%
738
360
Total
100.0%
100.0%
70,079
65,713
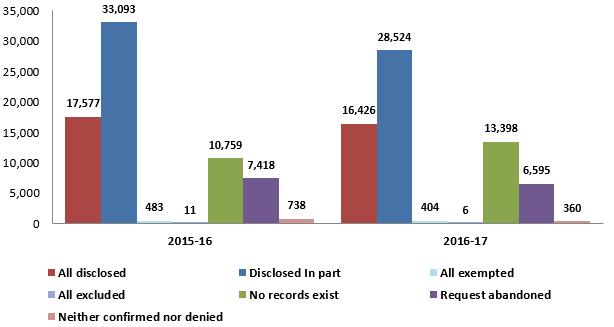
Figure 10: Disposition of closed Privacy Act requests: 2015‒16 and 2016-17Figure 10: Text version
This table compares the disposition of closed requests from the 2015-16 reporting period with the disposition of those for the 2016-17.
Disposition of closed requests
2015-16
2016-17
All disclosed
17,577
16,426
Disclosed in part
33,093
28,524
All exempted
483
404
All excluded
11
6
No records exist
10,759
13,398
Request abandoned
7,418
6,595
Neither confirmed nor denied
738
360
Complexity
In 2016-17, government institutions processed about 8.2 million pages for closed requests; 73.6 percent were disclosed either in full or in part.
Government institutions undertook outside consultations in 1.3 percent of all closed requests.
Relevant pages processed and disclosed See table 17 note 1 regarding closed Privacy Act requests: 2015-16 and 2016-17
Institutions subject to the Privacy Act may receive and process duplicate records and, in the end, release a single copy of the duplicates to the requestor.
The total number of requests for each reporting period reflects the total number of requests closed in each period with the exception of those categorized as “no records exist” or “neither confirmed nor denied.”
The category “interwoven information” includes requests wherein the relevant records contain personal information about another individual that is blended or intermixed with the personal information of the requester.
Other considerations include requests for the contents of a database, requests to process audio or video recordings, high-profile subject matter, instances in which records are located in another region or country, instances in which the records are in a language other than English or French, etc.
85.6 percent of all extensions taken for closed requests cited paragraph 15(a)(i) of the Privacy Act as a reason for the extension, relating to interference with government operations.
Reasons for and length of extensions regarding closed Privacy Act requests
The “other” category includes consultations with one or more of the following: other federal government institutions, provincial and municipal governments, foreign states, international organizations of states, Aboriginal governments, non-governmental organizations or individuals.
“Consult other institution” refers to a government institution’s recommendation that the institution that consulted them contact additional government institutions subject to the Privacy Act.
The cost to administer the Government of Canada’s privacy program decreased by 2.7 percent to $39.9 million in 2016-17, with the average cost per closed request increasing by 3.8 percent.
Cost of Privacy Act operations: 2015-16 and 2016-17
Cost of operations includes salaries, overtime, goods and services, contracts and all other expenses specific to Access to Information and Privacy offices. Costs associated with time spent by business areas searching for and reviewing records are not included here.
This calculation uses the total cost of operations in the reporting period to obtain the average cost per closed request. However, in actuality, the total cost of operations reflects processing costs of some requests that will be carried over into the next reporting period, in addition to closed requests, so the calculation is an approximation.
Disclosures under subsection 8(2) of the Privacy Act
Subsection 8(1) of the Privacy Act states that “personal information under the control of a government institution shall not, without the consent of the individual to whom it relates, be disclosed by the institution except in accordance with this section.” Subsection 8(2) of the Act, subject to other Acts of Parliament, provides for exceptions where it would be possible for government institutions to disclose personal information without consent.
Disclosures under subsection 8(2) of the Privacy Act
Paragraph 8(2)(e) of the Privacy Act: “Subject to any other Act of Parliament, personal information under the control of a government institution may be disclosed… to an investigative body specified in the regulations, on the written request of the body, for the purpose of enforcing any law of Canada or a province or carrying out a lawful investigation, if the request specifies the purpose and describes the information to be disclosed.”
Paragraph 8(2)(m) of the Privacy Act: “Subject to any other Act of Parliament, personal information under the control of a government institution may be disclosed… for any purpose where, in the opinion of the head of the institution, (i) the public interest in disclosure clearly outweighs any invasion of privacy that could result from the disclosure, or (ii) disclosure would clearly benefit the individual to whom the information relates.”
Requests for correction of personal information and notations
Subsection 12(2) of the Privacy Act provides individuals with the right to request that government institutions correct personal information under their control when the individual believes that it may contain errors or omissions. Alternatively, the individual may request that government institutions attach a notation to the information to reflect any corrections that were requested but not made.
Where the information has been disclosed to other individuals or organizations, government institutions are also required to advise them of the correction or notation.
Requests for correction of personal information
Disposition of received requests
Amount
Requests for correction accepted
18
Notations attached
58
Total
76
Privacy impact assessments
Privacy impact assessments (PIAs) provide a framework to ensure that privacy is considered throughout the design or redesign of programs or service delivery. The PIAs identify the extent to which proposals comply with all appropriate statutes, assist managers and decision makers in avoiding or mitigating privacy risks, and promote informed policy, program and system design choices.
Completed PIAs must be submitted to the Treasury Board of Canada Secretariat as well as to the Office of the Privacy Commissioner.
Number of privacy impact assessments initiated and completed
“Completed” signifies privacy impact assessments that were submitted to both the Office of the Privacy Commissioner and the Information and Privacy Policy Division of the Treasury Board of Canada Secretariat.
Personal Information Banks (PIBs) are descriptions of personal information held by government institutions. The Privacy Act requires that PIBs describe all personal information about individuals that is organized and retrievable by a person’s name or by an identifying number, symbol or other particular assigned only to that person. PIBs must include personal information that has been or is being used, or is available for use, to support a program or activity.
Institution-specific PIBs describe personal information contained in the records of a specific government institution.
Standard PIBs describe personal information found in records created, collected and maintained by most government institutions to support common internal programs and activities, such as communications, travel and employment. They are created by the Treasury Board of Canada Secretariat and government institutions can register against them.
Central PIBs describe personal information about members of the general public as well as current and former employees from all or several government institutions. They are maintained by central government departments and agencies.
Personal information banks
Amount
Number of new institution-specific PIBs registered
8
Number of times standard PIBs were registered against by government institutions See table 24 note 1
55
Number of central PIBs registered
1
Total number of new PIBs registered
64
Number of government institutions registering new PIBs
15
Table 24 Notes
Table 24 Note 1
At the date of this report’s publication, there were 50 standard personal information banks maintained by the Treasury Board of Canada Secretariat.
The statistics that follow reflect the best available data since 1983. The categories have been adjusted in some cases in order to compare data across the years.
Number of Privacy Act requests since 1983
Requests under the Privacy Act
Number of requests
Requests received
1,576,479
Requests closed
1,555,066
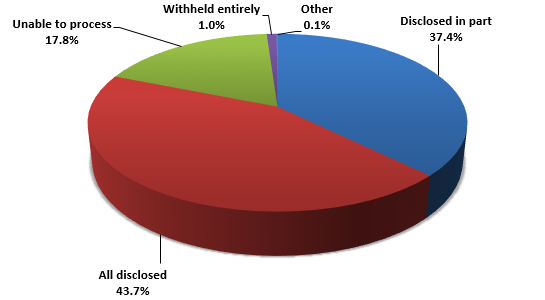
Figure 11: Disposition of Closed Privacy Act requests since 1983Figure 11: Text version
This table identifies the disposition of closed requests since 1983. Data is shown in percentages.
Disposition of closed requests
Requests as percentage
All disclosed
43.7%
Disclosed in part
37.4%
Unable to process
17.8%
Withheld entirely
1.0%
Other
0.1%
In the preceding figure:
“Withheld entirely” includes categories “all exempted” and “all excluded.”
This calculation uses the total cost of operations to obtain the average cost per closed request since 1983. However, in actuality, the total cost of operations reflects processing costs of some requests that will be carried over into the next reporting period, in addition to closed requests, so the calculation is an approximation.
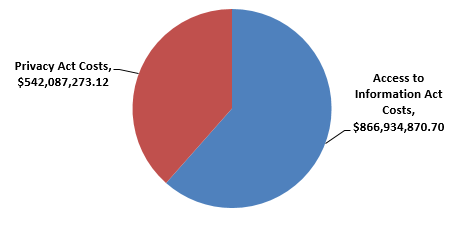
Figure 12: Cost of operations regarding the Access to Information Act vs. the Privacy Act since 1983Figure 12: Text version
This table compares the cost of operations since 1983 relating to the administration of the Access to Information Act across the Government of Canada, with those regarding the Privacy Act.