
Guide to Executive Project Dashboards
Version 3.0
July 2012
Treasury Board of Canada Secretariat
Chief Information Officer Branch
Table of Contents
- 1. Introduction to Executive Project Dashboards
- 2. Overview of Executive Project Dashboard Components
- 3. Project Overview Section
- 4. Project Cost Section
- 5. Financial Summary Section
- 6. Project Schedule Section
- 7. Project Scope / Requests for Change Section
- 8. Project Risk Section
- 9. Project Issues Section
- 10. Project Health Section
- 11. Enquiries and Comments
- 12. Related Policies and Publications
- Appendix : Sample Executive Project Dashboard
1. Introduction to Executive Project Dashboards
1.1 Intended Use and Audience
An executive project dashboard is a business management tool that is used to show, clearly and succinctly, the health and status of a project by means of the following key project metrics: cost, schedule, scope, risks and issues.
The primary audience for executive project dashboards is senior project executives and others who play a governance or oversight role in a project.
1.2 Purpose
The purpose of an executive project dashboard is to generate discussion at senior levels and to draw attention to project areas that might require course correction.
Executive project dashboards are not meant to replace the detailed status reports that project managers and project teams produce and use for their own day-to-day management and reporting. They are designed to communicate key project information and to answer the following questions quickly:
- Is the project on budget, on time and within the original scope?
- If not, what is the effect on the overall project? What corrective actions have been or will be taken?
- What are the critical risks and issues, and what is their effect on the project?
- What actions will be taken or contingency plans put in place to mitigate these risks or to manage these issues?
1.3 Benefits
The benefits of using executive project dashboards include the following:
- Information on project health and status is communicated in a way that is in line with proven industry best practices;
- Risks and issues that may hinder the project's success are clearly visible, which allows for earlier identification of opportunities for course correction; and
- Support can be garnered for evidence-based governance decisions and executive accountability.
1.4 Baseline Project Values
The foundation of an executive project dashboard is a project's baseline values—the planned values for each objective of the project (i.e., cost, schedule and scope) that have been approved by the project's most senior authorities and against which the project will be measured for success. Revising baseline project values involves modifying the project's cost, schedule or scope objectives in order to reflect the change in circumstance.
The Treasury Board of Canada Secretariat (TBS) recommends that revised baseline project values be formally approved by the project's most senior authorities. Once approved, the revised baseline project values become the new baseline values from which variances are determined.
If a project has exceeded its approvals and is operating without authorities, this fact should be communicated as a project issue, and the project issues status indicator should be set to red to signal the critical nature of the issue and the need for immediate attention.
2. Overview of Executive Project Dashboard Components
An executive project dashboard is usually presented in the form of a one-page report that uses displays of data pulled from one or more project reporting tools to provide warnings, action notices, next steps and summaries of project conditions. Dashboards employ graphic devices such as coloured indicator lights and charts to communicate information at a glance.
This guide draws extensively upon industry best practices to detail a suggested format for executive project dashboards, and it can be applied to any such dashboards. The sections that follow contain short descriptions of the recommended components of the dashboard, along with examples from an executive project dashboard used at TBS. The Appendix contains a sample executive project dashboard.
It is recommended that projects led by Government of Canada departments and agencies use the executive project dashboard template and guidance available on Publiservice; projects included in the TBS Chief Information Officer Branch (CIOB) oversight portfolio are required to follow this approach.
3. Project Overview Section
This section provides basic information about the project and the sponsoring organization. This information may include project name, project phase, executive summary and business outcomes. In completing the dashboard, it is helpful to keep in mind the audience for whom the dashboard is intended—senior project executives. Using clear and concise language is important, as is clearly identifying what decision or action, if any, is being sought.
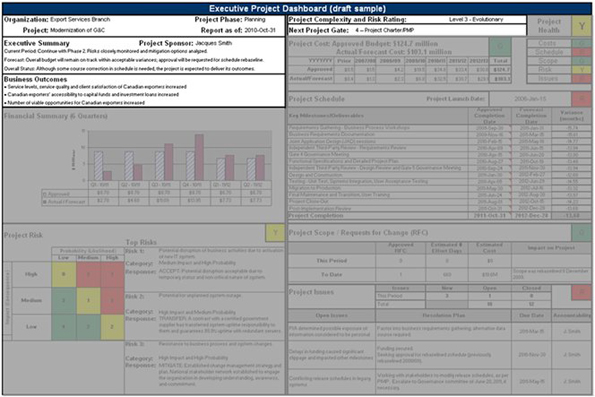
Figure 1 - Text version
The image highlights the Project Overview section of an executive project dashboard tool, in which the user enters high-level data about the project.
4. Project Cost Section
This section identifies the total approved budget and the total actual or forecast cost for the project, as well as a breakdown of those costs by fiscal year. It is recommended that the project budget reported in the dashboard include all expenses and contingencies related to the project.
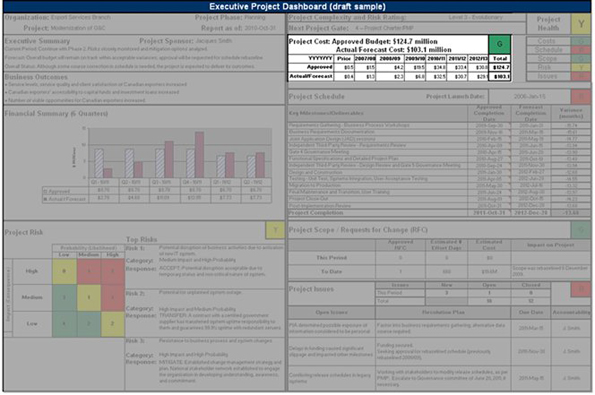
Figure 2 - Text version
The image highlights the Project Cost section of an executive project dashboard. This section contains a budget table that presents the approved and actual/forecast budgets.
4.1 Project Cost Status Indicator
The project cost status indicator is based on the variance between the total approved project budget and the total actual or forecast cost.
TBS uses the following criteria in selecting the appropriate project cost indicator:
 |
Green indicates a variance of less than 10 per cent. The project is expected to be completed within budget. |
 |
Yellow indicates a variance of between 10 and 20 per cent. The project may not be possible within budget. Additional funding or re-profiling may be required. |
 |
Red indicates a variance of over 20 per cent. Project completion may not be possible within budget. Funding decisions are required. |
5. Financial Summary Section
This section provides a visual summary of project costs. A bar graph can be used to show approved versus actual or forecast cost. The example provides a summary for six periods, with the third period being the current quarter. Different cost periods (e.g., months) can be used, depending on the length of the project.
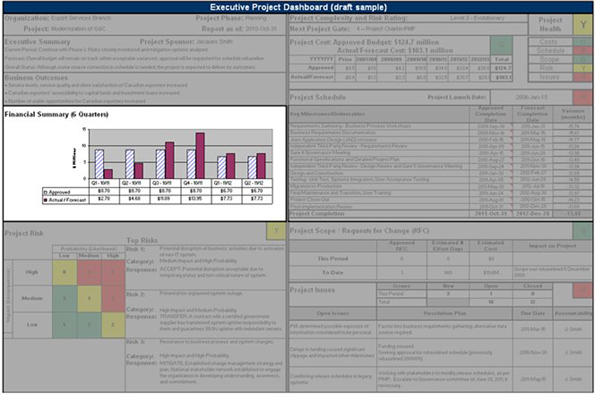
Figure 3 - Text version
The image highlights the Financial Summary section of an executive project dashboard. A comparative bar chart is shown in this section of the dashboard tool. The comparative bar chart presents the project's Approved and Actual/Forecasted expenditures for six quarters.
6. Project Schedule Section
This section identifies the approved (baseline) and forecast completion dates for key milestones or deliverables and the variance between them (sometimes referred to as “slippage”). The focus is on milestones and deliverables for the current phase and on those planned for the next phase.
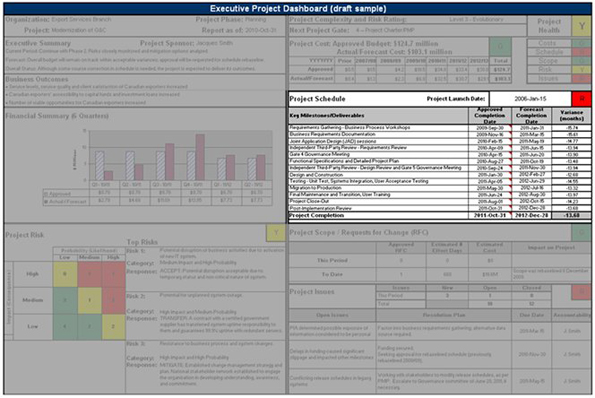
Figure 4 - Text version
The image highlights the Project Schedule section of an executive project dashboard. This section lists the project's major milestones, their approved and forecasted completion dates, as well as the variance between these dates.
6.1 Project Schedule Variance
Project schedule variance is the difference between the approved duration and the forecast duration of the project, based on the most recently approved completion date, the forecast completion date, and the official launch date.
Project duration is the number of days from the launch date to the completion date and is calculated as follows:
Approved duration = (Approved completion date - Official launch date)
Forecast duration = (Forecast completion date - Official launch date)
In the example, schedule variance is expressed in months.
The project launch date is the project’s official start date—the date on which the proposed initiative first received approval from its most senior authorities (e.g., a departmental investment board, Treasury Board) to proceed as a project.
6.2 Project Schedule Status Indicator
The project schedule status indicator is based on the project schedule variance.
For the purpose of determining the project schedule status indicator, project schedule variance is calculated as a percentage of the approved duration, as follows:

For example, a project with an approved duration of 100 working days was recently forecast to require 115 days:
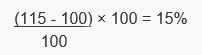
The variance is therefore 15 per cent, which means that the project is 15 per cent behind schedule.
At TBS, the following criteria are applied in determining the project schedule indicator:
|
Green indicates a variance of less than 10%. Project completion is expected within the planned schedule. |
|
Yellow indicates a variance of between 10 and 20%. Project completion may not be possible within the planned schedule. |
|
Red indicates a variance of over 20%. Project completion may not be possible within the planned schedule. Scheduling decisions are required. |
7. Project Scope / Requests for Change Section
Project scope refers to the features and functions that characterize the product, service or result that the project is meant to deliver. For the purposes of executive project dashboards, requests for change are defined as substantive proposals for changes to a project’s scope. They can include changes to the total number of project deliverables or changes to the business requirements for one or more project deliverables.
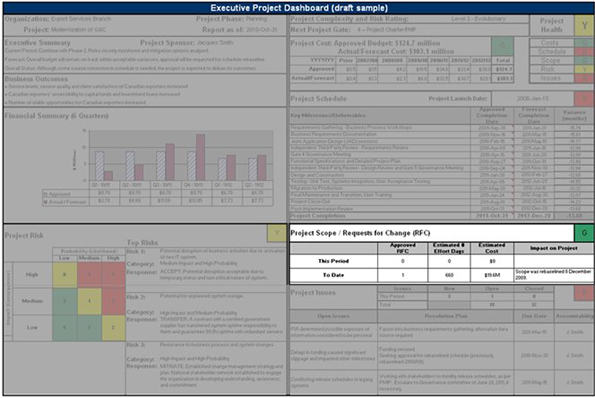
Figure 5 - Text version
The image highlights the Project Scope / Request for Change section of the Executive Project Dashboard. This section lists the number of change requests that could have an impact on the scope and the results of the project.
7.1 Project Scope / Requests for Change Status Indicator
The project scope / requests for change status indicator reflects the impact that changes to scope are having on the project.
TBS uses the following criteria in selecting the appropriate project scope / requests for change indicator:
|
Green indicates that the project is on track. Identified changes are not expected to negatively impact the project's scope, cost or schedule. |
|
Yellow indicates that some course correction may be required. Identified changes may negatively impact the project's scope, cost or schedule. |
|
Red indicates that significant course correction may be required. Identified changes may have a significant negative impact on the project's scope, cost or schedule. |
8. Project Risk Section
This section identifies risks that exist for a project, the likelihood that they will materialize and their anticipated impact on intended project outcomes.
According to the Government of Canada’s Framework for the Management of Risk, "Risk refers to the effect of uncertainty on objectives. It is the expression of the likelihood and impact of an event with the potential to affect the achievement of an organization’s objectives.
" At the project level, risk may relate to elements including scope, schedule and budget.
Figure 6 - Text version
The image highlights the Project Risk section of an executive project dashboard. This section includes a 3x3 colour-coded risk matrix to identify risks by probability and likelihood of occurring.
8.1 Types of Risk
There are two types of risk:
- Inherent risk: The risk that is present prior to the development or application of a risk response (sometimes referred to as a risk management strategy). This type of risk could have a negative impact on the project if no action is taken.
- Residual risk: The risk remaining after a risk response has been implemented. Typically, residual risks are those that have been accepted or that have not been mitigated completely because of cost, schedule or a lack of control.
TBS recommends that both inherent and residual risks be identified and quantified in a risk registry to help track the overall health of the project's risk management practices.
8.2 Project Risk Matrix
This section contains a matrix that provides a high-level view of the inherent risks across the project. The matrix identifies the risks, the probability (likelihood) that they will materialize, and their anticipated impact (consequence) on project scope, schedule, cost or intended business outcomes. It does not include closed risks (risks that no longer have any chance of occurring).
Each risk is classified according to two elements: probability and impact.
- Probability:
-
The probability of a risk occurring is expressed as low (unlikely), medium (likely) or high (very likely) according to the following ranges:
- Low indicates a 1 to 35-per-cent chance that the risk will occur;
- Medium indicates a 35 to 65-per-cent chance that the risk will occur; and
- High indicates a 65-per-cent or higher chance that the risk will occur.
Determining the probability of a risk occurring is often complex and usually relies heavily on the judgment and experience of key management stakeholders (typically a senior-level project manager or executive within the project governance body).
- Impact:
- The potential impact of a risk is designated as low (minor), medium (moderate) or high (major), according to the degree to which the project's scope, schedule or cost could be affected.
The following table and definitions provide a guide to determining the impact of a particular risk:
| Low | Medium | High | |
|---|---|---|---|
Table 1 Notes
|
|||
Cost |
1% to 4% cost overrun |
4% to 7% cost overrun |
More than 7% cost overrun |
Schedule |
Less than 10% varianceSee table 1 note * |
10% to 20% varianceSee table 1 note * |
More than 20% varianceSee table 1 note * |
Scope |
Minor scope areas affected |
Major scope areas affected |
Scope reduction unacceptable to project sponsor |
Risk Impact
- Low: Some limited impact with minimal adverse effect on the project's scope, schedule or cost. No significant impact on overall project delivery.
- Medium: Will noticeably affect the project's scope, schedule or cost. May create a situation where the project's credibility could be somewhat undermined.
- High: Significant negative effect on one or more of the project's scope, schedule or cost. May create a situation where the project's credibility could be seriously undermined.
Although these ratings provide a guideline for risk assessment, judgment is also required, and this may elevate or downgrade the categorization of a risk's impact. For example, if the triggering or realization of a risk causes both a medium impact to cost and a medium impact to schedule, the risk could be classified as high impact.
Risk categorization: Based on the combination of its assessed probability and impact, each inherent risk must be assigned an overall colour (red, yellow or green). The following matrix presents the overall colour categorization of risks once their impact and probability are assessed. Judgment may be applied in determining a risk's categorization.
Example:
Figure 6-1 - Text version
The image highlights a 3x3 colour-coded risk matrix containing 9 cells of potential risks to the project's outcome. The X axis of the matrix identifies whether a risk has a low, medium or high probability or likelihood of occurring. The Y axis of the matrix identifies whether a risk has a low, medium, or high impact or consequence on the project if it were to occur. Three cells, located in the bottom left corner of the matrix, contain the number of low risks and are coloured green. Three cells, in a diagonal line from the top left to the bottom right corner of the matrix, contain the number of medium risks and are coloured yellow. The remaining three cells, located in the top right corner of the matrix, contain the number of high risks and are coloured red.
8.3 Risk Response
There are four ways to respond to managing a risk that has an adverse effect:
- Accept: Accept the risk, usually because the cost of implementing a risk reduction strategy would outweigh the benefits of doing so.
- Avoid: Attempt to avoid the risk even in the planning stage of a project, when the objectives are defined. It may also be appropriate to change or terminate an activity or process to avoid unnecessary risk.
- Transfer: Transfer the risk by paying a contractor or an experienced third party that is well suited to take on the risk in another way.
- Mitigate: Reduce an undesired consequence of the risk and ensure that activity resumes to an acceptable level.
8.4 Top Three Risks
This section identifies the three most critical inherent risks (highest impact and highest probability), indicates how they have been categorized and outlines the response planned for each. Based on these risks, dashboard users can then more easily determine the residual risks that remain after risk responses are implemented.
8.5 Project Risk Status Indicator
Risks may be rolled up into an overall risk status indicator. For TBS purposes in interpreting the overall project risk indicator status, it is the project's residual risks (as identified and quantified in a risk registry) that are considered rather than its inherent risks. If residual risks have not been identified or quantified, this indicator represents the overall status of the project's inherent risks.
TBS interprets the project risk status indicator as follows:
|
Green indicates that the project is on track. The risks are not expected to impact the other project metrics or overall business outcomes. |
|
Yellow indicates that some course correction may be required. One or more identified risks may impact the other project metrics or overall business outcomes. |
|
Red indicates that significant course correction may be required. One or more identified risks may impact the other project metrics or overall business outcomes. |
9. Project Issues Section
This section identifies issues that the project is experiencing. An issue is a critical, unplanned event that has occurred, or is in the process of occurring, that is negatively affecting the project’s objectives (cost, schedule, scope) and that may have a significant impact on intended business outcomes if it is not addressed or resolved by management. An issue may be a risk that has materialized, or it may be something that should be provided by the project but currently is not provided (or is not forecast to be), such as a missing deliverable or a deliverable that is not meeting its specifications.
In this section, the current most critical open issues are identified, along with the intended resolution plan, the due date for resolution and the person accountable for the resolution plan. While only the most critical open issues are displayed in a dashboard, as a best practice, project managers should maintain an open issues log to track all project issues.
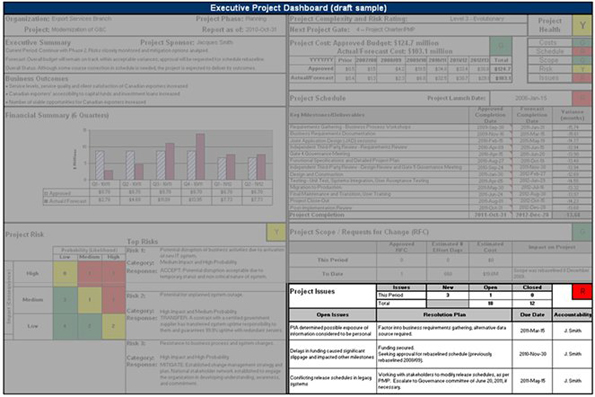
Figure 7 - Text version
The image highlights the Project Issues section of an executive project dashboard. This section lists issues that must be addressed as they might have an impact on the project's intended business outcomes. The text that follows the image explains what is meant by "project issue" and provides examples.
9.1 Issue Versus Risk
An issue differs from a risk in that an issue is something that is already having an adverse effect on one or more of the project's objectives, whereas a risk is a potential future event that could have an adverse outcome on the project's objectives (but is not having that effect now). The purpose of risk management is to effectively anticipate what might happen and find ways to avoid or minimize the chances of it happening, or find ways to avoid or minimize the adverse effects it might have on the project if it does happen. This is different from issue management, which works to minimize the adverse effects of a problem that is already affecting the project. A risk can become an issue once it is triggered and materializes.
Example of a risk: As a result of external job market factors, the project may not be able to maintain the current number of staff in technical job categories, which could lead to slippage in the schedule. In order to mitigate this risk, a 20-per-cent budget contingency is being added to the salaries budget for those categories so that the project can offer financial incentive to prospective candidates, should aggressive hiring be required to maintain staff levels.
Example of an issue: Due to external job market factors, the project has been unsuccessful in maintaining the number of Java developers required. As a result, the schedule is slipping at a rate of five working days per month.
Note that in some project management circles, the term "issue" includes items that are not necessarily having an adverse effect on project outcomes yet. For example, the fourth editition of the Project Management Institute's A Guide to the Project Management Body of Knowledge (PMBOK Guide), 2008, defines an issue as a "point or matter in question or in dispute, or a point or matter that is not settled and is under discussion or over which there are opposing views or disagreements.
" If the issue is not clearly defined or in dispute and is not adversely affecting project outcomes, it need not be reported in the dashboard. In order to distinguish between disputed matters and issues, the project may wish to adopt another term for the former, such as "items for clarification," or track these as action items, not issues.
9.2 Project Issues Status Indicator
The project issues status indicator identifies the severity of the issues being experienced by the project and the degree to which they are being effectively resolved or acted upon. Once a risk materializes, it is considered an issue and is to be reflected in the Project Issues section.
At TBS, the possible project issues indicators are as follows:
|
Green indicates that the project is on track. All identified issues are manageable within the project's scope, cost and schedule. |
|
Yellow indicates that some course correction may be required. One or more of the identified issues are potentially unmanageable within the project's scope, cost or schedule. |
|
Red indicates that significant course correction may be required. One or more of the identified issues are unmanageable within the project's scope, cost or schedule, or the activities undertaken to date to resolve the issue(s) have not been effective. |
10. Project Health Section
This section contains the status indicator for the project as a whole, as well as the status indicators for the health of the various aspects of the project.
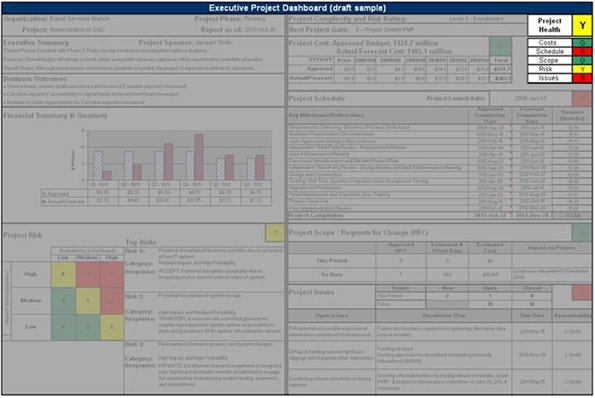
Figure 8 - Text version
The image highlights the Project Health section of an executive project dashboard. This section recaps the status indicators from each section of the dashboard and identifies the overall health of the project based on those indicators.
Two components help determine overall project health: an aggregate of the status indicators and judgment.
10.1 Project Health Aggregate
To determine overall project health, the red, yellow and green indicators that were attributed to project cost, schedule, scope, risk and issues are counted up to arrive at an aggregate project health indicator.
TBS uses the following table to arrive at an aggregate project health indicator:
| Combination of Indicators | Aggregate Indicator |
|---|---|
At least two red indicators |
|
One red indicator and at least one yellow indicator |
|
At least three yellow indicators |
|
One red indicator and four green indicators |
|
Two yellow indicators and three green indicators |
|
Most other permutations |
|
10.2 Judgment
Once the aggregate project health indicator is determined based on the indicators for the various project components, it is adjusted up or down to reflect the realities of the project.
Judgment plays an important role in determining overall health because the five core project metrics (cost, schedule, scope, risks and issues) may be weighted differently, depending on the specific circumstances of a project. This assessment of the overall project health requires input from a senior project manager or executive within the project governance body.
TBS uses the following scale for overall project health:
|
Green indicates that the project is on track. |
|
Yellow indicates that some course correction may be required. |
|
Red indicates that significant course correction may be required. |
11. Enquiries and Comments
IT Project Review and Oversight
Chief Information Officer Branch
Treasury Board of Canada Secretariat
90 Elgin Street
Ottawa, Ontario, Canada
K1A 0R5
Email: itprod-despti@tbs-sct.gc.ca
12. Related Policies and Publications
Treasury Board Policy Instruments
Other Useful Resources
- Dashboard Reporting User Guide (Michigan Department of Information Technology, Strategic Project Office)
- TBS Executive Project Dashboard Tool
- Government of California IT Project Tracking Reports
- Guide to Using the Project Complexity and Risk Assessment Tool
- IT Dashboard (Government of the United States)
Appendix : Sample Executive Project Dashboard
Following is a sample of a completed executive project dashboard template. This dashboard contains metrics for project cost, schedule, scope, risks, issues and overall project health.
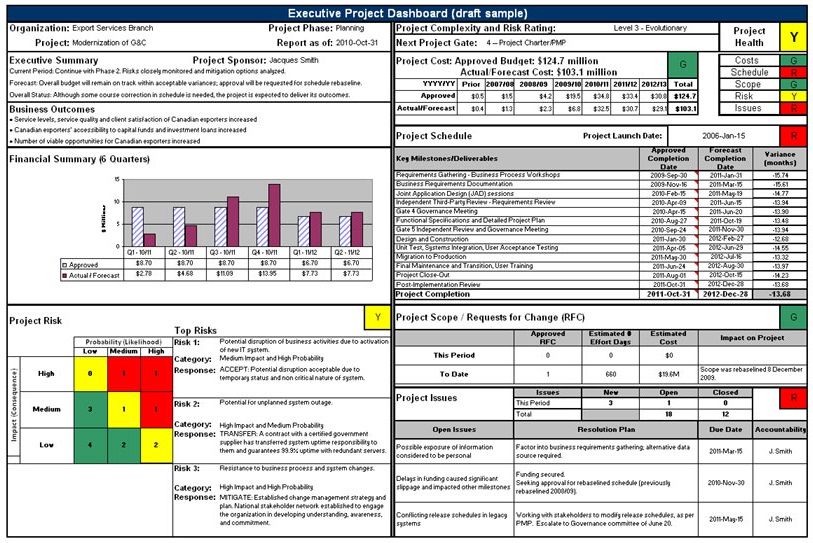
Figure 9 - Text version
This image illustrates a sample of a completed Executive Project Dashboard template.