
Demographic Snapshot of Canada’s Public Service, 2020
Preamble
This snapshot provides key demographics for Canada’s federal public service and supplements the Clerk of the Privy Council’s Twenty-Eighth Annual Report to the Prime Minister on the Public Service of Canada.
The Office of the Chief Human Resources Officer (OCHRO) works in partnership with departments and agencies to access, analyze, and share federal public service workforce data to identify current workforce trends. In the coming year, the public service will aim to recruit and equip the next generation of federal public servants to carry out the Government of Canada’s priorities. In the process, there will be an increased focus on ensuring that the public service is diverse and inclusive and reflects the population it serves.
On this page
- Introduction
- Highlights from 2020
- Part 1: Federal public service
- Part 2: Executives
- Part 3: Highlights from employee surveys
Introduction
This snapshot compares the current workforce with that of the baseline year of 2010. The data in this snapshot is current as of March 31, 2020, unless indicated otherwise.
Part 1 of this document covers all employees of the entire federal public service (the core public administration and separate agencies), and Part 2 focuses on executives. Part 3 provides highlights from the 2020 Public Service Employee Survey and the 2020 Student Exit Survey.
Canada’s federal public service consists of two population segments:
- the core public administration; and
- separate agencies.
The term “core public administration” refers to approximately 70 departments and agencies for which the Treasury Board is the employer. These organizations are listed in Schedules I and IV of the Financial Administration Act. More information on this segment of the population is available in the Interactive data visualization tool.
The term “separate agencies” refers to agencies listed in Schedule V of the Financial Administration Act. Separate agencies conduct their own negotiations and may set their own classification system and compensation levels for their employees.
The principal separate agencies are:
- Canada Revenue Agency;
- Parks Canada;
- Canadian Food Inspection Agency; and
- National Research Council Canada.
Population counts for the following separate agencies are not included because their employee information is not available in the pay system:
- Canadian Security Intelligence Service;
- National Capital Commission;
- Canada Investment and Savings; and
- Canadian Forces Non‑Public Funds.
The federal public service does not include:
- ministers’ exempt staff;
- employees locally engaged outside Canada;
- RCMP regular force members;
- RCMP civilian force members; and
- Canadian Armed Forces members.
Highlights from 2020
In this section
Number of employees
- 300,450 active employees (282,980 in 2010)
- Represents 0.79% of the Canadian population (0.83% in 2010)
Location
- 57.7% of employees are in the regionsFootnote 1 (59.4% in 2010)
- 42.3% of employees are in the National Capital Region (40.6% in 2010)
Employment type
- 83.2% are indeterminate employees (86.2% in 2010)
- 11.0% are term employees (9.1% in 2010)
- 5.8% are casuals and students (4.7% in 2010)
Women
- 55.4% of employees are women (55.2% in 2010)
- 50.3% of executives are women (43.7% in 2010)
Official languages
- 70.9% of employees indicated English as their first official language (71.0% in 2010)
- 29.1% of employees indicated French as their first official language (29.0% in 2010)
Age
- The average age of employees is 43.9 years (43.9 years in 2010)
- The average age of executives is 50.0 years (50.1 years in 2010)
Part 1: Federal public service
In this section
Relative size and spending
Between 2010 and 2020:
- the population of Canada grew from approximately 34.1 million to 38.0 million (an increase of 11.4%)Footnote 2; and
- the number of federal public servants increased from 282,980 to 300,450 (an increase of 6.2%).Footnote 3
The federal public service comprised 0.79% of the Canadian population in 2020. This is well below the ratios in the 1980s and early 1990s, which were very close to 1% and slightly lower than 0.83% in 2010.
Between 2010 and 2020:
- Canada’s real gross domestic product (GDP) increased by 17.8%Footnote 4; and
- real federal program spending increased by 18.3% (in constant dollars)Footnote 5.
Most recently, from the 2018 to 2019 fiscal year to the 2019 to 2020 fiscal year, there was:
- a decrease of 5.4% in real gross domestic product; and
- an increase of 6.0% in real federal program spending.
Since the 2010 to 2015 period, where the workforce decreased in response to budget reductions, there has been an increase in the federal public service workforce.
Figure 1 shows trends in the economy, the Canadian population, real federal program spending and the size of the federal public service, from 2010 to 2020.
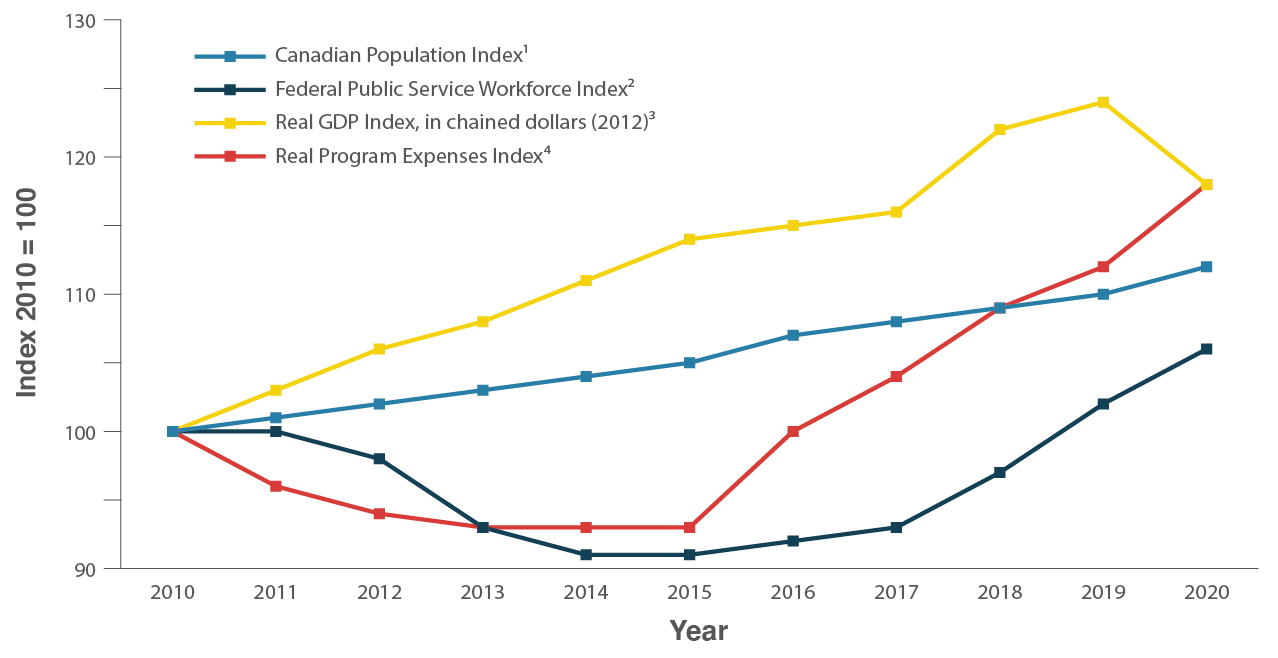
Figure 1 - Text version
| Fiscal Year | Canadian Population Index1 | Federal Public Service Workforce Index2 | Real GDP Index, in chained dollars (2012)3 | Real Program Expenses Index4 |
|---|---|---|---|---|
| 2010 | 100 | 100 | 100 | 100 |
| 2011 | 101 | 100 | 103 | 96 |
| 2012 | 102 | 98 | 106 | 94 |
| 2013 | 103 | 93 | 108 | 93 |
| 2014 | 104 | 91 | 111 | 93 |
| 2015 | 105 | 91 | 114 | 93 |
| 2016 | 107 | 92 | 115 | 100 |
| 2017 | 108 | 93 | 116 | 104 |
| 2018 | 109 | 97 | 122 | 109 |
| 2019 | 110 | 102 | 124 | 112 |
| 2020 | 112 | 106 | 118 | 118 |
Sources: Office of the Chief Human Resources Officer, Treasury Board of Canada Secretariat; Statistics Canada; and Department of Finance Canada (Fiscal Reference Tables).
Diversity in the federal public service
Sex
As shown in Figure 2, in 2020, women made up 55.4% of the federal public service, a 0.2 percentage point increase from 2010. It is also a considerable increase (32.2 percentage points) from 1990.
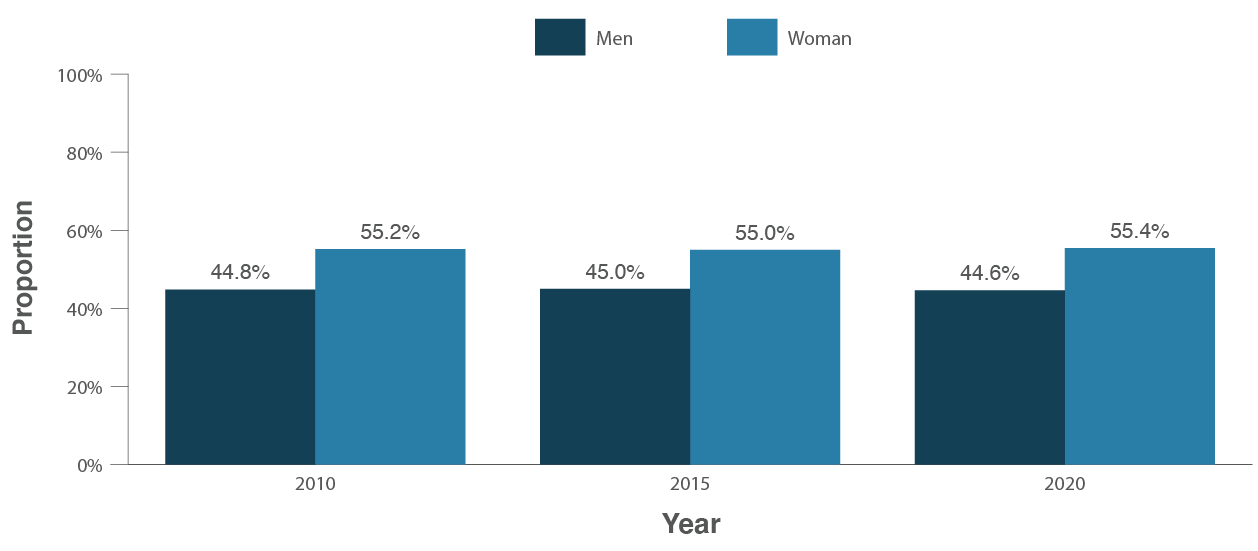
Figure 2 - Text version
| Sex | 2010 | 2015 | 2020 |
|---|---|---|---|
| Women | 55.2% | 55.0% | 55.4% |
| Men | 44.8% | 45.0% | 44.6% |
Source: Office of the Chief Human Resources Officer, Treasury Board of Canada Secretariat.
Technical Notes:
Population: Includes all employment tenures and active employees only (employees on leave without pay are excluded).
The information provided excludes employees of unknown sex and is based on data as of March 31.
Employment equity designated groups
Representation
Figure 3 shows that there have been increases in the representation of women and members of visible minorities in the core public administration since 2016. The increase in representation for women has been modest, while representation rates for members of visible minorities showed a steady increase for the last five consecutive years. However, the representation rates of Indigenous peoples and persons with disabilities in the core public administration decreased slightly over the last five years. As of 2020, representation of three employment equity groups exceed their respective workforce availability with the exception of persons with disabilities. Footnote 6
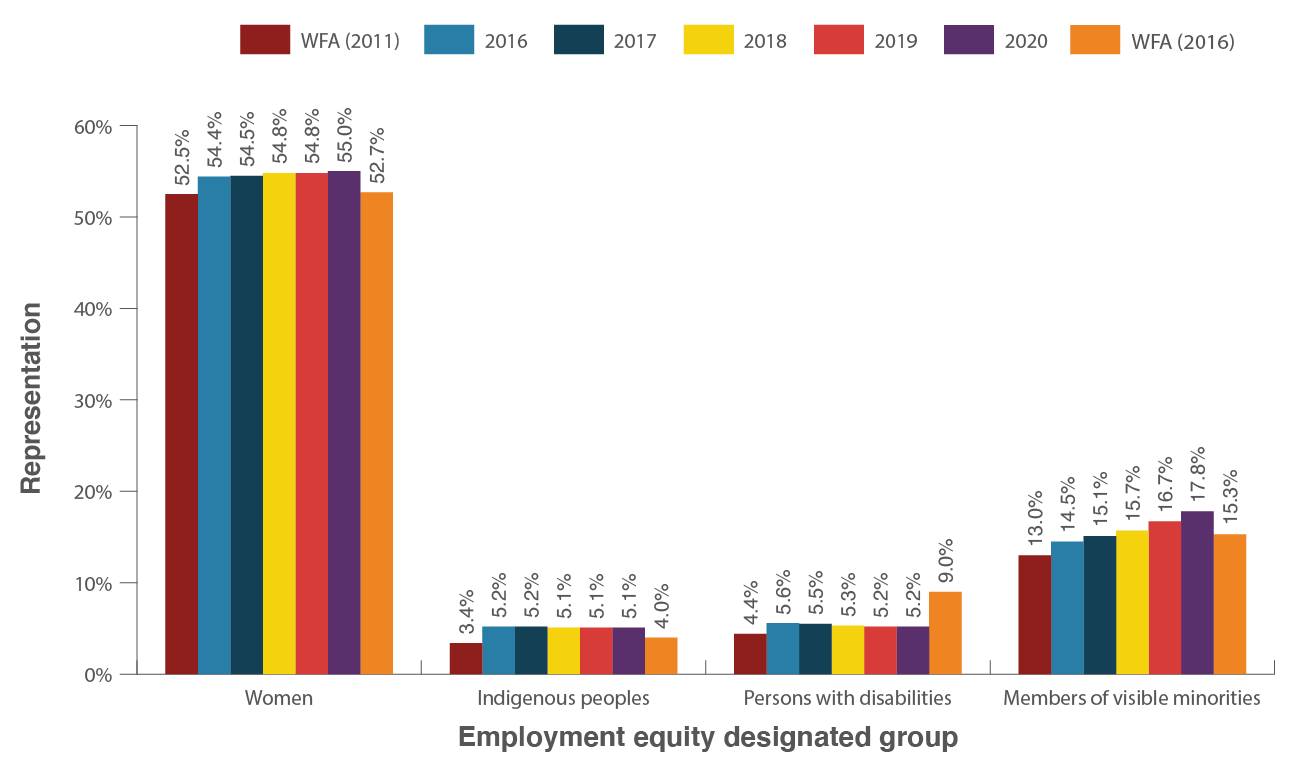
Figure 3 - Text version
| Employment equity designated group | WFA (2011) | 2016 | 2017 | 2018 | 2019 | 2020 | WFA (2016) |
|---|---|---|---|---|---|---|---|
| Women | 52.5% | 54.4% | 54.5% | 54.8% | 54.8% | 55.0% | 52.7% |
| Indigenous peoples | 3.4% | 5.2% | 5.2% | 5.1% | 5.1% | 5.1% | 4.0% |
| Persons with disabilities | 4.4% | 5.6% | 5.5% | 5.3% | 5.2% | 5.2% | 9.0% |
| Members of visible minorities | 13.0% | 14.5% | 15.1% | 15.7% | 16.7% | 17.8% | 15.3% |
Source: Pay System as of March 31st of each year and Employment Equity Data Bank (EEDB).
Population: The information includes indeterminates, terms of three months or more, and seasonal employees of organizations captured under the Financial Administration Act, Schedules I and IV (core public administration). Excluded from this information are employees on leave without pay, terms less than 3 months, students and casual workers, Governor in Council appointees, Ministers’ exempt staff, federal judges and deputy ministers.
The data in this table covers employees identified for the purpose of employment equity in the regulations to the Employment Equity Act.
Technical Notes:
Internal representation for Indigenous peoples, members of visible minorities and persons with disabilities is based on those who have voluntarily chosen to self-identify in one of the respective employment equity groups, while sex information is taken from the pay system.
The 2016 workforce availability estimates (WFA) are based on information from the 2016 Census of Canada and the 2017 Canadian Survey on Disability.
The 2011 workforce availability estimates are based on information from the 2011 National Household Survey and the 2012 Canadian Survey on Disability.
Workforce availability estimates include only Canadian citizens in those occupations in the Canadian workforce that correspond to occupations in the core public administration.
The 2011 WFA is the relevant comparison for 2016, 2017 and 2018 representation data, while the 2016 WFA is the relevant comparison for 2019 and 2020.
Hiring
Figure 4 shows that the proportion of new hires for indeterminate and term positions of three months or more remains above or equal to the current workforce availability of all employment equity designated groups except for persons with disabilities, which remains below the group’s current workforce availability.
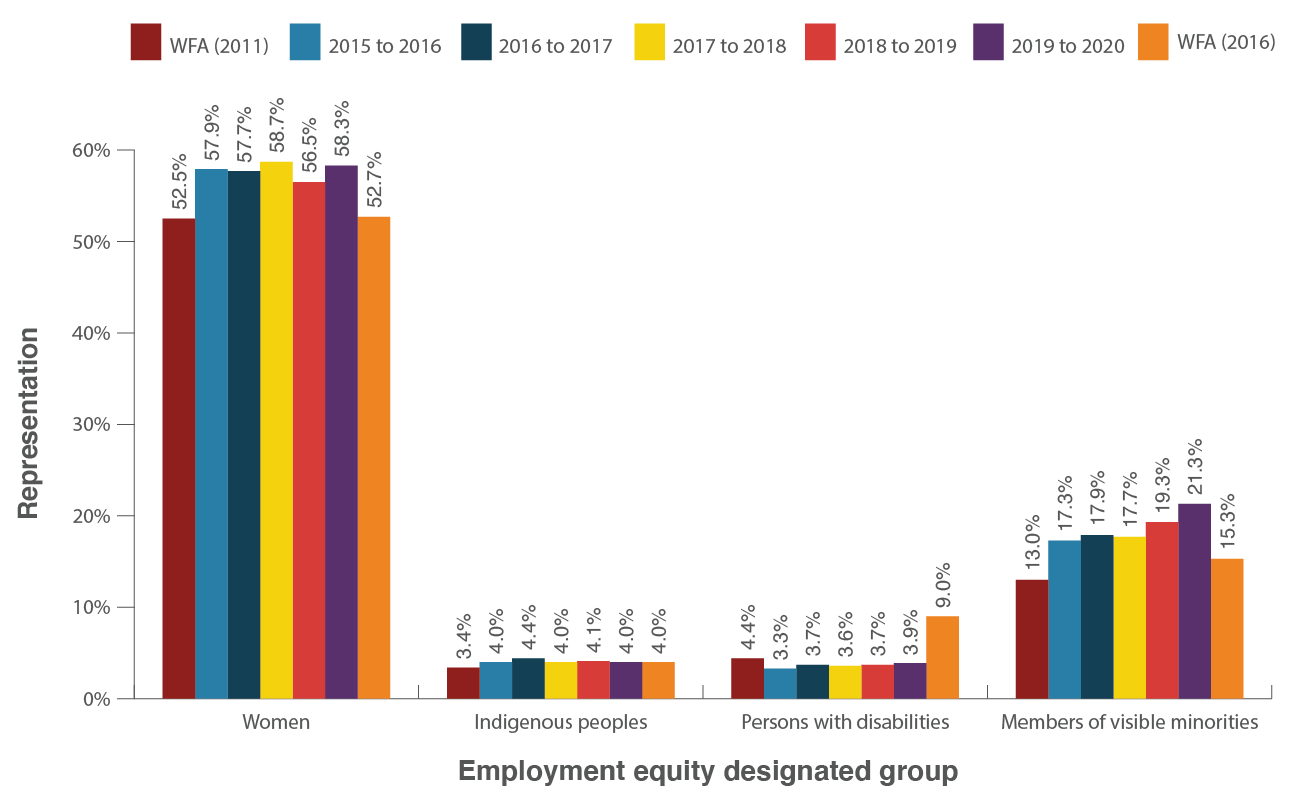
Figure 4 - Text version
| Employment equity designated group | WFA (2011) | 2015 to 2016 | 2016 to 2017 | 2017 to 2018 | 2018 to 2019 | 2019 to 2020 | WFA (2016) |
|---|---|---|---|---|---|---|---|
| Women | 52.5% | 57.9% | 57.7% | 58.7% | 56.5% | 58.3% | 52.7% |
| Indigenous peoples | 3.4% | 4.0% | 4.4% | 4.0% | 4.1% | 4.0% | 4.0% |
| Persons with disabilities | 4.4% | 3.3% | 3.7% | 3.6% | 3.7% | 3.9% | 9.0% |
| Members of visible minorities | 13.0% | 17.3% | 17.9% | 17.7% | 19.3% | 21.3% | 15.3% |
Source: Treasury Board of Canada Secretariat Pay System, Treasury Board of Canada Secretariat Employment Equity Data Bank (EEDB) and the Public Service Commission of Canada’s files on hiring and staffing activities.
Population: The information includes indeterminates, terms of three months or more, and seasonal employees of organizations captured under the Financial Administration Act, Schedules I and IV (core public administration).
Technical Notes:
Internal representation for Indigenous peoples, persons with disabilities and members of visible minorities is based on those who have voluntarily chosen to self-identify in one of the respective employment equity groups, while sex information is taken from the pay system.
“Employees hired” refers to employees who were added to the public service of Canada payroll between April 1 and March 31 of each given fiscal year.
Percentages are that designated group’s share of all hires.
The 2016 workforce availability estimates (WFA) are based on information from the 2016 Census of Canada and the 2017 Canadian Survey on Disability.
The 2011 workforce availability estimates are based on information from the 2011 National Household Survey and the 2012 Canadian Survey on Disability.
Workforce availability estimates include only Canadian citizens in those occupations in the Canadian workforce that correspond to occupations in the core public administration.
The 2011 WFA is the relevant comparison for 2015 to 2016, 2016 to 2017 and 2017 to 2018 representation data, while the 2016 WFA is the relevant comparison for 2018 to 2019 and 2019 to 2020.
First official language
As shown in Figure 5, the breakdown of federal public servants by first official language in 2020 is almost the same as it was in 2010 and 2015.
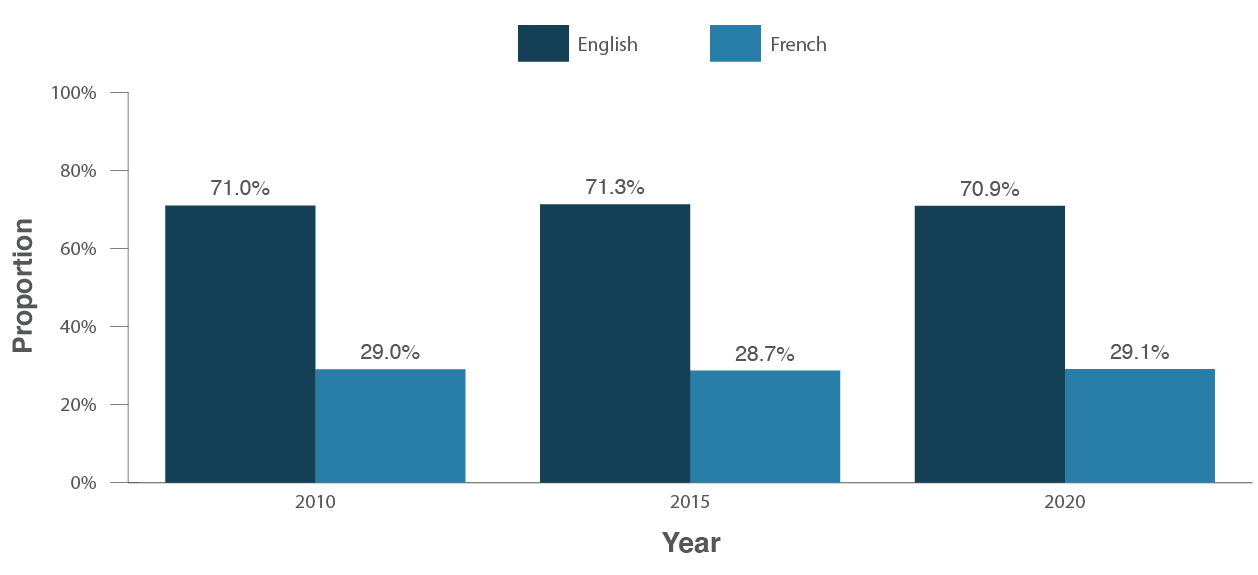
Figure 5 - Text version
| First official language | 2010 | 2015 | 2020 |
|---|---|---|---|
| English | 71.0% | 71.3% | 70.9% |
| French | 29.0% | 28.7% | 29.1% |
Source: Office of the Chief Human Resources Officer, Treasury Board of Canada Secretariat.
Technical Notes:
Population: Includes all employment tenures and active employees only (employees on leave without pay are excluded).
The information provided excludes employees of unknown first official language and is based on data as of March 31.
Age of federal public servants
Figure 6 compares the breakdown of federal public servants in 2010, 2015 and 2020 by age. From 2010 to 2020, the age breakdown changed slightly, with:
- a decreases in the proportion of employees aged 30 to 34 years and those aged 45 to 54 years; and
- an increases in the proportion of employees aged 20 to 29 years, 35 to 44 years and those above the age of 55 years.
The average age of federal public servants increased slightly between 2010 and 2015 (from 43.9 years in 2010, to 45.0 years in 2015) and then decreased between 2015 and 2020 from 45.0 years in 2015 to 43.9 years in 2020.
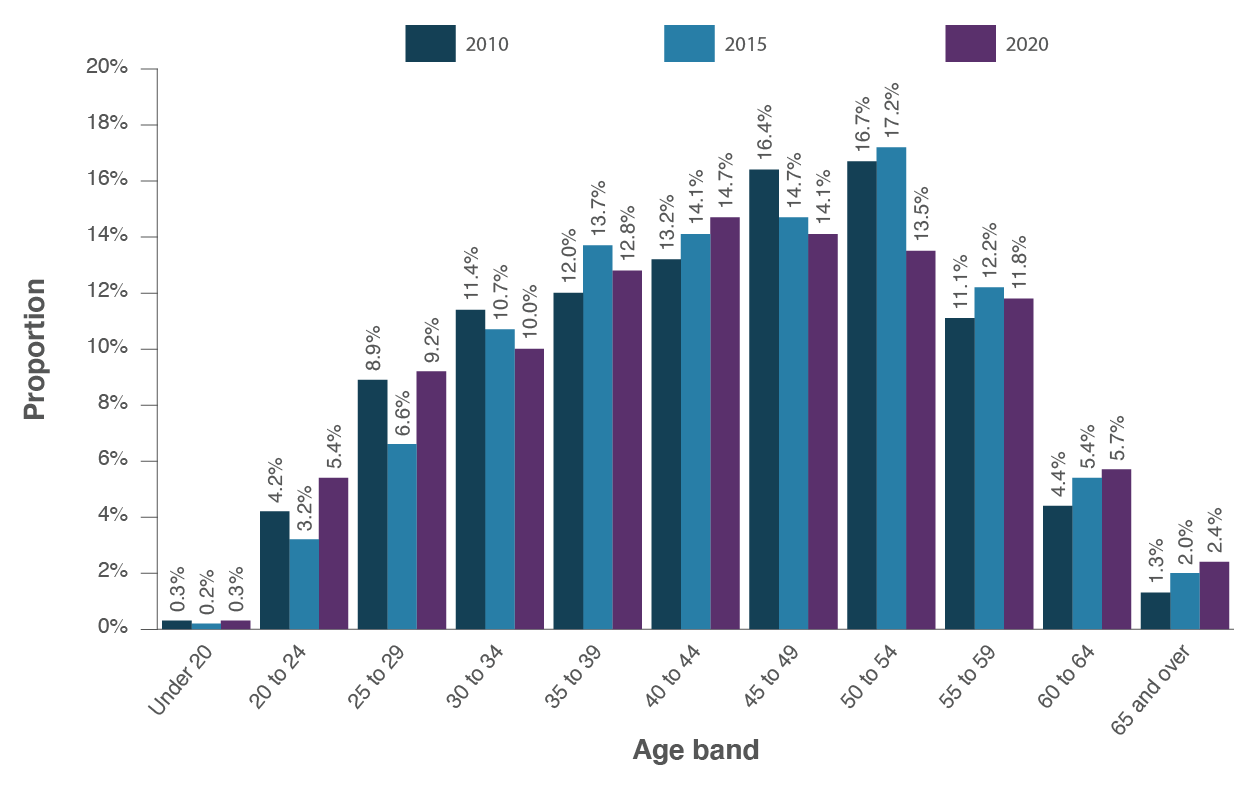
Figure 6 - Text version
| Age band | 2010 | 2015 | 2020 |
|---|---|---|---|
| Under 20 | 0.3% | 0.2% | 0.3% |
| 20 to 24 | 4.2% | 3.2% | 5.4% |
| 25 to 29 | 8.9% | 6.6% | 9.2% |
| 30 to 34 | 11.4% | 10.7% | 10.0% |
| 35 to 39 | 12.0% | 13.7% | 12.8% |
| 40 to 44 | 13.2% | 14.1% | 14.7% |
| 45 to 49 | 16.4% | 14.7% | 14.1% |
| 50 to 54 | 16.7% | 17.2% | 13.5% |
| 55 to 59 | 11.1% | 12.2% | 11.8% |
| 60 to 64 | 4.4% | 5.4% | 5.7% |
| 65 and over | 1.3% | 2.0% | 2.4% |
Source: Office of the Chief Human Resources Officer, Treasury Board of Canada Secretariat.
Technical Notes:
Population: Includes all employment tenures and active employees only (employees on leave without pay are excluded).
The information provided excludes employees of unknown age and is based on data as of March 31.
Figure 7 shows the distribution of federal public servants by generation for 2010, 2015 and 2020. Up until 2015, baby boomers (people born between 1946 and 1966) made up the largest group of federal public servants. However, they are being replaced by Generation Xers (people born between 1967 and 1979) and millennials (people born between 1980 and 2000). Millennials now represent the largest group of public servants (38.4%) followed by Generation Xers (36.8%).
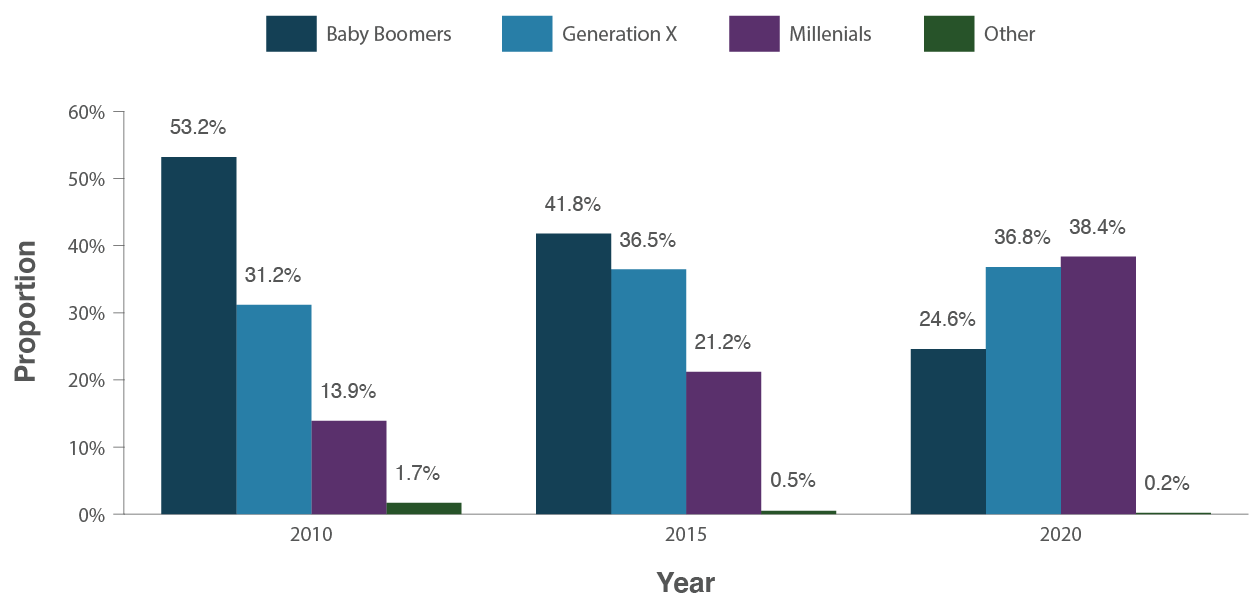
Figure 7 - Text version
| Generation | 2010 | 2015 | 2020 |
|---|---|---|---|
| Baby Boomers | 53.2% | 41.8% | 24.6% |
| Generation X | 31.2% | 36.5% | 36.8% |
| Millennials | 13.9% | 21.2% | 38.4% |
| Other | 1.7% | 0.5% | 0.2% |
Source: Office of the Chief Human Resources Officer, Treasury Board of Canada Secretariat.
Technical Notes:
Population: Includes all employment tenures and active employees only (employees on leave without pay are excluded).
The information provided excludes employees of unknown age and is based on data as of March 31.
Other includes employees who were born in other generations (i.e., the Greatest generation, Traditionalists and Generation Z).
Hiring into the core public administration
Figure 8 shows new indeterminate hiring in the core public administration over time. Indeterminate hiring has been on the rise since the 2012 to 2013 fiscal year. New indeterminate hiring in the core public administration increased by 0.5%, from 19,245 in the 2018 to 2019 fiscal year to 19,333 in the 2019 to 2020 fiscal year.

Figure 8 - Text version
| Generation | 2009 to 2010 | 2010 to 2011 | 2011 to 2012 | 2012 to 2013 | 2013 to 2014 | 2014 to 2015 | 2015 to 2016 | 2016 to 2017 | 2017 to 2018 | 2018 to 2019 | 2019 to 2020 |
|---|---|---|---|---|---|---|---|---|---|---|---|
| Millennials | 5,921 | 4,775 | 3,775 | 1,284 | 2,060 | 3,274 | 4,168 | 6,712 | 9,169 | 12,381 | 13,127 |
| Other | 10,383 | 6,902 | 4,867 | 1,581 | 2,255 | 2,819 | 3,530 | 4,373 | 5,580 | 6,864 | 6,206 |
Source: Office of the Chief Human Resources Officer, Treasury Board of Canada Secretariat.
The hiring of new indeterminate employees who are millennials increased by 3.6 percentage points (from 64.3% in the 2018 to 2019 fiscal year to 67.9% in the 2019 to 2020 fiscal year). During this same period:
- the hiring of new indeterminate employees from the baby boomer generation decreased from 10.1% to 8.7%; and
- the hiring of those who are Generation Xers decreased from 25.5% to 23.2%.Footnote 7
Figure 9 shows the entire age distribution of new indeterminate hires in the core public administration. The median age was 33.6 years.
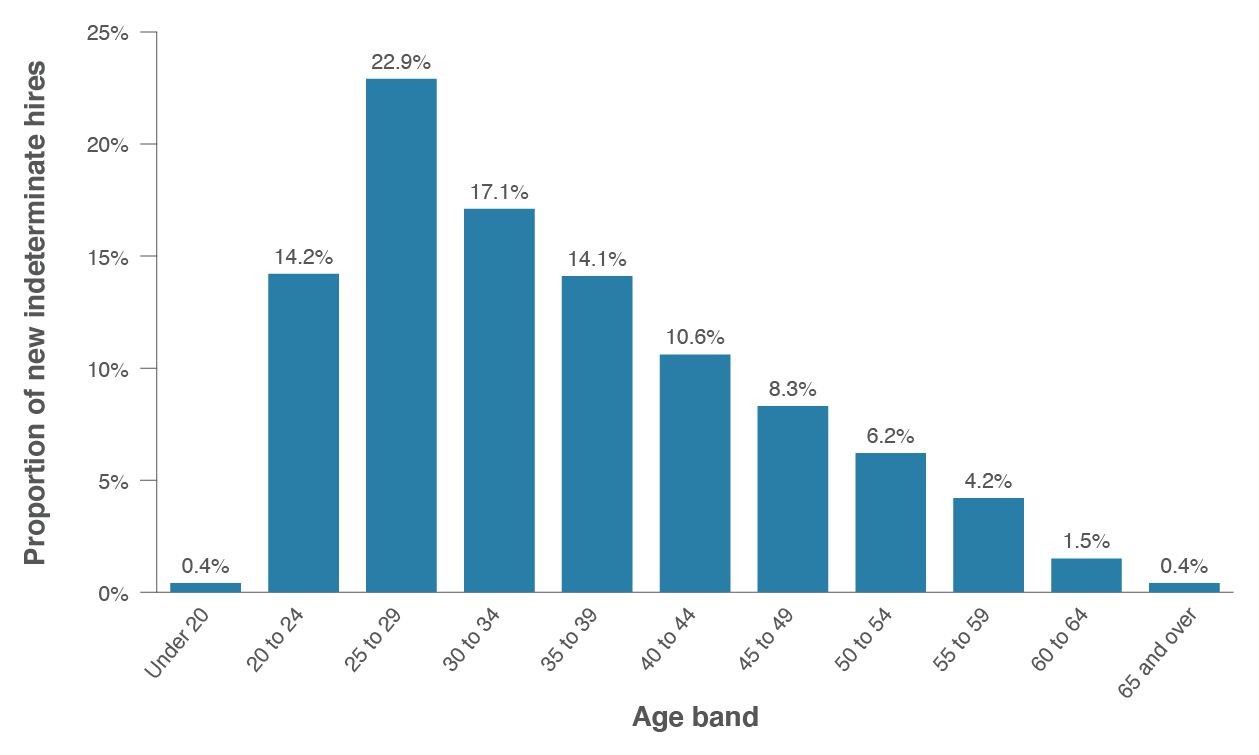
Figure 9 - Text version
| Age band | Proportion |
|---|---|
| Under 20 | 0.4% |
| 20 to 24 | 14.2% |
| 25 to 29 | 22.9% |
| 30 to 34 | 17.1% |
| 35 to 39 | 14.1% |
| 40 to 44 | 10.6% |
| 45 to 49 | 8.3% |
| 50 to 54 | 6.2% |
| 55 to 59 | 4.2% |
| 60 to 64 | 1.5% |
| 65 and over | 0.4% |
Source: Office of the Chief Human Resources Officer, Treasury Board of Canada Secretariat.
Departures from the federal public service
As shown in Figure 10, in the 2019 to 2020 fiscal year, retirements, resignations and all other reasons made up 3.0%, 0.7%, and 0.6% of departures from the federal public service, respectively.
Since the 2012 to 2013 and the 2013 to 2014 period, where the number of departures from the federal public service increased in response to budget reductions, there has been a steady decrease of departures from the federal public service workforce.
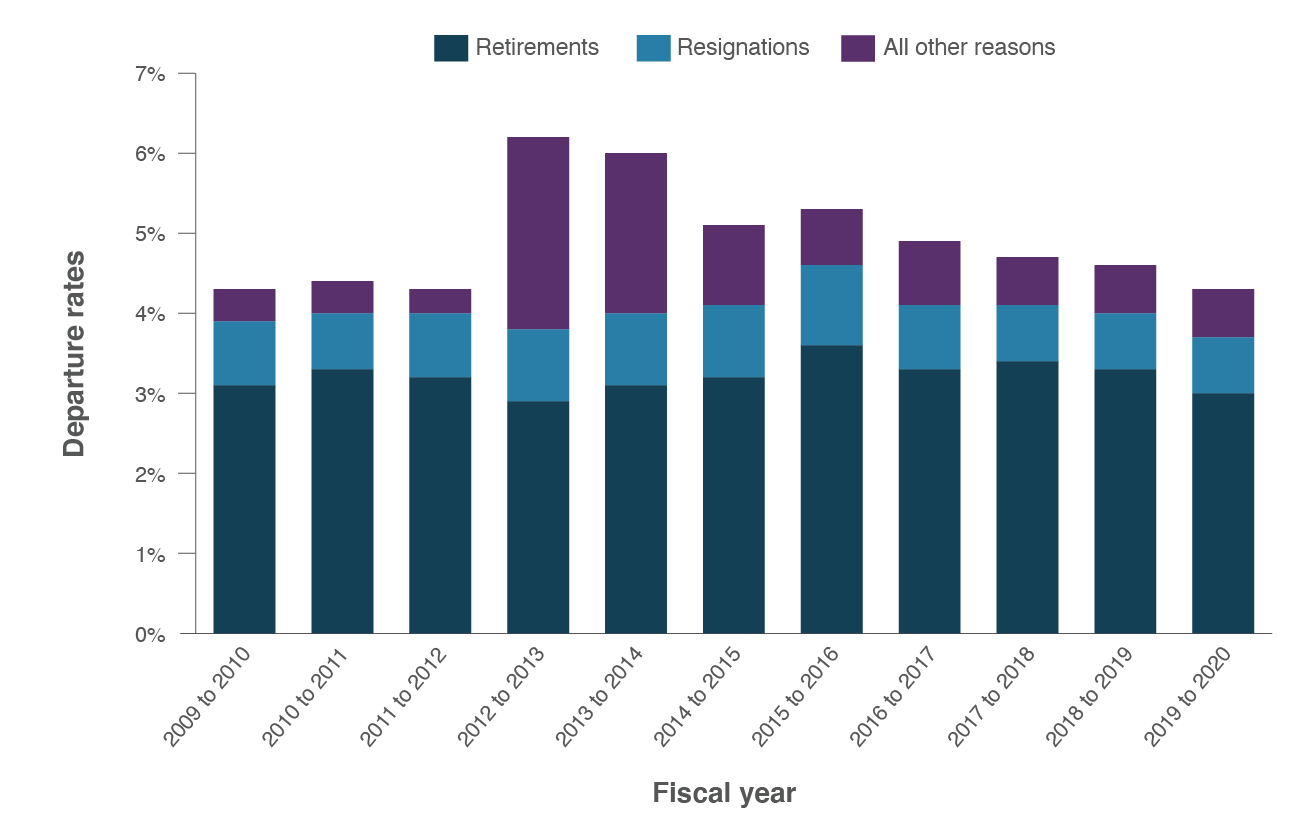
Figure 10 - Text version
| Departure type | 2009 to 2010 | 2010 to 2011 | 2011 to 2012 | 2012 to 2013 | 2013 to 2014 | 2014 to 2015 | 2015 to 2016 | 2016 to 2017 | 2017 to 2018 | 2018 to 2019 | 2019 to 2020 |
|---|---|---|---|---|---|---|---|---|---|---|---|
| Retirements | 3.1% | 3.3% | 3.2% | 2.9% | 3.1% | 3.2% | 3.6% | 3.3% | 3.4% | 3.3% | 3.0% |
| Resignations | 0.8% | 0.7% | 0.8% | 0.9% | 0.9% | 0.9% | 1.0% | 0.8% | 0.7% | 0.7% | 0.7% |
| All other reasons | 0.4% | 0.4% | 0.3% | 2.4% | 2.0% | 1.0% | 0.7% | 0.8% | 0.6% | 0.6% | 0.6% |
Source: Office of the Chief Human Resources Officer, Treasury Board of Canada Secretariat.
Technical Notes:
Population: Indeterminate federal public servants, including employees who departed (retired, resigned or left for other reasons) while on leave without pay.
Knowledge-intensive workforce in the core public administration
In 1990, the public service workforce was composed mainly of clerical and operational workers. Since then, employees undertaking more knowledge-intensive work comprise an ever-increasing share of employees in the core public administration. The cadre of knowledge workers is highly skilled, with significant expertise gained through a combination of education, training and experience. The transformation in work has been in response to:
- an increasingly demanding environment;
- new challenges; and
- technological advances since 2000.
As shown in Figure 11, the five largest knowledge-intensive classification groups in the core public administration are:
- Administrative Services (AS);
- Program Administration (PM);
- Economics and Social Science Services (EC);
- Computer Systems (CS); and
- Engineering and Scientific Support (EG).
In 2020, these classification groups represented 46.5% of the core public administration workforce and in 2010, they represented only 40.7%.
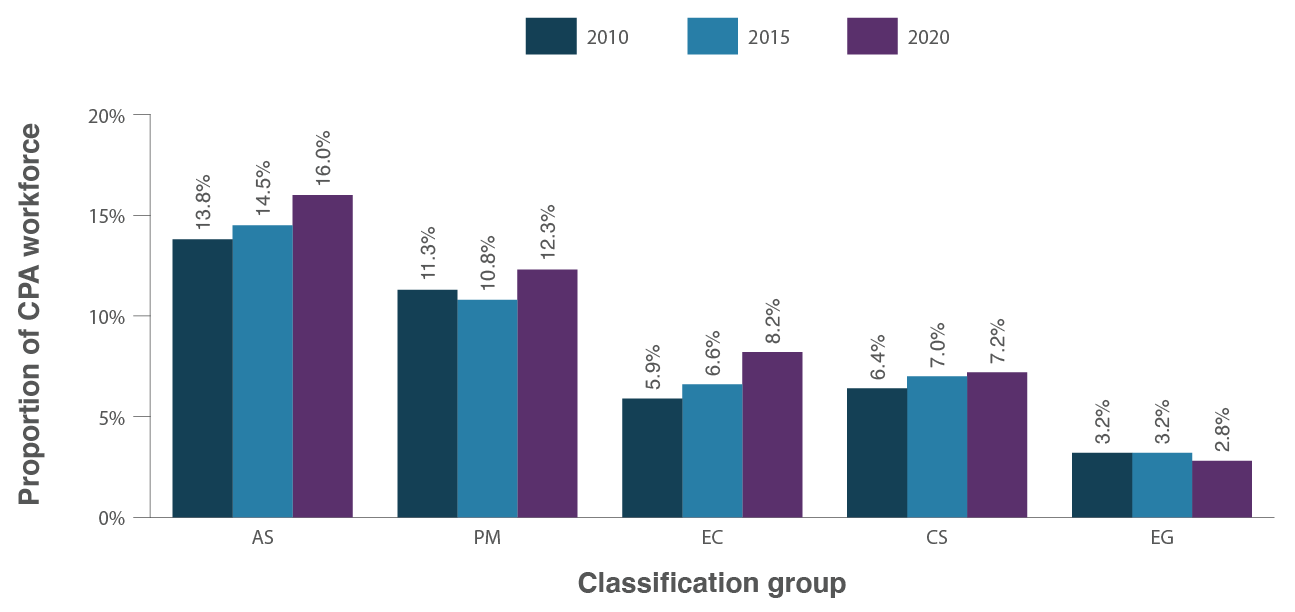
Figure 11 - Text version
| Classification group | 2010 | 2015 | 2020 |
|---|---|---|---|
| AS | 13.8% | 14.5% | 16.0% |
| PM | 11.3% | 10.8% | 12.3% |
| EC | 5.9% | 6.6% | 8.2% |
| CS | 6.4% | 7.0% | 7.2% |
| EG | 3.2% | 3.2% | 2.8% |
Source: Office of the Chief Human Resources Officer, Treasury Board of Canada Secretariat.
Technical Notes:
Population: Includes all employment tenures and active employees only (employees on leave without pay are excluded), based on effective employment classification (acting appointments are included).
The information provided is based on data as of March 31.
On June 22, 2009, the Economics, Sociology and Statistics (ES) and the Social Science Support (SI) classification groups were combined to form the Economics and Social Science Services (EC) classification group.
Part 2: Executives
In this section
This section provides demographic information about the federal public service’s Executive groupFootnote 8.
Typically, assistant deputy ministers (classified as EX-04 and EX-05) fulfill senior leadership functions, providing strategic direction and oversight. Directors, executive directors and directors general (classified from EX-01 to EX-03) fulfill executive functions and are responsible for managing employees.
Population size of the Executive group
As of March 31, 2020, there were 7,376 executives in the federal public service:
- about half of them (50.7%) were EX-01s; et
- only 6.4% were EX-04s and EX-05s.
Between 2010 and 2020, the federal public service executive workforce grew by 6.2%, while the executive population grew by 8.9% over this same period.
Executive diversity
Employment equity designated groups among core public administration executives
Figure 12 illustrates the levels of executive representation in the core public administration for all four employment equity groups from 2016 to 2020.
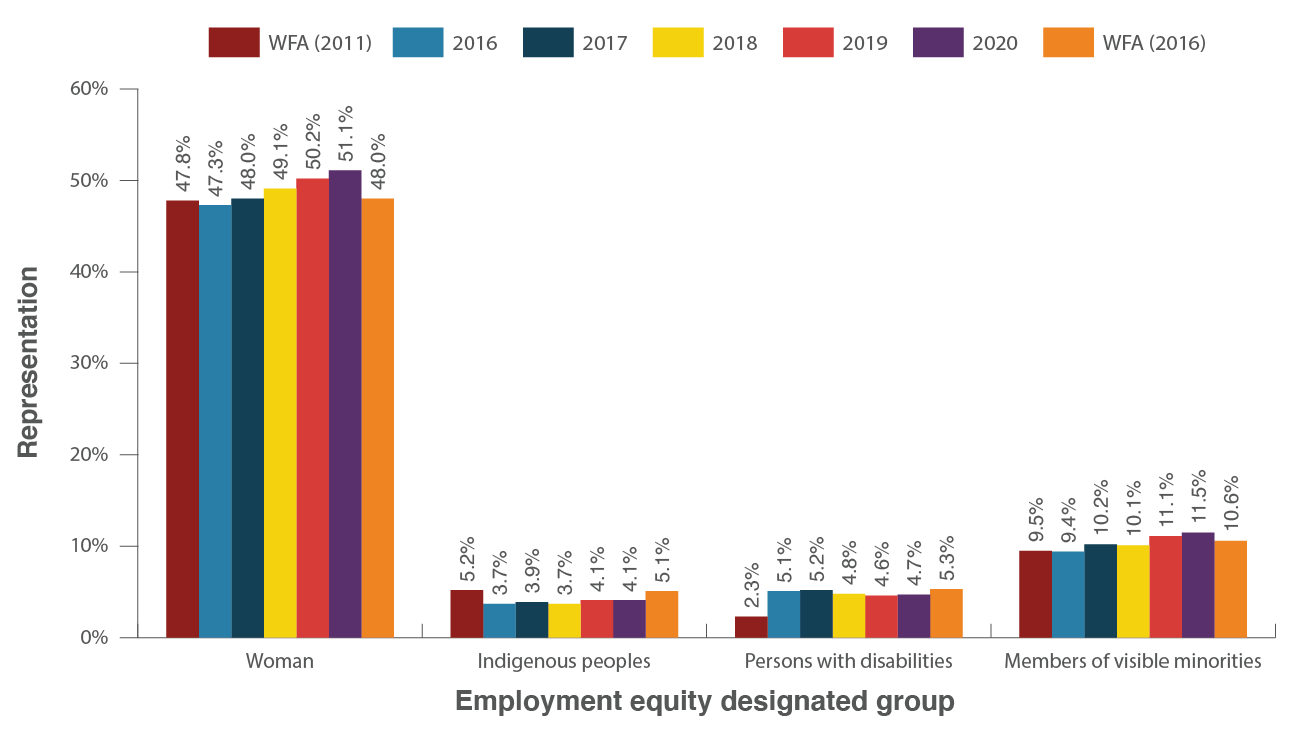
Figure 12 - Text version
| Employment equity designated group | WFA (2011) | 2016 | 2017 | 2018 | 2019 | 2020 | WFA (2016) |
|---|---|---|---|---|---|---|---|
| Women | 47.8% | 47.3% | 48.0% | 49.1% | 50.2% | 51.1% | 48.0% |
| Indigenous peoples | 5.2% | 3.7% | 3.9% | 3.7% | 4.1% | 4.1% | 5.1% |
| Persons with disabilities | 2.3% | 5.1% | 5.2% | 4.8% | 4.6% | 4.7% | 5.3% |
| Members of visible minorities | 9.5% | 9.4% | 10.2% | 10.1% | 11.1% | 11.5% | 10.6% |
Source: Pay System as of March 31st of each year and Employment Equity Data Bank (EEDB).
Population: The information includes indeterminates, terms of three months or more, and seasonal employees of organizations captured under the Financial Administration Act, Schedules I and IV (core public administration). Excluded from this information are employees on leave without pay, terms of less than 3 months, students and casual workers, Governor in Council appointees, Ministers’ exempt staff, federal judges and deputy ministers.
The data in this table covers employees identified for the purpose of employment equity in the regulations to the Employment Equity Act.
Technical Notes:
Internal representation for Indigenous peoples, persons with disabilities and members of visible minorities is based on those who have voluntarily chosen to self-identify in one of the respective employment equity groups, while sex information is taken from the pay system.
Law Management (LC) has been included as part of the Executive workforce since 2011 to 2012 fiscal year.
The 2016 workforce availability estimates (WFA) are based on information from the 2016 Census of Canada and the 2017 Canadian Survey on Disability.
The 2011 workforce availability estimates are based on information from the 2011 National Household Survey and the 2012 Canadian Survey on Disability.
Workforce availability estimates include only Canadian citizens in those occupations in the Canadian workforce that correspond to occupations in the core public administration.
The 2011 WFA is the relevant comparison for 2016, 2017 and 2018 representation data, while the 2016 WFA is the relevant comparison for 2019 and 2020.
In 2020, the core public administration representation levels for women and members of visible minorities in the executive category met their respective workforce availability, while representation of Indigenous peoples and persons with disabilities fell short of their respective workforce availability, as shown in Figure 12.
Compared with 2019, the representation levels of designated groups at the executive level remained the same or saw a modest increase.
First official language of executives
As shown in Figure 13, between 2010 and 2020, the proportion of executives in the federal public service who indicated that French is their first official language increased from 30.1% to 32.9%. Similarly, for the overall federal public service, the comparable figures show a slight increase, from 29.0% in 2010 to 29.1% in 2020.
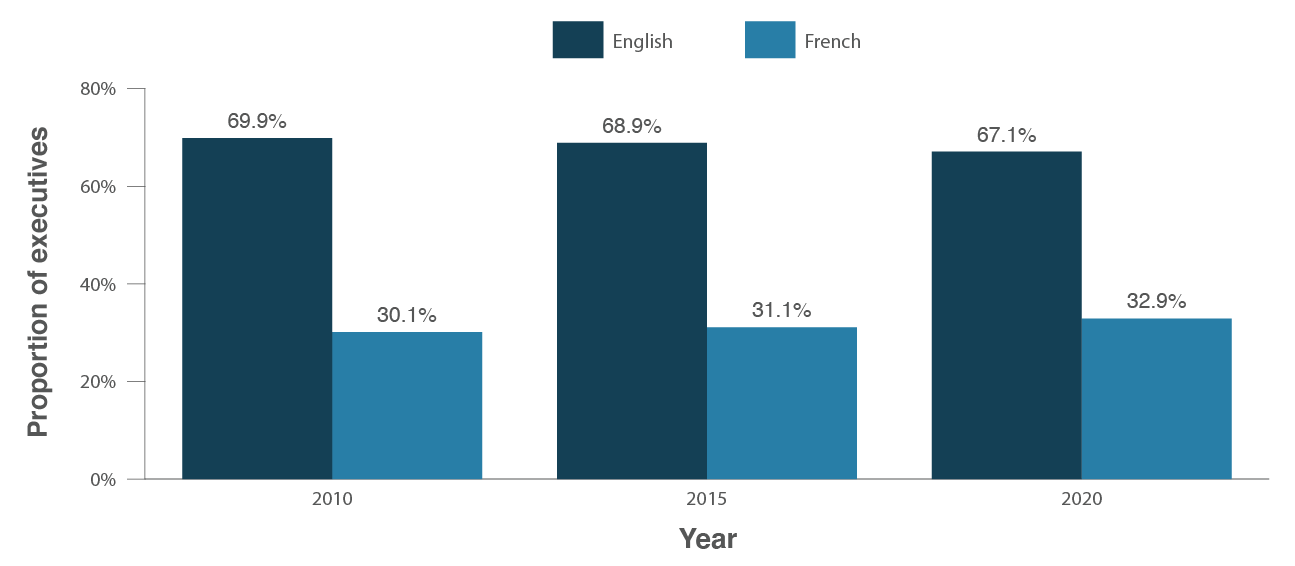
Figure 13 - Text version
| First official language | 2010 | 2015 | 2020 |
|---|---|---|---|
| English | 69.9% | 68.9% | 67.1% |
| French | 30.1% | 31.1% | 32.9% |
Source: Office of the Chief Human Resources Officer, Treasury Board of Canada Secretariat.
Technical Notes:
Population: Includes all federal public service executives, specifically, core public administration executives and their equivalents in separate agencies (such as Executive group (EX) and Management group (MG) classifications) in all tenures (indeterminate, term and casual). It does not include executives on leave without pay or those whose data on first official language is missing.
The information provided is based on data as of March 31.
Age of executives in federal public service
Figure 14 shows the age breakdown of federal public service executives for 2010, 2015 and 2020. The proportion of executives between 40 and 49 years of age and 65 years and older have increased between 2010 and 2020, while the proportion of executives aged 39 and under and between 50 and 64 years of age has decreased.
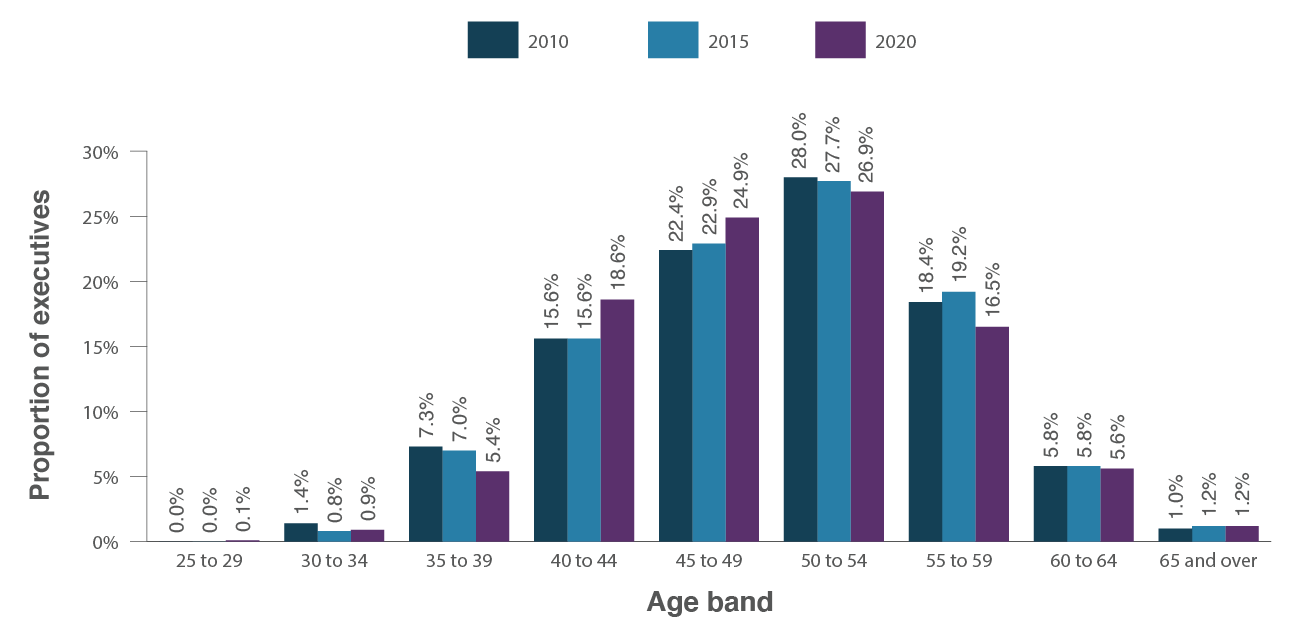
Figure 14 - Text version
| Age band | 2010 | 2015 | 2020 |
|---|---|---|---|
| 25 to 29 | 0.0% | 0.0% | 0.1% |
| 30 to 34 | 1.4% | 0.8% | 0.9% |
| 35 to 39 | 7.3% | 7.0% | 5.4% |
| 40 to 44 | 15.6% | 15.6% | 18.6% |
| 45 to 49 | 22.4% | 22.9% | 24.9% |
| 50 to 54 | 28.0% | 27.7% | 26.9% |
| 55 to 59 | 18.4% | 19.2% | 16.5% |
| 60 to 64 | 5.8% | 5.8% | 5.6% |
| 65 and over | 1.0% | 1.2% | 1.2% |
Source: Office of the Chief Human Resources Officer, Treasury Board of Canada Secretariat.
Technical Notes:
Population: Includes all federal public service executives, specifically, core public administration executives and their equivalents in separate agencies (such as Executive group (EX) and Management group (MG) classifications) in all tenures (indeterminate, term and casual). It does not include executives on leave without pay.
The information provided is based on data as of March 31.
Figure 15 shows that between 2010 and 2020:
- the average age of junior executives at the EX-01 to EX-03 levels in the federal public service remained stable at approximately 50 years of age;
- the average age of senior executives at the EX-04 to EX-05 levels hovered between 53 and 54 years of age; and
- the average age of non-executives hovered between 44 and 45 years of age.
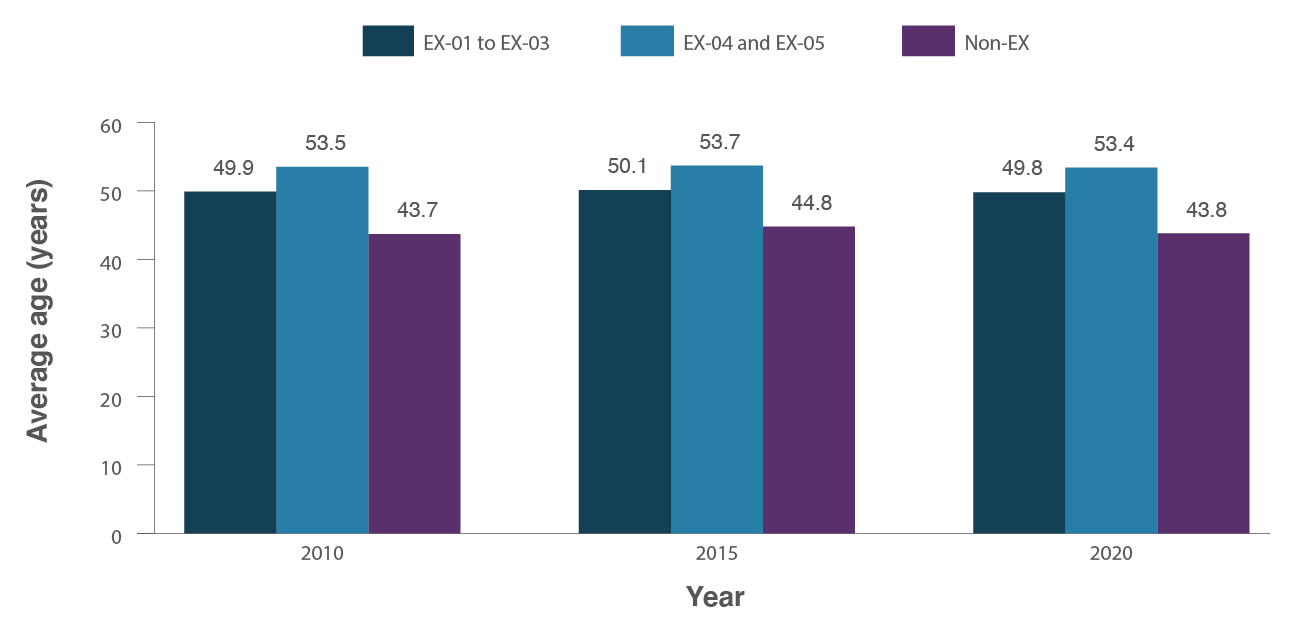
Figure 15 - Text version
| Executive level | 2010 | 2015 | 2020 |
|---|---|---|---|
| EX-01 to EX-03 | 49.9 | 50.1 | 49.8 |
| EX-04 and EX-05 | 53.5 | 53.7 | 53.4 |
| Non-EX | 43.7 | 44.8 | 43.8 |
Source: Office of the Chief Human Resources Officer, Treasury Board of Canada Secretariat.
Technical Notes:
Population: Includes all federal public service executives, specifically, core public administration executives and their equivalents in separate agencies (such as Executive group (EX) and Management group (MG) classifications) in all tenures (indeterminate, term and casual). The population does not include executives on leave without pay.
The information provided is based on data as of March 31.
Part 3: Highlights from employee surveys
In this section
2020 Public Service Employee Survey
The 2020 Public Service Employee Survey (PSES) took place from November 30, 2020 to January 29, 2021. This comprehensive survey measures the federal government employees’ opinions about their engagement, leadership, workforce, workplace, workplace well-being and compensation.
A total of 188,786 employees in 87 federal departments and agencies responded to the 2020 PSES, for a response rate of 61%.
Overall, results for the 2020 PSES were more positive than those for the 2019 survey.
Results show that employees are engaged in their work: 83% of employees indicated that they like their job, up from 81% in 2019.
Perceptions of senior management are more positive than what was found in the 2019 results. In 2020, 68% of employees indicated that they had confidence in senior management, up from 62% in 2019.
The 2020 survey included several new questions to get employees’ perceptions of different aspects of the workplace in relation to the COVID‑19 pandemic:
- 70% of employees indicated that senior managers in their department or agency were taking adequate steps to support their mental health during the pandemic;
- 84% of employees felt that their department or agency was effectively communicating the mental health services and resources that were available to them; and
- 81% of employees indicated that they were satisfied with the measures their department or agency was taking to protect their physical health and safety during the pandemic.
The 2020 results show that employees felt more supported in their career development than they did in 2019. In 2020:
- 73% felt that they got the training needed to do their job, up from 69% in 2019; and
- 61% felt that their organization did a good job of supporting employee career development, up from 57% in 2019.
In response to a new question in 2020, 77% of employees indicated that they felt that their immediate supervisor supported their career goals.
Most employees believe that their workplace is respectful, and the results relating to many aspects of respect in the workplace were better than they were in 2019. 85% of employees indicated that in their work unit, individuals behave in a respectful manner, slightly higher than 2019 (82%).
11% of employees reported harassment on the job in the past 12 months, down from 14% in 2019, and 7% of employees reported discrimination on the job in the past 12 months (8% in 2019).
Overall, results related to the psychological health of the workplace improved from 2019. For example, in 2020:
- 68% of employees indicated that their workplace was psychologically healthy, up from 61% in 2019; and
- 81% of employees indicated that their department or agency was doing a good job of raising awareness of mental health in the workplace, up from 73% in 2019.
In response to a new question in 2020, 69% of employees indicated that they would feel comfortable sharing concerns about their mental health with their immediate supervisor.
For more information, consult the results of the 2020 Public Service Employee Survey.
2020 Student Exit Survey
The Student Exit Survey (SES) is led by the Office of the Chief Human Resources Officer (OCHRO) and has been conducted annually since 2017. The SES was developed to:
- inform recruitment and onboarding strategies;
- contribute to improvements to the student application process; and
- lead to enhancements of student work assignments.
The 2020 SES was conducted from August 10 to September 4, 2020 and included questions related to different stages of the student work term, such as:
- the application process;
- recruitment;
- onboarding and orientation;
- work experience;
- accommodations;
- work environment;
- workplace well-being; and
- pay.
Sixty-eight organizations participated in the survey, yielding 4,272 completed surveys.
Notable improvements were observed from 2019 to 2020.
The largest improvement was observed in the areas of recruitment and onboarding:
- 72% of students were satisfied with the amount of information provided about the job prior to accepting the position (compared to 61% in 2019); and
- 82% of students were satisfied with the overall orientation received about the organization (compared to 74% in 2019).
Large improvements were also observed in student workplace experiences:
- 69% of students agreed that there was a clear work plan in place for the student work term (compared to 61% in 2019); and
- 85% of students agreed that they were given meaningful work (compared to 79% in 2019).
Similarly, there was also improvement in student perception about future employment in the public service:
- 79% would seek a job in their department or agency after completing their studies (compared to 71% in 2019); and
- 88% would recommend to other students that they seek a career in the federal public service (compared to 82% in 2019).
- Results for new questions related to the COVID-19 pandemic were positive:
- 94% of students were satisfied with the measures their department or agency has taken to protect their physical health and safety during the COVID-19 situation; and
- 86% of students agreed that their immediate supervisor supported their mental health and well being during their student job.
It is important that students are provided with a meaningful work experience, not only to present the federal public service as an employer of choice, but also to train and recruit strong candidates that will help shape the future of the public service.
For more information, consult the results of the 2020 Student Exit Survey.