
Workplace well-being

Workplace Well-Being
(PDF, 203 KB)
Text version
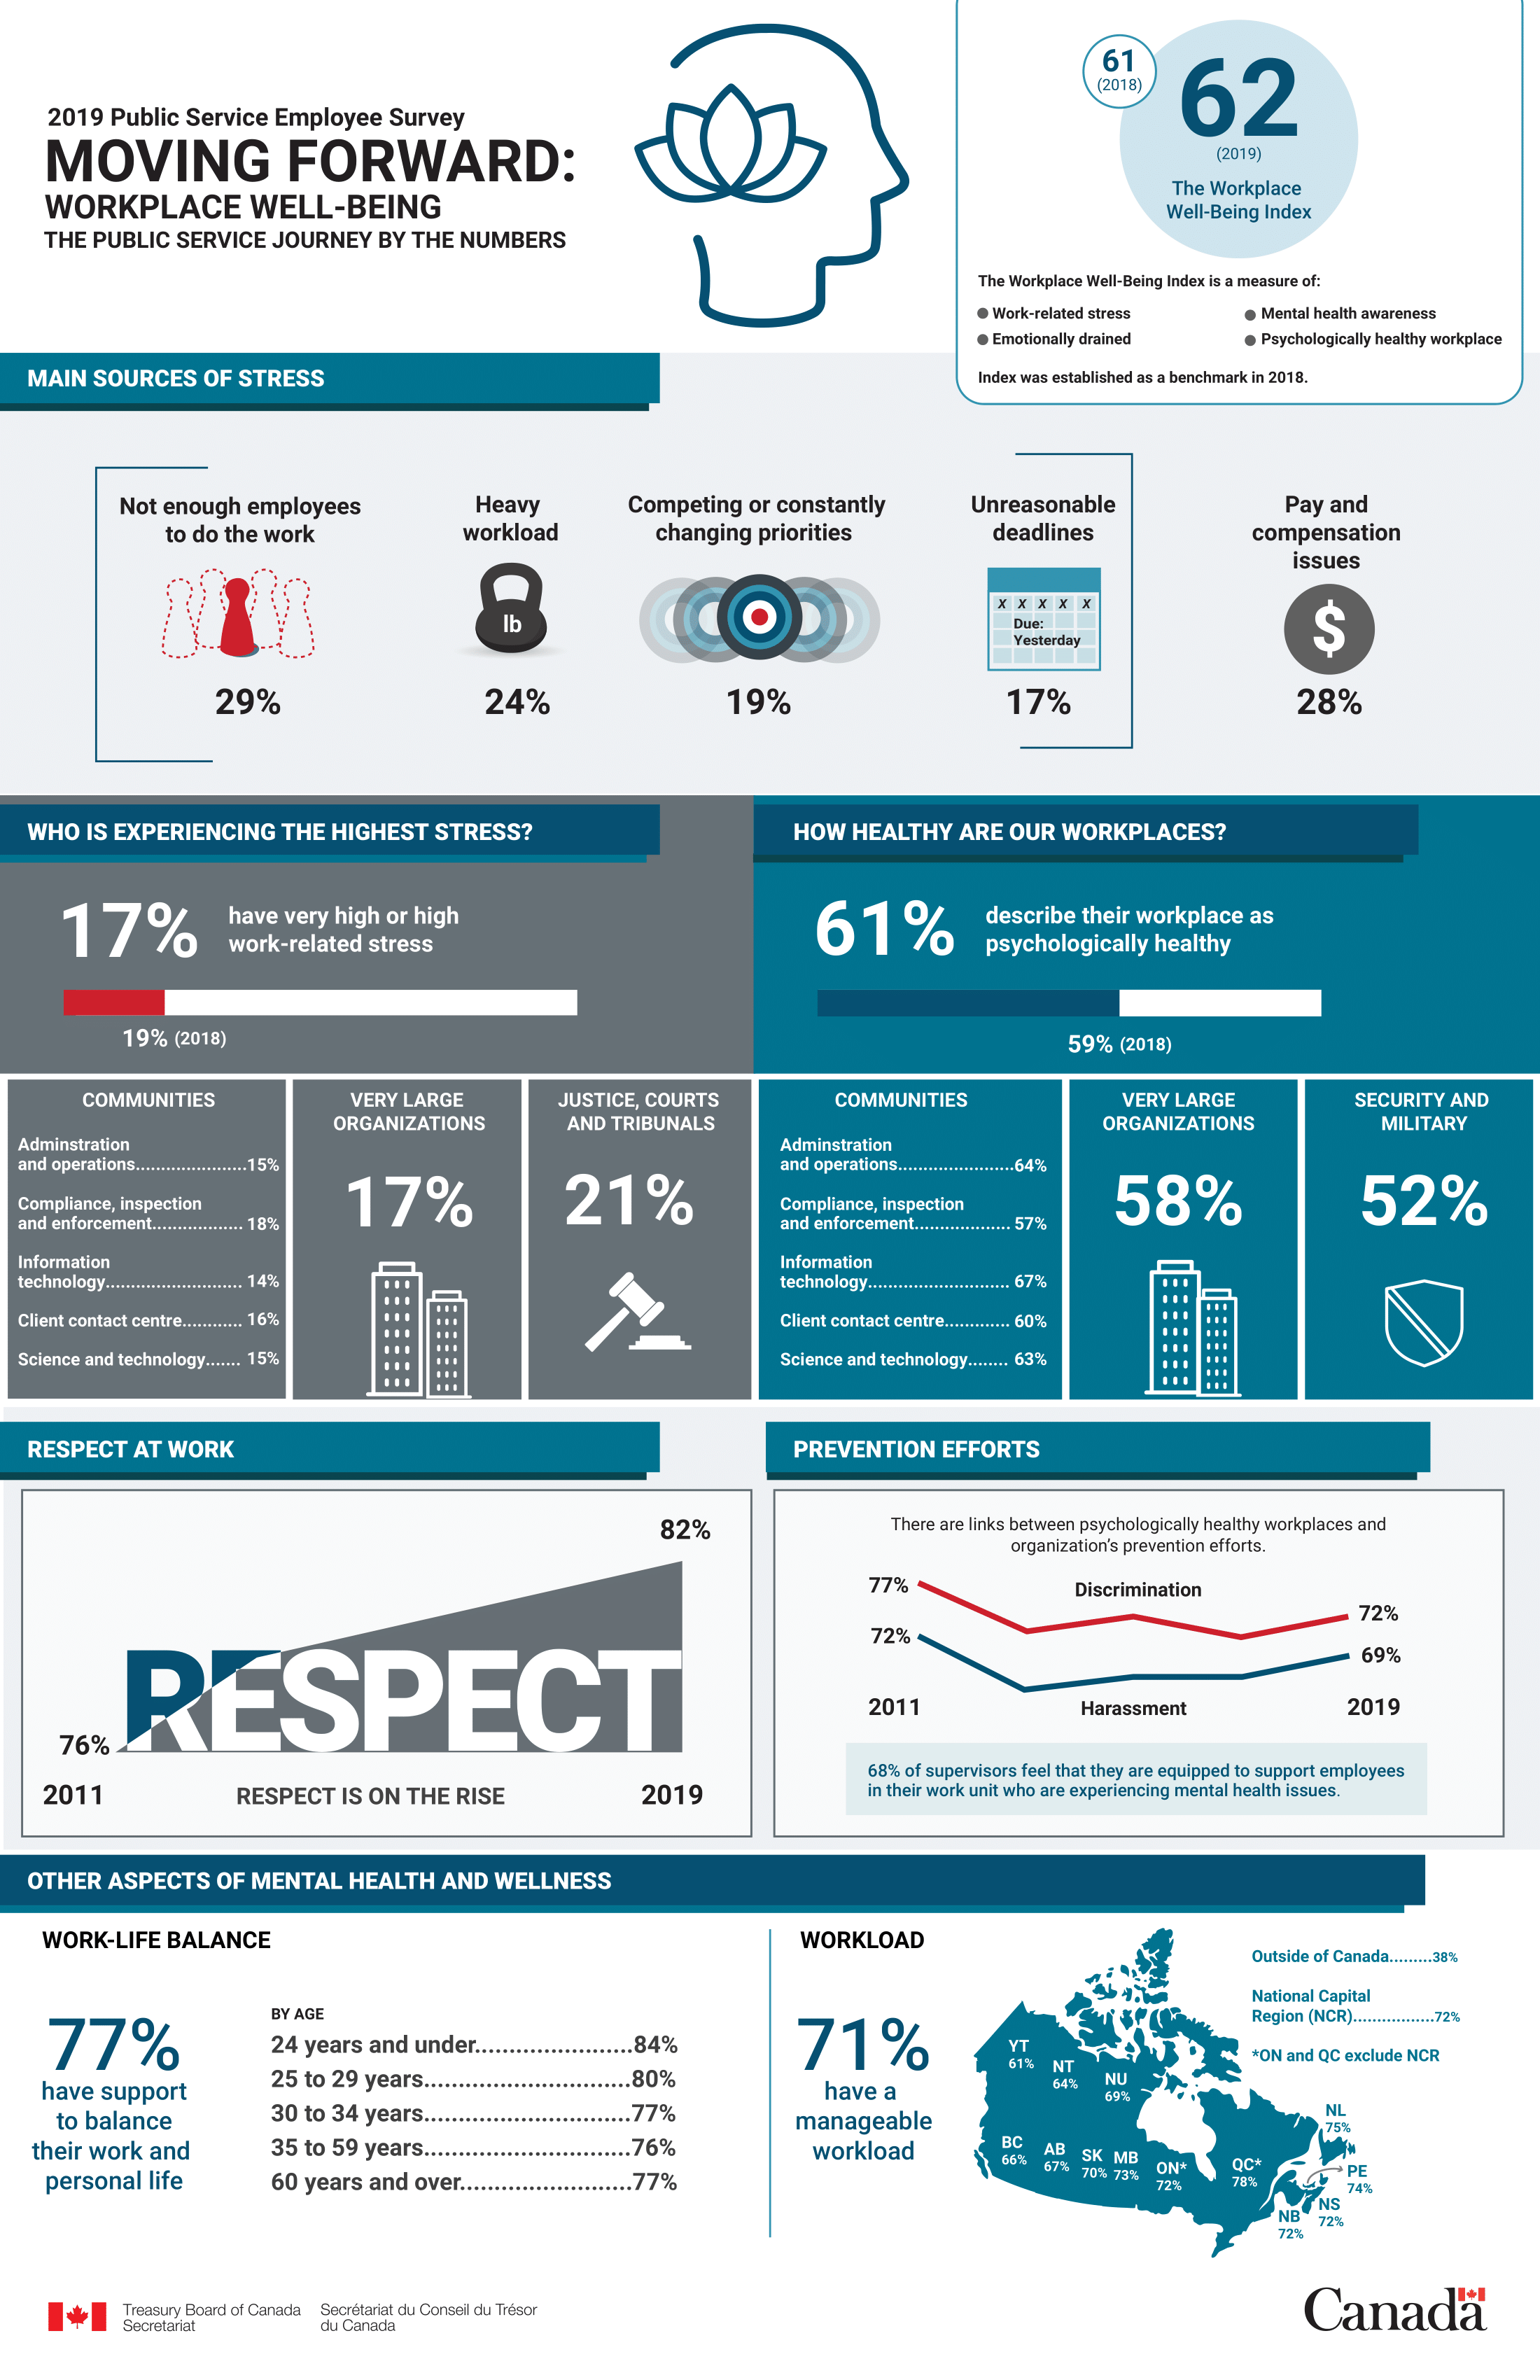
The Workplace Well-Being Index
- 2019: 62
- 2018: 61
The Workplace Well-Being Index is a measure of:
- work-related stress
- emotionally drained
- mental health awareness
- psychologically healthy workplace
Index was established as benchmark in 2018.
Main sources of stress
- Not enough employees to do the work (29%)
- Heavy workload (24%)
- Competing or constantly changing priorities (19%)
- Unreasonable deadlines (17%)
- Pay and compensation issues (28%)
Who is experiencing the highest stress?
- 17% have very high or high work-related stress, 19% in 2018
| Results by communities | Percentage |
|---|---|
| Administration and operations | 15 |
| Compliance, inspection and enforcement | 18 |
| Information technology | 14 |
| Client contact centre | 16 |
| Science and technology | 15 |
- Very large organizations (17%)
- Justice, courts and tribunals (21%)
How healthy are our workplaces?
- 61% describe their workplace as psychologically healthy, 59% in 2018
| Results by communities | Percentage |
|---|---|
| Administration and operations | 64 |
| Compliance, inspection and enforcement | 57 |
| Information technology | 67 |
| Client contact centre | 60 |
| Science and technology | 63 |
- Very large organizations (58%)
- Security and military (52%)
Respect at work
Respect is on the rise
| Year | Percentage |
|---|---|
| 2011 | 76 |
| 2019 | 82 |
Prevention efforts
There are links between psychologically healthy workplaces and organizations’ prevention efforts.
| 2011 | 2019 | |
|---|---|---|
| Discrimination | 77% | 72% |
| Harassment | 72% | 69% |
68% of supervisors feel that they are equipped to support employees in their work unit who are experiencing mental health issues.
Other aspects of mental health and wellness
Work-life balance
- 77% have support to balance work and personal life
| Age | Percentage |
|---|---|
| 24 years and under | 84 |
| 25 to 29 years | 80 |
| 30 to 34 years | 77 |
| 35 to 59 years | 76 |
| 60 years and over | 77 |
Workload
- 71% have a manageable workload
| Region | Percentage |
|---|---|
| Yukon | 61 |
| Northwest Territories | 64 |
| Nunavut | 69 |
| British Columbia | 66 |
| Alberta | 67 |
| Saskatchewan | 70 |
| Manitoba | 73 |
| Ontariotable 6 note * | 72 |
| Quebectable 6 note * | 78 |
| New Brunswick | 72 |
| Nova Scotia | 72 |
| Prince Edward Island | 74 |
| Newfoundland and Labrador | 75 |
| Outside of Canada | 38 |
| National Capital Region (NCR) | 72 |
Table 6 Notes
|
|