
Report on the Public Service Pension Plan for the Fiscal Year Ended March 31, 2014
ISSN 2291-4285
Catalogue No. BT1-13/2014E-PDF
His Excellency the Right Honourable David Johnston, C.C., C.M.M., C.O.M., C.D.,
Governor General of Canada
Excellency:
I have the honour to submit to Your Excellency the Report on the Public Service Pension Plan for the Fiscal Year Ended .
Respectfully submitted,
Original signed by
The Honourable Tony Clement,
President of the Treasury Board
Table of Contents
- Message From the President of the Treasury Board
- Message From the Chief Human Resources Officer
- Introduction to the Public Service Pension Plan
- Year at a Glance, 2013–14
- 2013–14 Highlights
- Demographic Highlights
- Financial Overview
- Communications to Plan Members
- Pension Objective
- Historical Context
- Roles and Responsibilities
- Summary of Plan Benefits
- Financial Statements Content Overview
- Further Information
- Account Transaction Statements
- Statistical Tables
- Financial Statements of the Public Service Pension Plan for the Fiscal Year Ended
- Financial Statements
- Glossary of Terms
- Footnotes
Message from the President of the Treasury Board

The Honourable Tony Clement,
President of the Treasury Board
I am pleased to present the Report on the Public Service Pension Plan for the Fiscal Year Ended . This report provides parliamentarians, public servants and Canadian taxpayers with a regular update on how the government manages the pension plan for employees of the public service of Canada.
In fiscal year 2013–14, the Government of Canada continued to ensure the strength and long-term sustainability of the public service pension plan in a way that is fair to employees and taxpayers.
As we move toward an employer-employee cost-sharing ratio of 50:50, we continue to gradually increase the employees' contribution rates. This is in addition to changing the normal age of retirement for new members to 65, which took effect in January 2013. These changes will save Canadian taxpayers billions of dollars by 2017–18, and millions of dollars every year thereafter.
The Treasury Board of Canada Secretariat continues to support these efforts and is strengthening key elements of its governance practices to help better protect employees and taxpayers.
I am pleased to note that the Auditor General in his 2014 Spring Report confirmed that the Treasury Board of Canada Secretariat is meeting its legislative obligations and is carrying out its responsibilities in respect to the public sector pension plans.
I would like to take this opportunity to thank all of our public service employees for their service to Canadians and for their ongoing support in building Canada's high-performing public service of the future.
Original signed by
The Honourable Tony Clement,
President of the Treasury Board
Message from the Chief Human Resources Officer

Daniel Watson,
Chief Human Resources Officer
I am pleased to present the Report on the Public Service Pension Plan for the Fiscal Year Ended . This report details the continuing progress of the public service of Canada toward becoming an institution that is relevant to Canadians, with modernized tools and practices for the future.
As Chief Human Resources Officer, I am responsible for providing strategic enterprise-wide leadership that supports the basics of sound people management. We are focused on delivering sustainable, holistic and centrally managed pension plans that continue to meet the needs of both employees and employer.
Furthermore, we are committed to addressing the Auditor General's recommendations in relation to the public sector pension plans.
We continue to improve the work we do to help plan members, parliamentarians and Canadians obtain the information and related services they need to make informed decisions about the public service pension plan.
Of note, this year, is the removal of the Superannuation Account from the public service pension plan's financial statements. For many years, management had reported the Superannuation Account as part of "Other Accounts Available for Benefits" in the pension plan's Statement of Financial Position. This change in presentation will provide more reliable and relevant information for the users of the financial statements. There are no financial implications for the Government of Canada or pension plan members resulting from the removal of the account, nor does it impact the government's deficit.
I would like to thank Public Works and Government Services Canada, the day-to-day administrator of the public service pension plan, for its continuing involvement in the compilation of content for the annual report.
Original signed by
Daniel Watson,
Chief Human Resources Officer
Treasury Board of Canada Secretariat
Introduction to the Public Service Pension Plan
The public service pension plan is a contributory defined benefit plan serving more than 507,000 working and retired public service employees. The plan is the largest of its kind in Canada in terms of total membership, covering substantially all of the employees of the Government of Canada, which includes 141 departments and agencies in the federal public service, certain Crown corporations and the territorial governments. The public service pension plan was originally established by the Public Service Superannuation Act of 1954, and it is still governed by that Act. The plan operates differently from a traditional pension plan, since the Government of Canada has a legal obligation to pay benefits.
Year at a Glance, 2013–14
- Total plan membership including active contributors, retired members, survivors and deferred members increased by 1.2 per cent to 570,467 members.
- Active contributors decreased by 0.3 per cent to 299,293 members.
- Retired members increased by 3.2 per cent to 207,495 members.
- Employer and employee cash contributions increased by 4.1 per cent to $4.6 billion.
- Total benefit payments to eligible pension plan members and survivors increased by 6.9 per cent to $6.3 billion.
- The value of the pension obligations increased by 2.5 per cent to $157.6 billion.
- The value of the public service pension plan net assets held by the Public Sector Pension Investment Board. Footnote 1 increased over the past year to $68.2 billion. The investment return for the year was 16.3 per cent, for an investment income of $9.2 billion after expenses.
- The net amount transferred to the Public Sector Pension Investment Board increased by 8.5 per cent to a total of $3.5 billion.
- The average annual pension for new retirees was $35,548, an increase of 5.3 per cent over 2012–13.
- The average pension paid to plan members in 2013–14 was $28,019, an increase of 2.3 per cent over 2012–13.
2013–14 Highlights
The fiscal year ended , included the following highlights:
- Increases to employee pension contributions continued to be phased in so as to eventually reach an employer-employee cost-sharing ratio of 50:50. By increasing employee pension contributions and changing the normal retirement age for new members to 65, which took effect in January 2013, the government ensures that the public service pension plan remains sustainable and financially responsible. These changes will save Canadian taxpayers approximately $700 million annually once they are fully implemented.
- The Office of the Auditor General of Canada conducted a performance audit of public sector pension plans with a focus on the public service pension plan, the Canadian Forces pension plan, and the Royal Canadian Mounted Police pension plan. The audit objective was to determine whether the Treasury Board of Canada Secretariat, National Defence, the Royal Canadian Mounted Police, and the Department of Finance Canada carried out selected key aspects of their governance and management responsibilities. The Auditor General's report confirmed that the government carried out its legislative responsibilities in respect of the public sector pension plans, and the government agreed with the conclusions and recommendations put forward by the Auditor General. To address the Auditor General's recommendations, the government has developed and implemented a comprehensive management action plan.
- The Superannuation Account has been removed from the public service pension plan's Financial Statements of the Public Service Pension Plan for the Fiscal Year Ended (Financial Statements), and is now disclosed by way of a note to the Financial Statements. This presentation change, which complies with Canadian accounting standards for pension plans, will provide more reliable and relevant information for the users of the Financial Statements. Supported by the Comptroller General of Canada, this change has no financial implications for the Government of Canada or the pension plan. Pension plan members and beneficiaries will continue to receive their pension benefits.
- The Transformation of Pension Administration Initiative has successfully centralized services previously provided by individual federal departments into a centre of pension expertise and has implemented a modern, commercial, off-the-shelf software product. The modernized pension processes and centralized service delivery model, coupled with an agile technology solution, have increased the effectiveness of public service operations and generated significant savings, thereby ensuring the sustainability of the pension administration. The administration of the Royal Canadian Mounted Police pension plan has been transferred to the new software product, and the Canadian Forces pension plan will be transferred in the future. This will result in a further reduction of operation costs due to economies of scale.
- In January 2014, the Annual Pensioners Statement was introduced for retired public service pension plan members and survivors. The new statement provides clear, concise and personalized pension information in an easy-to-read format.
Demographic Highlights
This figure shows the number of active contributors relative to the number of retired members over the last 10 years.
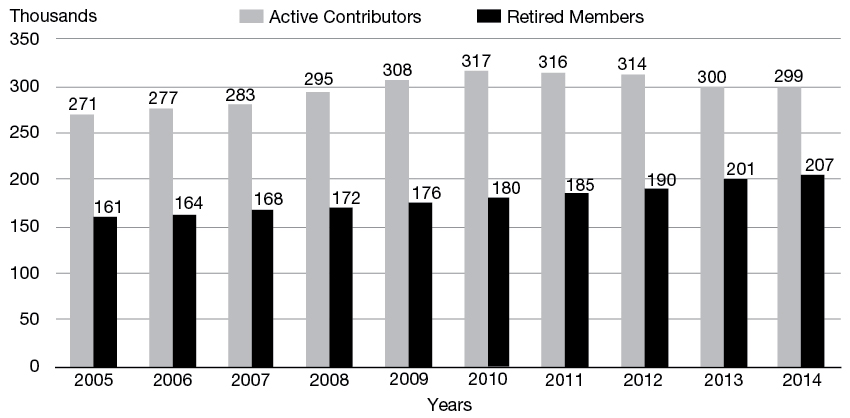
Figure 1 - Text version
| Years | Active Contributors (in thousands) | Retired Members (in thousands) |
|---|---|---|
| 2005 | 271 | 161 |
| 2006 | 277 | 164 |
| 2007 | 283 | 168 |
| 2008 | 295 | 172 |
| 2009 | 308 | 176 |
| 2010 | 317 | 180 |
| 2011 | 316 | 185 |
| 2012 | 314 | 190 |
| 2013 | 300 | 201 |
| 2014 | 299 | 207 |
The 10-year annual average growth rate Footnote 2 for active contributors was 1.1 per cent (1.2 per cent in 2013) compared with 2.6 per cent for retired members (2.4 per cent in 2013).
Figure 2 shows the number of active contributors by age group in 2014 relative to the number of active contributors in 2005.
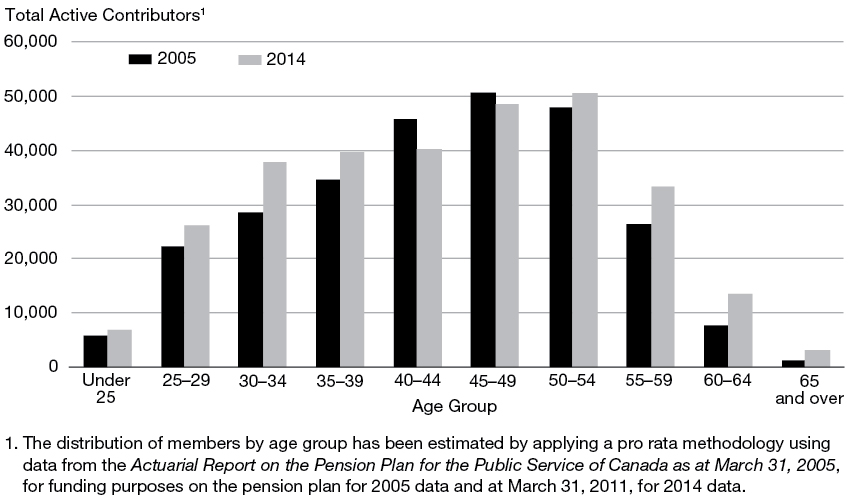
Figure 2 - Text version
| 2005 | 2014 | ||
|---|---|---|---|
| Age Group | Total Active Contributors table note 1 * | Age Group | Total Active Contributors table note 1 * |
Table 1 Notes
|
|||
| Under 25 | 6,040 | Under 25 | 6,997 |
| 25–29 | 22,371 | 25–29 | 26,075 |
| 30–34 | 28,573 | 30–34 | 37,766 |
| 35–39 | 34,477 | 35–39 | 39,575 |
| 40–44 | 45,554 | 40–44 | 40,191 |
| 45–49 | 50,538 | 45–49 | 48,239 |
| 50–54 | 47,911 | 50–54 | 50,444 |
| 55–59 | 26,325 | 55–59 | 33,276 |
| 60–64 | 7,746 | 60–64 | 13,581 |
| 65 and over | 1,300 | 65 and over | 3,149 |
| Total | 270,835 | Total | 299,293 |
The number of active contributors has increased from 2005 to 2014 for each group, except for the 40–44 and 45–49 age categories in the centre of the distribution.
| Membership Profile | Number of Members 2005 |
Percentage of Total 2005 |
Number of Members 2014 |
Percentage of Total 2014 |
Per cent Change 2005–14 |
|---|---|---|---|---|---|
| Active contributors | 270,835 | 54.5 | 299,293 | 52.4 | 10.5 |
| Retired members | 161,468 | 32.5 | 207,495 | 36.4 | 28.5 |
| Survivors | 59,060 | 11.9 | 59,331 | 10.4 | 0.5 |
| Deferred annuitants | 5,552 | 1.1 | 4,348 | 0.8 | (21.7) |
| Total | 496,915 | 100.0 | 570,467 | 100.0 | 14.8 |
The public service pension plan operates in a challenging and changing environment. Today, it is facing the challenge of an aging membership and longer retirements. The ratio of active-to-retired members (including survivors and deferred annuitants) under the public service pension plan has declined over the years. The decline in the proportion of active members, coupled with the fact that members are living longer, increases the cost of the pension plan. Over the period from 2005 to 2014, the number of active contributors increased by 10.5 per cent, and the number of retired members increased by 28.5 per cent. Over the same period, the number of survivors increased by 0.5 per cent, and the number of deferred annuitants decreased by 21.7 per cent.
Financial Overview
Contributions
Members' contribution rates were raised following the Government of Canada's commitment to increase contribution rates to reach an employer-employee ratio of 50:50 over the next few years.
Generally, if an employee was participating in the plan on or before , the contribution rates for Group 1 (members with a normal retirement age of 60) are applied. If an employee began participating in the plan on or after , contribution rates for Group 2 (members with a normal retirement age of 65) are applied.
As illustrated in Table 2, Group 2 plan members pay lower contribution rates than Group 1 members because they must wait five years longer than Group 1 members before they are eligible to receive a pension benefit. Since they receive a benefit that has a lower overall value and cost, they do not pay as much as those who are eligible for an unreduced pension at age 60.
| 2014 | 2013 | |
|---|---|---|
| Members who were participating in the plan on or before (Group 1) | ||
| On earnings up to the year's maximum pensionable earnings | 7.50% | 6.85% |
| On any earnings over the year's maximum pensionable earnings | 9.80% | 9.20% |
| Members who began participating in the plan on or after (Group 2) | ||
| On earnings up to the year's maximum pensionable earnings | 6.62% | 6.27% |
| On any earnings over the year's maximum pensionable earnings | 7.89% | 7.63% |
The year's maximum amount of pensionable earnings in 2013 and 2014 is $51,100 and $52,500 respectively.
Figure 3 shows the total amount of cash contributions from both the employer and plan members over the period from 2005 to 2014.
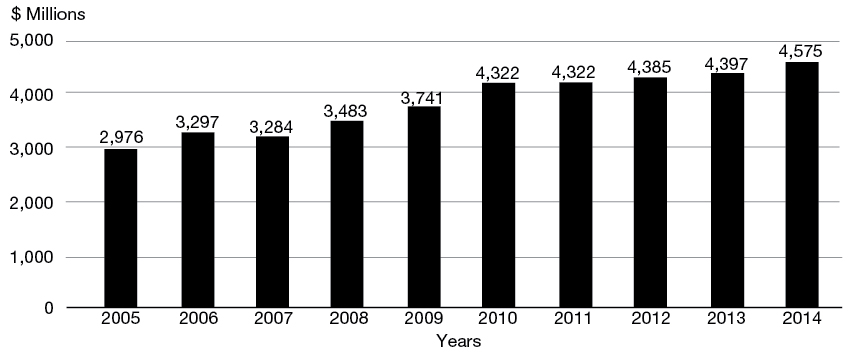
Figure 3 - Text version
| Years | Contributions on a cash basis ($ millions) |
|---|---|
| 2005 | 2,976 |
| 2006 | 3,297 |
| 2007 | 3,284 |
| 2008 | 3,483 |
| 2009 | 3,741 |
| 2010 | 4,322 |
| 2011 | 4,322 |
| 2012 | 4,385 |
| 2013 | 4,397 |
| 2014 | 4,575 |
The annual growth rate in cash contributions from both the employer and plan members over the past 10 years averaged 4.9 per cent. The contributions do not include year-end accrual adjustments, which are reported in the Financial Statements of this report.
Figure 4 shows the share of total cash contributions between the employer and plan members as at .
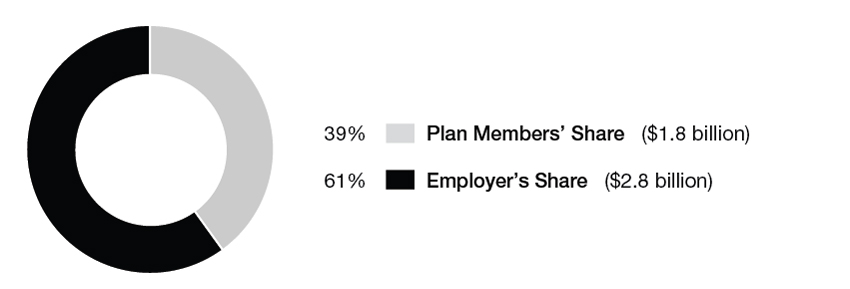
Figure 4 - Text version
| Current and Past Cash Contributions ($ billion) | Per cent | |
|---|---|---|
| Plan Members Share | 1.80 | 39 |
| Employer's Share | 2.80 | 61 |
| Total | 4.60 | 100 |
Public service pension plan benefits are funded through compulsory contributions from the employer and the plan members, as well as from investment earnings. Cash contributions received in 2013–14 totalled $4.6 billion ($4.4 billion in 2012–13), excluding year-end accrual adjustments. The employer contributed $2.8 billion ($2.7 billion in 2012–13), Footnote 3 and the plan members contributed $1.8 billion ($1.7 billion in 2012–13). As shown in Figure 4, the employer paid approximately 61 per cent of total contributions during the fiscal year (61 per cent in 2012–13), compared with 39 per cent for the plan members (39 per cent in 2012–13). Cash contributions in Figure 4 include both current service and past service (e.g., service buybacks, pension transfers). The contributions presented in the Financial Statements of this report include year-end accrual adjustments.
Benefits
In 2013–14, the public service pension plan paid out $6.3 billion in benefits, an increase of $407 million over the previous year.
Benefits were paid to 266,826 retired members and survivors, compared with 259,098 in 2012–13. Of the 10,839 newly retired members in 2013–14:
- 8,078 were entitled to immediate annuities (9,659 in 2012–13);
- 1,657 received annual allowances (2,737 in 2012–13);
- 616 were eligible to receive disability retirement benefits (681 in 2012–13); and
- 488 were entitled to deferred annuities (269 in 2012–13).
In 2013–14, 2,552 plan members left the public service before the age of 50 (1,990 in 2012–13) and withdrew approximately $348 million ($262 million in 2012–13) in lump-sum amounts (i.e., the present value of their future benefits), excluding return of contributions for non-vested Footnote 4 members. These sums were transferred to other pension plans or to locked-in retirement vehicles.
The average annual pension for newly retired members in 2013–14 was $35,548, compared with $33,773 in 2012–13 an increase of 5.3 per cent. The average pension paid to all plan members was $28,019 in 2013–14 ($27,380 in 2012–13).
This figure presents the average pension paid to plan members from 2005 to 2014. In 2013–14, the average pension was $28,019 ($27,380 in 2012–13).
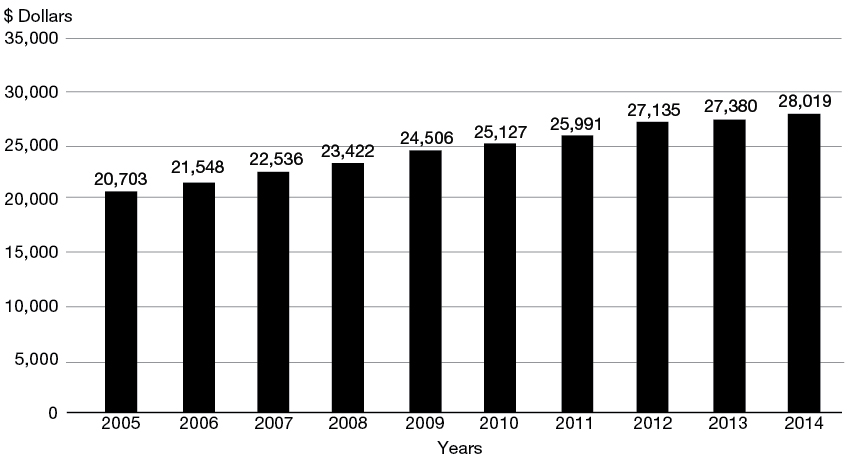
Figure 5 - Text version
| Years | Average Pension ($ Dollars) |
|---|---|
| 2005 | 20,703 |
| 2006 | 21,548 |
| 2007 | 22,536 |
| 2008 | 23,422 |
| 2009 | 24,506 |
| 2010 | 25,127 |
| 2011 | 25,991 |
| 2012 | 27,135 |
| 2013 | 27,380 |
| 2014 | 28,019 |
Pensions under the public service pension plan are indexed annually to take into account the cost of living, which is based on increases in the Consumer Price Index. In 2014, the indexation rate was 0.9 per cent (1.9 per cent in 2013).
This figure presents the total amount of benefits paid to plan members and survivors each year from 2005 to 2014.
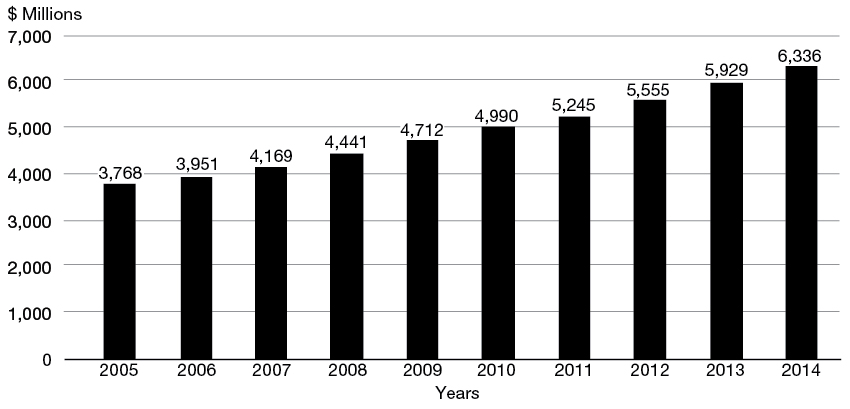
Figure 6 - Text version
| Years | Benefits Payments ($ millions) |
|---|---|
| 2005 | 3,768 |
| 2006 | 3,951 |
| 2007 | 4,169 |
| 2008 | 4,441 |
| 2009 | 4,712 |
| 2010 | 4,990 |
| 2011 | 5,245 |
| 2012 | 5,555 |
| 2013 | 5,929 |
| 2014 | 6,336 |
Benefit payments, on average, have increased by 5.8 per cent annually over the past 10 years. Benefit payments are indexed annually to take into account the cost of living.
This figure presents the total amount of benefits paid to retired members and to survivors.

Figure 7 - Text version
| Benefit Payments ($ billions) | Per cent | |
|---|---|---|
| Survivors | 0.7 | 12% |
| Retired Members | 5.6 | 88% |
| Total | 6.30 | 100% |
Benefits paid to retired members ($5.6 billion), including benefits paid to plan members who retired on grounds of disability, represented 88 per cent of the 2013–14 pension payments (88 per cent in 2012–13); benefits paid to survivors ($0.7 billion) represented 12 per cent (12 per cent in 2012–13).
Investment Returns
The Public Sector Pension Investment Board has generated above-benchmark returns in eight of the past ten years. It has accomplished this by pursuing a strategy of increasing the internal active management of its investments and by diversifying its asset classes. The internal active management of assets allows for better control in terms of investment risks and costs. The Public Sector Pension Investment Board has moved from being once fully invested in public markets into private market areas such as private equity, real estate, infrastructure and renewable resources. These private market areas all recorded above-benchmark returns in 2013–14, with the overall portfolio being driven primarily by public and private equities, as well as by the real estate and infrastructure portfolios.
This figure shows the rate of return on the assets held by the Public Sector Pension Investment Board against its comparative benchmark.

Figure 8 - Text version
| Years | Portfolio Returns | Benchmark Returns |
|---|---|---|
| 2005 | 7.9% | 7.2% |
| 2006 | 19.1% | 18.0% |
| 2007 | 11.3% | 10.1% |
| 2008 | -0.3% | 1.2% |
| 2009 | -22.7% | -17.6% |
| 2010 | 21.5% | 19.8% |
| 2011 | 14.5% | 12.7% |
| 2012 | 3.0% | 1.6% |
| 2013 | 10.7% | 8.6% |
| 2014 | 16.3% | 13.9% |
The Public Sector Pension Investment Board reported a rate of return of 16.3 per cent for the 2013–14 fiscal year (10.7 per cent in 2012–13), compared with the benchmark rate of return of 13.9 per cent (8.6 per cent in 2012–13). Over the past 10 years, the Public Sector Pension Investment Board has recorded an annualized rate of return of 7.3 per cent, Footnote 5 compared with the benchmark rate of return of 7.0 per cent over the same period.
Additional information concerning the rate of return on assets held by the Public Sector Pension Investment Board and comparative benchmarks is available on the PSP Investments website.
This figure presents the total value of public service pension plan assets held by the Public Sector Pension Investment Board each year over the last 10 years for the years ended March 31. Amounts include the cumulative net amounts transferred from the Government of Canada and the cumulative net return on assets held. In 2014, the total value of assets reached $68.2 billion. To date, $42.0 billion (61.6 per cent) of the total value has been transferred from the Government of Canada.
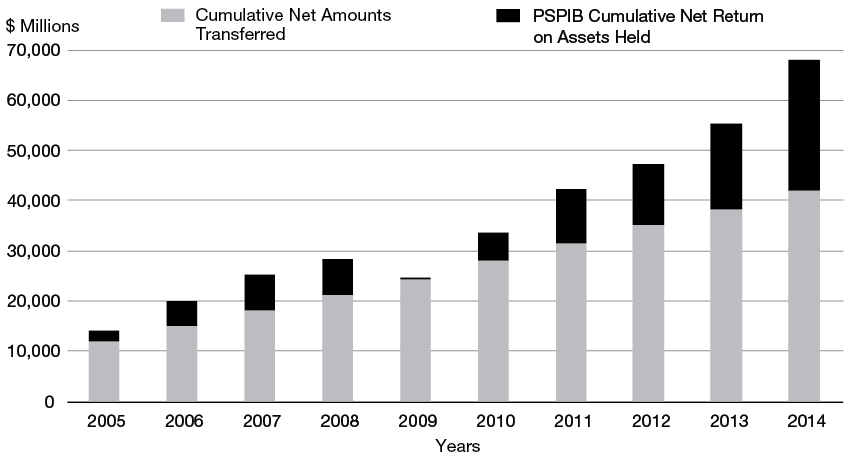
Figure 9 - Text version
| Years | PSPIB Cumulative Net Return on Assets Held | Cumulative Net Amounts Transferred |
|---|---|---|
| 2005 | 1,958 | 1,2017 |
| 2006 | 4,892 | 15,105 |
| 2007 | 7,334 | 18,076 |
| 2008 | 7,131 | 21,133 |
| 2009 | 184 | 24,312 |
| 2010 | 5,642 | 28,019 |
| 2011 | 10,689 | 31,610 |
| 2012 | 11,962 | 35,166 |
| 2013 | 17,059 | 38,424 |
| 2014 | 26,209 | 41,959 |
Administrative Expenses
The legislation provides for the pension-related administrative expenses of government organizations to be charged to the public service pension plan, namely, those of the Treasury Board of Canada Secretariat, Public Works and Government Services Canada, Health Canada and the Office of the Chief Actuary. Administrative expenses also include Public Sector Pension Investment Board operating expenses.
This figure presents the administrative expenses charged to the public service pension plan each year from 2005 to 2014 as shared between government departments and the Public Sector Pension Investment Board.
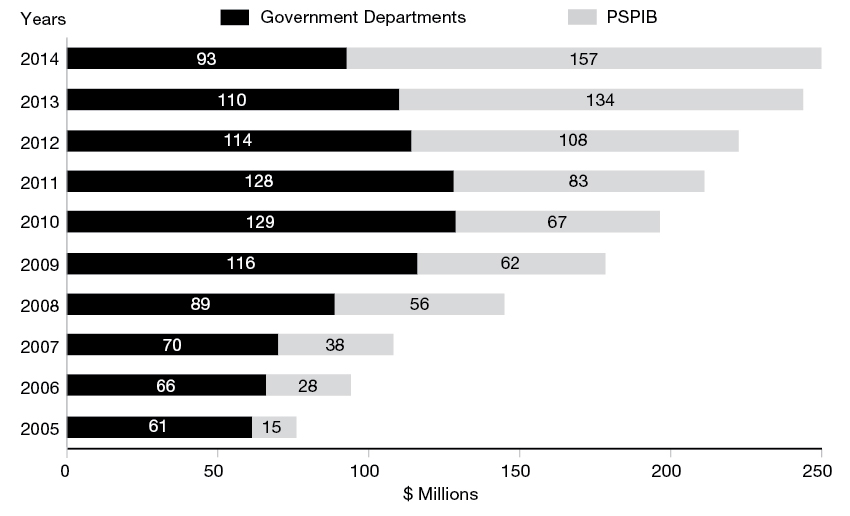
Figure 10 - Text version
| Expenses ($ Millions) | 2005 | 2006 | 2007 | 2008 | 2009 | 2010 | 2011 | 2012 | 2013 | 2014 |
|---|---|---|---|---|---|---|---|---|---|---|
| Government Departments | 61 | 66 | 70 | 89 | 116 | 129 | 128 | 114 | 110 | 93 |
| PSPIB | 15 | 28 | 38 | 56 | 62 | 67 | 83 | 108 | 134 | 157 |
| Total | 76 | 94 | 108 | 145 | 178 | 196 | 211 | 222 | 244 | 250 |
The increase in administrative expenses for government departments from 2008 to 2010 was due in large part to the capital expenditure requirements related to the pension modernization project started in 2007–08. This project was completed in January 2013. The decrease in administration expenses for government departments from 2011 to 2014 was due to the completion of the centralization of pension services that started in 2006–07.
The Public Sector Pension Investment Board's increase in expenses from 2011 to 2014 is due in part to the growth in assets managed by the Crown corporation, and in part to its management's ongoing strategy to increasingly manage the investment portfolio internally. Managing assets internally increases operating expenses while reducing external management expenses. As a result, over the past five fiscal years, internally managed assets allocated to the public service pension plan increased by approximately $36 billion, while associated operating expenses grew by $95 million.
Based on available market data related to the investment implementation style, it is estimated that the increase in internally managed assets has resulted in savings ranging from $131 million to $193 million for fiscal year 2013–14, compared to what costs would have been had the Public Sector Pension Investment Board employed external investment managers to manage these funds. As a result of these savings, the Public Sector Pension Investment Board's cost ratios have declined each year for the past five fiscal years. Cost ratios are operating expenses plus asset management expenses as a percentage of average net investment assets. In 2013–14, the average cost per 100 dollars of invested assets was 59.3 cents; in 2008–09, the average cost was 86.9 cents per 100 dollars, an overall decrease of 32 per cent.
Communications to Plan Members
The Government of Canada recognizes that the public service pension plan is an integral part of the public service workforce recruitment, retention and renewal strategy and is committed to providing timely and accurate information about the plan to plan members. To fulfill this commitment, the government has focused on a number of initiatives, including Your Public Service Pension and Benefits web portal and the Pensions section of the Treasury Board of Canada Secretariat website. Outreach events were undertaken to promote the web portal and answer questions to plan members.
This figure presents the monthly average page views each year from 2007 to 2013.
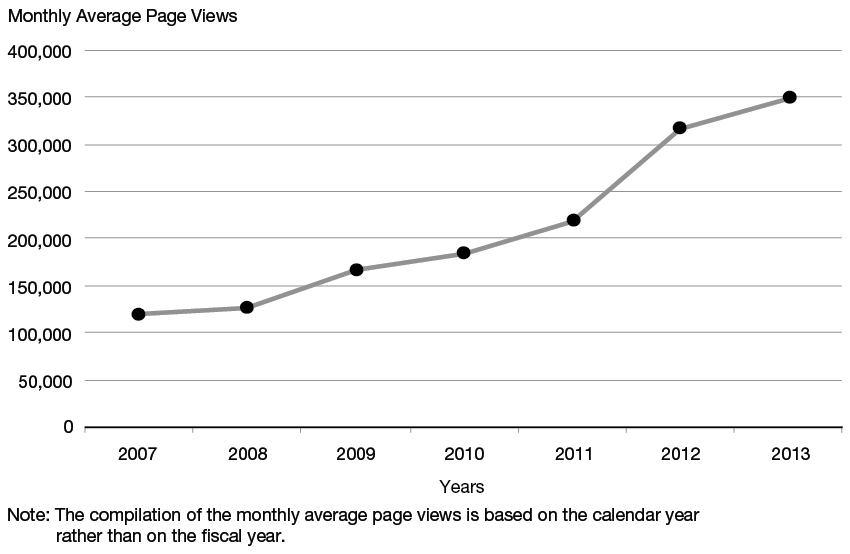
Figure 11 - Text version
| Year | Monthly Average Page Views |
|---|---|
| 2007 | 118,891 |
| 2008 | 126,564 |
| 2009 | 166,438 |
| 2010 | 183,994 |
| 2011 | 217,782 |
| 2012 | 315,514 |
| 2013 | 348,201 |
Your Public Service Pension and Benefits web portal continues to be one of the main sources of information for both active and retired plan members. Since its launch in 2006, the web portal has almost tripled its number of page views.
Pension Objective
The objective of the Public Service Superannuation Act and related statutes is to provide a source of lifetime retirement income for retired and disabled public service pension plan members. Upon a plan member's death, the pension plan provides an income for eligible survivors and dependants. Pension benefits are directly related to a plan member's salary and public service pensionable service.
Historical Context
The first Act entitling certain public service employees to retirement income came into effect in 1870. Over the years, the public service pension plan took many forms until the Public Service Superannuation Act came into effect on . The Public Service Superannuation Act introduced an important change in 1954 whereby pension coverage was broadened to include substantially all public service employees.
With the introduction of the Canada Pension Plan and the Québec Pension Plan in 1966, major amendments were made to the Public Service Superannuation Act to include the coordination of public service pension plan contribution rates and benefits with those of the Canada Pension Plan and the Québec Pension Plan.
Other amendments were made to the Public Service Superannuation Act over the years, including changes in 1999 that dealt primarily with improving plan management and introducing the Public Sector Pension Investment Board Act. This Act provided for the creation of the Public Sector Pension Investment Board in April 2000. Prior to April 2000, employer and plan member contributions under the public service pension plan had been credited to an account that formed part of the Public Accounts of Canada (Public Accounts); these contributions were not invested in capital markets (e.g., in bonds and stocks). Starting in April 2000, the government began transferring to the Public Sector Pension Investment Board amounts equal to pension contributions net of benefit payments and departmental administrative expenses for the plan.
The Public Service Superannuation Act was amended in 2006 to lower the factor used in the Canada Pension Plan or Québec Pension Plan coordination formula to calculate a pension at age 65. This change increased public service pension benefits for members reaching age 65 in 2008 or later.
In 2010–11, following amendments to the Income Tax Act that increased the maximum age to accrue pension benefits under a registered pension plan, the Public Service Superannuation Regulations were amended to allow members of the public service pension plan who reached age 70 or 71 in 2007 to buy back up to two years of pensionable service and increase their annual pension upon retirement.
Further amendments to the Public Service Superannuation Act were enacted by Parliament in 2012 to allow for public service pension plan member contribution rates to be gradually increased to reach an employer-employee cost-sharing ratio of 50:50. In addition, the age of eligibility for an unreduced pension benefit was increased from age 60 to age 65 for new public service employees who began participating in the plan on or after .
Roles and Responsibilities
On behalf of the Government of Canada, the overall responsibility of the public service pension plan rests with the President of the Treasury Board, supported by the Secretariat as the administrative arm of the Treasury Board and Public Works and Government Services Canada as the day-to-day administrator.
The President of the Treasury Board is also responsible for ensuring that the public service pension plan is adequately funded to fully meet plan member benefits. To determine the plan's funding requirements, the President enlists the help of the Office of the Chief Actuary, to provide advice and a range of actuarial services, and the Public Sector Pension Investment Board to manage the pension assets for the public sector pension plans. The Public Service Pension Advisory Committee advises the President on the administration, design and funding of the benefits and on other pension-related matters referred to it by the President.
The roles and responsibilities of each organization are as follows:
Treasury Board of Canada Secretariat
The President of the Treasury Board is responsible for the overall management of the public service pension plan on behalf of the Government of Canada, the plan sponsor. In support of the Treasury Board's role as employer for the public service, the Secretariat is responsible for policy development in respect of the funding, design and governance of the public service pension plan and other retirement programs and arrangements. In addition, the Secretariat is responsible for providing strategic direction, program advice and interpretation; developing legislation; communicating to plan members; and liaising with stakeholders.
Public Works and Government Services Canada
Public Works and Government Services Canada is responsible for the day-to-day administration of the public service pension plan. This includes developing and maintaining the public service pension systems, books of accounts, records, and internal controls, as well as preparing the Account Transaction Statements for reporting in the Public Accounts.
In addition, Public Works and Government Services Canada processes payments and carries out all accounting and financial administrative functions. Through its pay and pension services, Public Works and Government Services Canada's Pay and Pension Services for Government Employees ensures that federal government employees and retired pension plan members receive their pay and pension benefit payments accurately and on time. In total, this involves payments of approximately $29 billion annually.
Public Sector Pension Investment Board
The Public Sector Pension Investment Board is a Canadian Crown corporation established by the Public Sector Pension Investment Board Act and is governed by an 11-member board of directors, accountable to Parliament through the President of the Treasury Board. Its legislative mandate is to maximize returns without undue risk of loss, having regard to the funding, policies and requirements of the public service pension plan, the Royal Canadian Mounted Police pension plan, and the Canadian Forces Regular Force and Reserve Force pension plans. The Public Sector Pension Investment Board has been investing on behalf of the pension plans the amounts transferred by the Government of Canada since . The relevant financial results of the Public Sector Pension Investment Board are included in the pension plan's Financial Statements.
Office of the Chief Actuary
The Office of the Chief Actuary, an independent unit within the Office of the Superintendent of Financial Institutions Canada, provides a range of actuarial services and advice to the Government of Canada that includes the public service pension plan. The Office of the Chief Actuary is responsible for conducting an annual actuarial valuation of the pension plan for accounting purposes as well as a triennial (i.e., once every three years) funding valuation.
Public Service Pension Advisory Committee
The Public Service Pension Advisory Committee, established under the Public Service Superannuation Act, provides advice to the President of the Treasury Board on matters relating to the public service pension plan's administration, benefit design, and funding.
The committee is composed of 13 members: 1 pensioner, appointed from pensioners nominated by the public servant pensioner associations; 6 members representing employees, appointed from the employees nominated by the National Joint Council of the Public Service of Canada; and 6 members nominated by the President of the Treasury Board, who are traditionally chosen from the executive ranks of the public service. All members are appointed by the Governor in Council to hold office for a term not exceeding three years and are eligible for reappointment for one or more additional terms.
Summary of Plan Benefits
The following presents an overview of the main benefits offered under the public service pension plan as of . If there is a discrepancy between this information and information contained in the Public Service Superannuation Act, the Public Service Superannuation Regulations or other applicable laws, the legislation prevails at all times.
Types of Pension Benefits
The benefits that pension plan members are entitled to when they leave the public service depend on their age and the number of years of pensionable service to their credit.
Table 3. Types of Benefits Based on Age and Pensionable Service
| If a member is… | And leaves the public service with pensionable service of… | The member would be entitled to… |
|---|---|---|
Table 3.1 Notes
|
||
| Age 60 or over | At least 2 years | An immediate annuity |
| Age 55 or over | At least 30 years | An immediate annuity |
| Age 50 up to age 60 | At least 2 years | A deferred annuity payable at age 60; or An annual allowance payable as early as age 50 |
| Under age 50 | At least 2 years | A deferred annuity payable at age 60; or An annual allowance payable as early as age 50; or A transfer value |
| Under age 60 | At least 2 years and retiring because of disability | An immediate annuity |
| Any age | Less than 2 years | A return of contributions with interest |
| If a member is… | And leaves the public service with pensionable service of… | The member would be entitled to… |
|---|---|---|
Table 3.2 Notes
|
||
| Age 65 or over | At least 2 years | An immediate annuity |
| Age 60 or over | At least 30 years | An immediate annuity |
| Age 55 up to age 65 | At least 2 years | A deferred annuity payable at age 65; or An annual allowance payable as early as age 55 |
| Under age 55 | At least 2 years | A deferred annuity payable at age 65; or An annual allowance payable as early as age 55; or A transfer value |
| Under age 65 | At least 2 years and retiring because of disability | An immediate annuity |
| Any age | Less than 2 years | A return of contributions with interest |
Protection From Inflation
Pensions under the public service pension plan are indexed annually to take into account the cost of living, which is based on increases in the Consumer Price Index. In 2014, the indexation rate was 0.9 per cent (1.9 per cent in 2013).
Survivor Benefits
If a member is vested upon death (i.e., has at least two years of pensionable service), then the eligible survivor and children are entitled to the following:
- Survivor benefit
- A monthly allowance equal to half of the pension the member would have received before age 65, payable immediately to the eligible survivor.
- Child allowance
- An allowance equal to one fifth of the survivor benefit (two fifths if the member has no eligible survivor), payable until age 18, or age 25 if the child is a full-time student. The maximum allowance for all children combined is the equivalent of four children's benefits.
- Supplementary death benefit
- A lump-sum benefit equal to twice the member's annual salary, payable to the designated beneficiary or to the estate. Coverage decreases by 10 per cent each year starting at age 66 to a minimum of $10,000 by age 75. If the member is still employed in the public service after age 65, minimum coverage is the greater of $10,000 or one third of his or her annual salary.
If the member has no eligible survivor or children, the designated beneficiary of the supplementary death benefit or the estate will receive an amount equal to the greater of the return of contributions with interest, or five years of pension payments less any payments already received.
If death occurs before a member becomes vested (i.e., before a member has completed two years of pensionable service), contributions with interest are refunded to any eligible survivor or children, or to the designated beneficiary or the estate if the member has no eligible survivors.
Financial Statements Content Overview
Financial and Performance Audits
The Office of the Auditor General audits federal government operations and provides Parliament with independent information, advice and assurance to help hold the government to account for its stewardship of public funds. The Office of the Auditor General is responsible for performance audits and studies of federal departments and agencies. It conducts financial audits of the government's financial statements (i.e., the Public Accounts) and performs special examinations and annual financial audits of Crown corporations including the Public Sector Pension Investment Board. With respect to the public service pension plan, the Office of the Auditor General acts as the independent auditor.
Actuarial Valuation
Pursuant to the Public Pensions Reporting Act, the President of Treasury Board directs the Chief Actuary of Canada to conduct an actuarial valuation for funding purposes at least every three years. The purpose of the actuarial review is to determine the state of the pension account and pension fund as well as to assist the President of the Treasury Board in making informed decisions regarding the financing of the government's pension obligations. The last funding valuation was conducted as at , with an update as of , to reflect the pension changes from the Jobs and Growth Act, 2012.
In addition, the Office of the Chief Actuary performs an annual actuarial valuation for accounting purposes, which serves as the basis for determining the government's pension obligations and expenses reported in the Public Accounts and in the public service pension plan's Financial Statements included in this annual report. The economic assumptions used in the annual actuarial valuation represent management's best estimate.
Net Assets Available for Benefits
As at , the Statement of Financial Position shows that net assets were $69.6 billion compared with $56.9 billion last year. The net assets comprise primarily the assets managed by the Public Sector Pension Investment Board on behalf of the pension plan and contributions receivable for past service elections.
The Statement of Changes in Net Assets Available for Benefits shows that credits come from a number of different sources, including the following:
- Contributions from pension plan members and employers;
- Income from investments; and
- Transfers to the public service pension plan from other pension plans when employees leave an outside organization and join an employer covered under the Public Service Superannuation Act.
Amounts are debited from the public service pension plan to cover:
- Benefits;
- Administrative expenses; and
- Transfers or refunds from the public service pension plan to other registered pension plans.
Detailed information can be found in the Financial Statements.
Investment Management
Contributions relating to service since , are recorded in the Public Service Pension Fund Account in the accounts of Canada. An amount equal to contributions net of benefit payments and government departments' administration expenses is transferred regularly to the Public Sector Pension Investment Board and invested in capital markets.
The Public Sector Pension Investment Board's statutory objectives are to manage the funds transferred to it in the best interests of the contributors and beneficiaries, and to invest its assets with a view to achieving a maximum rate of return without undue risk of loss, having regard to the funding, policies and requirements of the pension plan. Accordingly, the Public Sector Pension Investment Board's board of directors has established an investment policy whereby the expected real rate of return is at least equal to the long-term valuation discount rate assumption. This rate is the same as that used in the most recently tabled actuarial valuation for funding purposes of the public service pension plan (4.1 per cent as reported in the Actuarial Report on the Pension Plan for the Public Service of Canada as at ).
As noted in the Public Sector Pension Investment Board's 2014 Annual Report, the investments allocated to the public service pension plan during the year ended , 2014, were in compliance with the Public Sector Pension Investment Board Act and the statement of investment policies, standards and procedures approved by its board of directors.
Pension Obligations
The Statement of Changes in Pension Obligations shows the present value of benefits earned for service to date that will be payable in the future. For the year ended , the value of pension obligations was $157.6 billion ($153.7 billion in 2013), an increase of $3.9 billion from the previous fiscal year. The increase is due primarily to an increase in accrued pension benefits.
Rate of Return on Assets Held by the Public Sector Pension Investment Board
In 2013–14, the assets held by the Public Sector Pension Investment Board earned a rate of return of 16.3 per cent (10.7 per cent in 2012–13). In accordance with the current investment policy, the assets are invested with a long-term target weight of 54.0 per cent in world equity, 33.0 per cent in real return assets, and 13.0 per cent in nominal fixed income. Refer to Note 6 and Note 8 of the Financial Statements or to the PSP Investments website for more details.
Interest Credited on the Public Service Superannuation Account
The Public Service Superannuation Account is credited quarterly with interest at rates calculated as though amounts recorded in this account were invested quarterly in a notional portfolio of Government of Canada 20-year bonds held to maturity. No formal debt instrument is issued to this account by the government in recognition of the amounts therein. The reduction in interest credited to the account relates to declining bond interest rates. The interest credited on the Public Service Superannuation Account is no longer recognized as "interest income" in the Statement of Changes in Net Assets Available for Benefits and is only reported in the Account Transaction Statements section of this report.
Table 4. Annualized Interest Rate Credited to the Superannuation Account (year ended March 31)
Table 4 shows the annualized interest rate credited.
| 2005 | 2006 | 2007 | 2008 | 2009 | 2010 | 2011 | 2012 | 2013 | 2014 | |
|---|---|---|---|---|---|---|---|---|---|---|
Table 4 Notes
|
||||||||||
| Percentage Interest Rate on Account table 4 note 1 * | 8.0 | 7.8 | 7.5 | 7.3 | 7.0 | 6.7 | 6.5 | 6.0 | 5.6 | 5.4 |
Administrative Expenses
The legislation provides for the pension-related administrative expenses of government organizations to be charged to the public service pension plan, namely, those of the Treasury Board of Canada Secretariat, Public Works and Government Services Canada, Health Canada and the Office of the Chief Actuary. Administrative expenses also include Public Sector Pension Investment Board operating expenses. Investment management fees are paid either directly by the Public Sector Pension Investment Board or offset against distributions received from the investments. In 2013–14, total expenses recorded by the pension plan were $93 million ($110 million in 2012–13) for government departments and $157 million ($134 million in 2012–13) for the Public Sector Pension Investment Board.
Transfer Agreements
The pension plan has transfer agreements with approximately 90 employers, including other levels of government, university and private sector employers. In 2013–14, $96 million ($135 million in 2012–13) was transferred into the public service pension plan, and $59 million ($49 million in 2012–13) was transferred out of the public service pension plan under these agreements.
Retirement Compensation Arrangements
Under the authority of the Special Retirement Arrangements Act, separate Retirement Compensation Arrangements No. 1 and No. 2 have been established to provide supplementary benefits to some employees. Since these arrangements are covered by separate legislation, the balance and corresponding value of their accrued pension benefits is not consolidated in the public service pension plan's Financial Statements. A summary of these arrangements is provided in the notes to the Financial Statements.
Retirement Compensation Arrangement No. 1 provides for benefits in excess of those permitted under the Income Tax Act for registered pension plans. In 2014, this primarily included benefits on salaries over $155,000 ($150,900 in 2013) plus some survivor benefits.
Retirement Compensation Arrangement No. 2 provides for pension benefits to public service employees declared surplus as a result of the three-year Early Retirement Incentive Program that ended on , which allowed eligible employees to retire with an unreduced pension.
Contributions and benefit payments in excess of limits permitted under the Income Tax Act for registered pension plans are recorded in the Retirement Compensation Arrangements Account in the Public Accounts. The balance in the Retirement Compensation Arrangements Account is credited with interest at the same rate as that of the Public Service Superannuation Account.
Further Information
Additional information concerning the public service pension plan is available at the following sites:
- Your Public Service Pension and Benefits Web Portal
- Pensions on Treasury Board of Canada Secretariat website
- Pay and Pension Services for Government Employees on Public Works and Government Services Canada website
- Public Service Superannuation Act
- PSP Investments
- Office of the Chief Actuary
Account Transaction Statements
Public Service Superannuation Account and Public Service Pension Fund
Prior to April 2000, all pension transactions accumulated in relation to the pension plan were accounted for, and recorded in, the Public Service Superannuation Account in the accounts of Canada (to the extent that any funds held in the Consolidated Revenue Fund have been earmarked specifically for the pension plan). The Superannuation Account does not consist of cash or marketable securities. The account is used to record transactions, such as contributions, benefit payments, interest, administrative expenses and other charges, which pertain to service prior to . The interest is credited quarterly at rates calculated as though the amounts recorded in the account were invested quarterly in a notional portfolio of Government of Canada 20-year bonds held to maturity.
All pension transactions related to service accrued since , are recorded in the Public Service Pension Fund Account in the accounts of Canada. An amount equal to contributions in excess of benefit payments and government organizations' administrative expenses is transferred regularly to the Public Sector Pension Investment Board and invested in capital markets. The balance in the Public Service Pension Fund Account at year-end represents amounts awaiting imminent transfer to the Public Sector Pension Investment Board.
The treatment of any actuarial excess or surplus and shortfall or deficit for both the Superannuation Account and the Pension Fund is outlined in the Financial Statements of the Public Service Pension Plan for the Fiscal Year Ended . As a result of the latest actuarial valuation as at , no actuarial adjustment was made to the Superannuation Account (nil in 2012–13) during the year ended March 31, 2014. Starting with the year ended , an annual adjustment of $435 million will be made to the Pension Fund for a period of 13 years ending in 2025. The Public Service Superannuation Act requires that any actuarial deficit be dealt with by transferring equal instalments to the Pension Fund over a period of up to 15 years, commencing in the year in which the actuarial report is tabled in Parliament.
| 2014 | 2013 | |
|---|---|---|
| The account transaction statement above is unaudited. | ||
| Opening Balance (A) | $96,648,001,666 | $96,441,820,180 |
| Receipts and Other Credits | ||
| Employee contributions | ||
|
Government employees
|
3,974,740 | 4,421,468 |
|
Retired employees
|
17,027,791 | 18,497,273 |
|
Public service corporation employees
|
261,641 | 275,357 |
| Employer contributions | ||
|
Government
|
17,233,070 | 18,502,069 |
|
Public service corporations
|
242,123 | 232,460 |
| Transfers from other pension funds | 391,468 | 592,964 |
| Interest | 5,061,490,938 | 5,317,729,059 |
| Total—Receipts and Other Credits (B) | $5,100,621,772 | $5,360,250,650 |
| Payments and Other Charges | ||
| Annuities | $5,163,832,473 | $4,996,538,068 |
| Minimum benefits | 16,775,306 | 13,781,359 |
| Pension division payments | 29,996,061 | 24,497,994 |
| Pension transfer value payments | 45,395,025 | 38,019,592 |
| Returns of contributions | ||
|
Government employees
|
154,484 | 16,920 |
|
Public service corporation employees
|
141,859 | 31,997 |
| Transfers to other pension funds | 10,651,878 | 9,757,823 |
| Administrative expenses | 57,897,383 | 71,425,411 |
| Total—Payments and Other Charges (C) | $5,324,844,467 | $5,154,069,164 |
| Receipts Less Payments (B - C) = (D) | $(224,222,695) | $206,181,486 |
| Closing Balance (A + D) | $96,423,778,971 | $96,648,001,666 |
| 2014 | 2013 | |
|---|---|---|
| The account transaction statement above is unaudited. | ||
| Opening Balance (A) | $550,792,204 | $142,589,690 |
| Receipts and Other Credits | ||
| Employee contributions | ||
|
Government employees
|
1,586,029,379 | 1,462,879,048 |
|
Retired employees
|
36,906,148 | 36,849,984 |
|
Public service corporation employees
|
151,031,744 | 135,731,961 |
| Employer contributions | ||
|
Government
|
2,519,014,713 | 2,492,724,245 |
|
Public service corporations
|
242,823,824 | 226,119,081 |
| Actuarial liability adjustment | 435,000,000 | 435,000,000 |
| Transfers from other pension funds | 91,526,497 | 131,267,992 |
| Transfer value election | 3,754,438 | 3,514,694 |
| Total—Receipts and Other Credits (B) | $5,066,086,742 | $4,924,087,005 |
| Payments and Other Charges | ||
| Annuities | $1,143,851,882 | $909,173,984 |
| Minimum benefits | 11,418,925 | 9,426,009 |
| Pension division payments | 27,576,454 | 19,792,756 |
| Pension transfer value payments | 302,264,857 | 224,367,506 |
| Returns of contributions | ||
|
Government employees
|
9,638,772 | 15,392,927 |
|
Public service corporation employees
|
3,505,117 | 2,736,087 |
| Transfers to other pension funds | 48,803,326 | 38,846,919 |
| Administrative expenses | 35,110,461 | 38,442,934 |
| Total—Payments and Other Charges (C) | $1,582,169,796 | $1,258,179,122 |
| Receipts Less Payments (B - C) | $3,483,916,946 | $3,665,907,883 |
| Transfers to Public Sector Pension Investment Board (D) | $(3,534,765,812) | $(3,257,705,370) |
| Closing Balance (A + B - C + D) | $499,943,338 | $550,792,203 |
Retirement Compensation Arrangements
Supplementary benefits for certain federal public service employees are provided under the Retirement Compensation Arrangements Regulations, No. 1, Parts I and II (public service portion), and the Retirement Compensation Arrangements Regulations, No. 2 (Early Retirement Incentive Program). The Special Retirement Arrangements Act authorized these regulations and established the Retirement Compensation Arrangements for the payment of benefits.
Transactions pertaining to Retirement Compensation Arrangement No. 1 and Retirement Compensation Arrangement No. 2, such as contributions, benefits and interest credits, are recorded in the Retirement Compensation Arrangements Account in the accounts of Canada. The Retirement Compensation Arrangements Account earns interest quarterly at the same rate as that credited to the Public Service Superannuation Account. The Retirement Compensation Arrangements Account is registered with the Canada Revenue Agency, and a transfer debit or credit is made annually between the Retirement Compensation Arrangements Account and the Canada Revenue Agency either to remit a 50-per-cent refundable tax for the net contributions and interest credits or to be credited a reimbursement based on the net benefit payments.
Actuarial shortfalls found between the balance in the Retirement Compensation Arrangements Account and the actuarial liabilities are credited to the Retirement Compensation Arrangements Account in equal instalments over a period of up to 15 years. As a result of the triennial valuation of , no adjustment was made to Retirement Compensation Arrangement No. 1 (nil in 2012–13), but a credit adjustment of $8 million was made to cover an actuarial deficiency in Retirement Compensation Arrangement No. 2 during the year ($8.0 million in 2012–13).
Retirement Compensation Arrangement No. 1
For tax purposes, financial transactions related to pension plan members' pensionable earnings over $155,000 in 2014 are recorded separately. As at , there were 5,556 public service employees (3,925 in 2013) and 9,544 retired members (7,527 in 2013) in this category.
| 2014 | 2013 | |
|---|---|---|
| The account transaction statement above is unaudited. | ||
| Opening Balance (A) | $975,251,232 | $910,164,231 |
| Receipts and Other Credits | ||
| Employee contributions | ||
|
Government employees
|
10,588,750 | 8,546,868 |
|
Retired employees
|
264,330 | 403,206 |
|
Public service corporation employees
|
1,721,296 | 1,627,632 |
| Employer contributions | ||
|
Government
|
83,641,858 | 75,927,626 |
|
Public service corporations
|
13,501,115 | 14,460,096 |
| Interest | 54,134,392 | 52,872,701 |
| Transfer from other pension funds | 24,072 | 92,262 |
| Transfer value election | 773 | 10,632 |
| Total—Receipts and Other Credits (B) | $163,876,586 | $153,941,023 |
| Payments and Other Charges | ||
| Annuities | $26,098,541 | $20,598,427 |
| Minimum benefits | 165,922 | 212,169 |
| Pension division payments | 903,333 | 252,898 |
| Pension transfer value payments | 324,334 | 745,370 |
| Returns of contributions | ||
|
Government employees
|
18,401 | 2,989 |
|
Public service corporation employees
|
5,809 | 3,918 |
| Transfers to other pension plans | 1,747,052 | 154,474 |
| Refundable tax | 69,699,727 | 66,883,777 |
| Total—Payments and Other Charges (C) | $98,963,118 | $88,854,022 |
| Receipts Less Payments (B - C) = (D) | 64,913,468 | 65,087,001 |
| Closing Balance (A + D) | $1,040,164,700 | $975,251,232 |
Retirement Compensation Arrangement No. 2
During the three year period starting , a number of employees between the ages of 50 and 54 left the public service under the Early Retirement Incentive Program, which waived the pension reduction under the Public Service Superannuation Act for employees who were declared surplus.
| 2014 | 2013 | |
|---|---|---|
| The account transaction statement above is unaudited. | ||
| Opening Balance (A) | $749,295,712 | $766,225,994 |
| Receipts and Other Credits | ||
| Government contributions and interest | ||
|
Contributions
|
0 | 0 |
|
Interest
|
38,383,183 | 41,350,683 |
| Actuarial liability adjustment | 8,000,000 | 8,000,000 |
| Total—Receipts and Other Credits (B) | $46,383,183 | $49,350,683 |
| Payments and Other Charges | ||
| Annuities | $84,639,840 | $84,001,208 |
| Refundable tax | (18,797,103) | (17,720,243) |
| Total—Payments and Other Charges (C) | 65,842,737 | 66,280,965 |
| Receipts Less Payments (B - C) = (D) | $(19,459,554) | $(16,930,282) |
| Closing Balance (A + D) | $729,836,158 | $749,295,712 |
Supplementary Death Benefit
As at , there were 287,563 active participants (292,713 in 2013) and 166,827 retired elective participants (159,545 in 2013) entitled to a Supplementary Death Benefit under Part II of the Public Service Superannuation Act. In 2013–14, 3,263 claims (4,419 in 2013) for Supplementary Death Benefits were paid.
| 2014 | 2013 | |
|---|---|---|
| The account transaction statement above is unaudited. Notes: Table 10 Notes
|
||
| Opening Balance (A) | $3,208,242,034 | $3,080,791,499 |
| Receipts and Other Credits | ||
| Contributions | ||
|
Employees (government and public service corporation)
|
96,660,263 | 95,496,841 |
|
Government
|
||
|
General
|
11,456,742 | 9,806,738 |
|
Single premium for $10,000 benefit
|
2,793,056 | 2,684,589 |
|
Public service corporations
|
1,315,296 | 1,264,435 |
| Interest | 170,131,983 | 172,062,762 |
| Total—Receipts and Other Credits (B) | $282,357,340 | $281,315,365 |
| Payments and Other Charges | ||
| Benefit payments | ||
|
General
table 10 note 1 1
|
$137,143,304 | $117,525,672 |
|
$10,000 Benefit
table 10 note 2 2
|
43,106,804 | 36,183,978 |
|
Other death benefit payments
|
337,605 | 155,180 |
| Total—Payments and Other Charges (C) | $180,587,713 | $153,864,830 |
| Receipts Less Payments (B - C) = (D) | $101,769,627 | $127,450,535 |
| Closing Balance (A + D) | $3,310,011,661 | $3,208,242,034 |
Statistical Tables
Statistical Table 1. Pensions in Pay
| Year | Pensions statistical table 1.1 note 1 1 | Survivor Pensions statistical table 1.1 note 2 2 | Total |
|---|---|---|---|
| Notes: Statistical Table 1.1 Notes
|
|||
| 2014 | 207,495 | 59,331 | 266,826 |
| 2013 | 200,975 | 58,123 | 259,098 |
| 2012 | 189,743 | 56,423 | 246,166 |
| Pensions statistical table 1.2 note 2 2 | Survivor Pensions | ||||||
|---|---|---|---|---|---|---|---|
| Year | Men | Women | Total | Spouse / Common- Law Partner | Children | Students | |
| Notes: Statistical Table 1.2 Notes
|
|||||||
| 2014 | Average annual amount | $31,882 | $22,974 | $28,019 | $13,031 | $2,038 | $3,471 |
| Average age | 71.3 | 68.5 | 70.1 | 80.1 | N/A | N/A | |
| Average pensionable service (years) | 25.4 | 22.7 | 24.2 | 22.3 | N/A | N/A | |
| 2013 | Average annual amount | $31,277 | $22,084 | $27,380 | $12,802 | $2,043 | $3,472 |
| Average age | 71.1 | 68.5 | 70.0 | 79.4 | N/A | N/A | |
| Average pensionable service (years) | 25.3 | 22.5 | 24.1 | 22.2 | N/A | N/A | |
| 2012 | Average annual amount | $31,063 | $21,498 | $27,135 | $12,555 | $1,991 | $2,794 |
| Average age | 71.1 | 68.7 | 70.1 | 78.5 | N/A | N/A | |
| Average pensionable service (years) | 25.7 | 22.5 | 24.4 | 22.2 | N/A | N/A | |
Statistical Table 2. Pensions That Became Payable
| Year | Men | Women | Total | Total Amount Paid | Average Pension |
|---|---|---|---|---|---|
| Notes: Statistical Table 2.1 Notes
|
|||||
| 2014 | 4,811 | 6,028 | 10,839 | $385,271,381 | $35,548 |
| 2013 | 6,033 | 7,313 | 13,346 | $450,740,734 | $33,773 |
| 2012 | 5,066 | 5,580 | 10,646 | $384,398,234 | $36,107 |
| Year | Spouse / Common-Law Partner | Children and Students | Total | Total Amount Paid | Average Pension Spouse / Common-Law Partner | Average Pension Children and Students |
|---|---|---|---|---|---|---|
| Notes: Statistical Table 2.2 Notes
|
||||||
| 2014 | 2,285 | 628 | 2,913 | $36,505,401 | $15,091 | $3,349 |
| 2013 | 2,557 | 363 | 2,920 | $38,025,675 | $15,850 | $2,930 |
| 2012 | 2,640 | 249 | 2,889 | $38,935,387 | $14,488 | $2,757 |
Statistical Table 3. Unreduced Pensions, Immediate Annuities statistical table 3 note 1 1 (year ended March 31)
| Year | 50– 54 statistical table 3 note 2 2 |
55 | 56 | 57 | 58 | 59 | 60 statistical table 3 note 3 3 |
61 | 62 | 63 | 64 | 65 | 66 and over | Total | Average Age statistical table 3 note 4 4 | Average Unreduced Pension statistical table 3 note 5 5 |
|---|---|---|---|---|---|---|---|---|---|---|---|---|---|---|---|---|
| Notes: Statistical Table 3 Notes
|
||||||||||||||||
| 2014 | 69 | 1,521 | 614 | 563 | 478 | 451 | 1,227 | 576 | 494 | 435 | 397 | 486 | 767 | 8,078 | 60 | $39,273 |
| 2013 | 57 | 1,668 | 755 | 679 | 609 | 537 | 1,624 | 702 | 617 | 482 | 465 | 561 | 903 | 9,659 | 60 | $36,668 |
| 2012 | 62 | 1,508 | 556 | 499 | 484 | 403 | 1,300 | 603 | 481 | 386 | 399 | 480 | 689 | 7,850 | 60 | $40,079 |
Statistical Table 4. Reduced Pension (Annual Allowances) and Lump-Sum Payments That Became Payable (year ended March 31)
| Reduced Pensions statistical table 4 note 1 1 | Lump-Sum Payments statistical table 4 note 2 2 | |||||
|---|---|---|---|---|---|---|
| Year | Number for Men | Number for Women | Total Number | Average Allowance | Number | Amount |
| Notes: Statistical Table 4 Notes
|
||||||
| 2014 | 592 | 1,065 | 1,657 | $29,536 | 9,071 | $478,127,833 |
| 2013 | 1,027 | 1,710 | 2,737 | $29,224 | 11,767 | $373,460,521 |
| 2012 | 654 | 1,066 | 1,720 | $29,648 | 4,811 | $249,328,748 |
Statistical Table 5. Changes in Number of Active Contributors, Retired Members, and Survivors on Pension
| Men | Women | Total | |
|---|---|---|---|
| Notes: Statistical Table 5.1 Notes
|
|||
| Number of Active Contributors, | 132,764 | 167,405 | 300,169 |
| Additions | 8,754 | 11,358 | 20,112 |
| Deletions statistical table 5.1 note 1 1 | 10,108 | 13,498 | 23,606 |
| Adjustments statistical table 5.1 note 2 2 | 1,257 | 1,361 | 2,618 |
| Number of Active Contributors, | 132,667 | 166,626 | 299,293 |
| Total | |
|---|---|
| Notes: Statistical Table 5.2 Notes
|
|
| Number of Retired Members, | 200,975 |
|
Additions
|
10,839 |
|
Deletions
|
3,644 |
| Adjustments statistical table 5.2 note 2 2 | (675) |
| Number of Retired Members, | 207,495 |
| Total | |
|---|---|
| Notes: Statistical Table 5.3 Notes
|
|
| Number of Survivors on Pension, | 56,789 |
|
Additions
|
2,285 |
|
Deletions
|
383 |
| Adjustments statistical table 5.3 note 1 1 | (717) |
| Number of Survivors on Pension, | 57,974 |
| Total | |
|---|---|
| Notes: Statistical Table 5.4 Notes
|
|
| Number of Children and Students on Pension, | 1,334 |
|
Additions
|
628 |
|
Deletions
|
222 |
| Adjustments statistical table 5.4 note 1 1 | (383) |
| Number of Children and Students on Pension, | 1,357 |
Statistical Table 6. Number and Amount of Transfer Value Payments by Years of Pensionable Service and Age at Termination (year ended )
| Years of Pensionable Service | Age at Termination | ||||||
|---|---|---|---|---|---|---|---|
| Under 30 | 30–34 | 35–39 | 40–44 | 45–49 | Total | Total ($) | |
| Under 5 | 430 | 319 | 181 | 172 | 177 | 1,279 | |
| 5–9 | 69 | 162 | 162 | 115 | 108 | 616 | |
| 10–14 | 1 | 40 | 104 | 121 | 123 | 389 | |
| 15–19 | 0 | 0 | 12 | 50 | 76 | 138 | |
| 20–24 | 0 | 0 | 1 | 26 | 77 | 104 | |
| 25–29 | 0 | 0 | 0 | 0 | 18 | 18 | |
| 30–35 | 0 | 0 | 0 | 0 | 8 | 8 | |
| Overall Total | 500 | 521 | 460 | 484 | 587 | 2,552 | $347,659,882 |
| Total Women | 1,490 | ||||||
| Total Men | 1,062 | ||||||
Statistical Table 7. Supplementary Death Benefit—Number of Participants and Number of Benefits Paid (year ended March 31)
| Active Participants statistical table 7 note 1 1 | Retired Participants statistical table 7 note 2 2 | Death Benefits Paid | ||||||||
|---|---|---|---|---|---|---|---|---|---|---|
| Year | Men | Women | Total | Men | Women | Total | Men | Women | Total | Amount Paid |
| Notes: Statistical Table 7 Notes
|
||||||||||
| 2014 | 126,151 | 161,412 | 287,563 | 94,655 | 72,172 | 166,827 | 2,358 | 905 | 3,263 | $180,587,713 |
| 2013 | 128,150 | 164,563 | 292,713 | 92,445 | 67,100 | 159,545 | 3,097 | 1,322 | 4,419 | $153,864,830 |
| 2012 | 133,878 | 172,041 | 305,919 | 90,057 | 61,648 | 151,705 | 3,421 | 1,493 | 4,914 | $164,082,537 |
Financial Statements of the Public Service Pension Plan for the Fiscal Year Ended
Statement of Responsibility
Responsibility for the integrity and fairness of the financial statements of the public service pension plan (the pension plan) rests with Public Works and Government Services Canada (PWGSC) and the Treasury Board of Canada Secretariat (TBS). TBS carries out responsibilities in respect of the overall management of the pension plan, while PWGSC is responsible for the day-to-day administration of the pension plan and for maintaining the books of accounts.
The financial statements of the pension plan for the year ended , have been prepared in accordance with the government's stated accounting policies for the pension plan set out in Note 2 of the financial statements, which are based on Canadian accounting standards for pension plans. The presentation and results using the stated accounting policies do not result in any significant differences from Canadian accounting standards for pension plans. The financial statements include management's best estimates and judgments where appropriate.
To fulfill its accounting and reporting responsibilities, PWGSC has developed and maintains books, records, internal controls, and management practices designed to provide reasonable assurance as to the reliability of the financial information and to ensure that transactions are in accordance with the Public Service Superannuation Act (PSSA) and regulations, as well as the Financial Administration Act (FAA) and regulations.
Additional information, as required, is obtained from the Public Sector Pension Investment Board (PSPIB). PSPIB maintains its own records and systems of internal control to account for the funds managed on behalf of the pension plan in accordance with the Public Sector Pension Investment Board Act, regulations and by-laws.
These statements have been audited by the Auditor General of Canada, the independent auditor for the Government of Canada.
Approved by:
George Da Pont
Deputy Minister and Deputy Receiver
General for Canada
Public Works and Government
Services Canada
Original signed by
Yaprak Baltacıoğlu
Secretary of the Treasury Board
Treasury Board of Canada Secretariat
Original signed by
Independent Auditor's Report
To the President of the Treasury Board and the Minister of Public Works and Government Services
Report on the Financial Statements
I have audited the accompanying financial statements of the public service pension plan, which comprise the statement of financial position as at , and the statement of changes in net assets available for benefits and statement of changes in pension obligations for the year then ended, and a summary of significant accounting policies and other explanatory information.
Management's Responsibility for the Financial Statements
Management is responsible for the preparation and fair presentation of these financial statements in accordance with the stated accounting policies set out in Note 2 of the financial statements, which conform with Canadian accounting standards for pension plans, and for such internal control as management determines is necessary to enable the preparation of financial statements that are free from material misstatement, whether due to fraud or error.
Auditor's Responsibility
My responsibility is to express an opinion on these financial statements based on my audit. I conducted my audit in accordance with Canadian generally accepted auditing standards. Those standards require that I comply with ethical requirements and plan and perform the audit to obtain reasonable assurance about whether the financial statements are free from material misstatement.
An audit involves performing procedures to obtain audit evidence about the amounts and disclosures in the financial statements. The procedures selected depend on the auditor's judgment, including the assessment of the risks of material misstatement of the financial statements, whether due to fraud or error. In making those risk assessments, the auditor considers internal control relevant to the entity's preparation and fair presentation of the financial statements in order to design audit procedures that are appropriate in the circumstances, but not for the purpose of expressing an opinion on the effectiveness of the entity's internal control. An audit also includes evaluating the appropriateness of accounting policies used and the reasonableness of accounting estimates made by management, as well as evaluating the overall presentation of the financial statements.
I believe that the audit evidence I have obtained is sufficient and appropriate to provide a basis for my audit opinion.
Opinion
In my opinion, the financial statements present fairly, in all material respects, the financial position of the public service pension plan as at , and the changes in its net assets available for benefits and changes in its pension obligations for the year then ended in accordance with Canadian accounting standards for pension plans.
Report on Other Legal and Regulatory Requirements
In my opinion, the transactions of the public service pension plan that have come to my notice during my audit of the financial statements have, in all significant respects, been in accordance with the Public Service Superannuation Act and regulations, the Public Sector Pension Investment Board Act and regulations and the by-laws of the Public Sector Pension Investment Board.
Original signed by
Nancy Y. Cheng, FCPA, FCA
Assistant Auditor General
for the Auditor General of Canada
Ottawa, Canada
Financial Statements
| As at | As at (Note 3) | As at (Note 3) | |
|---|---|---|---|
| Assets | |||
| Commitments (Note 24) The accompanying notes are an integral part of these financial statements. |
|||
|
Public Service Pension Fund (
Note 5)
|
$500 | $551 | $142 |
|
Investments (
Note 6)
|
73,869 | 59,610 | 51,345 |
|
Investment-related assets (
Note 6)
|
1,408 | 1,612 | 919 |
|
Contributions receivable (
Note 9)
|
910 | 896 | 1,011 |
|
Other assets (
Note 10)
|
111 | 70 | 66 |
| Total Assets | $76,798 | $62,739 | 53,483 |
| Liabilities | |||
|
Investment-related liabilities (
Note 6)
|
$7,110 | $5,709 | 5,120 |
|
Accounts payable and other liabilities
|
111 | 101 | 82 |
| Net Assets Available for Benefits | $69,577 | $56,929 | 48,281 |
| Pension Obligations | |||
|
Unfunded (
Note 14)
|
$92,064 | $93,783 | $93,018 |
|
Funded (
Note 14)
|
65,522 | 59,965 | 52,907 |
| Total Pension Obligations | $157,586 | $153,748 | $145,925 |
| Deficit – To be Financed by the Government of Canada (Note 15) | $(88,009) | $(96,819) | $(97,644) |
| 2014 | 2013 (Note 3) | |
|---|---|---|
| The accompanying notes are an integral part of these financial statements. | ||
| Net Assets Available for Benefits, Beginning of Year | $56,929 | $48,281 |
| Increase in Net Assets Available for Benefits | ||
|
Investment income, excluding changes in fair values of investment assets and investment liabilities (
Note 17)
|
1,603 | 1,293 |
|
Changes in fair values of investment assets and investment liabilities – realized and unrealized gains and losses (
Note 17)
|
7,704 | 3,938 |
|
Contributions
|
||
|
From Plan Members (
Note 16)
|
1,796 | 1,660 |
|
From Employers (
Note 16)
|
2,753 | 2,579 |
|
Actuarial adjustment (
Note 18)
|
435 | 435 |
|
Transfers from other pension plans
|
96 | 135 |
| Total Increase in Net Assets Available for Benefits | $14,387 | $10,040 |
| Decrease in Net Assets Available for Benefits | ||
|
Benefits paid with respect to service after
(
Note 19)
|
$1,155 | $919 |
|
Refunds and transfers (
Note 19)
|
392 | 301 |
|
Administrative expenses
|
192 | 172 |
| Total Decrease in Net Assets Available for Benefits | $1,739 | $1,392 |
| Net Increase in Net Assets Available for Benefits | $12,648 | $8,648 |
| Net Assets Available for Benefits, End of Year | $69,577 | $56,929 |
| 2014 Funded |
2014 Unfunded |
2014 Total |
2013 Funded |
2013 Unfunded |
2013 Total |
|
|---|---|---|---|---|---|---|
| The accompanying notes are an integral part of these financial statements. | ||||||
| Pension Obligations, Beginning of Year | $59,965 | $93,783 | $153,748 | $52,907 | $93,018 | $145,925 |
| Increase in Pension Obligations | ||||||
|
Interest on pension obligations
|
2,891 | 4,921 | 7,812 | 3,058 | 5,155 | 8,213 |
|
Benefits earned
|
4,561 | 0 | 4,561 | 4,532 | 0 | 4,532 |
|
Changes in actuarial assumptions (gains)/losses (Note 14) |
(19) | (878) | (897) | 898 | 1,029 | 1,927 |
|
Transfers from other pension plans
|
95 | 0 | 95 | 134 | 1 | 135 |
| Total Increase in Pension Obligations | $7,528 | $4,043 | $11,571 | $8,622 | $6,185 | $14,807 |
| Decrease in Pension Obligations | ||||||
|
Benefits paid (
Note 19)
|
$1,155 | $5,181 | $6,336 | $919 | $5,010 | $5,929 |
|
Experience gains
|
389 | 437 | 826 | 306 | 266 | 572 |
|
Refunds and transfers (
Note 19)
|
392 | 86 | 478 | 301 | 72 | 373 |
| 35 | 58 | 93 | 38 | 72 | 110 | |
| Total Decrease in Pension Obligations | $1,971 | $5,762 | $7,733 | $1,564 | $5,420 | $6,984 |
| Net Increase (Decrease) in Pension Obligations | $5,557 | $(1,719) | $3,838 | $7,058 | $765 | $7,823 |
| Pension Obligations, End of Year | $65,522 | $92,064 | $157,586 | $59,965 | $93,783 | $153,748 |
Notes to the Financial Statements
Year Ended (Canadian $)
1. Description of the Public Service Pension Plan
The public service pension plan (the pension plan), governed by the Public Service Superannuation Act (PSSA), provides pension benefits for federal public service employees. While the PSSA has been in effect since , federal legislation has been providing pensions for public servants since 1870.
The main provisions of the pension plan are summarized below.
(A) General
The pension plan is a contributory defined benefit plan covering substantially all of the full-time and part-time employees of the Government of Canada (the Government), certain Crown corporations, and territorial governments. Membership in the pension plan is compulsory for all eligible employees.
The Government is the sole sponsor of the pension plan. The President of the Treasury Board is the Minister responsible for the PSSA. The Treasury Board of Canada Secretariat (the Secretariat) is responsible for the management of the pension plan while Public Works and Government Services Canada (PWGSC) provides the day-to-day administration of the pension plan and maintains the books of accounts. The Office of the Chief Actuary (OCA), an independent unit within the Office of the Superintendent of Financial Institutions (OSFI) performs periodic actuarial valuations of the pension plan.
Until , separate market-invested funds were not set aside to provide for payment of pension benefits. Instead, transactions relating to the pension plan were recorded in a Public Service Superannuation Account (superannuation account) created by legislation in the accounts of Canada. Pursuant to the PSSA, as amended by the Public Sector Pension Investment Board Act, transactions relating to service since , are now recorded in the Public Service Pension Fund (Pension Fund). An amount equal to contributions in excess of benefit payments and administrative costs is transferred regularly to the Public Sector Pension Investment Board (PSPIB) and invested in capital markets. PSPIB is a Crown corporation whose statutory objectives are to manage the funds transferred to it for investment and to maximize investment returns without undue risk of loss, having regard to the funding, policies and requirements of the three main public sector pension plans (i.e., public service, Royal Canadian Mounted Police (RCMP) and Canadian Forces).
(B) Funding Policy
The pension plan is funded from plan member and employer contributions, and investment earnings. For the fiscal year, plan members of the public service pension on or before (i.e., Group 1) contributed 6.85 percent (2013 – 6.20 percent) for the first nine months and 7.50 percent (2013 – 6.85 percent) for the last three months of pensionable earnings up to the maximum covered by the Canada Pension Plan (CPP) or Québec Pension Plan (QPP); and 9.20 percent (2013 – 8.60 percent) for the first nine months and 9.80 percent for the last three months (2013 – 9.20 percent) of pensionable earnings above that maximum. The contribution rates for public service employees joining the pension plan on or after (i.e., Group 2) was set at 6.62 percent of pensionable earnings up to the maximum covered by the CPP and QPP, and 7.89 percent of pensionable earnings above that maximum. The Government's contribution is made monthly to provide for the cost (net of plan member contributions) of the benefits that have accrued in respect of that month at a rate determined by the President of the Treasury Board. The contribution rates are determined based on actuarial valuations, which are performed triennially.
The PSSA provides that all pension obligations arising from the pension plan be met by the Government. The PSSA requires that any actuarial deficit in the Pension Fund be dealt with by transferring equal instalments to the Pension Fund over a period of up to 15 years, commencing in the year in which the actuarial report is tabled in Parliament. PSSA also allows any surplus to be lowered by reducing Government and pension plan member contributions. In addition, if there is an amount considered to be non-permitted surplus (refer to PSSA section 44.4(5) for definition of non-permitted surplus) related to the Pension Fund, no further Government pension contributions are permitted while pension plan member contributions under the Pension Fund may be reduced and amounts from PSPIB may be transferred to the Government's Consolidated Revenue Fund (CRF).
(C) Benefits
The pension plan provides pension benefits based on the number of years of pensionable service up to a maximum of 35 years. Benefits are determined by a formula set out in the legislation; they are not based on the financial status of the pension plan. The basic benefit formula is 2 percent per year of pensionable service multiplied by the average of the five consecutive years of highest paid service.
Pension benefits are coordinated with the CPP and QPP, and the resulting pension reduction factor for pension plan members reaching age 65, or earlier if totally and permanently disabled, has been lowered from a level of 0.7 percent for those turning age 65 in calendar year 2007 or earlier to 0.625 percent for those turning age 65 in calendar year 2012 and later. Also, benefits are fully indexed to the increase in the Consumer Price Index.
Other benefits include survivor pensions, minimum benefits in the event of death, unreduced early retirement pensions, and disability pensions. To reflect the Income Tax Act restrictions on registered pension plan benefits, separate Retirement Compensation Arrangements (RCAs) have been implemented to provide benefits that exceed the limits established in the Income Tax Act. Since the RCAs are covered by separate legislation, their account balances in the accounts of Canada are not consolidated in these financial statements; however, condensed information is presented in Note 22.
2. Significant Accounting Policies
(A) Basis of Presentation
These financial statements present information on the pension plan on a going-concern basis. They are prepared to assist plan members and others in reviewing the activities of the pension plan for the year, not to portray the funding requirements of the pension plan.
These financial statements are prepared in Canadian dollars, the plan's functional currency, in accordance with the accounting policies stated below, which are based on Canadian accounting standards for pension plans in Part IV of the Chartered Professional Accountants (CPA) Canada Handbook (Section 4600). Section 4600 provides specific accounting guidance on investments and pension obligations. For accounting policies that do not relate to either investments or pension obligations, the plan complies with International Financial Reporting Standards (IFRS) in Part I of the CPA Canada Handbook. To the extent that IFRS in Part I is inconsistent with Section 4600, Section 4600 takes precedence. The presentation and results using the stated accounting policies do not result in any significant differences from Canadian accounting standards for pension plans.
PSPIB qualifies as an investment entity, and consequently, does not consolidate its subsidiaries other than those that solely provide it with services that relate to its investment activities. Instead, PSPIB measures its investments in subsidiaries at fair value through profit or loss ("FVTPL") including those that are formed by PSPIB and that qualify as investment entities ("investment entity subsidiaries"). PSPIB also measures its investments in associates, joint ventures and financial assets and financial liabilities at FVTPL.
The financial statements for the year ended were authorized for issue by the signatories on .
(B) Valuation of Assets
The Pension Fund represents investments held by PSPIB and allocated to the pension plan. Investments, investment-related assets and investment-related liabilities are recorded at the date upon which PSPIB becomes a party to the associated contractual provisions, and are carried at fair value. Purchases and sales are recorded as of the trade date. Fair value is the amount of consideration that would be agreed upon in an arm's length transaction between knowledgeable, willing parties who are under no compulsion to act.
At trade date, the best evidence of fair value is the transaction price. At each subsequent reporting year-end, market prices are used to determine fair value where an active market exists (such as a recognized securities exchange), as they reflect actual and regularly occurring market transactions on an arm's length basis. If quoted market prices are not available, then fair values are estimated using present value or other valuation techniques, using inputs existing at the end of the reporting year that are derived from observable market data.
Valuation techniques are generally applied to investments in real estate, private equity, infrastructure and renewable resources, over-the-counter (OTC) derivatives and certain fixed income securities. The values derived from applying these techniques are impacted by the choice of valuation model and the underlying assumptions made concerning factors such as the amounts and timing of future cash flows, discount rates, volatility and credit risk. In certain cases, such assumptions are not supported by market observable data.
The valuation methods of the investments are described in Note 6 (A) and Note 6 (B).
(C) Transaction Costs
Transaction costs are incremental costs directly attributable to the acquisition, due diligence, issue, or disposal of a financial asset or financial liability. Transaction costs are expensed as incurred and are recorded as a component of investment income (loss).
(D) Investment Management Fees
Investment management fees are directly attributable to the external management of assets on behalf of PSPIB. Management fees incurred for investments in private markets and certain private debt portfolios are paid by the investment directly, through capital contributions by PSPIB or offset against distributions received from the investment (Note 6 (A) (II)). Management fees are also incurred for certain public markets and alternative investments, and are paid either directly by PSPIB or offset against distributions received from pooled fund investments. In both cases, they are recorded against investment income (loss) (Note 17).
(E) Income Recognition
The investment income (loss) has been allocated proportionately by PSPIB based on the asset value held by the pension plan.
Investment income (loss) is made up of interest income, dividends, realized gains (losses) on the disposal of investments and unrealized gains (losses) which reflect the change in unrealized appreciation (depreciation) of investments held at the end of the year. Interest income is recognized as earned. Dividends are recognized on the ex-dividend date and are classified as dividend income. Private markets distributions from pooled funds, limited partnerships or from direct investments and co-investments are classified as interest income, dividend income or realized gains (losses) as appropriate. Co-investments are investments in private entities where the investment is made in conjunction with an external manager with whom PSPIB already has committed and delegated funds. Dividend expense related to securities sold short and securities lending income (net of fees on securities borrowed) are classified as other (net).
(F) Contributions
Contributions for current service are recorded in the year in which the related payroll costs are incurred. Contributions for past service that are receivable over a period in excess of one year are recorded at the estimated net present value of the contributions to be received.
(G) Benefits Earned, Benefits Paid, and Refunds and Transfers
Benefits are accrued as pensionable service accumulates. Benefits paid are recognized as a reduction of pension obligations, and net assets available for benefits when paid.
Benefit payments, refunds to former members and transfer payments to other plans are recorded in the period in which they are paid. Any benefit payment accruals not paid are reflected in accrued pension benefits.
(H) Translation of Foreign Currencies
Investment transactions in foreign currencies are recorded at exchange rates prevailing on the transaction date. Investments denominated in foreign currencies and held at the end of the year are translated at exchange rates in effect at the year-end date. Any realized and unrealized gains (losses) on foreign exchange are included in investment income (loss).
(I) Use of Estimates
The preparation of these financial statements based on Canadian accounting standards for pension plans requires management to make use of estimates and assumptions which can affect the reported values of investment assets and investment liabilities, pension obligations, income and expenses, and related disclosures at the date of the financial statements.
In making estimates and using assumptions, management relies on external information and observable conditions where possible. The estimates and associated assumptions are based on historical experience and other factors that are considered to be relevant. Actual results may differ from the estimates and assumptions. The estimates and underlying assumptions are reviewed on an ongoing basis. Revisions to accounting estimates are recognized in the period in which the estimate is revised if the revision affects only that period or in the period of the revision and future periods if the revision affects both current and future periods.
(J) Pension Obligations
The present value of pension obligations is calculated by using the projected benefit method prorated on service, based on management's best estimate assumptions.
3. Change in Accounting Policies
Removal of the Superannuation Account
For many years, management had reported the superannuation account as part of "Other Accounts Available for Benefits" in the pension plan's Statement of Financial Position. Management had also included certain transactions, including benefits paid for service before and interest income on the superannuation account, in the Statement of Changes in Net Assets Available for Benefits.
Management has determined that the balances and transactions in the superannuation account should be removed from the pension plan's Statement of Financial Position and the Statement of Changes in Net Assets Available for Benefits. This change will provide more reliable and relevant information to the users of the financial statements.
The superannuation account represents a tracking of all contributions, benefit payments, interest, charges and transfers that pertain to service before . The financial position of the superannuation account and the transactions recorded within this account are reported in Note 21. The amounts in Note 21 are the amounts that have been removed from the Statement of Financial Position and Statement of Changes in Net Assets Available for Benefits. The impact of these eliminations on the prior year are summarized in the tables below.
The pension promise to the plan members and beneficiaries is not affected by the removal of the superannuation account from the pension plan financial statements. The PSSA requires that all pension obligations arising from the plan be met.
| As Previously Reported Table 28 note 1 1 | Effect of Presentation Changes | Revised Based on Changes in Presentation | |
|---|---|---|---|
| Assets | |||
Table 28 Notes
|
|||
|
Public Service Pension Fund
|
$551 | $0 | $551 |
|
Investments
|
59,610 | 0 | 59,610 |
|
Investment-related assets
Table 28 note 1 1
|
1,612 | 0 | 1,612 |
|
Contributions receivable—post–
|
896 | 0 | 896 |
|
Other assets
|
70 | 0 | 70 |
| Total Assets | $62,739 | $0 | $62,739 |
| Liabilities | |||
|
Investment-related liabilities
Table 28 note 1 1
|
$5,709 | $0 | $5,709 |
|
Accounts payable and other liabilities
|
101 | 0 | 101 |
| Net Assets | $56,929 | $0 | $56,929 |
| Other Accounts | |||
|
Public Service Superannuation Account
|
$96,648 | $ (96,648) | $0 |
|
Contributions receivable
pre– service
|
120 | (120) | 0 |
| Net Assets Available for Benefits | $153,697 | $(96,768) | $56,929 |
| Pension Obligations | $153,748 | $0 | $153,748 |
| Deficit - To be Financed by the Government of Canada | $(51) | $(96,768) | $(96,819) |
| As Previously Reported | Effect of Presentation Changes | Revised Based on Changes in Presentation | |
|---|---|---|---|
| Assets | |||
|
Public Service Pension Fund
|
$142 | $0 | $142 |
|
Investments
|
51,345 | 0 | 51,345 |
|
Investment-related assets
|
919 | 0 | 919 |
|
Contributions receivable—post–
service
|
1,011 | 0 | 1,011 |
|
Other assets
|
66 | 0 | 66 |
| Total Assets | $53,483 | $0 | $53,483 |
| Liabilities | |||
|
Investment-related liabilities
|
$5,120 | $0 | $5,120 |
|
Accounts payable and other liabilities
|
82 | 0 | 82 |
| Net Assets | $48,281 | $0 | $48,281 |
| Other Accounts | |||
|
Public Service Superannuation Account
|
$96,442 | $(96,442) | $0 |
|
Contributions receivable—pre–
service
|
150 | (150) | 0 |
| Net Assets Available for Benefits | $144,873 | $(96,592) | $48,281 |
| Pension Obligations | $145,925 | $0 | $145,925 |
| Deficit - To be Financed by the Government of Canada | $(1,052) | $(96,592) | $(97,644) |
| As Previously Reported | Effect of Presentation Changes | Revised Based on Changes in Presentation | |
|---|---|---|---|
| Net Assets Available for Benefits, Beginning of Year | $144,873 | $(96,592) | $48,281 |
| Increase in Net Assets Available for Benefits | |||
|
Interest income on the Public Service Superannuation Account
|
5,318 | (5,318) | 0 |
|
Investment income, excluding changes in fair values of investment assets and investment liabilities
|
1,293 | 0 | 1,293 |
|
Changes in fair values of investment assets and investment liabilities – realized and unrealized gains and losses
|
3,938 | 0 | 3,938 |
|
Contributions
|
|||
|
From plan members
|
1,668 | (8) | 1,660 |
|
From employers
|
2,583 | (4) | 2,579 |
|
Actuarial adjustment
|
435 | 0 | 435 |
|
Transfers from other pension plans
|
135 | 0 | 135 |
| Total Increase in Net Assets Available for Benefits | $15,370 | $(5,330) | $10,040 |
| Decrease in Net Assets Available for Benefits | |||
|
Benefits paid
|
$5,929 | $ (5,010) | $919 |
|
Refunds and transfers
|
373 | (72) | 301 |
|
Administrative expenses
|
244 | (72) | 172 |
| Total Decrease in Net Assets Available for Benefits | $6,546 | $(5,154) | $1,392 |
| Net Increase in Net Assets Available for Benefits | $8,824 | $(176) | $8,648 |
| Net Assets Available for Benefits, End of Year | $153,697 | $(96,768) | $56,929 |
4. Application of New IFRS and Future Changes in Accounting Standards
(A) Application of new IFRS
Management has adopted the changes made to the following IFRS that are mandatorily effective for this year end.:
- IFRS 7 – financial instruments: disclosures
- The new disclosure requirements of this new standard, that includes the offsetting of financial assets and financial liabilities, have been applied retrospectively, and the effects of the new disclosure requirements are presented in Note 8 (D).
- IFRS 12 – disclosures of interests in other entities
- This standard requires disclosures for Investments in Associates and Joint Ventures. The new standard combines, enhances and replaces the disclosure requirements for subsidiaries, associates, joint arrangements and unconsolidated structured entities. IFRS 12 is a new standard on disclosure whose adoption had no impact on pension plan financial position. The new disclosure requirements are presented in Note 7.
- IFRS 13 – fair value measurement of financial instruments
- The adoption of this new standard for measuring fair value of financial instruments has no material impact on the value of the investments held by PSPIB on behalf of the pension plan.
(B) Future Changes in Accounting Standards
A number of new standards, amendments and interpretations have been issued by the International Accounting Standards Board (IASB), but are not yet effective. The following are those that relate to one or more of the pension plan's significant accounting policies or disclosures:
- IFRS 11 Joint Arrangement
- IFRS 11 was amended , effective in annual periods beginning on or after , to add new guidance on the accounting for acquisitions of interests in a joint operation that constitutes a business. Acquirers of such interests shall apply all of the principles in business combinations accounting in IFRS 3 Business Combinations, and other IFRS, that do not conflict with the guidance in IFRS 11 and disclose the information that is required in those IFRS in relation to business combinations. Management is currently assessing the impact of adopting this amendment.
- IFRS 9 Financial Instruments
-
In July 2014, the IASB published final revisions to IFRS 9 by issuing a complete standard that carries over the existing requirements in the 2013 revision and introduces certain limited amendments. Such amendments include adding a new fair value through other comprehensive income category to measure certain debt instruments.
This final version of IFRS 9 is effective for annual periods beginning on or after with early application permitted. Management is currently assessing the impact of adopting this final version of the standard.
5. Public Service Pension Fund
The Government has a statutory obligation to pay benefits relating to the pension plan. This pension obligation is to plan members and their beneficiaries. In order for the Government to track the transactions related to contributions, benefit payments, interest and transfers, the Government established the Pension Fund in the accounts of Canada. The accounts have no capacity to pay pensions. All cash receipts and disbursements go to or come from the CRF.
In 1999, the pension legislation was amended to allow the Government to invest funds in capital markets in order to provide for the pension obligations. This legislation created the PSPIB to manage and invest amounts that are transferred regularly to it from the CRF related to service since . The transactions are recorded in the Pension Fund. The Pension Fund is merely a flow through account. At year-end, the balance in the Pension Fund represents net contributions awaiting transfer to PSPIB. PSPIB investment assets and investment-related liabilities are reflected directly in the pension plan's financial statements.
6. Investments
(A) Investment Portfolio
| 2014 Fair Value |
2014 Cost |
2013 Fair Value |
2013 Cost |
|
|---|---|---|---|---|
| Investments | ||||
| Public Markets | ||||
|
Canadian Equity
|
$6,631 | $5,588 | $6,721 | $6,439 |
|
Foreign Equity
|
20,166 | 15,264 | 15,265 | 13,452 |
| Private Markets | ||||
|
Real Estate
|
9,292 | 7,664 | 7,939 | 6,833 |
|
Private Equity
|
5,874 | 3,830 | 5,115 | 3,943 |
|
Infrastructure
|
4,752 | 4,469 | 3,248 | 3,368 |
|
Renewable Resources
|
862 | 756 | 306 | 274 |
| Fixed Income | ||||
|
Cash and Money Market Securities
|
2,812 | 2,812 | 2,626 | 2,626 |
|
Government and Corporate Bonds
|
12,421 | 12,060 | 8,169 | 8,009 |
|
Inflation-Linked Bonds
|
3,630 | 3,046 | 3,190 | 2,782 |
|
Other Fixed Income Securities
|
5,238 | 4,511 | 5,725 | 5,125 |
| Alternative Investments | 2,191 | 1,854 | 1,306 | 1,094 |
|
Total Investments
|
$73,869 | $61,854 | $59,610 | $53,945 |
| Investment-Related Assets | ||||
|
Amounts Receivable from Pending Trades
|
$534 | $534 | $817 | $817 |
|
Interest Receivable
|
159 | 159 | 111 | 111 |
|
Dividends Receivable
|
60 | 60 | 49 | 49 |
|
Derivative-Related Receivables
|
655 | 500 | 635 | 207 |
|
Total Investment-Related Assets
|
$1,408 | $1,253 | $1,612 | $1,184 |
| Investment-Related Liabilities | ||||
|
Amounts Payable from Pending Trades
|
$(689) | $(689) | $(805) | $(805) |
|
Interest Payable
|
(20) | (20) | (18) | (18) |
|
Securities Sold Short
|
(520) | (500) | (341) | (339) |
|
Securities Sold Under Repurchase Agreements
|
(460) | (462) | (444) | (444) |
|
Derivative-Related Payables
|
(881) | (418) | (535) | (179) |
|
Capital Market Debt Financing (
Note 9)
|
(4,540) | (4,479) | (3,566) | (3,522) |
|
Total Investment-Related Liabilities
|
$(7,110) | $(6,568) | $(5,709) | $(5,307) |
|
Net Investments
|
$68,167 | $56,539 | $55,513 | $49,822 |
(I) Public Markets
Public markets consist of Canadian and foreign investments in the following securities: common shares, American depository receipts, global depository receipts, participation notes, preferred shares, income trust units, exchange traded funds units, pooled funds units, and securities convertible into common shares of publicly listed issuers.
Valuation Techniques
Direct investments in Canadian and foreign equities are measured at fair value using quoted market prices, namely, the bid price. In the case of investments in pooled funds, fair value is measured using unit values obtained from each of the funds' administrators, which are derived from the fair value of the underlying investments in each pooled fund. Where necessary, the impact of restrictions on the sale or redemption of such investments is taken into consideration in determining fair value.
(II) Private Markets
Private markets consist of investments in real estate, private equity, infrastructure and renewable resources.
Real estate investments are comprised of direct equity positions in various private entities, fund investments, as well as properties in the real estate sector. Real estate investments focus on partnerships, companies and properties operating mainly in the retirement and residential, office, retail and industrial sectors, as well as private funds invested in real estate assets. Real estate investments are accounted for net of all third-party financings. As at , the total amount of third-party financing included as part of real estate contracted by direct investments controlled by PSPIB was $2,945 million (2013 – $2,623 million).
Private equity investments are comprised of fund investments with similar objectives, co-investments in private entities as well as direct equity positions.
Infrastructure investments are comprised of direct equity positions, fund investments and co-investments in various private entities. Infrastructure investments focus on entities engaged in the management, ownership or operation of assets in energy, transportation and other regulated businesses. Infrastructure investments are accounted for net of all third-party financings. As at , the total amount of third-party financing included as part of infrastructure contracted by direct investments controlled by PSPIB for the pension plan was $1,196 million (2013 – $202 million).
Renewable resources investments are comprised of direct investments in properties involved in the production and harvesting of timber and farmland.
Valuation Techniques
The fair value of private markets investments is determined at least annually, using acceptable industry valuation methods. During the year, the fair value is reviewed and adjusted, as appropriate, to reflect the impact of any significant market or investment-specific events or circumstances. For each investment, the relevant methodology is applied consistently over time as appropriate in the prevailing circumstances.
In cases where the services of third-party appraisers are used, management ensures their independence and that valuation methods used are consistent with professional appraisal standards. Such standards include the International Private Equity and Venture Capital Valuation Guidelines, the Canadian Uniform Standards of Professional Appraisal Practice and the Uniform Standards of Professional Appraisal Practice in the United States of America. In validating the work performed by appraisers, management ensures that the assumptions used correspond to financial information and forecasts of the underlying investment.
For direct investments in real estate, valuation methods used include discounted cash flows, prices of recent comparable transactions and the direct capitalization approach. Assumptions used in such valuations include discount rates, capitalization rates, projected cash flows and/or net operating income, which are not fully supported by prices from market observable transactions.
For direct investments in private equity, direct investments and co-investments in infrastructure and in renewable resources, valuation methods used include discounted cash flows, earnings multiples, prices of recent comparable transactions and publicly traded comparables. Assumptions used in such valuations include discount rates and projected cash flows, which are not fully supported by prices from market observable transactions.
In the case of private equity, real estate and infrastructure fund investments as well as private equity co-investments, the annual fair value is generally determined based on the audited fair values reported by the fund's general partner using acceptable industry valuation methods.
(III) Fixed Income
Fixed income consists of cash and money market securities, government and corporate bonds, inflation-linked bonds and other fixed income securities.
Cash and money market securities include instruments having a maximum term to maturity of one year, such as treasury bills, certificates of deposit and bankers' acceptances.
Government and corporate bonds include Canadian and foreign, federal, provincial, territorial and municipal bonds. Inflation-linked bonds are fixed income securities that earn inflation adjusted returns.
Other fixed income securities consist of asset-backed securities, floating rate notes as well as private debt portfolios.
Asset-backed securities consist mainly of asset-backed term notes (ABTNs) and mortgage-backed securities. The ABTNs were received in exchange for third-party or non-bank sponsored asset-backed commercial paper (ABCP) that suffered a liquidity disruption in mid-August 2007 and were subsequently restructured in January 2009. Potential margin calls on the ABTNs are supported by funding facilities, as described in Note 23.
Private debt portfolios consist mainly of investments in the real estate sector in the form of third-party loans such as junior and senior debts, construction loans, bridge loans, income-participating loans, as well as other structured finance products. They also include real estate debt funds where significant portions of the value are attributed to the underlying real estate assets.
Private debt portfolios also include debt securities of private companies or other entities such as venture capital organizations, held mainly through private funds. Such debt securities take the form of senior debt, mezzanine and distressed debt.
Valuation Techniques
Cash and money market securities include short-term instruments that are recorded at cost plus accrued interest, which approximates fair value.
Fair values of government and corporate bonds, inflation-linked bonds, floating rate notes and mortgage-backed securities are based on prices obtained from third-party pricing sources. Such prices are determined using either an appropriate interest rate curve with a spread associated with the credit quality of the issuer or other generally accepted pricing methodologies.
ABTNs are measured at fair value whereby PSPIB relies on the valuation work performed by a recognized third-party expert. PSPIB ensures that the valuation conducted by such expert uses acceptable industry methods. Financial information used in the valuation of ABTNs includes interest rates, credit spreads and the underlying investments' terms to maturity. In addition to the values determined by the expert, PSPIB integrated certain assumptions in the fair value of ABTNs that are not fully supported by market observable data, such as liquidity estimates and the impact of the funding facilities described in Note 23.
The fair value of private debt portfolios in the real estate sector is obtained from third-party appraisers and is determined using either a yield-based or collateral-based valuation technique. The yield-based valuation technique involves discounting expected future cash flows that incorporate assumptions with respect to interest rates offered for similar loans to borrowers with similar credit ratings. The collateral-based valuation technique involves assessing the recoverable value of the collateral in question, net of disposal fees.
The fair value of fund investments included as part of private debt portfolios is determined based on the audited fair values reported by the fund's general partner using acceptable industry valuation methods.
(IV) Alternative Investments
Alternative investments consist mainly of units of funds that hold a mix of equity, fixed income and derivative instruments as well as hedge funds.
Valuation Techniques
The fair value of these investments is obtained from each of the funds' administrators and reflects the fair value of the underlying equity, fixed income or derivative instruments, as applicable. Where necessary, the impact of restrictions on the sale or redemption of such investments is taken into consideration in determining fair value.
(V) Amounts Receivable and Payable from Pending Trade
Amounts receivable from pending trades consist of proceeds on sales of investments, excluding derivative financial instruments, which have been traded but remain unsettled at the end of the reporting year.
Amounts payable from pending trades consist of the cost of purchases of investments, excluding derivative financial instruments, which have been traded but remain unsettled at the end of the reporting year.
Valuation Techniques
The fair value of amounts receivable and payable from pending trades reflects the value at which their underlying original sale or purchase transactions were undertaken.
(VI) Interest and Dividends Receivable
Interest and dividends are recorded at the amounts expected to be received as at the reporting date, which approximates fair value.
(VII) Interest Payable
Interest is accrued at the amount expected to be paid as at the reporting date, which approximates fair value.
(VIII) Securities Sold Short
Securities sold short reflect PSPIB's obligation to purchase securities pursuant to short selling transactions. In such transactions, PSPIB sells securities it does not own with an obligation to purchase similar securities on the market to cover its position.
Valuation Techniques
Using ask prices as inputs, the fair value of securities sold short is measured using the same method as the similar long positions presented within public markets and fixed income.
(IX) Securities Sold Under Repurchase Agreements
PSPIB is party to agreements which involve the sale of securities with a simultaneous agreement to repurchase such securities at a specified price and specified future date.
Securities sold under the repurchase agreements are not derecognized as PSPIB retains all related risks and rewards of ownership. As such, all related income (loss) continues to be reported in investment income (loss).
Obligations to repurchase the securities sold are accounted for as investment-related liabilities. Interest expense related to such obligations is reported in investment income (loss).
Valuation Techniques
Obligations to repurchase the securities sold under repurchase agreements are recorded at cost plus accrued interest, which approximates fair value.
(X) Derivative-Related Receivables and Payables
The description and valuation of derivative-related receivables and payables are described in Note 6 (B).
(XI) Capital Market Debt Financing
PSPIB's capital market debt program is described in Note 11. Short-term promissory notes are recorded at cost plus accrued interest, which approximates fair value. The fair value of PSPIB's medium-term notes is based on prices that are obtained from third-party pricing sources. Such prices are determined using an interest rate curve with a spread consistent with PSPIB's credit quality.
(B) Derivative Financial Instruments
Derivative financial instruments are financial contracts that are settled at a future date. The value of such instruments is derived from changes in the value of the underlying assets, interest or exchange rates. Derivative financial instruments do not, typically, require an initial net investment. In certain cases, they require an initial net investment that is less than what would be required to hold the underlying position directly. Derivative financial instruments can be listed or traded OTC. OTC instruments consist of those that are bilaterally negotiated and settled, and those that are cleared (OTC-cleared) by a central clearing party (CCP).
PSPIB uses derivative financial instruments to enhance returns or to replicate investments synthetically. Derivatives are also used to reduce the risk associated with existing investments.
PSPIB uses the following types of derivative financial instruments:
- (I) Swaps
- Swaps are transactions whereby two counterparties exchange cash flow streams with each other based on predetermined conditions that include a notional amount and a term. Swaps are used to increase returns or to adjust exposures of certain assets without directly purchasing or selling the underlying assets.
- (II) Futures
- Futures are standardized contracts to take or make delivery of an asset (buy or sell) at a predefined price and predefined future date. Futures are used to adjust exposures to specified assets without directly purchasing or selling the underlying assets.
- (III) Forwards
- Forwards are contracts involving the sale by one party and the purchase by another party of a predefined amount of an underlying instrument, at a predefined price and at a predefined date in the future. Forwards are used to adjust exposures to specified assets without directly purchasing or selling the underlying assets.
- (IV) Options
- Options are the right, but not the obligation, to buy or sell a given amount of an underlying security, index, or commodity at an agreed-upon price stipulated in advance, either at a determined date or at any time before the predefined maturity date.
- (V) Warrants and Rights
-
Warrants are options to purchase an underlying asset, which is in the form of a transferable security and which can be listed on an exchange.
Rights are securities giving shareholders entitlement to purchase new shares issued by a corporation at a predetermined price (normally less than the current market price) in proportion to the number of shares already owned. Rights are issued only for a short period of time, after which they expire.
- (VI) Collateralized Debt Obligations
- Collateralized debt obligations are a type of asset-backed security that is constructed from a portfolio of credit-related assets. Collateralized debt obligations are usually divided into several tranches with different credit risk levels and corresponding interest payments. Any losses are applied first to the more junior tranches (lowest risk rating) before moving up in seniority.
Valuation Techniques
Listed derivative financial instruments are recorded at fair value using quoted market prices with the bid price for long positions and the ask price for short positions. OTC-cleared derivatives are recorded at fair value using prices obtained from the CCP. OTC derivatives are valued using appropriate valuation techniques, such as discounted cash flows using current market yields. The assumptions used include the statistical behavior of the underlying instruments and the ability of the model to correlate with observed market transactions. Although pricing models used are widely accepted and used by other market participants, in the case of collateralized debt obligations, the nature of such instruments requires more significant assumptions about the behavior of the default correlation. Such assumptions are not observable in the market.
Notional values of derivative financial instruments are not recorded as assets or liabilities as they represent the face amount of the contract. Except for credit derivatives, notional values do not represent the potential gain or loss associated with the market or credit risk of such transactions disclosed below. Rather, they serve as the basis upon which the cash flows and the fair value of the contracts are determined.
| 2014 | 2013 | |||||||
|---|---|---|---|---|---|---|---|---|
| Notional Value | Fair Value | Notional Value | Fair Value | |||||
| Assets | Liabilities | Net | Assets | Liabilities | Net | |||
Table 31 Notes
|
||||||||
| Equity and Commodity Derivatives | ||||||||
|
Futures
|
$1,019 | $0 | $0 | $0 | $616 | $0 | $0 | $0 |
|
Total Return Swaps
|
9,858 | 155 | (16) | 139 | 7,240 | 121 | (36) | 85 |
|
Warrants and Rights
|
4 | 4 | 0 | 4 | 2 | 0 | 0 | 0 |
|
Options:
|
||||||||
|
Listed-purchased
|
501 | 14 | 0 | 14 | 1,872 | 20 | 0 | 20 |
|
Listed-written
|
301 | 0 | (13) | (13) | 730 | 0 | (11) | (11) |
|
OTC-purchased
|
3,990 | 224 | 0 | 224 | 916 | 119 | 0 | 119 |
|
OTC-written
|
4,430 | 0 | (256) | (256) | 901 | 0 | (106) | (106) |
| Currency Derivatives | ||||||||
|
Forwards
|
22,549 | 110 | (328) | (218) | 24,986 | 249 | (243) | 6 |
|
Futures
|
51 | 0 | 0 | 0 | 31 | 0 | 0 | 0 |
|
Swaps
|
2,584 | 7 | (91) | (84) | 774 | 17 | (21) | (4) |
|
Options:
|
||||||||
|
OTC-purchased
|
2,924 | 24 | 0 | 24 | 3,789 | 57 | 0 | 57 |
|
OTC-written
|
2,549 | 0 | (12) | (12) | 3,534 | 0 | (49) | (49) |
| Interest Rate Derivatives | ||||||||
|
Bond Forwards
|
510 | 0 | 0 | 0 | 617 | 4 | (5) | (1) |
|
Futures
|
1,768 | 0 | 0 | 0 | 969 | 0 | 0 | 0 |
|
Interest Rate Swaps
|
||||||||
|
OTC
|
8,620 | 29 | (63) | (34) | 8,425 | 17 | (29) | (12) |
|
OTC-Cleared
|
6,087 | 0 | 0 | 0 | 0 | 0 | 0 | 0 |
|
Total Return Swaps
|
0 | 0 | 0 | 0 | 2 | 0 | 0 | 0 |
|
Swaptions
|
22,942 | 60 | (51) | 9 | 2,048 | 6 | (4) | 2 |
|
Options:
|
||||||||
|
Listed-purchased
|
19,255 | 13 | 0 | 13 | 3,683 | 3 | 0 | 3 |
|
Listed-written
|
20,193 | 0 | (6) | (6) | 3,619 | 0 | (2) | (2) |
|
OTC-purchased
|
7,389 | 11 | 0 | 11 | 1,283 | 7 | 0 | 7 |
|
OTC-written
|
10,937 | 0 | (11) | (11) | 2,028 | 0 | (7) | (7) |
| Credit Derivatives table 31 note 1 1 | ||||||||
|
OTC-Purchased
|
1,552 | 1 | (33) | (32) | 1,395 | 12 | (12) | 0 |
|
OTC-Sold
|
399 | 3 | (1) | 2 | 681 | 3 | (10) | (7) |
|
OTC-Cleared-Purchased
|
619 | 0 | 0 | 0 | 0 | 0 | 0 | 0 |
|
OTC-Cleared-Sold
|
934 | 0 | 0 | 0 | 0 | 0 | 0 | 0 |
| Total | $151,965 | $655 | $(881) | $(226) | $70,141 | $635 | $(535) | $100 |
| 2014 | |
|---|---|
| Less than 3 Months | $67,555 |
| 3 to 12 Months | 56,357 |
| Over 1 Year | 28,053 |
| Total | $151,965 |
(C) Fair Value Measurement
Investments, investment-related assets and investment-related liabilities are classified according to the following hierarchy based on the significant inputs used in measuring their fair value.
- Level 1:
- Valuation is based on quoted prices in active markets for identical assets or liabilities.
- Level 2:
- Valuation is based on quoted prices for similar assets or liabilities in active markets or quoted prices for identical or similar assets or liabilities in markets that are not active. Level 2 also includes model-based valuation techniques for which all significant assumptions are observable in the market.
- Level 3:
- Valuation is based on model-based techniques for which significant assumptions are not observable in the market. They reflect PSPIB's assessment of the assumptions that market participants would use in pricing the assets or liabilities.
| 2014 | |||||
|---|---|---|---|---|---|
| Level 1 | Level 2 | Level 3 | No Level table 34 note 1 1 | Total Fair Value | |
Table 34 Notes
|
|||||
| Investments | |||||
| Public Markets | |||||
|
Canadian Equity
|
$6,152 | $479 | $0 | $0 | $6,631 |
|
Foreign Equity
|
17,063 | 3,103 | 0 | 0 | 20,166 |
| Private Markets | |||||
|
Real Estate
|
0 | 0 | 9,292 | 0 | 9,292 |
|
Private Equity
|
0 | 0 | 5,874 | 0 | 5,874 |
|
Infrastructure
|
0 | 0 | 4,752 | 0 | 4,752 |
|
Renewable Resources
|
0 | 0 | 862 | 0 | 862 |
| Fixed Income | |||||
|
Cash and Money Market Securities
|
590 | 2,222 | 0 | 0 | 2,812 |
|
Government and Corporate Bonds
|
0 | 12,421 | 0 | 0 | 12,421 |
|
Inflation-Linked Bonds
|
0 | 3,630 | 0 | 0 | 3,630 |
|
Other Fixed Income Securities
|
0 | 2,228 | 3,010 | 0 | 5,238 |
| Alternative Investments | 0 | 818 | 1,373 | 0 | 2,191 |
| Total Investments | $23,805 | $24,901 | $25,163 | $0 | $73,869 |
| Investment-Related Assets | |||||
|
Amounts Receivable from Pending Trades
|
$0 | $0 | $0 | $534 | $534 |
|
Interest Receivable
|
0 | 0 | 0 | 159 | 159 |
|
Dividends Receivable
|
0 | 0 | 0 | 60 | 60 |
|
Derivative-Related Receivables
|
31 | 624 | 0 | 0 | 655 |
| Total Investment-Related Assets | $31 | $624 | $0 | $753 | $1,408 |
| Investment-Related Liabilities | |||||
|
Amounts Payable from Pending Trades
|
$0 | $0 | $0 | $(689) | $(689) |
|
Interest Payable
|
0 | 0 | 0 | (20) | (20) |
|
Securities Sold Short
|
(520) | 0 | 0 | 0 | (520) |
|
Securities Sold Under Repurchase Agreements
|
0 | (460) | 0 | 0 | (460) |
|
Derivative-Related Payables
|
(19) | (862) | 0 | 0 | (881) |
|
Capital Market Debt Financing
|
0 | (4,540) | 0 | 0 | (4,540) |
| Total Investment-Related Liabilities | $(539) | $(5,862) | $0 | $(709) | $(7,110) |
| Net Investments | $23,297 | $19,663 | $25,163 | $44 | $68,167 |
| 2013 | |||||
|---|---|---|---|---|---|
| Level 1 | Level 2 | Level 3 | No Level table 35 note 1 1 | Total Fair Value | |
Table 35 Notes
|
|||||
| Investments | |||||
| Public Markets | |||||
|
Canadian Equity
|
$6,721 | $0 | $0 | $0 | $6,721 |
|
Foreign Equity
|
12,546 | 2,719 | 0 | 0 | 15,265 |
| Private Markets | |||||
|
Real Estate
|
0 | 0 | 7,939 | 0 | 7,939 |
|
Private Equity
|
0 | 0 | 5,115 | 0 | 5,115 |
|
Infrastructure
|
0 | 0 | 3,248 | 0 | 3,248 |
|
Renewable Resources
|
0 | 0 | 306 | 0 | 306 |
| Fixed Income | |||||
|
Cash and Money Market Securities
|
458 | 2,168 | 0 | 0 | 2,626 |
|
Government and Corporate Bonds
|
0 | 8,169 | 0 | 0 | 8,169 |
|
Inflation-Linked Bonds
|
0 | 3,190 | 0 | 0 | 3,190 |
|
Other Fixed Income Securities
|
0 | 2,476 | 3,249 | 0 | 5,725 |
| Alternative Investments | 0 | 644 | 662 | 0 | 1,306 |
| Total Investments | $19,725 | $19,366 | $20,519 | $0 | $59,610 |
| Investment-Related Assets | |||||
|
Amounts Receivable from Pending Trades
|
$0 | $0 | $0 | $817 | $817 |
|
Interest Receivable
|
0 | 0 | 0 | 111 | 111 |
|
Dividends Receivable
|
0 | 0 | 0 | 49 | 49 |
|
Derivative-Related Receivables
|
23 | 611 | 1 | 0 | 635 |
| Total Investment-Related Assets | $23 | $611 | $1 | $977 | $1,612 |
| Investment-Related Liabilities | |||||
|
Amounts Payable from Pending Trades
|
$0 | $0 | $0 | $(805) | $(805) |
|
Interest Payable
|
0 | 0 | 0 | (18) | (18) |
|
Securities Sold Short
|
(341) | 0 | 0 | 0 | (341) |
|
Securities Sold Under Repurchase Agreements
|
0 | (444) | 0 | 0 | (444) |
|
Derivative-Related Payables
|
(13) | (519) | (3) | 0 | (535) |
|
Capital Market Debt Financing
|
0 | (3,566) | 0 | 0 | (3,566) |
| Total Investment-Related Liabilities | $(354) | $(4,529) | $(3) | $(823) | $(5,709) |
| Net Investments | $19,394 | $15,448 | $20,517 | $154 | $55,513 |
The classification within the levels of the hierarchy is established at the time of the initial valuation of the asset or liability and reviewed on each subsequent reporting year-end.
During the year ended , listed Canadian equity securities with a fair value of $456 million classified as Level 1 were transferred to a non-listed fund held by PSPIB. Consequently, the securities were classified as Level 2 as at (no significant transfers during the year ended ).
Level 3 Reconciliation
The reconciliation of all movements related to investments, investment-related assets and investment-related liabilities categorized within Level 3 is as follows:
| Opening Balance | Purchases | Sales | Settlements | Realized Gains | Unrealized Gains (Losses) table 36 note 1 1 | Transfer Out of Level 3 | Closing Balance | |
|---|---|---|---|---|---|---|---|---|
|
Table 36 Notes
|
||||||||
| Private Markets | $16,608 | $5,013 | $(3,102) | $0 | $547 | $1,906 | $(192) | $20,780 |
| Fixed Income | 3,249 | 527 | (883) | (211) | 223 | 105 | 0 | 3,010 |
| Alternative Investments | 662 | 637 | (19) | 0 | 1 | 92 | 0 | 1,373 |
| Derivative-Related Receivables/Payables (net) | (2) | 5 | (7) | 0 | 1 | 3 | 0 | 0 |
| Total | $20,517 | $6,182 | $(4,011) | $(211) | $772 | $2,106 | $(192) | $25,163 |
As at , two private markets investments were classified under Level 3 as their fair values were determined based on significant unobservable inputs. During the year ended , such investments were transferred to Level 2 as the underlying investees indirectly held by PSPIB became publicly traded. In the case of one of the two private markets investments, the instruments held by PSPIB are subject to restrictions as at and may only be resold upon registration.
| Opening Balance | Purchases | Sales | Settlements | Realized Gains | Unrealized Gains (Losses) table 37 note 1 1 | Transfer Out of Level 3 | Closing Balance | |
|---|---|---|---|---|---|---|---|---|
|
Table 37 Notes
|
||||||||
| Public Markets | $123 | $1 | $(5) | $0 | $1 | $(11) | $(109) | $0 |
| Private Markets | 13,355 | 3,520 | (1,343) | 0 | 154 | 922 | 0 | 16,608 |
| Fixed Income | 2,912 | 987 | (855) | (47) | 146 | 106 | 0 | 3,249 |
| Alternative Investments | 222 | 420 | 0 | 0 | 0 | 20 | 0 | 662 |
| Derivative-Related Receivables/Payables (net) | (7) | 5 | (7) | 0 | 2 | 5 | 0 | (2) |
| Total | $16,605 | $4,933 | $(2,210) | $(47) | $303 | $1,042 | $(109) | $20,517 |
As at , an investment in a non-listed fund that held listed securities was classified under Level 3 due to the nature of the contractual restrictions on the redemption of the fund units. During the year ended , the listed securities held by the fund were classified as Level 1 as at .
Level 3 Sensitivity Analysis
In the course of measuring fair value of financial instruments classified as Level 3, valuation techniques used incorporate assumptions that are based on non-observable data. Significant assumptions used for each asset class are described in Notes 6 (A) and (B). Although such assumptions reflect PSPIB's best judgment, the use of reasonably possible alternative assumptions could yield different fair value measures representing, at a minimum, a 7 percent increase and 5 percent decrease (2013 – 4 percent increase and 4 percent decrease) in the fair value of financial instruments categorized as Level 3. This excludes private debt portfolios and fund investments of $9,542 million allocated to the pension plan (2013– $7,416 million), where a sensitivity analysis is not possible given the underlying assumptions used are not available to PSPIB. In the case of fund investments, the fair value is determined based on the audited financial statements of the fund's general partner as indicated in Note 6 (A). With respect to private debt portfolios, the fair value is obtained from third-party appraisers as described in Note 6 (A).
(D) Securities Lending and Borrowing Programs
PSPIB participates in securities lending and borrowing programs whereby it lends and borrows securities in order to enhance portfolio returns. Lending and borrowing transactions under such programs do not transfer the risks or rewards of ownership of the securities to the counterparty. Consequently, PSPIB does not derecognize securities lent or recognize securities borrowed.
The securities lending and borrowing programs require collateral in cash, high-quality debt instruments or securities. Collateral transactions are conducted under terms that are usual and customary in standard securities lending and borrowing programs. PSPIB and its counterparties are authorized to sell, repledge or otherwise use collateral held. The same securities or equivalent securities must be returned to the counterparty at the end of the contract, unless an event of default occurs. As at , PSPIB, on behalf of the pension plan, has re-invested $1,754 million of collateral held (2013 - $1,615 million).
| 2014 | 2013 | |
|---|---|---|
Table 38 Notes
|
||
| Securities Lending | ||
|
Securities Lent
|
$6,998 | $5,389 |
|
Collateral Held
table 38 note 1 1
|
7,449 | 5,676 |
| Securities Borrowing | ||
|
Securities Borrowed
|
520 | 341 |
|
Collateral Pledged
table 38 note 2 2
|
545 | 343 |
(E) Securities Sold and Collateral Pledged Under Repurchase Agreements
Securities sold under repurchase agreements are described in Note 6 (A) (IX) and involve pledging collateral consisting of cash or securities deemed acceptable by the counterparties. Collateral transactions are conducted under terms that are usual and customary in standard repurchase arrangements. Such terms require the relevant counterparty to pledge additional collateral based on the changes in the fair value of the existing collateral pledged. The counterparties are authorized to sell, repledge or otherwise use collateral held. The securities pledged as collateral must be returned to the relevant counterparty at the end of the contract, unless an event of default occurs. PSPIB does not sell, repledge or otherwise use collateral held.
On behalf of the pension plan, PSPIB pledged collateral under the repurchase agreements with a fair value of $459 million at (2013 – $444 million).
7. Interest in Other Entities
(A) Subsidiaries, Joint Ventures and Associates
As an investment entity, PSPIB does not consolidate its subsidiaries other than those that solely provide it with services that relate to its investment activities. PSPIB measures its investments in its subsidiaries, joint ventures and associates at FVTPL as described in Note 2 (A).
In the normal course of business, investments in private markets are commonly held through investment entity subsidiaries formed by PSPIB. As at , 82 investment entity subsidiaries were incorporated in North America, 13 in Europe and 9 in Oceania, 3 in Central and South America, and 1 in Africa ( – 80 in North America, 10 in Europe, 5 in Oceania, and 3 in Central and South America).
In addition, PSPIB controlled 58 investees directly or through its investment entity subsidiaries as at (51 investees – ).
The following tables present, in descending order, the most significant investees held directly or indirectly by PSPIB where it has control, joint control or significant influence:
| Entity's Name | Principal Place of Business | Ownership Interest Held by PSPIB | Relationship to PSPIB |
|---|---|---|---|
| Revera Inc. | North America | 100% | Controlled investee |
| AviAlliance GmbH | Europe | 100% | Controlled investee |
| Charter Hall Office Trust | Oceania | 43% | Jointly controlled investee |
| Forth Ports Limited | Europe | 37% | Jointly controlled investee |
| Telesat Holdings Inc. | North America | 34% | Associate |
| Kaingaroa Timberlands Ltd | Oceania | 30% | Jointly controlled investee |
| Kinetic Concepts, Inc. | North America | 21% | Associate |
| Isolux Infrastructure Netherlands B.V. | Central and South America | 19% | Jointly controlled investee |
| Transelect S.A. | Central and South America | 18% | Associate |
| Gassled | Europe | 5% | Associate |
| Entity's Name | Principal Place of Business | Ownership Interest Held by PSPIB | Relationship to PSPIB |
|---|---|---|---|
| Revera Inc. | North America | 100% | Controlled investee |
| SCG Hotel CLP, LP. | North America | 100% | Controlled investee |
| H2O Power Limited Partnership | North America | 92% | Controlled investee |
| TD Canada Trust Tower | North America | 50% | Jointly controlled investee |
| Charter Hall Office Trust | Oceania | 43% | Jointly controlled investee |
| Telesat Holdings Inc. | North America | 35% | Associate |
| DP World Australia Ltd. | Oceania | 25% | Jointly controlled investee |
| Kinetic Concepts, Inc. | North America | 21% | Associate |
| Transelect S.A. | Central and South America | 18% | Associate |
| Gassled | Europe | 5% | Associate |
In addition to the above, PSPIB controls and consolidates two wholly owned subsidiaries that solely provide it with services that relate to its investment activities. Such services are mainly related to raising capital used to finance private market investments within the context of PSPIB's capital market debt program described in Note 11.
(B) Structured Entities
PSPIB holds interests in partnerships and funds mainly in the context of its investments in private markets. Given their nature, such entities commonly have the characteristics of a structured entity as defined by IFRS. These entities are held as investments and do not expose PSPIB to additional risks or returns compared to interests held in non-structured entities.
Information regarding structured entities is included, as applicable, within disclosures of investment risk management under Note 8, guarantees and indemnities under Note 23 and commitments under Note 24.
8. Investment Risk Management
Risk management is a central part of PSPIB's operations. Included in the overall risk management framework is a continuous process whereby PSPIB systematically addresses the investment risks related to its various investment activities with the goal of achieving a maximum rate of return without undue risk of loss.
A risk governance framework that includes required reporting on risk to all levels of the organization ensures that appropriate investment objectives are pursued and achieved in line with the fulfillment of PSPIB's legislated mandate. The Board of Directors and its committees oversee all risk matters and receive assurances from senior management, including the Chief Risk Officer, as well as PSPIB's independent internal auditor reporting directly to the Audit Committee.
PSPIB has adopted an Investment Risk Management Policy which is an integral part of its risk control system and supplements the Statement of Investment Policies, Standards and Procedures (SIP&P). The objective of this policy is to provide a framework to manage the risks that PSPIB is exposed to, namely market, credit and liquidity risks.
(A) Market Risk
Market risk is the risk that the value of an investment will fluctuate as a result of changes in market prices, whether those changes are caused by factors specific to the individual investment, volatility in share and commodity prices, interest rate, foreign exchange or other factors affecting similar securities traded in the market.
Market risk management focuses on the following two key components:
- Policy Portfolio
- The Policy Portfolio (long-term asset mix), as defined in the SIP&P, determines a diversification strategy to mitigate risk whereby PSPIB invests in a diversified portfolio expected to achieve a return at least equal to the Actuarial Rate of Return (ARR) defined as the rate of return assumption used by the Chief Actuary of Canada in the latest actuarial valuation report of the pension plan. In the absence of other factors affecting the funding of the pension plan or changes to pension benefits under the pension plan, the ARR is the rate of return required to maintain funding requirements and pension benefits at their current levels.
- Active Management
- Active management is defined as the sum of investment strategies that deviate from the approved Policy Portfolio. It is designed to supplement the returns of the Policy Portfolio within an active risk budget.
The risks associated with these components are the Policy Portfolio market risk and the active risk. The Policy Portfolio market risk represents the investment risk arising from the exposure to approved asset classes in the approved weightings. In establishing its Policy Portfolio, PSPIB also takes into consideration the impact of the Policy Portfolio market risk on funding risk. Funding risk is the risk that the assets under management will be insufficient to meet the relevant pension liabilities of the pension plan, which may require the contributions to the plan to be increased. The Policy Portfolio is reviewed by PSPIB at least annually as part of the review of the SIP&P, and this review includes changes, if any, to PSPIB's long-term expectations of market conditions and other factors that may affect the funding level of the pension plan.
Active risk refers to all market risk arising from active management activities. It is managed in accordance with the Investment Risk Management Policy.
Measurement of Market Risk
The Value-at-Risk (VaR) is one of the methods used to measure market risk and is reported on a quarterly basis. It is not the maximum potential loss, but rather the maximum loss not exceeded with a given confidence level, over a given period of time. PSPIB uses a Historical VaR model incorporating ten years' worth of market returns scaled to a twelve-month holding period at a 95 percent confidence level. For investments that are not actively traded, the calculation of VaR uses securities with similar risk attributes as a proxy.
In measuring Policy Portfolio risk, VaR represents the absolute loss expected from the Policy Portfolio (Policy Portfolio VaR). Whereas in terms of measuring the active risk, VaR reflects the loss relative to the Policy Portfolio benchmark (Active VaR).
VaR is statistically valid under normal market conditions and does not specifically consider losses from severe market events. It also assumes that the future will behave in a pattern similar to the past. Consequently, if future market conditions differ significantly from those of the past, potential losses may differ from those originally estimated.
The following table shows the Total VaR consisting of the Policy Portfolio VaR, the Active VaR and the diversification effect, calculated as a percentage of net investments, as at March 31. The diversification effect captures the impact of holding different types of assets that may react differently in various types of situations and thus reduces the total VaR.
| 2014 | 2013 | |
|---|---|---|
| Policy Portfolio VaR | 20.3% | 20.2% |
| Active VaR | 2.8 | 2.6 |
| Total VaR (Undiversified) | 23.1 | 22.8 |
| Diversification Effect | (0.1) | (1.3) |
| Total VaR | 23.0% | 21.5% |
Stress Testing
Although VaR is a widely accepted risk measure, it is complemented by other risk measurement methodologies that provide greater insight on market risk. PSPIB uses stress testing and scenario analysis to examine the impact on financial results of abnormally large movements in risk factors. Stress testing and scenario analysis are used to test a portfolio's sensitivity to various risk factors and key model assumptions. These methods also use historically stressed periods to evaluate how a current portfolio reacts under such circumstances. Stress testing and scenario analysis are also deployed to assess new product performance.
(I) Interest Rate Risk
Interest rate risk refers to the risk that fluctuations in interest rates will directly affect the fair value of the pension plan's net asset values.
| Less than 1 Year | 1 to 5 Years | 5 to 10 Years | Over 10 Years | Other | Total | |
|---|---|---|---|---|---|---|
Table 39 Notes
|
||||||
| Government Bonds | $1,295 | $3,885 | $1,319 | $1,937 | $0 | $8,436 |
| Corporate Bonds | 486 | 2,205 | 1,021 | 273 | 0 | 3,985 |
| Inflation-Linked Bonds | 2 | 887 | 1,017 | 1,724 | 0 | 3,630 |
| Asset-Backed Securities | 8 | 1,173 | 18 | 0 | 0 | 1,199 |
| Private Debt Portfolios | ||||||
|
Directly Held
|
127 | 352 | 0 | 0 | 0 | 479 |
|
Held Through Funds
table 39 note 1 1
|
0 | 0 | 0 | 0 | 1,429 | 1,429 |
| Total Investments With Significant Exposure to Interest Rate Risk | $1,918 | $8,502 | $3,375 | $3,934 | $1,429 | $19,158 |
| Other Investments table 39 note 2 2 | $0 | $0 | $0 | $0 | $4,943 | $4,943 |
| Total Fixed Income | $1,918 | $8,502 | $3,375 | $3,934 | $6,372 | $24,101 |
The terms to maturity of PSPIB's capital market debt financing are disclosed in Note 11.
Alternative investments as well as derivative contracts described in Notes 6 (A) (IV) and Note 6 (B), respectively, are also subject to interest rate risk exposures. These exposures are reflected in the VaR calculation described in Note 8 (A).
(II) Foreign Currency Risk
PSPIB and its subsidiaries are exposed to currency risk through holdings of securities, units in pooled funds and units in limited partnerships of non-Canadian assets. Fluctuations in the relative value of the Canadian dollar against these foreign currencies can result in a positive or a negative effect on the fair value of the investments. To mitigate this risk, PSPIB may take, through foreign forward contracts or cross currency swaps, positions in foreign currencies. In October 2013, PSPIB amended its policy to fully hedge foreign currency investments in government and corporate bonds, inflation-linked bonds, certain other fixed income securities, as well as investments in real estate, infrastructure and renewable resources. PSPIB's previous policy was to hedge a target of 50 percent of its foreign currency investments in non-emerging countries. Additional factors are considered when implementing the hedging target for investments in emerging countries, namely, total relative exposure and cost effectiveness.
| Currency | 2014 Fair Value |
2014 % of Total |
2013 Fair Value |
2013 % of Total |
|---|---|---|---|---|
| US Dollar (USD) | $17,882 | 61.0% | $11,141 | 53.3% |
| Euro (EUR) | 2,520 | 8.6 | 1,875 | 9.0 |
| British Pound (GBP) | 1,350 | 4.6 | 1,550 | 7.4 |
| Japanese Yen (JPY) | 1,143 | 3.9 | 833 | 4.0 |
| Hong Kong Dollar (HKD) | 953 | 3.3 | 754 | 3.6 |
| Korean Won (KRW) | 952 | 3.2 | 565 | 2.7 |
| Brazilian Real (BRL) | 918 | 3.1 | 878 | 4.2 |
| Swiss Franc (CHF) | 579 | 2.0 | 278 | 1.3 |
| Taiwanese New Dollar (TWD) | 445 | 1.5 | 341 | 1.6 |
| Australian Dollar (AUD) | 369 | 1.3 | 687 | 3.3 |
| Indian Rupee (INR) | 342 | 1.2 | 257 | 1.2 |
| South African Rand (ZAR) | 285 | 1.0 | 221 | 1.1 |
| Swedish Krona (SEK) | 192 | 0.6 | 53 | 0.3 |
| Columbian Peso (COP) | 178 | 0.6 | 127 | 0.6 |
| Mexican Peso (MXN) | 153 | 0.5 | 177 | 0.9 |
| Others | 1,049 | 3.6 | 1,149 | 5.5 |
| Total Net Foreign Currency | $29,310 | 100.0% | $20,886 | 100.0% |
As at , PSPIB and its subsidiaries also had commitments, denominated in foreign currencies of $8,730 million (7,319 million USD, 188 million EUR, 21 million GBP, 16 million ZAR, 206 million BRL, 44,475 million COP, and 10,835 million INR) which were not included in the foreign currency exposure above.
(B) Credit Risk
PSPIB is exposed to credit risk, that is, the risk that the issuer of a debt security or that the counterparty to a derivative contract, to a securities lending and borrowing transaction or to securities sold under repurchase agreements, is unable to meet its financial obligations.
Credit risk encompasses the risk of a deterioration of creditworthiness and the relevant concentration risk. Credit risk monitoring entails an evaluation of the credit quality of each issuer and counterparty that transacts with PSPIB. To perform this evaluation, PSPIB relies on four recognized credit rating agencies. A minimum of two credit ratings are used to classify each security. Except for ABTNs, securities rated by only one agency are classified as "not rated." If the agencies disagree as to a security's credit quality, PSPIB uses the lowest of the available ratings.
As at , the investment portfolio's maximum exposure to credit risk amounted to approximately $22 billion (2013 - approximately $17 billion). This amount excludes investments in distressed debt in the amount of approximately $1.2 billion as at (2013 - approximately $1 billion). The maximum exposure to credit risk also excludes collateralized debt obligations, collateral held as disclosed in Notes 6 (D), 6 (E) and in this note and the impact of guarantees and indemnities disclosed in Note 23.
As at , the investment portfolio had a net notional exposure of $40 million (2013 - $87 million) to various tranches of collateralized debt obligations, of which approximately 53 percent (2013 - approximately 67 percent) of the underlying dollar exposure was rated "Investment Grade", as well as funding facilities, as described in Note 23, to support potential margin calls on the ABTNs.
To monitor the evolution of credit risk, PSPIB periodically produces a concentration report by credit rating of all credit-sensitive financial securities with the exception of securities held in pooled funds or for private market investments.
| Credit Rating | 2014 | 2013 |
|---|---|---|
| Investment grade (AAA to BBB-) | 97.4% | 97.9% |
| Below investment grade (BB+ and below) | 1.0 | 1.0 |
| Not rated: | ||
| Rated by a single credit rating agency | 0.5 | 0.1 |
| Not rated by credit rating agencies | 1.1 | 1.0 |
| Total | 100.0% | 100.0% |
(I) Counterparty Risk
Counterparty risk represents the credit risk from current and potential exposure related to transactions involving derivative contracts, securities lending and borrowing as well as securities sold under repurchase agreements. In order to minimize counterparty risk, PSPIB requires that counterparties provide adequate collateral and meet its credit rating requirements. PSPIB frequently monitors the credit rating of its counterparties as determined by recognized credit rating agencies. With respect to derivative contracts, PSPIB has the ability to terminate all trades with most counterparties whose credit rating is downgraded below its requirements.
For OTC derivatives, PSPIB's policy also requires the use of the International Swaps and Derivative Association (ISDA) Master Agreement with all counterparties to derivative contracts. The ISDA Master Agreement provides the contractual framework within which dealing activities across a full range of OTC products are conducted. In the case of OTC-cleared derivatives, the CCP regulates trading activities between parties under terms that are customary to such transactions.
As a credit mitigation technique, the ISDA Master Agreement contractually binds counterparties to close-out netting provisions in the case of default by one of the counterparties. Additionally, the Credit Support Annex (CSA) to the ISDA Master Agreement enables PSPIB to realize any collateral placed with it in the case of default of the counterparty. The CSA also requires PSPIB to contribute further collateral when requested. All collateral transactions under the CSA are in high-quality debt instruments or securities. The CSA also regulates the exchange of collateral when the credit exposure to a counterparty exceeds a predetermined threshold. In certain cases, counterparties are authorized to sell, repledge or otherwise use collateral held. Similarly, in the case of OTC-cleared derivatives, the CCP requires collateral in cash, high quality debt instruments or securities and is authorized to sell, repledge or otherwise use collateral held. On behalf of the pension plan, PSPIB pledged securities with a fair value of $421 million as collateral with respect to derivative contracts at (2013 – $53 million), 20 million which are with respect to OCT-cleared derivatives (2013 – nil). Securities with a fair value of $25 million were received from counterparties as collateral at (2013 – $106 million). PSPIB does not sell, repledge or otherwise use any collateral held with respect to derivative contracts.
With respect to transactions involving securities lending and borrowing as well as securities sold under repurchase agreements, collateral requirements are in place to mitigate counterparty risk. Note 6 (D) and Note 6 (E) describe collateral requirements in securities lending and borrowing programs as well as securities sold under repurchase agreements, respectively.
In the case of the securities lending program, PSPIB's exposure to counterparty risk is further mitigated as the custodian of the securities lent assumes the risk that counterparty will be unable to meet its obligations associated with the collateral requirements.
PSPIB is responsible for counterparty risk monitoring and mitigation as well as maintaining a comprehensive, disciplined, and enterprise-wide process for tracking and managing counterparty risk. As such, PSPIB measures counterparty risk on an ongoing basis, evaluates and tracks the creditworthiness of current counterparties and mitigates counterparty risk through collateral management.
(C) Liquidity Risk
Liquidity risk corresponds to PSPIB's ability to meet its financial obligations when they come due with sufficient and readily available cash resources. PSPIB's cash position is monitored on a daily basis. In general, investments in cash, cash equivalents, floating rate notes, bonds and public equities are expected to be highly liquid as they will be invested in securities that are actively traded. PSPIB utilizes appropriate measures and controls to monitor liquidity risk in order to ensure that there is sufficient liquidity to meet financial obligations as they come due. A liquidity report taking into consideration future forecasted cash flows is prepared and presented to senior management on a weekly basis. This ensures that sufficient cash reserves are available to meet forecasted cash outflows. Additionally, sufficient sources of liquidity are maintained for deployment in case of market disruption.
PSPIB has the ability to raise additional capital through the use of PSPIB's capital market debt program. This program allows PSPIB to issue short-term promissory notes and medium-term notes. Note 11 provides additional information on the usage of the capital market debt program.
The terms to maturity of the notional amount of derivatives are disclosed in Note 6 (B).
Financial Liabilities
| Less than 3 Months | 3 to 12 Months | Over 1 Year | Total | |
|---|---|---|---|---|
|
Table 42 Notes
|
||||
| Non Derivative-Related Financial Liabilities table 42 note 1 1 | ||||
|
Amounts Payable from Pending Trades
|
$(689) | $0 | $0 | $(689) |
|
Interest Payable
|
(18) | (2) | 0 | (20) |
|
Securities Sold Short
|
(520) | 0 | 0 | (520) |
|
Securities Sold Under Repurchase Agreements
|
(460) | 0 | 0 | (460) |
|
Capital Market Debt Financing
|
(2,399) | (576) | (1,565) | (4,540) |
|
Accounts Payable and Other Liabilities
|
(74) | 0 | (36) | (110) |
| Total | $(4,160) | $(578) | $(1,601) | $(6,339) |
| Derivative-related financial instruments | ||||
|
Derivative-related receivables
|
$301 | $230 | $124 | $655 |
|
Derivative-related payables
table 42 note 1 1
|
(339) | (318) | (224) | (881) |
| Total | $(38) | $(88) | $(100) | $(226) |
(D) Offsetting
PSPIB is subject to ISDA Master Agreements in relation to its OTC derivative financial instruments as described in Note 8 (B) (I). Such agreements contain close-out netting provisions applicable only in the case of default. In certain cases, such agreements also allow for offsetting. In cases where the conditions for offsetting were met, financial instruments have been presented net in the Statement of Financial Position. Securities sold under repurchase agreements, as described in Note 6 (E) are subject to similar arrangements although they are not offset.
The following tables are completed for all recognized financial instruments that are set off in accordance with paragraph 42 of IAS 32.
| A | B | C | Related Amounts not Set Off in the Statement of Financial Position | |||
|---|---|---|---|---|---|---|
| Financial Assets | Gross Amounts of Recognised Financial Assets | Gross Amounts of Recognised Financial Liabilities Set Off | Net Amounts of Financial Assets Presented in the Statement of Financial Position C= (A-B) |
Recognized Financial Liabilities | Collateral Held Not Recognized | Net |
| As at OTC-derivatives |
$626 | $2 | $624 | $558 | $23 | $43 |
| Total | $626 | $2 | $624 | $558 | $23 | $43 |
| As at OTC-derivatives |
$614 | $2 | $612 | $467 | $99 | $46 |
| Total | $614 | $2 | $612 | $467 | $99 | $46 |
| A | B | C | Related Amounts Not Set Off in the Statement of Financial Position | |||
|---|---|---|---|---|---|---|
| Financial Liabilities | Gross Amounts of Recognised Financial Liabilities | Gross Amounts of Recognised Financial Assets Set Off | Net Amounts of Financial Liabilities Presented in the Statement of Financial Position C= (A-B) |
Recognized Financial Assets | Collateral Pledged Not Derecognized | Net |
| As at OTC-derivatives |
$864 | $2 | $862 | $558 | $264 | $40 |
| Repurchased agreements | 460 | 0 | 460 | 0 | 459 | 1 |
| Total | $1,324 | $2 | $1,322 | $558 | $723 | $41 |
| As at OTC-derivatives |
$524 | $2 | $522 | $467 | $46 | $9 |
| Repurchased agreements | 444 | 0 | 444 | 0 | 444 | 0 |
| Total | $968 | $2 | $966 | $467 | $490 | $9 |
9. Contributions Receivable
| 2014 | 2013 | |
|---|---|---|
| Plan Member Contributions for Past Service Elections | $421 | $398 |
| Employers' Share of Contributions for Past Service Elections | 438 | 436 |
| Other Contributions Receivable | 51 | 62 |
| Total Contributions Receivable | $910 | $896 |
10. Other Assets
The costs of operation of PSPIB are charged to the four plans for which PSPIB provides investment services, namely, the public service pension plan, the Canadian Forces pension plan, the Reserve Force pension plan and the Royal Canadian Mounted Police pension plan. The direct costs of investment activities such as external investment management fees and custodial fees are allocated to each plan, and their operating expenses are allocated on a quarterly basis based upon the asset value of each plan's investments under management.
In 2014, 72.9 percent of the PSPIB operating expenses were allocated to the public service pension plan (2013 – 73 percent). PSPIB initially charges all expenses to the public service pension plan; they are reimbursed quarterly by the three other plans.
| 2014 | 2013 | |
|---|---|---|
| Share of Expenses Receivable From | ||
|
Canadian Forces Pension Plan
|
$14 | $7 |
|
Royal Canadian Mounted Police Pension Plan
|
5 | 3 |
|
Reserve Force Pension Plan
|
0 | 0 |
| Subtotal | $19 | $10 |
| Other | 92 | 60 |
| Total Other Assets | $111 | $70 |
11. Capital Market Debt Financing
PSPIB's capital market debt program consists of the private placement of short-term promissory notes as well as medium-term notes issued by PSP Capital Inc., a wholly-owned subsidiary of PSPIB. The capital raised is primarily used to finance private market investments. It is unconditionally and irrevocably guaranteed by PSPIB in accordance with its corporate leverage policy.
The maximum amount authorized by the Board of Directors for the capital market debt program is 10 percent of the net investments plus all recourse debt outstanding of PSPIB at the time of commitment to issuance. Under this limit, the short-term promissory note component cannot exceed $3 billion for issuances in Canada and US$3 billion for issuances in the United States.
PSPIB's capital market debt financing was in compliance with the limits authorized by the Board of Directors during the year ended .
| 2014 Capital Amounts to be Paid at Maturity |
2014 Fair Value |
2013 Capital Amounts to be Paid at Maturity |
2013 Fair Value |
|
|---|---|---|---|---|
| Short-term Canadian dollar promissory notes, bearing interest between 0.99 percent and 1.19 percent and maturing within 7 and 364 days of issuance ( – 31 and 191 days) | $1,044 | $1,043 | $629 | $627 |
| Short-term US dollar promissory notes, bearing interest between 0.11 percent and 0.30 percent and maturing within 35 and 365 days of issuance ( – 29 and 189 days) | 1,678 | 1,677 | 740 | 740 |
| Medium-term notes Series 1, bearing interest of 4.57 percent per annum and matured on | 0 | 0 | 729 | 746 |
| Medium-term notes Series 2, bearing interest of 2.94 percent per annum and maturing on | 509 | 523 | 510 | 529 |
| Medium-term notes Series 3, bearing variable interest of 3-month CDOR + 39 basis points and maturing on | 254 | 255 | 255 | 256 |
| Medium-term notes Series 4, bearing interest of 2.26 percent per annum and maturing on | 655 | 668 | 656 | 668 |
| Medium-term notes Series 5, bearing interest of 3.03 percent per annum and maturing on | 364 | 374 | 0 | 0 |
| Total | $4,504 | $4,540 | $3,519 | $3,566 |
| 2014 | 2013 | |
|---|---|---|
| Short-Term Promissory Notes | $10,377 | $7,761 |
| Medium-Term Notes | 61,848 | 66,139 |
| Total | $72,225 | $73,900 |
12. Related Party Transactions
As outlined in Note 2 (A), investments in unconsolidated subsidiaries, jointly controlled investees and associates are measured at FVTPL. Transactions between PSPIB and such entities or subsidiaries of such entities are related party transactions. PSPIB enters into investment transactions with such related parties in the normal course of its business, more specifically, as part of private markets and certain fixed income investments described under Note 6 (A) as well as guarantees, indemnities and commitments described under Notes 23 and 24, respectively. Since balances in connection with all investment transactions are measured at FVTPL, those transactions undertaken with related parties have the same impact on net assets and profit (loss) and other comprehensive income (loss) as those with unrelated parties.
Transactions between PSPIB and its consolidated subsidiaries as well as related balances are eliminated upon consolidation and, therefore, are not disclosed in this note.
13. Capital Management
PSPIB manages the pension plan's investments. PSPIB's investment objectives are:
- To invest fund transfers in the best interests of the beneficiaries and contributors under the PSSA. The funds received are invested with a view of achieving a maximum rate of return, without undue risk of loss, having regard to the funding, policies and requirements of the pension plan established under the PSSA and the ability of the pension plan to meet its financial obligations. The funds are also invested in accordance with PSPIB's Investment Risk Management policies outlined in Note 8.
- To maintain an appropriate credit rating to achieve access to the capital markets at the lowest cost of capital. Note 11 provides information on the capital market debt financing and Note 8 (C) provides information on PSPIB liquidity.
The public service pension plan capital consists of the actuarial funding surplus or deficit related to service since April 1, 2000 determined regularly by the funding actuarial valuation prepared by the OCA. The purpose of this valuation is to determine the financial position of the pension plan by testing its ability to meet obligations to current plan members and their survivors. Using various assumptions, the OCA projects the future pension benefits to estimate the current value of the pension obligations on a funding basis, which is compared with the sum of: the investment assets held by PSPIB, including their projected earnings; and the discounted value of future plan member and Government contributions, including future earnings on contributions. The result of this comparison is either an actuarial surplus or an actuarial deficit.
It is Government policy that the obligations that pertain to service before are unfunded and are paid as they become due. For the obligations for service since , the objective of managing the capital position of the pension plan is to ensure that the investments held by PSPIB is sufficient to meet the related future pension obligations.
14. Pension Obligations
(A) Present Value of Pension Obligations
An actuarial valuation for accounting purposes is performed as at March 31 of each fiscal year by the OCA to measure and report the pension obligations, and to attribute the costs of the benefits to the period using the projected benefit method prorated on service. The actuarial valuation is based on the most recent triennial actuarial valuation for funding purposes, as applicable, in regards to demographic assumptions other than the percentage increase in population growth. The other assumptions underlying the valuation are based on management's best estimates of expected long-term experience and short-term forecasts. The assumptions include estimates of future inflation, interest rates, return on investments, general wage increases, workforce composition, retirement rates and mortality rates.
The discount rates used to measure the present value of the pension obligations, as well as, the costs of benefits earned and the interest expense, for the pension plan are as follows:
- for funded pension benefits, the streamed expected rates of return on invested funds; and
- for unfunded pension benefits , the streamed weighted average of Government of Canada long-term bond rates.
The streamed weighted average of Government of Canada long-term bond rates is a calculated 20-year weighted moving average of Government of Canada long-term bond rates projected over time. The streamed rates take into account historical Government of Canada long-term bond rates and, over time, reflect expected Government of Canada long-term bond rates.
| 2014 | 2013 | |||
|---|---|---|---|---|
| Accrued Benefit Obligations | Benefit and Interest Expenses | Accrued Benefit Obligations | Benefit and Interest Expenses | |
Table 53 Notes
|
||||
| Discount rates: table 53 note 1 1 | ||||
|
Funded Pension Benefits
|
5.9% | 4.7% | 5.9% | 5.6% |
|
Unfunded Pension Benefits
|
4.6% | 5.4% | 4.6% | 5.7% |
| Expected Rate of Return on Investments | 4.7 % | 5.6% | ||
| Long-Term Rate of Inflation | 2.0% | 2.0% | 2.0% | 2.0% |
| Long-Term General Wage Increase | 2.6% | 2.6% | 2.6% | 2.7% |
For the year ended , the pension plan recorded net gains related to changes in actuarial assumptions and actuarial experience totalling $1.7 billion compared to net losses of $1.4 billion in 2012-13.
(B) Pension Plan Amendments
The Jobs and Growth Act, 2012, which received Royal Assent on , amended the PSSA by increasing the pensionable age by five years for contributors entering the plan on or after , and by increasing the maximum share of the current service cost contribution to 50% for all members of the pension plan. Delaying the retirement benefit entitlement age by five years for new entrants will reduce the cost of benefits to the plan in future years. The amendments to the plan provisions have no financial impact on the accrued benefits earned prior to the implementation date.
No amendments were made to the pension plan during the 2013-14 fiscal year.
15. DEFICIT – To be Financed by the Government of Canada
The financial statement deficit does not impact the benefit payments to plan members as the Government has a statutory obligation for the payment of the pension benefits it sponsors. Pursuant to pension legislation, the transactions for funded and unfunded pension benefits are tracked in the pension accounts within the accounts of Canada.
- a) Funded pension benefits
- The pension plan is financed from employee and employer contributions, as well as investment earnings. Funded pension benefits relate to post-March 2000 service that falls within the Income Tax Act limits, as an amount equal to contributions less benefit payments and other charges is invested in capital markets through the PSPIB. Funded pension benefits also include pre-2000 service purchased since .
- b) Unfunded pension benefits
- Unfunded pension benefits related to pre-April 2000 service and post-March 2000 service that falls above the Income Tax Act limits are tracked in the pension plan superannuation account as no separate market invested funds are maintained for this account ( Note 21 and Note 22). Employee and employer contributions for unfunded pension benefits are part of the CRF. Contributions amounted to $148 million ($176 million in 2013).
- c) Impact of removing the superannuation account from the pension plan financial statements
- The superannuation account was removed to provide more reliable and relevant information for the users of the financial statements. The resulting financial statements deficit as at is reported at $88 billion compared to a deficit of $97 billion as at and $98 billion as at after restatement. The financial statements deficit does not impact the funding valuation of the pension plan as the superannuation account continues to be taken into consideration in the calculation of the funding position. See Note 3 for further details regarding the removal of the superannuation account.
16. Contributions
| 2014 | 2013 | |
|---|---|---|
| From Plan Members | ||
|
Current Service Required Contributions
|
$1,773 | $1,637 |
|
Past Service Contributions
|
23 | 23 |
| Total Plan Member Contributions | $1,796 | $1,660 |
| From the Employer | ||
|
Current Service Required Contributions
|
$2,752 | $2,718 |
|
Past Service Contributions
|
1 | (139) |
| Total Employer Contributions | $2,753 | $2,579 |
| Total Plan Member and Employer Contributions | $4,549 | $4,239 |
17. Investment Income
| 2014 | 2013 | |
|---|---|---|
Table 55 Notes
|
||
| Interest Income | $788 | $585 |
| Dividend Income | 1,002 | 858 |
| Interest Expense (Note 9) | (72) | (74) |
| Transaction Costs | (69) | (36) |
| External Investment Management Fees table 55 note 1 1 | (22) | (27) |
| Other (Net) | (24) | (13) |
| Subtotal | $1,603 | $1,293 |
| Net Realized Gains table 55 note 2 2 | 1,767 | 1,634 |
| Net Unrealized Gains (Losses) table 55 note 3 3 | 5,937 | 2,304 |
| Investment Income | $9,307 | $5,231 |
18. Actuarial Adjustments
Starting with the plan year ended , and based on the triennial actuarial valuation of the pension plan tabled in Parliament on , an annual adjustment of $435 million will be made to the Pension Fund for a period of 13 years ending in 2025. The PSSA requires that any actuarial deficit be dealt with by transferring equal instalments to the Pension Fund over a period of up to 15 years, commencing in the year in which the actuarial report is tabled in Parliament.
19. Benefit Payments and Refunds and Transfers
(A) Benefit Payments
| 2014 | 2013 | |
|---|---|---|
Table 56 Notes
|
||
| Retirement Benefit Payments | $1,018 | $781 |
| Disability Benefit Pension Payments | 126 | 129 |
| Death Benefit Payments table 56 note 1 1 | 11 | 9 |
| Total Benefit Payments | $1,155 | $919 |
(B) Refunds and Transfers
| 2014 | 2013 | |
|---|---|---|
| Pension Division Payments | $28 | $20 |
| Returns of Contributions and Transfer Value Payments | 315 | 242 |
| Transfers to Other Pension Funds | 49 | 39 |
| Total Refunds and Transfers | $392 | $301 |
20. Administrative Expenses
The legislation provides for administrative expenses to be charged to the pension plan. The Treasury Board approves the administrative expenses chargeable to the plan.
PWGSC, as the day-to-day administrator, recovers from the pension plan administrative expenses for the activities directly attributable to its administration. These costs include salaries and benefits, systems maintenance and development, accommodation, and other operating costs of administering the pension plan within the department.
The Secretariat, as the program manager of the pension plan, provides policy interpretation support, information to plan members, financing and funding services and support to the Pension Advisory Committee, and charges its administrative costs to the pension plan.
Health Canada gets reimbursed for the costs related to medical examinations to elect for the purchase of prior service and certify retirement on medical grounds under the pension plan. These costs are included in TBS' Operations and Maintenance costs charged to the pension plan.
The OCA provides actuarial valuation services. The costs related to these services are charged to the pension plan.
PSPIB charges plan-related operating expenses, salaries and benefits and other operating fees to the pension plan.
| 2014 | 2013 | |
|---|---|---|
Table 58 Notes
|
||
| PWGSC | ||
|
Salaries and Benefits
table 58 note 1 1
|
$54 | $56 |
|
Operation and Maintenance
table 58 note 1 1
|
6 | 9 |
|
Professional and Consulting Fees
table 58 note 1 1
|
22 | 34 |
|
Other
|
6 | 6 |
|
Total
|
$88 | $105 |
| The Secretariat | ||
|
Salaries and Benefits
|
$3 | $3 |
|
Operation and Maintenance
|
1 | 1 |
|
Professional and Consulting Fees
|
0 | 0 |
|
Total
|
$4 | $4 |
| OCA – Actuarial Fees | $1 | $1 |
| Subtotal – Government Departments (included in the Service Cost) | $93 | $110 |
| PSPIB | ||
|
Salaries and Benefits
|
$100 | $89 |
|
Operation and Maintenance
|
31 | 28 |
|
Professional and Consulting Fees
|
18 | 9 |
|
Other
|
8 | 8 |
|
Total
|
$157 | $134 |
| Total Administrative Expenses table 58 note 2 2 | $250 | $244 |
21. Superannuation Account
A separate public service superannuation account (superannuation account) has been established in the accounts of Canada under the PSSA. In order for the Government to track transactions, the superannuation account records transactions made through the CRF related to contributions, benefit payments, interest and transfers that pertain to service before . The superannuation account portrays a notional portfolio of bonds, and as such, does not hold any investment assets. The amount of interest credited on the account is as though net cash flows were invested quarterly in 20-year Government of Canada bonds issued at prescribed rates and held to maturity.
| 2014 | 2013 | |
|---|---|---|
Table 59 Notes
|
||
| Balance of Account | ||
|
Superannuation Account
|
$96,424 | $96,648 |
|
Plan Member Contribution Receivable for Past Service
|
58 | 62 |
|
Employers Contributions Receivable for Past Service
|
47 | 58 |
| Subtotal | $96,529 | $96,768 |
| Pension Obligations table 59 note 1 1 | 92,064 | 93,783 |
| Excess of the Balance of the Account Over the Pension Obligations | $4,465 | $2,985 |
The PSSA requires that any actuarial deficit resulting from a lower balance in the superannuation account than the actuarial liability be addressed by increasing the superannuation account in equal instalments over a period of up to 15 years. It also allows the surplus to be reduced by decreasing the superannuation account over a period of up to 15 years; however, if the balance of the superannuation account exceeds one hundred and ten percent (110 percent) of the amount required to meet the cost of the benefits payable, the surplus amount must be reduced by decreasing the superannuation account annually over a period of up to 15 years.
| 2014 | 2013 | |
|---|---|---|
| Opening Balance | $96,648 | $96,442 |
| Increase | ||
|
Contributions—Employers
|
$19 | $18 |
|
Contributions—Plan Members
|
21 | 23 |
|
Transfers from Other Pension Plans
|
0 | 1 |
|
Interest Income
|
5,061 | 5,318 |
|
Total Increase
|
$5,101 | $5,360 |
| Decrease | ||
|
Benefits Paid
|
$5,181 | $5,010 |
|
Refunds and Transfers
|
86 | 72 |
|
Administrative Expenses
|
58 | 72 |
|
Total Decrease
|
$5,325 | $5,154 |
| Closing Balance | $96,424 | $96,648 |
22. Retirement Compensation Arrangements
Separate Retirement Compensation Arrangements (RCA), No. 1 and No. 2, have been established under the authority of the Special Retirement Arrangements Act to provide supplementary pension benefits to certain plan members. RCA No. 1 provides for benefits in excess of those permitted under the Income Tax Act restrictions for registered pension plans. RCA No. 2 provides pension benefits to federal public service employees who were declared surplus as a result of a three-year Early Retirement Incentive program that ended on . The cost of RCA No. 2 is entirely assumed by the Government.
Pursuant to the legislation, transactions pertaining to both RCA No. 1 and RCA No. 2, such as contributions, benefits, and interest credits, are recorded in the RCA Account, which is maintained in the accounts of Canada. The legislation also requires that the RCA Account be credited with interest quarterly at the same rates as those credited to the superannuation account. The RCA is registered with the Canada Revenue Agency (CRA), and a transfer is made annually between the RCA Account and the CRA either to remit a 50-percent refundable tax in respect of the net contributions and interest credits or to be credited a reimbursement based on the net benefit payments. Since these arrangements are covered by separate legislation, the balance in this Account and related pension obligations are not consolidated in the financial statements of the pension plan.
| 2014 | 2013 | |
|---|---|---|
| Balance of Account | ||
|
RCA Account
|
$1,770 | $1,725 |
|
Refundable Tax Receivable
|
1,752 | 1,701 |
|
Plan Member Contribution Receivable for Past Service
|
14 | 8 |
|
Employers Contributions Receivable for Past Service
|
5 | 4 |
| Subtotal | $3,541 | $3,438 |
| Pension Obligations | $3,272 | $3,349 |
| Excess of the Balance of the Account Over the Pension Obligations | $269 | $89 |
The actuarial assumptions used to value the pension obligations pertaining to the RCA Account are consistent with those used for the pension plan in all respects, except that they take into consideration the impact of the refundable tax on the notional rate of return expected for the Account.
| 2014 | 2013 | |
|---|---|---|
| Opening Balance | $3,438 | $3,337 |
| Increase | ||
|
Contributions—Employers
|
$97 | $91 |
|
Contributions—Plan Members
|
13 | 11 |
|
Interest Income
|
92 | 94 |
|
Net Change in Prior Service Contributions Receivable
|
7 | 3 |
|
Actuarial Adjustment
|
8 | 8 |
|
Increase in Refundable Tax Receivable
|
51 | 49 |
|
Total Increase
|
$268 | $256 |
| Decrease | ||
|
Benefits Paid
|
$111 | $105 |
|
Refunds and Transfers
|
3 | 1 |
|
Refundable Tax Remittance
|
51 | 49 |
|
Total Decrease
|
$165 | $155 |
| Closing Balance | $3,541 | $3,438 |
Funding actuarial deficits found between the balance in the RCA Account and the actuarial liabilities are credited to the RCA Account in equal instalments over a period of up to 15 years. As a result of the triennial valuation of March 2011, no adjustment was made to RCA No. 1 (2013 – nil), but a credit adjustment of $8.0 million was made to cover an actuarial deficiency to RCA No. 2 (2013 – $8.0 million) during the year.
23. Guarantees and Indemnities
PSPIB provides indemnification to its directors, its officers, its vice-presidents and to certain PSPIB representatives who are asked to serve on boards of directors (or like bodies) or investment advisory boards (or like bodies) of entities in which PSPIB or its wholly-owned subsidiaries have made an investment or have a financial interest. As a result, but subject to the Public Service Pension Investment Board Act, PSPIB may be required to indemnify these representatives for costs incurred, such as claims, actions or litigations in connection with the exercise of their duties, unless the liability of such a representative relates to a failure to act honestly and in good faith. To date, PSPIB has not received any claims or made any payment for such indemnity.
In certain cases, PSPIB also provides indemnification to third parties in the normal course of business. As a result, PSPIB may be required to indemnify such third parties in connection with the performance of their contractual obligations. To date, PSPIB has not received any claims nor made any payments for such indemnities.
PSPIB unconditionally and irrevocably guarantees all credit facilities, short-term promissory notes and medium-term notes issued by PSP Capital Inc., as described in Note 11.
PSP Capital Inc. provided funding facilities of a maximum amount of $969 million to support potential margin calls on the ABTNs, of which $705 million has been allocated to the pension plan. As at , the margin funding facilities have not been drawn upon since inception.
In certain investment transactions, PSPIB provided guarantees, indemnifications or issued letters of credit to third parties, the most significant of which are as follows:
- As at , PSPIB agreed to guarantee and, in some cases, provide indemnification for the performance of certain investees under contractual agreements. The majority of these arrangements are borrowing arrangements. In the event a default occurs under such agreements, which is of limited recourse in certain cases, the pension plan could assume obligations of up to $889 million (2013 – $728 million) plus applicable interest and other related costs. The arrangements mature between January 2014 and September 2028.
- Additionally, PSPIB and its subsidiaries issued letters of credit totalling $82 million as at (2013 – $41 million), of which $60 million has been allocated to the pension plan (2013 – $30 million) in relation to investment transactions.
24. Commitments
PSPIB and its subsidiaries have committed to enter into investment transactions, which will be funded over the next several years in accordance with agreed terms and conditions. As at March 31, the portion of PSPIB's commitments that would be assumed by the pension plan is as follows ($ millions):
| 2014 | |
|---|---|
| Real Estate | $870 |
| Private Equity | 2,962 |
| Infrastructure | 1,842 |
| Renewal Resources | 582 |
| Other Fixed Income Securities | 1,513 |
| Alternative Investments | 1,327 |
| Total | $9,096 |
25. Reclassification of Prior Year Comparative Figures
Certain prior year comparatives have been reclassified to conform to the current year's presentation.
Glossary of Terms
- Accrued pension benefits
- Benefits earned by members under the public service pension plan for pensionable service to date.
- Actuarial assumptions
- Economic and demographic assumptions, such as future expected rates of return, inflation, salary levels, retirement ages and mortality rates, that are used by actuaries when carrying out an actuarial valuation or calculation.
- Actuarial valuation
- An actuarial analysis that provides information on the financial condition of a pension plan.
- Administration expenses
- Expenses by government departments for the administration of the public service pension plan and for operating expenses incurred by the Public Sector Pension Investment Board to invest pension assets. Investment management fees are paid either directly by the Public Sector Pension Investment Board or offset against distributions received from the investments.
- Annual allowance
- A benefit available to plan members who have more than two years of pensionable service, who retire before age 60 (Group 1) or before age 65 (Group 2), and who are not entitled to an immediate annuity. This benefit is a reduced pension that takes into account the early payment of a retirement pension. The earliest it becomes payable is at age 50 (Group 1) or at age 55 (Group 2).
- Basic pension
- Pension plan benefits based on the number of years of pensionable service to a maximum of 35 years. The benefits are determined by a formula set out in the Public Service Superannuation Act; they are not based on the financial status of the pension plan. The basic benefit formula is 2 per cent per year of pensionable service times the average of the five consecutive years of highest paid service. Using a legislated formula, benefits are coordinated with the Canada Pension Plan and the Québec Pension Plan and are fully indexed to the increase in the Consumer Price Index.
- Benchmark
- A standard against which rates of return can be measured, such as stock and bond market indexes developed by stock exchanges and investment managers.
- Benefits earned
- Benefits to members for service provided during the fiscal year.
- Canada Pension Plan
- A mandatory earnings-related pension plan, implemented on January 1, 1966, to provide basic retirement income to Canadians who work in all the provinces and territories except the province of Quebec. Quebec operates the Québec Pension Plan for persons who work in that province, which is similar to the Canada Pension Plan.
- Child
- A dependant who may be entitled to a children's allowance under the public service pension plan in the event of a plan member's death. To be eligible for an allowance, a child must be under 18 years of age. Children between 18 and 25 may receive allowances if they are enrolled in school or another educational institution full-time and have attended continuously since the age of 18 or the date of the member's death, whichever occurs later.
- Consumer Price Index
- A measure of price changes published by Statistics Canada on a monthly basis. The Consumer Price Index measures the retail prices of a "shopping basket" of about 300 goods and services, including food, housing, transportation, clothing and recreation. The index is weighted, meaning that it gives greater importance to price changes for some products than others—more to housing, for example, than to entertainment—in an effort to reflect typical spending patterns. Increases in the Consumer Price Index are also referred to as increases in the cost of living.
- Contributions
- Sums credited or paid by the employer (Government of Canada, some Crown corporations and the territorial governments) and plan members to finance future pension benefits. Each year, the employer contributes amounts sufficient to fund the future benefits earned by employees in respect of that year, as determined by the President of the Treasury Board.
- Deferred annuity
- A benefit that is available to most plan members who leave the public service before age 60 (Group 1) or before age 65 (Group 2) and who have at least two years of pensionable service. This benefit is calculated using the same formula as an immediate annuity, but payment is deferred until age 60 (Group 1) or until age 65 (Group 2). A plan member who is entitled to a deferred annuity may request an annual allowance at any time after he or she reaches age 50 (Group 1) or age 55 (Group 2).
- Defined benefit pension plan
- A type of pension plan that promises a certain level of pension, which is usually based on the plan member's salary and years of service. The public service pension plan is a defined benefit pension plan.
- Disability
- A physical or mental impairment that prevents an individual from engaging in any employment for which the individual is reasonably suited by virtue of his or her education, training or experience and that can reasonably be expected to last for the rest of the individual's life.
- Group 1
- Members of the public service pension plan who were participating in the plan on or before .
- Group 2
- Members of the public service pension plan who began participating in the plan on or after .
- Immediate annuity
- A benefit payable to plan members who retire at any time after reaching age 60 (Group 1) or age 65 (Group 2) with at least 2 years of pensionable service, or after reaching age 55 (Group 1) or age 60 (Group 2) with at least 30 years of pensionable service, or at any age in the case of disability.
- Indexation
- The automatic adjustment of pensions in pay or accrued pension benefits (deferred annuities) in accordance with changes in the Consumer Price Index. Under the public service pension plan, pensions are indexed in January of each year in order to maintain their purchasing power.
- Minimum benefit
- A benefit that is equal to the payment of the plan member's basic pension for a period of five years. If the plan member or his or her eligible surviving spouse or children have not received, in total, pension payments equal to five times the amount of the plan member's annual basic pension, the balance in the form of a lump-sum amount becomes payable to his or her designated beneficiary for the Supplementary Death Benefit or, if there is no beneficiary, to his or her estate.
- Net assets available for benefits
- Includes receivables and other assets, and the fair value of the assets held by the Public Sector Pension Investment Board on behalf of the pension plan, net of Public Sector Pension Investment Board liabilities.
- Pension Transfer Agreement
- An agreement negotiated between the Government of Canada and an eligible employer to provide portability of accrued pension credits from one pension plan to the other.
- Pensionable service
- Periods of service to the credit of a public service pension plan member. This service includes any complete or partial periods of purchased service (e.g., service buyback or elective service).
- Public Sector Pension Investment Board
- A Crown corporation established on April 1, 2000, under the Public Sector Pension Investment Board Act. The corporation's mandate is to invest in capital markets the amounts transferred to it since , by the Government of Canada with respect to the public service pension plan. The Public Sector Pension Investment Board operates under the commercial name of PSP Investments. Both names are used interchangeably throughout this report.
- Public Service Pension Fund Account
- An account established to record pension transactions relating to service provided by members since .
- Public service pension plan
- A pension plan implemented on , that provides benefits to public service employees payable on retirement, termination of service or disability, and to their survivors payable after death. This plan is defined by the Public Service Superannuation Act, the Pension Benefits Division Act and the public service–related benefits provided under the Special Retirement Arrangements Act.
- Public Service Superannuation Account
- An account established by the Public Service Superannuation Act to record pension transactions relating to service provided by members before .
- Public Service Superannuation Act
- An Act to provide pension benefits to eligible federal public servants and their dependants.
- Québec Pension Plan
- A pension plan similar to the Canada Pension Plan that covers individuals working in the province of Quebec. It is administered by the Régie des rentes du Québec.
- Return of contributions
- A benefit that is available to contributors who leave the public service with less than two years of pensionable service under the public service pension plan. It includes employee contributions plus interest, if applicable.
- Supplementary death benefit
- A decreasing life insurance benefit equal to twice the annual salary of the plan member; coverage decreases by 10 per cent per year starting at age 66. A minimum amount of coverage (i.e., $10,000) is provided at no cost to the plan member at age 65 for plan members entitled to an immediate annuity or an annual allowance payable within 30 days after termination of employment in the public service. This minimum coverage is maintained for life.
- Survivor
- The person who, at the time of the plan member's death, was married to the plan member before his or her retirement or was cohabiting in a relationship of a conjugal nature with the plan member prior to retirement and for at least one year prior to the date of death.
- Survivor benefit
- A pension benefit paid to the survivor of a plan member who dies.
- Transfer value
- A benefit option available to plan members who leave the public service before age 50 (Group 1) or before age 55 (Group 2) with at least two years of pensionable service. This benefit is the actuarial value of the plan member's accrued pension benefits. It must be transferred to another registered pension plan, to a retirement savings vehicle, or to a financial institution to purchase an annuity.
- Vesting
- Vesting occurs after the employee has been a member of the pension plan (i.e., has pensionable service) for an uninterrupted period of two years. Once vested, the member is entitled to receive the value of the employee's own contributions plus those of the employer, along with the investment returns earned on both contributions.
- Year's maximum pensionable earnings
- The maximum earnings on which contributions are made to the Canada Pension Plan and the Québec Pension Plan during the year. The year's maximum pensionable earnings were $52,500 in 2014 ($51,100 in 2013).