
Report on Public Sector Pension Plans as at March 31, 2015
This report provides data and information for fiscal year ended . Where not available, data and information from other years is presented and noted.
Table of Contents
Overview
Objective and scope of this report
The Government of Canada sponsors a number of defined benefit pension plans for its employees, including the public service, the Royal Canadian Mounted Police (RCMP), the Canadian Armed Forces and the Reserve Force pension plans (the four main public sector pension plans), as well as other retirement compensation arrangements. These plans are one of the benefits the government offers to help recruit and retain the highly skilled workforce that is required to deliver services to Canadians.
The President of the Treasury Board and the Treasury Board of Canada Secretariat have an overarching policy responsibility for the four main public sector plans. However, the plans are managed separately and have their own governance structure and reporting requirements.
This report provides an overview of the four main public sector pension plans, and compiles and complements information contained in each of the four plans’ annual and actuarial reports. Data presented in this report is from publicly available documents.
Year at a glance, fiscal year ended
- There were 721,276Footnote * members in the four plans, including active contributors and retired members.
- The four plans had a total pension obligation of $253.3 billion.Footnote *
- A total of $112.0 billion in pension plan assets was invested by the Public Sector Pension Investment Board (PSPIB).
- PSPIB reported an annual rate of return of 14.5% and an annualized rate of return of 7.6% over the last 10 years.
- A total of $6,184 million in cash contributions was made to the four plans by members and employers.
- To cover day-to-day operations of the pension plans, $429 million in administrative expenses were charged to the plans.
- The total pension expense incurred by the government was $12.1 billion.
- Contributions for the public service pension plan continues to move toward the cost-sharing objective of 50:50 by 2017. Comparable changes to the Canadian Armed Forces and the RCMP pension plans are also being made.
- The average pension paid to retired members was $24,141 for the public service, $39,715 for the RCMP, and $24,851Footnote * for the Canadian Armed Forces and the Reserve Force.
Roles and responsibilities
The four main public sector pension plans are contributory defined benefit pension plans established by legislation.Footnote 1 The plans provide retirement and survivor benefits to eligible plan members upon retirement and their survivors upon the member’s death.
The Government of Canada is the sponsor of the four main public sector pension plans.
Pursuant to legislation, the President of the Treasury Board, the Minister of National Defence and the Minister of Public Safety and Emergency Preparedness are responsible for their organizations’ respective pension plans. The President of the Treasury Board also assumes responsibilities with respect to the funding of the four plans.
To support their respective ministers, the Treasury Board of Canada Secretariat, National Defence and the RCMP are responsible for developing policy and legislation, providing program advice and interpretation, providing financial analysis, and preparing financial statements and annual reports for their organizations’ pension plans. National Defence provides its pension plan’s day-to-day administration, including determining eligibility for benefits and calculating and paying benefits. Public Services and Procurement Canada (PSPC) provides the day-to-day administration of the public service pension plan. PSPC has also been providing such administration for the RCMP pension plan since .
The Office of the Chief Actuary, an independent unit of the Office of the Superintendent of Financial Institutions, performs periodic actuarial valuations for funding purposes and calculates the yearly pension obligations included in the pension plans’ financial statements.
PSPIB is a Crown corporation established by the Public Sector Pension Investment Board Act that is accountable to Parliament through the President of the Treasury Board. PSPIB’s statutory mandate is to manage the funds transferred by the four main pension plan funds and to maximize investment returns without undue risk of loss, having regard to the funding, policies and requirements of the pension plans. PSPIB has been investing on behalf of the four main pension plans since .
Membership
Figure 1 shows the number of active contributors and retired members for each pension plan.
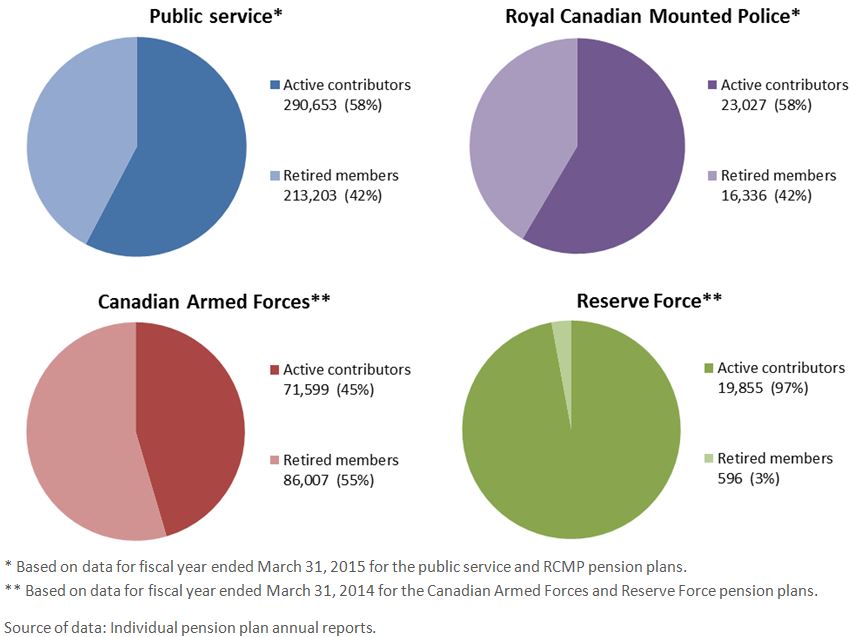
Figure 1 - Text version
| Number | % of total | |
|---|---|---|
Figure 1 Table 1 Notes
Source of data: Individual pension plan annual reports. |
||
| Active contributors | 290,653 | 58% |
| Retired members | 213,203 | 42% |
| Public service total | 503,856 | 100% |
| Number | % of total | |
|---|---|---|
Figure 1 Table 2 Notes
Source of data: Individual pension plan annual reports. |
||
| Active contributors | 23,027 | 58% |
| Retired members | 16,336 | 42% |
| Royal Canadian Mounted Police total | 39,363 | 100% |
| Number | % of total | |
|---|---|---|
Figure 1 Table 3 Notes
Source of data: Individual pension plan annual reports. |
||
| Active contributors | 71,599 | 45% |
| Retired members | 86,007 | 55% |
| Canadian Armed Forces total | 157,606 | 100% |
| Number | % of total | |
|---|---|---|
Figure 1 Table 4 Notes
Source of data: Individual pension plan annual reports. |
||
| Active contributors | 19,855 | 97% |
| Retired members | 596 | 3% |
| Reserve Force total | 20,451 | 100% |
Figure 2 shows the number of active contributors and retired members for each of the four pension plans.
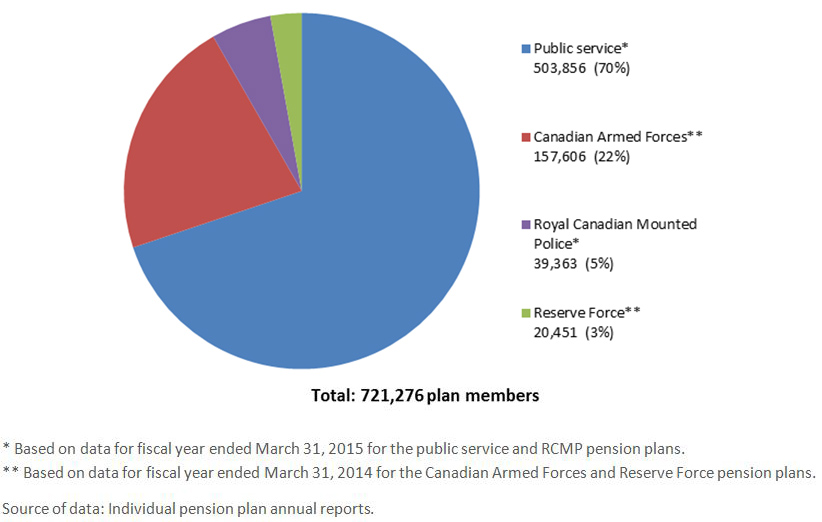
Figure 2 - Text version
| Total | % of total | |
|---|---|---|
Figure 2 Table 1 Notes
Source of data: Individual pension plan annual reports. |
||
| Public servicefigure 2 table 1 note * | 503,856 | 70% |
| Canadian Armed Forcesfigure 2 table 1 note ** | 157,606 | 22% |
| Royal Canadian Mounted Policefigure 2 table 1 note * | 39,363 | 5% |
| Reserve Forcefigure 2 table 1 note ** | 20,451 | 3% |
| All plans total | 721,276 | 100% |
Benefits payable to retired members
Figure 3 shows average pensions paid to retired members and survivors from 2006 to 2015.
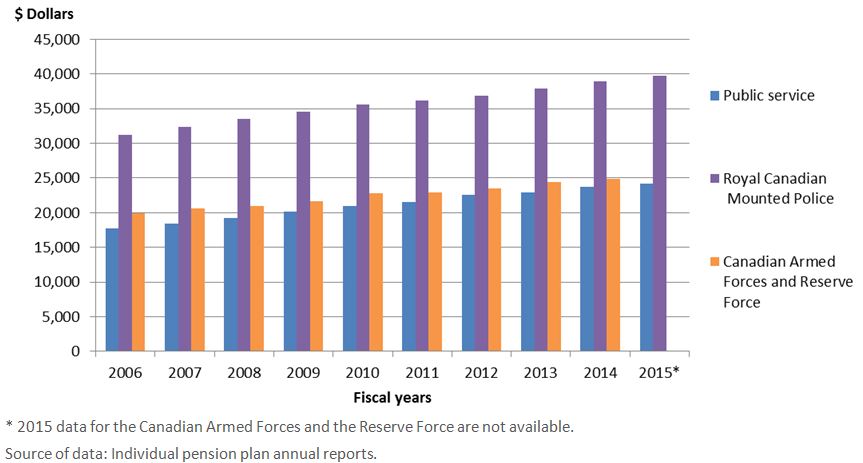
Figure 3 - Text version
| Fiscal years | Public service | Royal Canadian Mounted Police | Canadian Armed Forces and Reserve Force |
|---|---|---|---|
Figure 3 Table 1 Notes
Source of data: Individual pension plan annual reports. |
|||
| 2006 | 17,711 | 31,245 | 19,897 |
| 2007 | 18,412 | 32,385 | 20,560 |
| 2008 | 19,273 | 33,533 | 21,002 |
| 2009 | 20,107 | 34,610 | 21,684 |
| 2010 | 20,945 | 35,561 | 22,783 |
| 2011 | 21,584 | 36,114 | 22,970 |
| 2012 | 22,566 | 36,848 | 23,443 |
| 2013 | 22,883 | 37,930 | 24,382 |
| 2014 | 23,746 | 38,940 | 24,851 |
| 2015figure 3 table 1 note * | 24,141 | 39,715 | N/A |
The average pension paid to retired members and survivors was as follows:
- Public service: $24,141 (for fiscal year ended )
- The RCMP: $39,715 (for fiscal year ended )
- Canadian Armed Forces and Reserve Force: $24,851 (for fiscal year ended )
Contributions
Public sector pension plan benefits are funded through compulsory contributions from the employers and plan members, as well as from investment earnings. Figure 4 shows the share of cash contributions to the pension funds between the employers and plan members for each plan for the year ended March 31, 2015. Cash contributions include current service and past service contributions (e.g., service buybacks) and do not include actuarial adjustments.Footnote 2
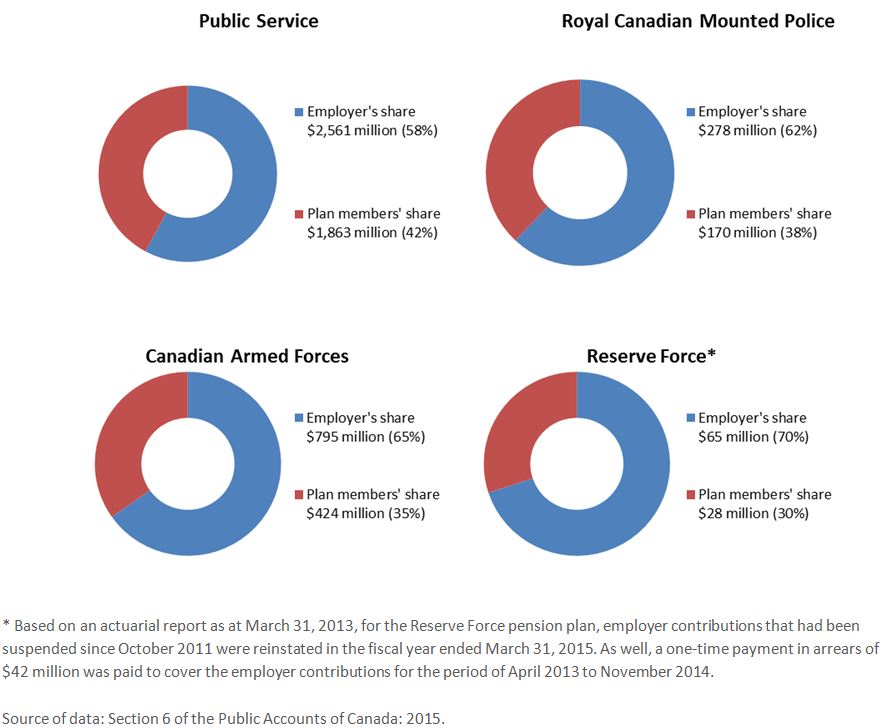
Figure 4 - Text version
| Public service (in millions) | Public service (in percentage) | Royal Canadian Mounted Police (in millions) | Royal Canadian Mounted Police (in percentage) | Canadian Armed Forces (in millions) | Canadian Armed Forces (in percentage) | Reserve Force (in millions)figure 4 table 1 note * | Reserve Force (in percentage)figure 4 table 1 note * | |
|---|---|---|---|---|---|---|---|---|
Figure 4 Table 1 Notes
Source of data: Section 6 of the Public Accounts of Canada: 2015. |
||||||||
| Employer’s share | $2,561 | 58% | $278 | 62% | $795 | 65% | $65 | 70% |
| Plan members’ share | $1,863 | 42% | $170 | 38% | $424 | 35% | $28 | 30% |
| Total | $4,424 | 100% | $448 | 100% | $1,219 | 100% | $93 | 100% |
Table 1 shows plan members’ contributions as a percentage of their salary that is collected through payroll deductions. Plan members contribute at a lower rate on salary up to the yearly maximum pensionable earnings (YMPE) that apply under the Canada Pension Plan and the Quebec Pension Plan. In 2015, the YMPE limit was $53,600.
The public service pension plan comprises two groups of plan members: those who were participating in the plan on or before (Group 1), and those who began participating in the plan on or after (Group 2). Table 1 outlines members’ contribution rates as a percentage of their salary for 2015.
| Public service | RCMP | Canadian Armed Forces | Reserve Forcetable 1 note * | ||
|---|---|---|---|---|---|
| Group 1 | Group 2 | ||||
Table 1 Notes
Source of data: Section 6 of the Public Accounts of Canada: 2015. |
|||||
| Up to the YMPE | 8.2% | 7.1% | 8.2% | 8.2% | 5.2% |
| Above the YMPE | 10.4% | 8.5% | 10.4% | 10.4% | N/A |
Since (2007 for the Reserve Force pension plan), plan member and employer pension contributions, net of benefit payments and other charges to the pension plans, are to be transferred to PSPIB for investment.
Prior to , employer and plan member contributions under the pension plans were not invested. Contributions, as well as benefit payments, interest, charges and transfers that pertain to service before , have been tracked in the superannuation accounts in the Public Accounts of Canada.
Financial overview
Value of assets held by PSPIB
Figure 5 shows the value of assets held by PSPIB for each pension plan, as at .
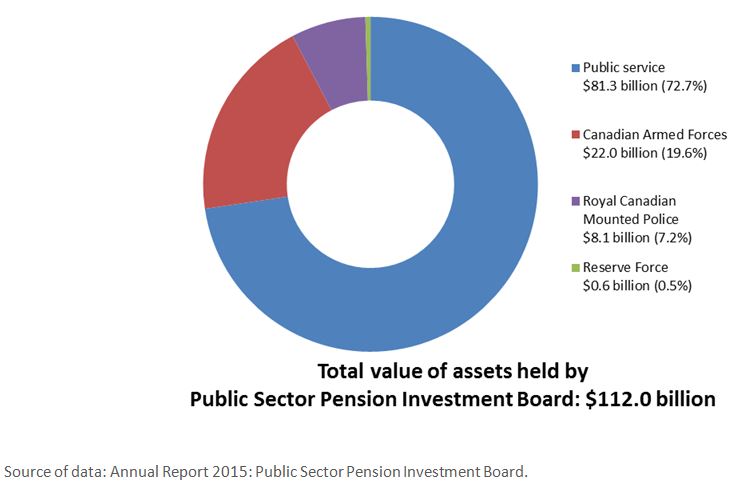
Figure 5 - Text version
| Fiscal year | Public service | Canadian Armed Forces | Royal Canadian Mounted Police | Reserve Force | Total |
|---|---|---|---|---|---|
| Source of data: Annual Report 2015: Public Sector Pension Investment Board. |
|||||
| 2015 | $81.3 billion (72.7%) | $22.0 billion (19.6%) | $8.1 billion (7.2%) | $0.6 billion (0.5%) | $112 billion |
Figure 6 shows the total value of pension plan assets held by PSPIB each year over the last 10 years at year ended .
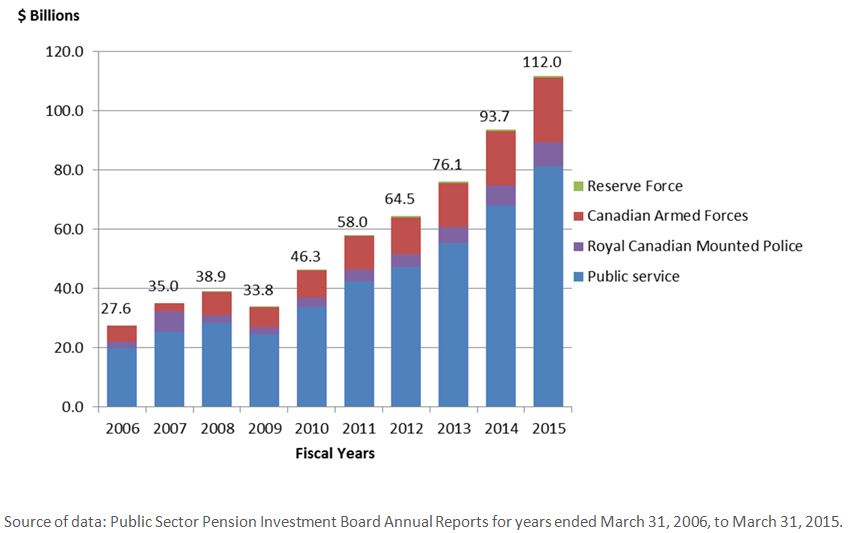
Figure 6 - Text version
| Fiscal years | Public service | Canadian Armed Forces | Royal Canadian Mounted Police | Reserve Force | Total |
|---|---|---|---|---|---|
| Source of data: Public Sector Pension Investment Board Annual Reports for years ended , to . |
|||||
| 2006 | 20.0 | 5.6 | 2.0 | 0.0 | 27.6 |
| 2007 | 25.4 | 2.5 | 7.0 | 0.0 | 35.0 |
| 2008 | 28.3 | 7.8 | 2.8 | 0.1 | 38.9 |
| 2009 | 24.5 | 6.8 | 2.4 | 0.1 | 33.8 |
| 2010 | 33.7 | 9.1 | 3.3 | 0.2 | 46.3 |
| 2011 | 42.3 | 11.3 | 4.1 | 0.3 | 58.0 |
| 2012 | 47.1 | 12.4 | 4.6 | 0.4 | 64.5 |
| 2013 | 55.5 | 14.9 | 5.4 | 0.4 | 76.1 |
| 2014 | 68.2 | 18.4 | 6.7 | 0.5 | 93.7 |
| 2015 | 81.3 | 22.0 | 8.1 | 0.6 | 112.0 |
Investment Asset Mix
As part of its investment approach, PSPIB has developed a policy portfolio, which is a diversification strategy intended to mitigate risks. The policy portfolio represents the long-term target asset allocation among various asset classes. PSPIB’s actual investment asset mix is based on the policy portfolio.
Figure 7 shows PSPIB’s investment asset mix as at .
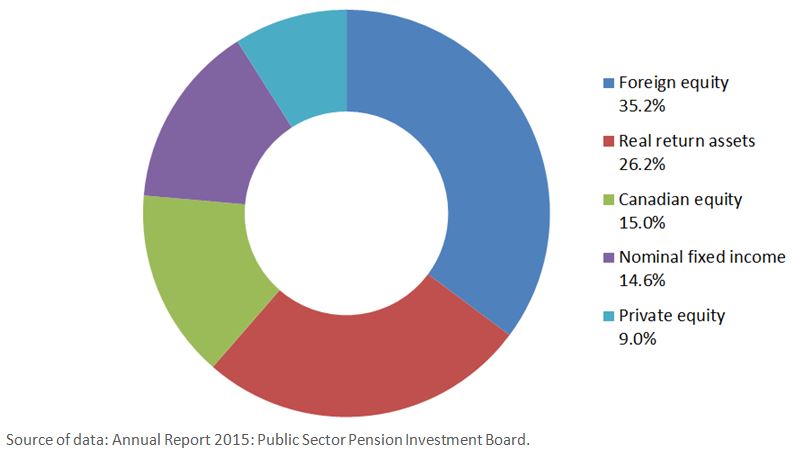
Figure 7 - Text version
| PSPIB investment | |
|---|---|
| Source of data: Annual Report 2015: Public Sector Pension Investment Board. |
|
| Foreign equity | 35.2% |
| Real return assets | 26.2% |
| Canadian equity | 15.0% |
| Nominal fixed income | 14.6% |
| Private equity | 9.0% |
Investment returns
PSPIB reported a rate of return of 14.5% for fiscal year ended and an annualized rate of return of 7.6% over the last 10 years, which surpassed the return objective of 6.0% over the same period.
PSPIB has generated above-benchmark returns in 8 of the past 10 years. It has accomplished this by pursuing a strategy of reducing the share of its investments managed by external assets managers and by diversifying its asset classes. Internal active management of assets allows for better control in terms of investment risks and costs.
Figure 8 shows the yearly rate of return on assets held by PSPIB against its comparative benchmark at year ended .
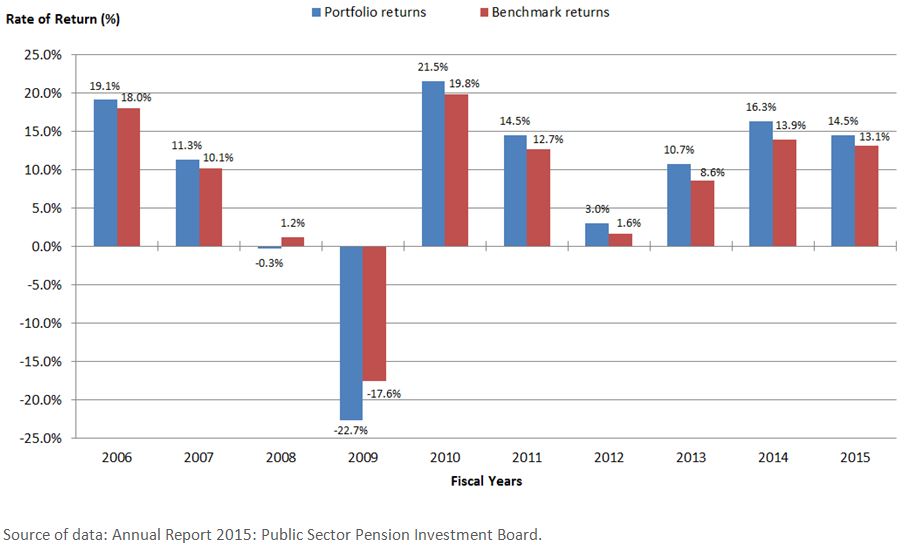
Figure 8 - Text version
| Fiscal years | Portfolio returns | Benchmark returns |
|---|---|---|
| Source of data: Annual Report 2015: Public Sector Pension Investment Board. |
||
| 2006 | 19.1% | 18.0% |
| 2007 | 11.3% | 10.1% |
| 2008 | -0.3% | 1.2% |
| 2009 | -22.7% | -17.6% |
| 2010 | 21.5% | 19.8% |
| 2011 | 14.5% | 12.7% |
| 2012 | 3.0% | 1.6% |
| 2013 | 10.7% | 8.6% |
| 2014 | 16.3% | 13.9% |
| 2015 | 14.5% | 13.1% |
Additional information on the rate of return on assets held by PSPIB and comparative benchmarks is available on PSPIB’s website.
Public sector pension obligations
Figure 9 shows the total pension obligations of the four main public sector pension plans. As at (for the public service and RCMP pension plans), and as at (for the Canadian Armed Forces and the Reserve Force pension plans), there was a total pension obligation of $253.3 billion.
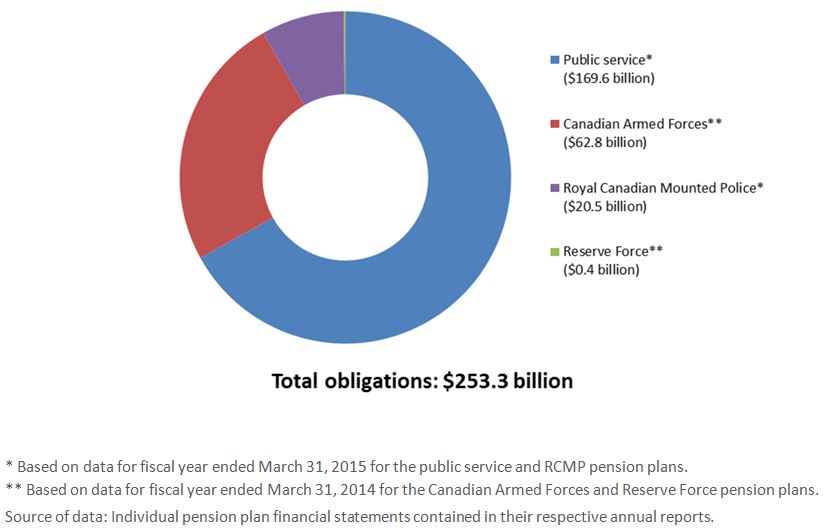
Figure 9 - Text version
| Public servicefigure 9 table 1 note * | Canadian Armed Forcesfigure 9 table 1 note ** | Royal Canadian Mounted Policefigure 9 table 1 note * | Reserve Forcefigure 9 table 1 note ** | Total liabilities | |
|---|---|---|---|---|---|
Figure 9 Table 1 Notes
Source of data: Individual pension plan financial statements contained in their respective annual reports. |
|||||
| Obligations (in billions) | 169,580 | 62,789 | 20,508 | 381 | 253,258 |
Administrative expenses
Legislation provides pension-related administrative expenses to be charged to the public sector pension plans. These expenses include those of six government organizationsFootnote 3 and of PSPIB.
Figure 10 shows the administrative expenses charged to the pension plans for the last 10 years as shared between government organizations and PSPIB, (left axis, in $ millions) and the assets held by PSPIB (right axis, in $ billions). Figure 10 also shows the relation between administrative expenses and increases in the value of assets held by PSPIB.
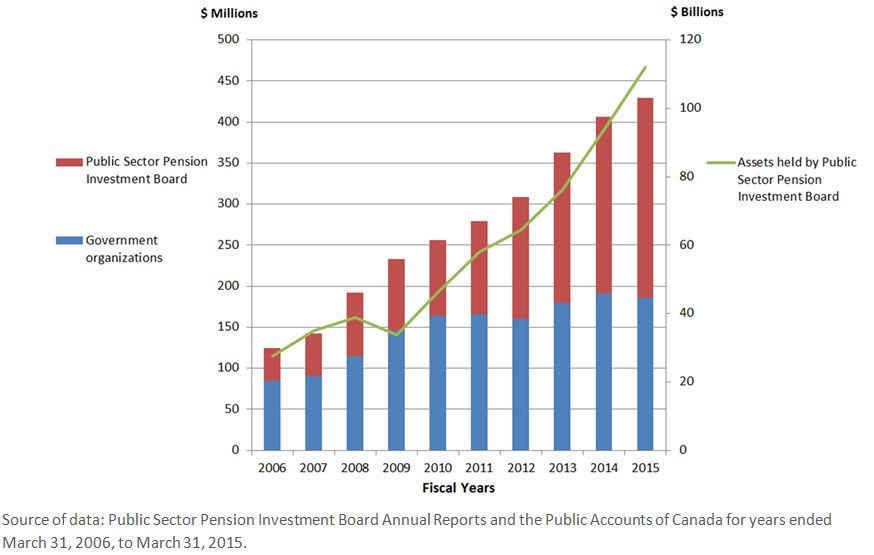
Figure 10 - Text version
| Fiscal years | Government organizations (millions) | Public Sector Pension Investment Board (millions) | Total (millions) | Assets held by Public Sector Pension Investment Board (billions) |
|---|---|---|---|---|
| Source of data: Public Sector Pension Investment Board Annual Reports and the Public Accounts of Canada for years ended , to . |
||||
| 2006 | 85 | 39 | 124 | 27.6 |
| 2007 | 91 | 52 | 143 | 35.0 |
| 2008 | 115 | 77 | 192 | 38.9 |
| 2009 | 146 | 87 | 233 | 33.8 |
| 2010 | 163 | 92 | 256 | 46.3 |
| 2011 | 165 | 114 | 279 | 58.0 |
| 2012 | 160 | 148 | 308 | 64.5 |
| 2013 | 179 | 184 | 363 | 76.1 |
| 2014 | 191 | 216 | 407 | 93.7 |
| 2015 | 186 | 243 | 429 | 112.0 |
In fiscal year ended , total administrative expenses for the four pension plans were $429 million. Administrative expenses for each pension plan were as follows:
- Public service pension plan: $276 million
- RCMP pension plan: $40 million
- Canadian Armed Forces pension plan: $98 million
- Reserve Force pension plan: $15 million
Impact on public finances
Table 2 shows a summary of transactions for the four pension plans that resulted in expenses for the Government of Canada for the fiscal year ended . These expenses are calculated based on Canadian public sector accounting standards and are included in the Public Accounts of Canada: 2015.
The pension expense includes employers’ contributions and recognized actuarial valuation gains and losses and other adjustments.
The net interest expense is calculated based on the average accrued pension obligations (i.e., benefits earned by members under their pension plan for pensionable service).
Changes in actuarial assumptions can have significant impacts on the pension expense and obligation. Table 4 shows the impact of changes to certain key assumptions on the pension plans’ obligations.
| Pension expense | Net interest expense | Total expense | |
|---|---|---|---|
Table 2 Notes
Source of data: Table 6.16 of the Public Accounts of Canada: 2015. |
|||
| Public servicetable 2 note * | $2,889 | $4,751 | $7,640 |
| Canadian Armed Forces | 1,201 | 2,286 | 3,487 |
| Reserve Force | (6) | (3) | (9) |
| RCMP | 367 | 652 | 1,019 |
| Total expensestable 2 note ** | $4,451 | $7,686 | $12,137 |
Pension plan funding
Key measures to support sustainability
The governance framework of the public sector plans includes key mechanisms that help ensure that the plans remain sustainable and affordable to plan members and taxpayers. These mechanisms include actuarial valuations, which provide an estimate of expenses and obligations, reviews of the funded status of the plans, and the pension plans’ annual reports.
Each of the plans also has a pension advisory committee that comprises representatives for the employer, plan members and retirees. These committees provide additional oversight, accountability and transparency through their review of administration, design and funding of benefits.
To further strengthen the governance framework of the plans, a coordinating committee, comprising assistant deputy ministers from the Treasury Board of Canada Secretariat, the RCMP, National Defence, Public Services and Procurement Canada, and the Department of Finance Canada, was established to ensure that the government has the information and expert advice it needs to make informed decisions on the management of the public sector pension plans.
The government continues to pursue efficiencies and modernization, such as the reforms announced in 2012, including the move to 50:50 cost sharing for the public service pension plan, and comparable changes to the contribution rates for the Canadian Armed Forces and RCMP pension plans. The normal age of retirement was also changed from 60 to 65 for employees who joined the federal public service in 2013 or later.
Additional monitoring and oversight activities are also performed periodically, which help support the pension plans’ sustainability. These activities include benchmarking of other pension plans’ financial status and monitoring of PSPIB investment returns.
Actuarial valuations
Actuarial valuations are performed regularly to support the administration of the pension plans. The Office of the Chief Actuary performs two types of actuarial valuations:
- Actuarial valuations for funding purposes are conducted at least once every three years. Their purpose is to determine the contribution rates, actuarial liability and the funded status of the plans. These valuations assist the President of the Treasury Board in making informed decisions on the financing of the pension plans. Assessments of the funded status of the pension plans are done more frequently, in consultation with the Office of the Chief Actuary.
- Actuarial valuations for accounting purposes are performed as at March 31 of each fiscal year to measure and report on the pension expense and obligations in the Public Accounts of Canada, and to provide the necessary information to prepare the plans’ financial statements.
Methodology and assumptions used in actuarial valuations
Economic assumptions are set in order to conduct actuarial valuations. Population characteristics and benefit provisions are specific to each pension plan. Assumptions underlying the actuarial valuation for accounting purposes are based on management’s best estimates; the Office of the Chief Actuary determines the best estimate assumptions used in actuarial valuations for funding purposes.
As part of the economic assumptions, discount rates are used to determine the present value of the future pension payments (i.e., pension obligation), the costs of benefits earned, and interest expenses.
Discount rates are set as follows:
- For funded pension benefits (post-), the discount rates are streamed expected rates of return on funds invested by PSPIB.
- For unfunded pension benefits (pre-), the discount rates are the streamed weighted average of Government of Canada long-term bond rates. The streamed weighted average of Government of Canada long-term bond rates is a calculated 20-year weighted moving average of Government of Canada long-term bond rates projected over time. The streamed rates take into account historical Government of Canada long-term bond rates and, over time, reflect expected Government of Canada long-term bond rates.
Table 3 shows some of the key economic assumptions used in the most recent actuarial valuations.
| Actuarial report | Long-term discount rate | Salary increase | Pension indexation | |
|---|---|---|---|---|
| Unfunded pension benefits (pre-) | Funded pension benefits (post-)table 3 note * | |||
Table 3 Notes
Source: Actuarial reports of the Office of the Chief Actuary of Canada and the Public Accounts of Canada: 2015. |
||||
| For accounting purposes (as at ) |
5.1% | 6.1% | 2.6% | 2.0% |
| For funding purposes | ||||
|
Public service (as at March 31, 2014)
|
4.8% | 6.1% | 2.9% | 2.0% |
|
RCMP (as at
)
|
5.0% | 6.3% | 3.2% | 2.2% |
|
Canadian Armed Forces (as at
)
|
4.8% | 6.1% | 3.0% | 2.0% |
|
Reserve Force (as at
)
|
N/A | 6.1% | 3.0% | 2.0% |
Sensitivity analysis of actuarial assumptions
Changes in actuarial assumptions for accounting purposes can result in significantly higher or lower estimates of the accrued pension obligations. Table 4 shows the impact of a 1% increase or decrease to the long-term actuarial assumptions on the pension plans, as well as the other pension arrangements for members of Parliament, federally appointed judges, non-career diplomats, the Governor General and lieutenant governors, and retirement compensation arrangements.
| Changes in actuarial assumptions | Unfunded pension benefits (pre-) | Funded pension benefits (post-) |
|---|---|---|
| Source: Section 2 of the Public Accounts of Canada: 2015 |
||
| Increase of 1% in discount rates | (8,700) | (17,300) |
| Decrease of 1% in discount rates | 9,100 | 22,500 |
| Increase of 1% in rate of inflation | 20,400 | 14,300 |
| Decrease of 1% in rate of inflation | (17,000) | (11,800) |
| Increase of 1% in general wage increase | 1,200 | 6,100 |
| Decrease of 1% in general wage increase | (1,100) | (5,300) |
Actuarial valuation report balances
Tables 5 and 6 show the balances of the superannuation account and the pension fund of each pension plan as of the last triennial funding valuation.
| RCMP 2012 | Canadian Armed Forces 2013 | Reserve Force 2013 | Public service 2014 | |
|---|---|---|---|---|
| Source: Actuarial reports of the Office of the Chief Actuary of Canada. |
||||
| Account balance | $13,024 | $46,390 | N/A | $96,530 |
| Actuarial liability | $13,141 | $45,233 | N/A | $97,211 |
| RCMP 2012 | Canadian Armed Forces 2013 | Reserve Force 2013 | Public service 2014 | |
|---|---|---|---|---|
| Source: Actuarial reports of the Office of the Chief Actuary of Canada. |
||||
| Actuarial value of assets | $4,526 | $14,914 | $356 | $63,151 |
| Actuarial liability | $5,307 | $17,350 | $392 | $66,775 |
Source documents
- Report on the Public Service Pension Plan for the Fiscal Year Ended
- Royal Canadian Mounted Police Pension Plan: Annual Report, 2014–15
- 2013–2014 Annual Report: Canadian Armed Forces Pension Plans
- Annual Reports 2001 to 2015: Public Sector Pension Investment Board
- Public Accounts of Canada: 2015
- Actuarial Report on the Pension Plan for the Public Service of Canada as at
- Actuarial Report on the Pension Plan for the Royal Canadian Mounted Police as at
- Actuarial Report on the Pension Plan for the Canadian Forces: Regular Force as at
- Actuarial Report on the Pension Plan for the Canadian Forces: Reserve Force as at
Glossary
- actuarial adjustments
- The special payments that the Government of Canada is required to make to fund actuarial deficits.
- actuarial assumptions
- Economic and demographic assumptions, such as future expected rates of return, inflation, salary levels, retirement ages and mortality rates, that are used by actuaries when carrying out an actuarial valuation or calculation.
- actuarial valuation
- An actuarial analysis that provides information on the financial condition of a pension plan.
- actuarial value of assets
- The actuarial value of assets is a method to value the investments of a pension plan using a five-year smoothed value. Under this method, the expected return on investments is recorded immediately while the difference between the expected and actual return on investments is recorded over a five-year period through actuarial gains and losses. The actuarial value of assets is adjusted, if necessary, to ensure that it does not fall outside a limit of plus or minus 10% of the market value of investments at year end. Any difference is recorded immediately through actuarial gains and losses.
- administrative expenses
- Expenses by government departments for the administration of the public sector pension plans and for operating expenses incurred by the Public Sector Pension Investment Board to invest pension assets. Investment management fees are paid either directly by the Public Sector Pension Investment Board or are offset against distributions received from the investments.
- benchmark
- A standard against which rates of return can be measured, such as stock and bond market indexes developed by stock exchanges and investment managers.
- contributions
- Sums credited or paid by the employer and plan members to finance future pension benefits. Each year, the employer contributes amounts sufficient to fund the future benefits earned by employees in respect of that year, as determined by the President of the Treasury Board.
- defined benefit pension plan
- A type of pension plan that promises a certain level of pension, which is usually based on the plan member’s salary and years of service. The four main public sector pension plans are defined benefit pension plans.
- pension liability/obligation
- Corresponds to the value, discounted in accordance with actuarial assumptions, of all future payable benefits accrued as of the valuation date in respect of all previous pensionable service.
- pensionable service
- Periods of service to the credit of a public sector pension plan member. This service includes any complete or partial periods of purchased service (e.g., service buyback or elective service).
- pension transfers
- Transfers made based on an agreement negotiated between the Government of Canada and an eligible employer to provide portability of accrued pension credits from one pension plan to the other.
- service buyback
- A service buyback is a legally binding agreement to purchase a period of prior service to increase a member’s pensionable service.
- survivor
- The person who, at the time of the plan member’s death, was married to the plan member before his or her retirement or was cohabiting with the plan member in a relationship of a conjugal nature prior to retirement and for at least one year prior to the date of death.
- yearly maximum pensionable earnings (YMPE)
- The maximum earnings on which contributions are made to the Canada Pension Plan and the Québec Pension Plan during the year. The yearly maximum pensionable earnings were $53,600 in 2015 ($52,500 in 2014).