
Annual Report on Official Languages 2015-16
ISSN 1486-9683
Catalogue No. BT23-1E-PDF
© Her Majesty the Queen in Right of Canada,
represented by the President of the Treasury Board, 2017
Table of Contents
- Message from the President of the Treasury Board
- Introduction
- Status of official languages programs
- Office of the Chief Human Resources Officer activities and follow-up
- Conclusion and trends
- Appendix A: Federal institutions required to submit a review for fiscal year 2015 to 2016
- Appendix B: Sources of statistical data
- Appendix C: Definitions
- Appendix D: Statistical tables
Message from the President of the Treasury Board

President of the Treasury Board
I am pleased to table in Parliament the 28th annual report on official languages, which covers fiscal year 2015 to 2016. This report describes the government’s efforts to ensure that Canada’s two official languages continue to be an integral part of our everyday operations.
Our government remains committed to ensuring that all federal services are delivered in full compliance with the Official Languages Act. In fulfilling this commitment, the Treasury Board Secretariat’s Official Languages Centre of Excellence plays an important role by reinforcing the use of both of Canada’s official languages in the public service. I have closely monitored the public consultations conducted by my colleague, the Honourable Mélanie Joly, Minister of Canadian Heritage, on the renewal of the government’s next Action Plan for Official Languages.
For the public service, our reviews of federal institutions reveal that the vast majority of them succeed in ensuring that they communicate with and provide services to the public in both official languages at offices that are designated bilingual. This report presents data on both accomplishments and challenges that remain with regard to achieving full compliance with the Official Languages Act. One such challenge relates to the effectiveness of measures put in place to create and maintain a work environment that is conducive to the use of both official languages in bilingual regions. Through tools such as the Public Service Employee Survey, we are taking the pulse of our workforce so that we can do what is necessary to be an exemplary and bilingual federal administration.
My report this year also presents results from the census-based update of the language obligations of federal offices under the Official Languages (Communications with and Services to the Public) Regulations, which was launched in 2012. Although this update of the regulations is nearing completion, the regulations themselves have not been reviewed in depth since their adoption in 1991. Francophone and Anglophone minority communities across the country have been asking for these regulations to be improved in order to better reflect their realities. We must take into account changing demographics, new technologies and lessons learned over the past 25 years to be able to serve Canadians better, and in the language of their choice. I was therefore proud to announce the review of the regulations in November 2016. As my colleague, the Honourable Mélanie Joly, did in undertaking consultations on the government’s next Action Plan, I encourage Canadians to become agents of positive change and to participate in the review of the regulations.
I invite you to read this report to find out more about the Government of Canada’s efforts in support of Canada’s official languages.
Original signed by
The Honourable Scott Brison, P.C., M.P.
President of the Treasury Board
Introduction
The Official Languages Act (the act) requires that the President of the Treasury Board report to Parliament on the status of official languages programs in federal institutions subject to Parts IV, V and VI of the act.
The Office of the Chief Human Resources Officer provides support for some 200 federal institutions subject to the act so that they can meet their obligations under the act. These institutions consist of those that are part of the core public administration, as well as Crown corporations, privatized organizations, separate agencies and other public institutions.
Deputy heads have the primary responsibility for human resources management in their respective organizations. They must ensure that their institutions:
- develop and maintain a corporate culture that is conducive to the use of both official languages
- have the capacity to communicate with the Canadian public and public servants in both official languages
- maintain a public service workforce that tends to reflect the two official language communities
This 28th annual report presents the status of the programs relating to the implementation of Parts IV, V and VI of the act in the 2015 to 2016 fiscal year,Footnote 1 with respect to the federal institutions for which the Treasury Board has responsibility under section 46 of the act.
Status of official languages programs
Offering official languages programs in federal organizations is a fundamental part of human resources management and delivering services to the Canadian public. Federal institutions must submit to the Office of the Chief Human Resources Officer a review on official languages at least once every three years. This fiscal year marks the second year of the current three-year cycle. Eighty-seven organizationsFootnote 2 were required to submit a review on the elements related to the application of Parts IV, V and VI of the act. All but one did so, the Blue Water Bridge Authority, which was amalgamated this year with the Federal Bridge Corporation Limited.
Methodology
Institutions were required to report on the following elements:
- communications with and services to the public in both official languages
- language of work
- human resources management
- governance
- monitoring of official languages programs
These five elements were assessed primarily through multiple-choice questions, requesting evidence or explanations when the answers were negative or not applicable; however, the number of questions was reducedFootnote 3, for small institutions and airport authorities, to lighten their reporting burden. Deputy heads are responsible for ensuring that their institution’s review responses are supported by facts and evidence. The response scales used in the Review on Official Languages are shown in Table 1.
| Nearly always | In 90% or more of cases |
|---|---|
| Very often | Between 70% and 89% of cases |
| Often | Between 50% and 69% of cases |
| Sometimes | Between 25% and 49% of cases |
| Almost never | In less than 25% of cases |
| Yes | Completely agree with the statement |
| No | Completely disagree with the statement |
| Regularly | With some regularity |
| Sometimes | From time to time, but not regularly |
| Almost never | Rarely |
| N/A | Does not apply to the institution |
Narrative questions were used to gather more detailed information about the elements, including the following aspects:
- institutions’ official languages capacity
- activities undertaken in large institutions and key institutionsFootnote 4 to measure the availability and quality of services offered in both official languages
The information collected is also used in other activities of the Office of the Chief Human Resources Officer.
The sections below provide an overview of the status of the official languages programs in the 86 institutions that submitted reviews. The statistical tables in Appendix D of this report show the results for all federal institutions.Footnote 5
Communications with and services to the public
As of March 31, 2016, federal institutions had 11,429 offices,Footnote 6 of which 3,995 (35%) were required to offer services to the public in both official languages.Footnote 7
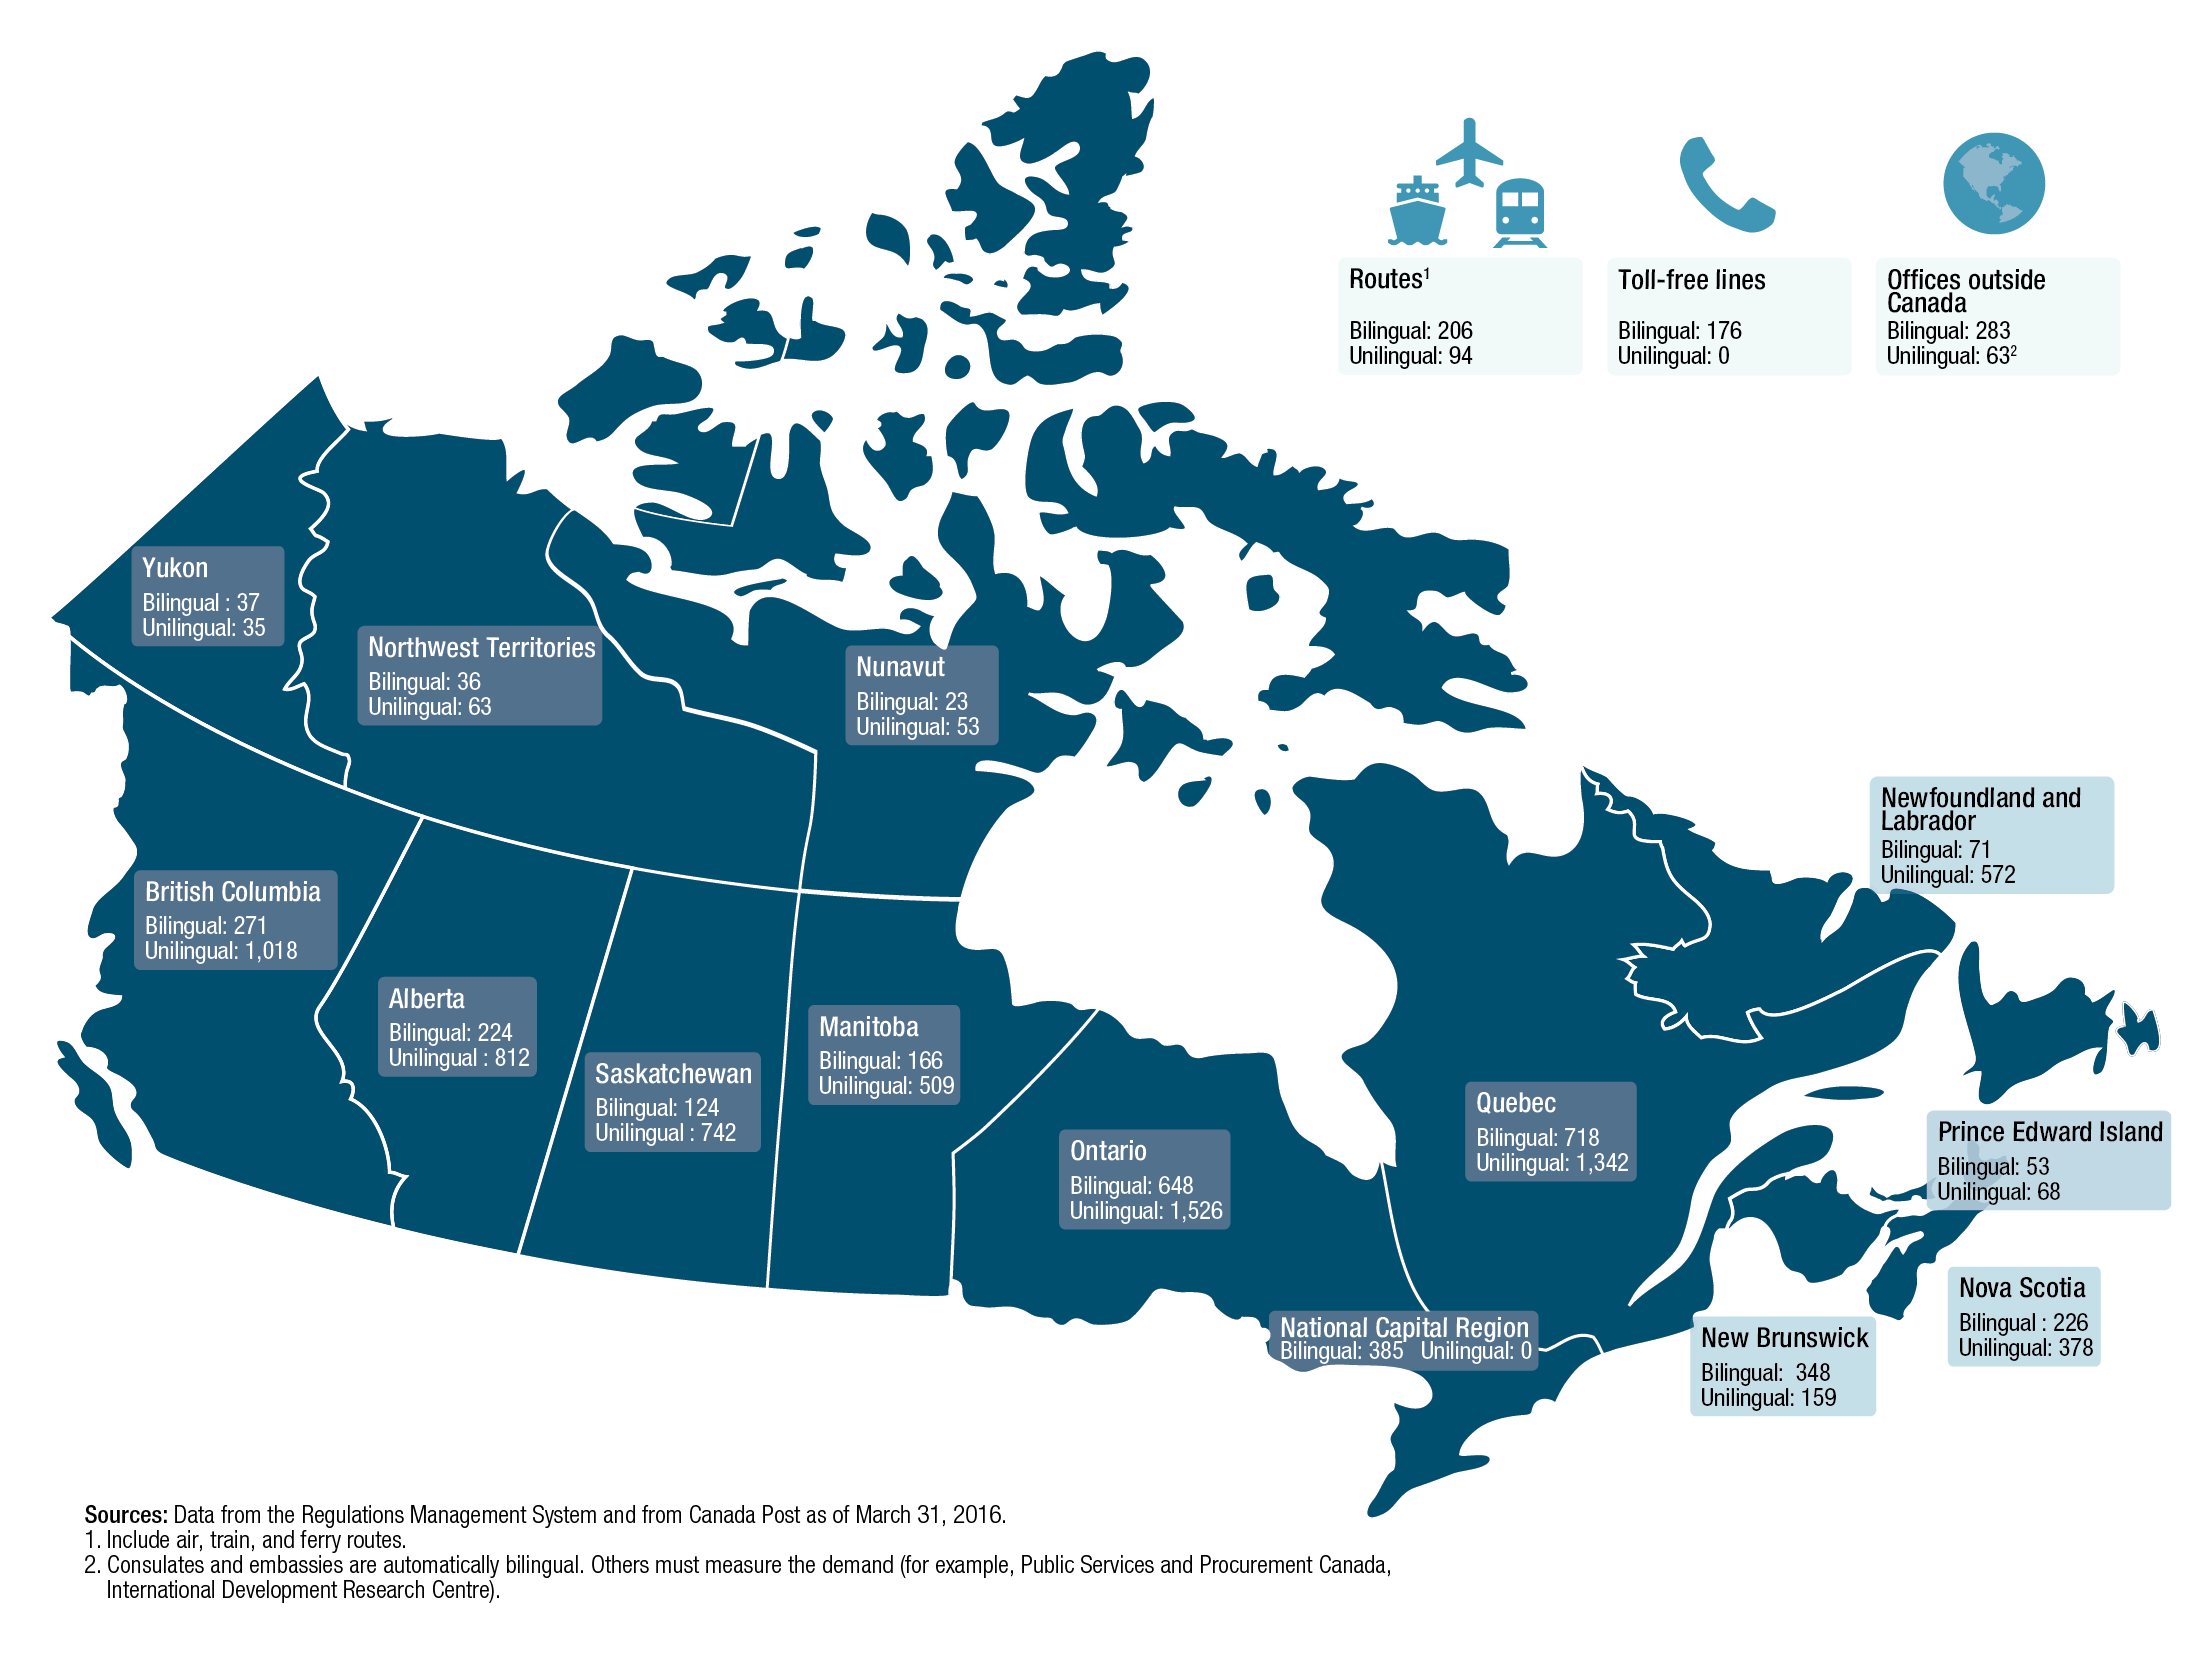
Map - Text version
British Columbia: 271 bilingual offices, 1,018 unilingual; Alberta: 224 bilingual offices, 812 unilingual; Saskatchewan: 124 bilingual offices, 742 unilingual; Manitoba: 166 bilingual offices, 509 unilingual; Ontario: 648 bilingual offices, 1,526 unilingual; National Capital Region: 385 bilingual offices, none unilingual; Quebec: 718 bilingual offices, 1,342 unilingual; New Brunswick: 348 bilingual offices, 159 unilingual; Prince Edward Island: 53 bilingual offices, 68 unilingual; Nova Scotia: 226 bilingual offices, 378 unilingual; Newfoundland and Labrador: 71 bilingual offices, 572 unilingual; Yukon: 37 bilingual offices, 35 unilingual; Northwest Territories: 36 bilingual offices, 63 unilingual; Nunavut: 23 bilingual offices, 53 unilingual; Offices outside Canada: 283 bilingual, 63 unilingual (Consulates and embassies are automatically bilingual. Other offices must measure the demand (for example, Public Services and Procurement Canada, International Development Research Centre)); 176 bilingual toll free lines, none are unilingual; Routes: 206 bilingual, 94 unilingual (include air, train and ferry routes). Sources: Data from the Regulatory Management System and from Canada Post as of March 31, 2016.
Frequency of oral and written communications
Based on the reviews for fiscal year 2015 to 2016, almost all of the institutions that were assessed (94%) reported that, in offices that are bilingual for the purposes of communications with and services to the public, oral communications nearly always or very often occur in the official language chosen by the public. This rate is 93% in small institutions. In airport authoritiesFootnote 8 that have bilingual offices, the compliance rate decreased to 85%.
Ninety-five per cent of the institutions said that written communications nearly always or very often occur in the official language chosen by the public. In small institutions, this rate is 94%; and in airport authorities, it is 83%.
Figure 1. Institutions’ responses for the frequency of oral and written communications in the official language chosen by the public when the office is bilingual
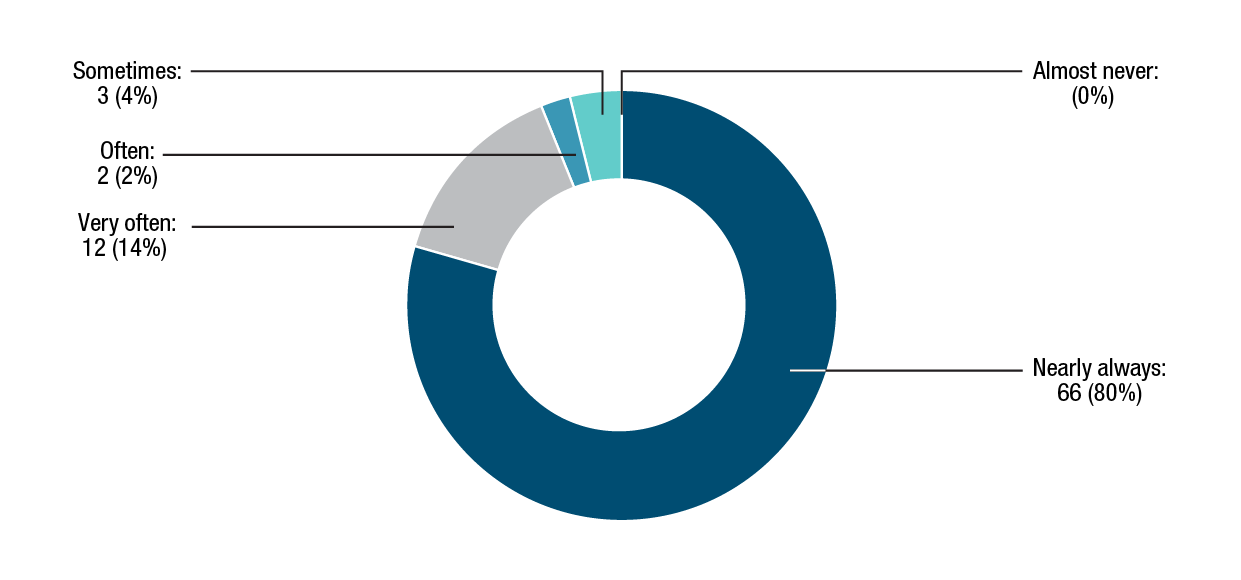
Figure 1a - Text version
Nearly always: 66 institutions, or 80%; very often: 12 institutions, or 14%; often: 2 institutions, or 2%; sometimes: 3 institutions, or 4%; almost never: no institution, or 0%.
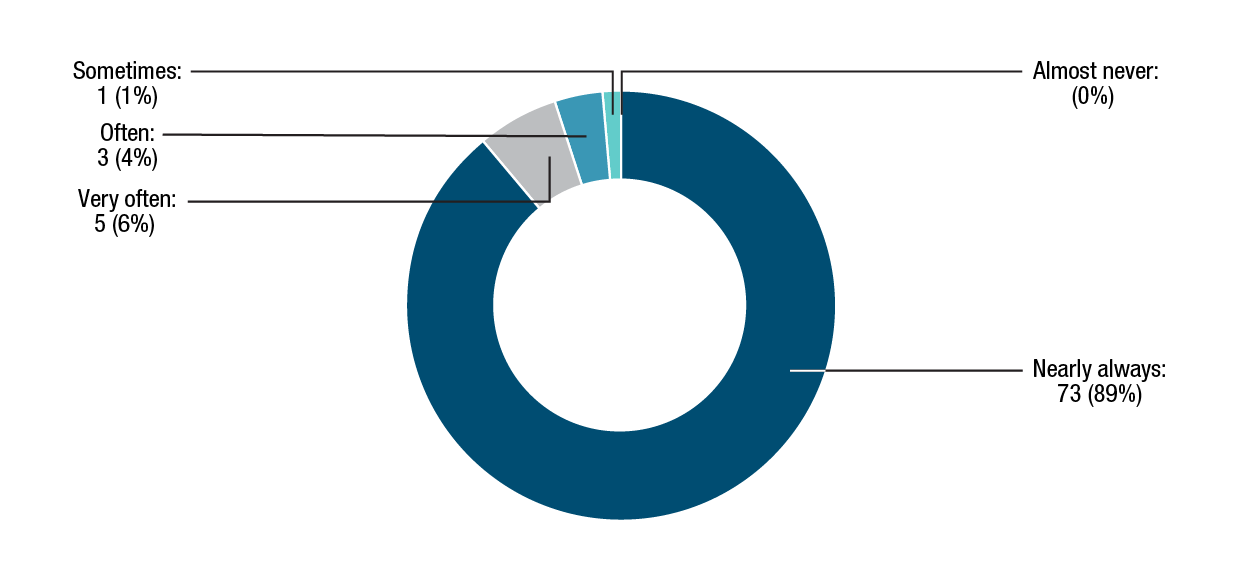
Figure 1b - Text version
Nearly always: 73 institutions, or 89%; very often: 5 institutions, or 6%; often: 3 institutions, or 4%; sometimes: 1 institution, or 1%; almost never: no institution, or 0%.
Communications material
Of all institutions under review (including airport authorities), 89% stated they ensure that in bilingual offices all communications material is nearly always or very often produced and simultaneously issued in full in both official languages. This is the case for 90% of small institutions and for 54% of airport authorities.
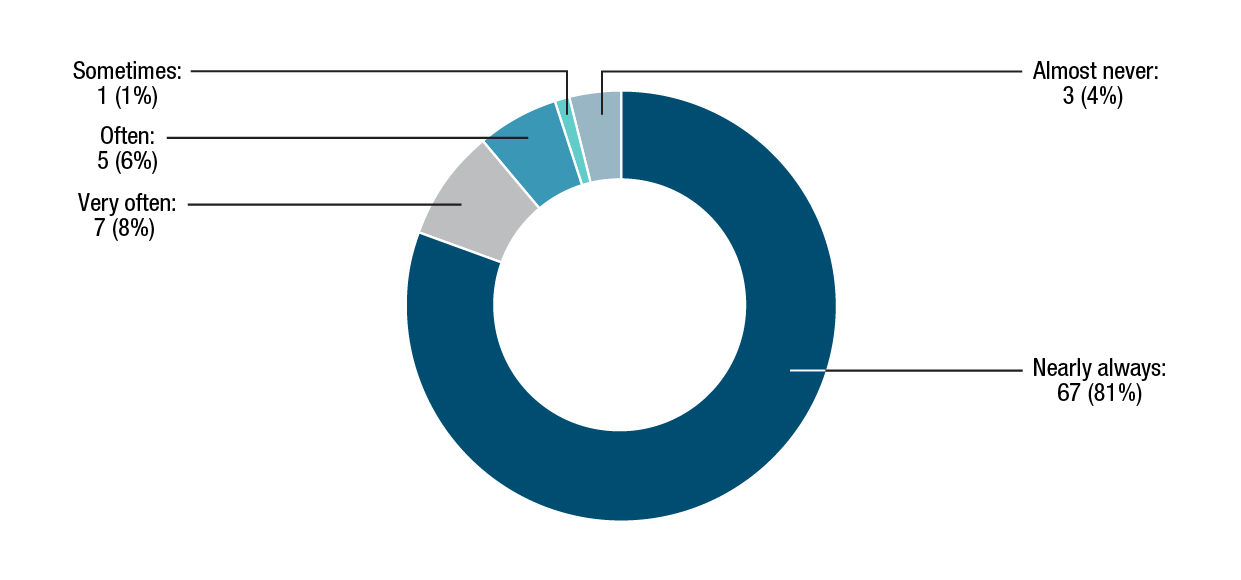
Figure 2 - Text version
Nearly always: 67 institutions, or 81%; very often: 7 institutions, or 8%; often: 5 institutions, or 6%; sometimes: 1 institution, or 1%; almost never: 3 institutions, or 4%.
Signs identifying the institution’s offices or facilities
Federal institutions put in place various measures to ensure the active offer of communications with and services to the public in both official languages in bilingual offices. The Policy on Official Languages defines active offer as follows: “Clearly indicate visually and verbally that members of the public can communicate with and obtain services from a designated office in either English or French.” Of all institutions that submitted a review, 96% stated that the signs identifying their offices are nearly always in both official languages. This is the case for 97% of the small institutions that submitted a review. For airport authorities, 93% stated that it is nearly always the case, and 7% stated that this was very often the case.
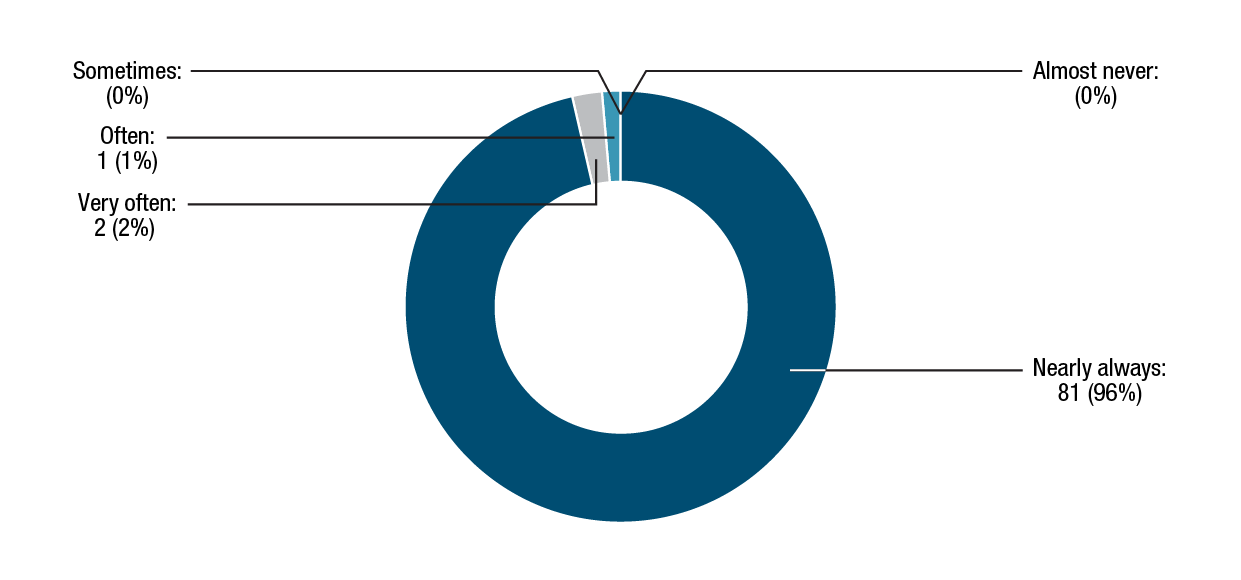
Figure 3 - Text version
Nearly always: 81 institutions, or 96%; very often: 2 institutions, or 2%; often: 1 institution, or 1%; sometimes: no institution, or 0%; almost never: no institution, or 0%.
Small institutions’ websites
All the small institutions indicated that the English and French versions of their websites are nearly always simultaneously posted in full and are of equal quality. For airport authorities, 73% stated this was nearly always the case, and 20% stated that this was very often the case.
Greeting the public in person
A smaller proportion of institutions indicated that they take appropriate measures to greet the public in person in both official languages: 77% of institutions nearly always take appropriate measures (84% for small institutions and 64% for airport authorities), and 11% of institutions very often take such measures (3% for small institutions and 7% for airport authorities).
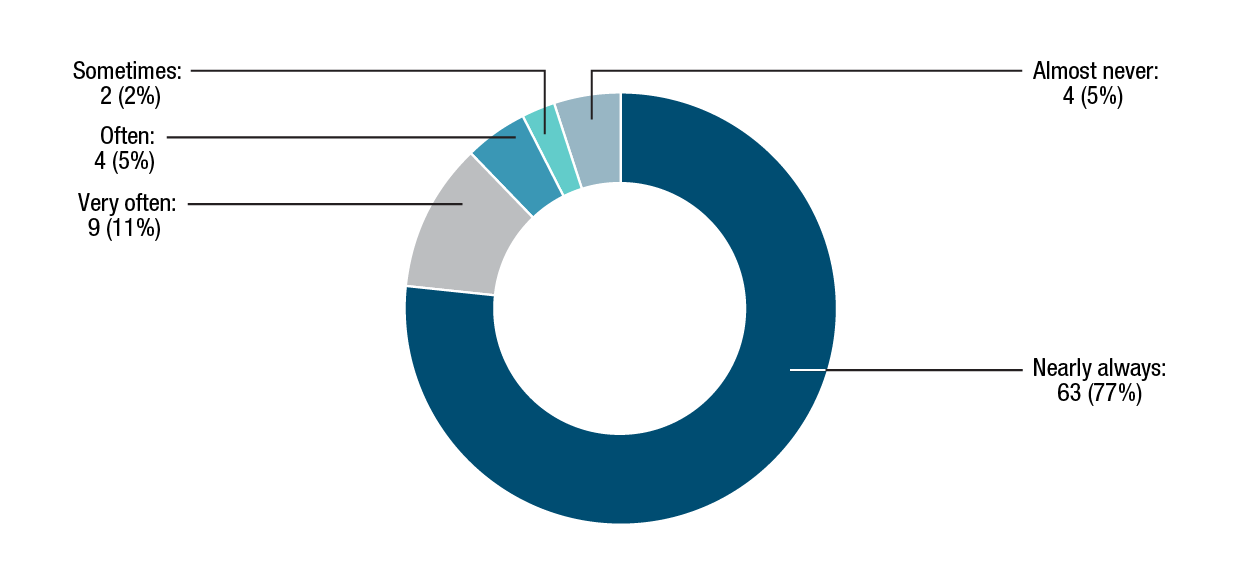
Figure 4 - Text version
Nearly always: 63 institutions, or 77%; very often: 9 institutions, or 11%; often: 4 institutions, or 5%; sometimes: 2 institutions, or 2%; almost never: 4 institutions, or 5%.
Contracts and agreements with third parties
Large and key institutionsFootnote 10 stated that contracts and agreements with third parties acting on behalf of bilingual offices contain clauses setting out their language obligations (79%, nearly always; 18%, very often). They said they ensure that measures are taken to verify that the language clauses are respected (84%, nearly always; 16%, very often). Immigration, Refugees and Citizenship Canada was the only institution that stated that the question did not apply to it.
Use of advertising media
All large and key institutions stated that they nearly always (94%) or very often (6%) select and use advertising media that reach the targeted public in the most efficient way possible in the official language of their choice. Two institutions, the Canada School of Public Service and the Canadian Space Agency, stated that the question did not apply to them.
Implementation of the Official Languages (Communications with and Services to the Public) Regulations reapplication exercise
The Official Languages (Communications with and Services to the Public) Regulations (the regulations) require all federal institutions to undertake the regulations reapplication exercise every 10 years, following the release of data on first official language spoken from the most recent decennial census. To this, the Treasury Board added, in its Directive on the Implementation of the Official Languages (Communications with and Services to the Public) Regulations (the directive), a requirement to review the language obligations of all the offices subject to the provisions for significant demand. The regulations reapplication exercise updates the language obligations of federal offices offering services to the public, thereby ensuring that offices are designated bilingual where there is significant demand for services in the minority language, based on thresholds set out in the regulations.
To update the language obligations of their offices, federal institutions follow a three-stage process:
- Phase I: They examine the census data on the size and proportion of the official language minority population in the census areas in which their offices are located. Some institutions are also required to consider the number of people they serve at their offices.
- Phase II: They examine the census data on the size and proportion of the official language minority population in the broader area served by each affected office.
- Phase III: They gather data on the language preferences of the public they serve at a specific location.
In the first two phases of the regulations reapplication exercise, 89% of the targeted offices were reviewed, including all Canada Post offices; and the language obligations for communications with and services to the public were determined. Burolis, the federal government database that lists the offices of federal institutions where Canadians can obtain services in English, in French or in both official languages, is updated regularly to reflect the progress of the exercise.
Activities and results
In fiscal year 2015 to 2016, the Office of the Chief Human Resources Officer supported institutions in the application of the directive by providing interpretations, advice and individualized support in response to institutions’ requests.
| Status | Number | Percentage |
|---|---|---|
Note: 1,277 offices were not included in the regulations reapplication exercise because they are automatically bilingual. |
||
| Offices removed from the exercise | 188 | 1.8% |
| Follow-ups completed | 9,441 | 92.2% |
| Ongoing follow-ups to the end of 2016 | 611 | 6.0% |
| Total | 10,240 | 100% |
As of March 31, 2016, no change has been made to the linguistic designation of 9,270 offices, or 98.2% of the 9,441 offices reviewed:
- 2,219 offices continue to be designated bilingual for the purposes of communications with and services to the public
- 7,051 offices continue to provide communications with and services to the public in one official language
However, 89 of the 9,441 offices whose language obligations were reviewed have been newly designated bilingual, while 82 others will no longer be required to provide services in both official languages.Footnote 11 The majority of these 171 offices are Canada Post offices across the country.
Some 1,277 other federal offices are automatically designated bilingual under section 22 or 24 of the act and are therefore not included in the regulations reapplication exercise. It is also worth mentioning that since the start of this exercise, 188 federal offices have been removed from the exercise for a variety of reasons, including discontinuation of services, consolidation or relocation.
| Impact | Number | Percentage |
|---|---|---|
| No change in language obligations | 10,547 | 91.6% |
| Newly bilingual offices | 89 | 0.8% |
| Offices that are no longer required to provide services in both official languages | 82 | 0.7% |
| Offices removed from the regulations reapplication exercise | 188 | 1.6% |
| Offices whose language obligations have not yet been determined through the exercise | 611 | 5.3% |
| Total offices | 11,517 | 100% |
The proportion of bilingual offices has increased by 1%, to 35%, since the start of the regulations reapplication exercise. It is estimated that by the end of the regulations reapplication exercise, more than 90% of the official language minority population will be able to receive federal services nearby in the minority language. Online services, toll-free telephone lines and other types of service delivery other than in-person service delivery are not included when calculating the availability of services nearby because all of those services are available in both official languages across Canada at all times.
After the second phase of the regulations reapplication exercise, certain unilingual offices became bilingual; they had until September 3, 2015, to comply with their new language obligations. Of the ten institutions where offices needed to comply with this deadline, seven stated in their review on official languages for fiscal year 2015 to 2016 that their newly bilingual offices had put in place the necessary resources to comply with their new language obligations. However, these institutions stated that all their offices that were designated as bilingual during the first phase were able to comply with their language obligations. The Business Development Bank of Canada stated that three offices had not yet acquired bilingual resources to meet their new obligations but that the active offer of servicesFootnote 12, was made in both official languages and that the telephone service was completely bilingual. Correctional Service Canada stated that six newly bilingual offices did not yet offer bilingual services at the time of the review but that the institution was working diligently to correct the situation. Finally, the Canadian Food Inspection Agency stated that, because of conflicting priorities, it was not able to follow up with its newly bilingual offices.
The offices that have new bilingual obligations have one year to implement the necessary measures to provide services in both official languages. Non-compliance may result in complaints to the Commissioner of Official Languages.
For offices that are no longer required to provide bilingual services, the directive states that the minority language community must be consulted on the terms and conditions of the cessation of bilingual services, the date the services will stop, and the location of offices where the minority community can receive services in its language. The directive gives institutions up to two years to carry out these consultations. Bilingual services continue to be provided until the consultations are held. The final results of the exercise are scheduled to be released at the end of March 2017.
Language of work
Bilingual meetings
In regions designated bilingual for language of work purposes, 75% of the institutions reporting in fiscal year 2015 to 2016 stated that meetings are nearly always (40%) or very often (35%) conducted in both official languages and that employees may use the official language of their choice. In contrast, 59% of small institutions indicated that this is nearly always the case, and 21% stated that this is very often the case. Only one airport authority stated that this is always the case, another that it is very often the case, and three others (50%), that it is almost never the case. Twelve institutions, including eleven airport authorities, do not have offices in bilingual regionsFootnote 13 and did not need to respond to this question or responded that the question did not apply to them.
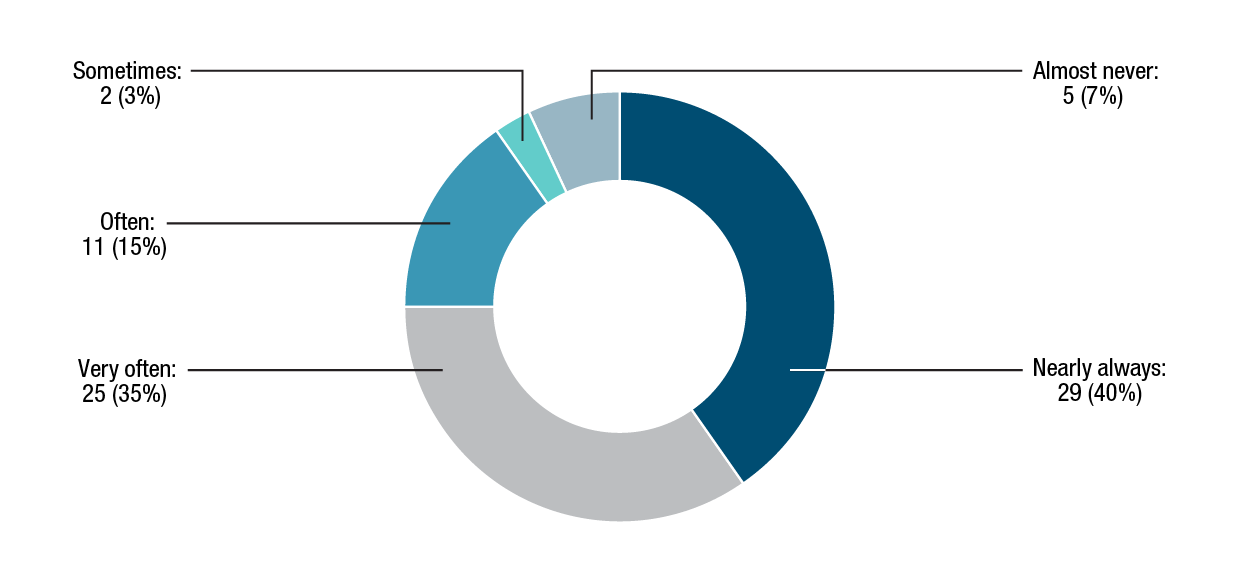
Figure 5 - Text version
Nearly always: 29 institutions, or 40%; very often: 25 institutions, or 35%; often: 11 institutions, or 15%; sometimes: 2 institutions, or 3%; almost never: 5 institutions, or 7%.
Bilingual supervision
Close to three quarters of the institutions (74%) stated that the incumbents of bilingual or either/or positions are nearly always supervised in the official language of their choice, regardless of whether the supervisors are located in bilingual or unilingual regions; 15% reported that this is very often the case. In small institutions, this is nearly always the case for 77% of them, and very often the case for 10%. For the five airport authorities where this applies, three stated that this is nearly always the case, one that it is very often the case, and one that it is sometimes the case.
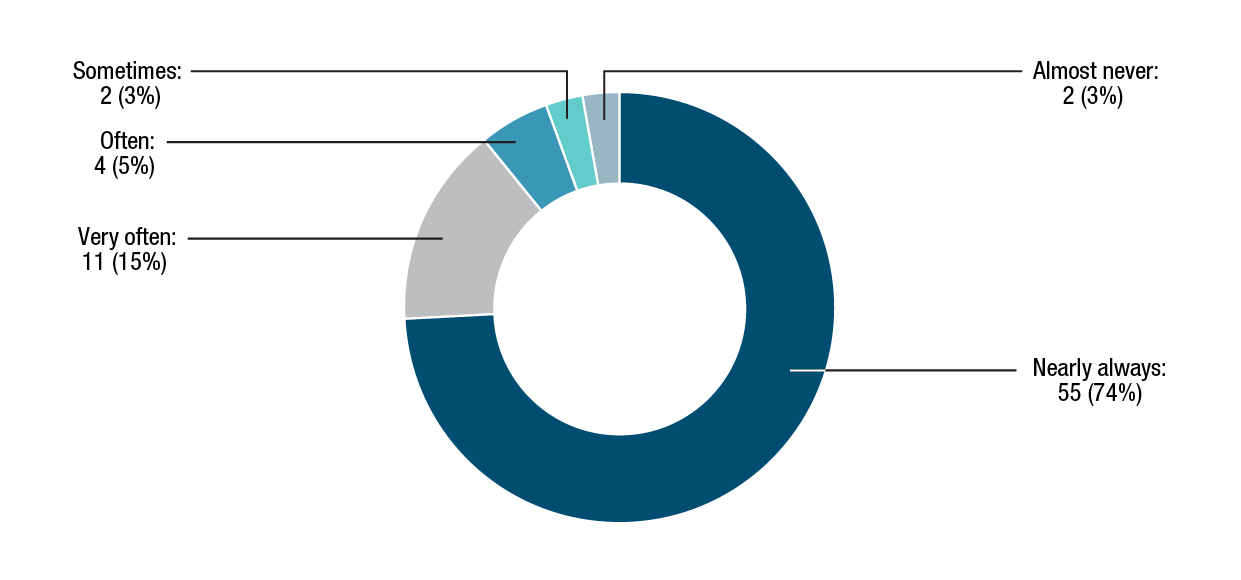
Figure 6 - Text version
Nearly always: 55 institutions, or 74%; very often: 11 institutions, or 15%; often: 4 institutions, or 5%; sometimes: 2 institutions, or 3%; almost never: 2 institutions, or 3%.
Personal and central services
Almost all institutions that submitted a review stated that personal and central services are nearly always (89%) or very often (7%) provided to employees in bilingual regions in the official language of their choice. This is nearly always the case for 93% of small institutions. Four of the five airport authorities where this applies stated that this is nearly always the case.
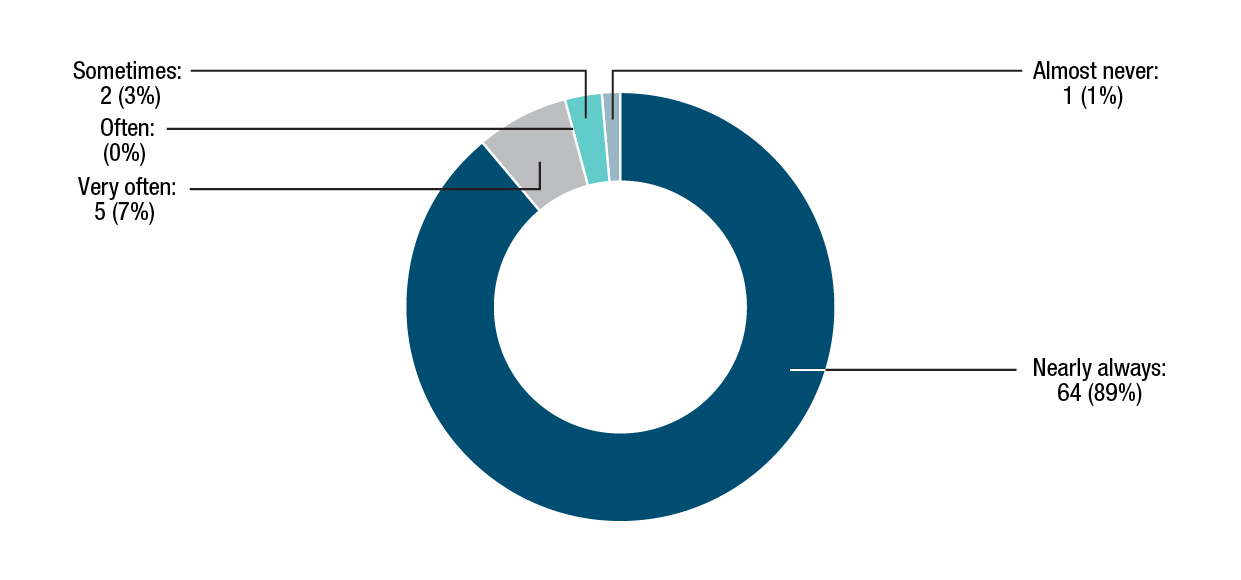
Figure 7 - Text version
Nearly always: 64 institutions, or 89%; very often: 5 institutions, or 7%; often: no institution, or 0%; sometimes: 2 institutions, or 3%; almost never: 1 institution, or 1%.
Training or professional development
Large and key institutions reported that employees nearly always (76%) or very often (21%) obtain training or professional development in the official language of their choice.
Documentation and work instruments
In a majority of these institutions, documentation and regularly and widely used work instruments and electronic systems are nearly always (87%) or very often (13%) available in the official language of employees’ choice.
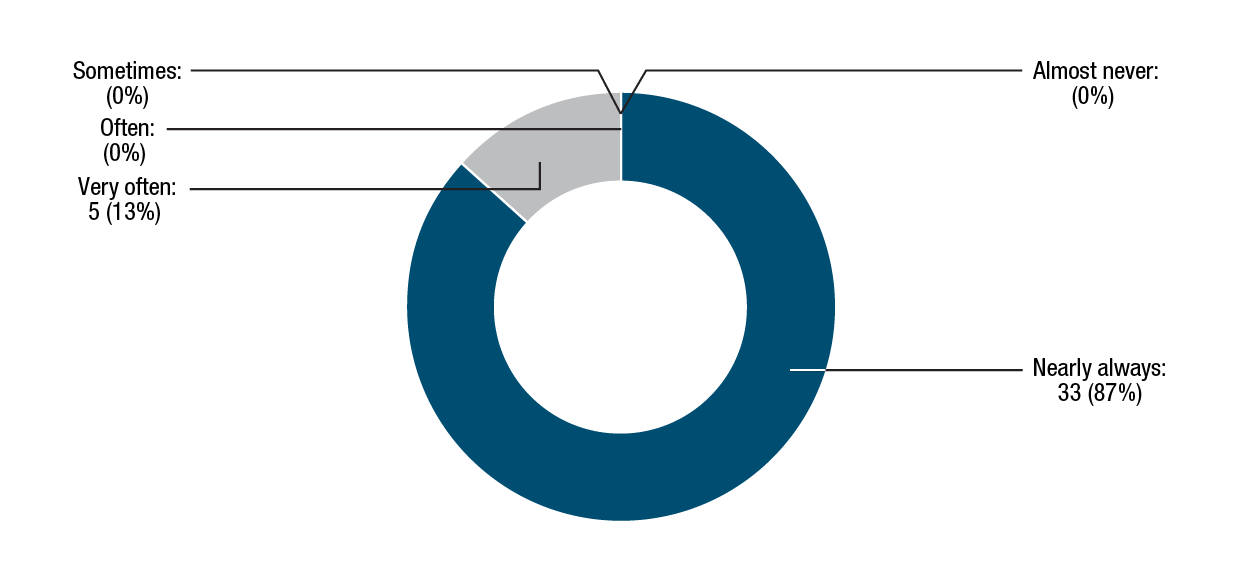
Figure 8 - Text version
Nearly always: 33 institutions, or 87%; very often: 5 institutions, or 13%; often: no institution, or 0%; sometimes: no institution, or 0%; almost never: no institution, or 0%.
Drafting documents
Among large and key institutions, 50% stated that employees can nearly always draft documents in the official language of their choice; 42% of them stated that they can very often do so.

Figure 9 - Text version
Nearly always: 19 institutions, or 50%; very often: 16 institutions, or 42%; often: 3 institutions, or 8%; sometimes: no institution, or 0%; almost never: no institution, or 0%.
Work instruments in unilingual regions
In unilingual regions, 82% of large and key institutions stated that regularly and widely used work instruments and electronic systems are nearly always available in both official languages for employees who provide bilingual services to the public or to employees in a bilingual region. This is often the case for 18% of these institutions. Four large and key institutions stated that this question did not apply to them.Footnote 14

Figure 10 - Text version
Nearly always: 28 institutions, or 82%; very often: 6 institutions, or 18%; often: no institution, or 0%; sometimes: no institution, or 0%; almost never: no institution, or 0%.
Several institutions said that they used the results of the 2014 Public Service Employee Survey in their reviews for fiscal year 2015 to 2016 to support their responses regarding language of work.
Human resources management (including equitable participation)
Part VI of the Official Languages Act provides for workforce participation rates of Anglophones and Francophones in the federal public service that generally align with their representation in the general population.
On March 31, 2016, the participation rate of Anglophones in all federal institutions subject to the act was 73.5%. The participation rate of Francophones was 26.5%. In the core public administration, the participation rate was 68.8% for Anglophones and 31.2% for Francophones.
According to data from the 2011 Census, 75% of the Canadian population have English as their first official language, and 23.2%, French. Based on a comparison of the workforce data and the most recent data from the 2011 Census, employees from both official language communities continue to be well represented in all federal institutions subject to the act. The participation rates of the two linguistic groups have remained relatively stable over the past five years.
Administrative measures for staffing
The institutions that submitted a review this fiscal year stated that administrative measures are nearly always (88%) or very often (8%) taken to ensure that bilingual positions are staffed appropriately so that services to the public and to employees can be offered in the official language of their choice, when required by Treasury Board policies. This is nearly always the case for 94% of small institutions, and very often the case for 3%. Ten airport authorities stated that they nearly always take such measures, and one stated that it very often does. Finally, three institutions, all of which are airport authorities, stated that the question did not apply to them.

Figure 11 - Text version
Nearly always: 73 institutions, or 88%; very often: 7 institutions, or 8%; often: 1 institution, or 1%; sometimes: 1 institution, or 1%; almost never: 1 institution, or 1%.
Establishing language requirements of bilingual positions
Almost all of the institutions stated that the language requirements of bilingual positions are nearly always (86%) or very often (11%) established objectively. Linguistic profiles reflect the duties of employees or their work units and take into account language obligations related to service to the public and language of work. Small institutions reported that for 90% of them, this is always the case; for 7% of them, it is very often the case. It is nearly always the case for airport authorities. Ten institutions (one large institution, two small institutions and seven airport authorities) indicated that the question did not apply to them.

Figure 12 - Text version
Nearly always: 65 institutions, or 86%; very often: 8 institutions, or 11%; often: 3 institutions, or 4%; sometimes: no institution, or 0%; almost never: no institution, or 0%.
Staffing bilingual positions
In all institutions where there are bilingual positions, these positions are nearly always (86%) or very often (10%) staffed by candidates who are bilingual at the time of appointment. This is nearly always the case for 87.5% of small institutions with bilingual positions and very often the case for 6% of them. It is nearly always the case for all airport authorities (100%). Seven institutions stated that the question did not apply to them.

Figure 13 - Text version
Nearly always: 68 institutions, or 86%; very often: 8 institutions, or 10%; often: 3 institutions, or 4%; sometimes: no institution, or 0%; almost never: no institution, or 0%.
Resources to meet language obligations
The 38 large and key institutions that submitted reviews stated that they nearly always (76%) or very often (16%) have the resources they need to meet their language obligations regarding service to the public and language of work.
To meet these obligations:
- half of these 38 institutions (50%) nearly always provide language training as part of their employees’ career development and nearly another third of them (29%) very often provide it
- 63% of them nearly always provide a work environment that allows employees returning from language training to use and improve their second language skills so that they can retain what they learned, and 16% of them very often provide it
Governance and monitoring
In the fiscal year running from 2015 to 2016, 71% of institutions with performance agreements have included performance objectives for implementing the various parts of the act. In the case of small institutions, the proportion is 57%. Five institutions indicated that this did not apply to them. Airport authorities did not have to answer this question.
For almost all of the large and key institutions, language obligations regularly (58%) or sometimes (37%) appear as items on senior management committee agendas, as needed.
In large and key institutions, the champion or co-champions and the persons responsible for Parts IV, V, VI and VII of the act meet regularly (89%) or sometimes (11%) to discuss the official languages file.
Thirty-seven out of the 38 large and key institutions have established an official languages committee, a network, or a working group made up of representatives from the different sectors or regional offices, which meets regularly (87%) or sometimes (11%) to deal horizontally with questions related to language obligations. Only one, the Privy Council Office, does not have such a committee.
Of all the institutions that submitted a review, 64 (91%) stated that they regularly take measures to ensure that employees are well aware of the obligations related to various parts of the act. Of all the small institutions, 88% stated that this was the case for them. Airport authorities did not have to answer this question.
Activities to measure availability and quality of services
Of all institutions, 84% conducted activities during the fiscal year to measure the availability and quality of services offered to the public in both official languages. The same percentage applies to large and key institutions. Among small institutions, this rate was 78%, and among airport authorities, it was 93%.
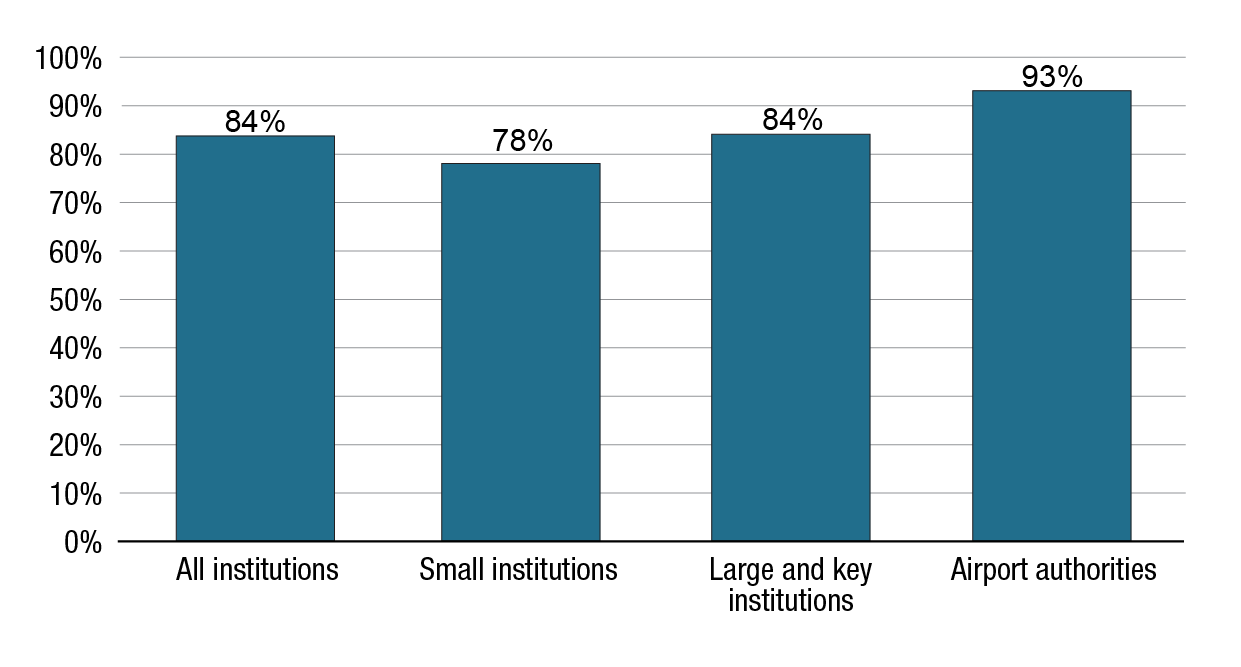
Figure 14 - Text version
All institutions: 84%; small institutions: 78%; large and key institutions: 84%; and airport authorities: 93%.
Activities to measure the use of official languages in the workplace
Seventy-nine per cent of all institutions, 72% of small institutions, and 84% of large and key institutions carried out activities to periodically measure whether employees can use the official language of their choice in the workplace in any region designated bilingual for the purposes of language of work. Airport authorities were not questioned about this.
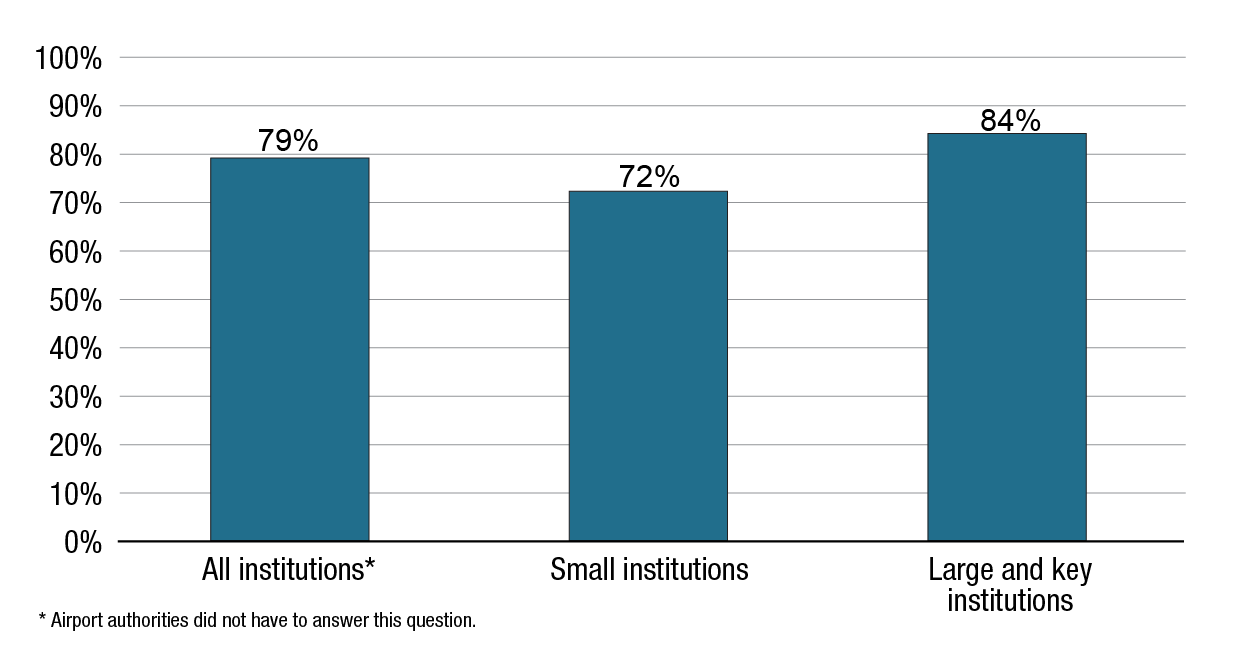
Figure 15 - Text version
All institutions: 79%; small institutions: 72%; and large and key institutions: 84%. Airport authorities did not have to answer this question.
Mechanisms to determine and document impact of decisions
More than three quarters (80%) of all institutions, 74% of small institutions, and 84% of large and key institutions indicated that they have mechanisms in place to determine whether their decisions have an impact on the implementation of the act, and to document their findings. Such decisions might have to do with adopting or revising a policy, creating or eliminating a program, or establishing or closing an office. Of the 65 institutions that submitted a review, 13 (including 7 small institutions) stated that they do not have such mechanisms, and 5 small institutions specified that this question did not apply to them.
Figure 16 - Text version
All institutions: 80%; small institutions: 74%; and large and key institutions: 84%. Airport authorities did not have to answer this question.
Audit or evaluation activities
Seventy-one per cent of institutions stated that audit or evaluation activities are undertaken by internal audit or other units to evaluate to what extent official language requirements are being implemented. In small institutions, the rate is 61%, and one of them stated that the question did not apply to it.
Shortcomings or deficiencies
When monitoring activities or mechanisms reveal shortcomings or deficiencies, almost all of the institutions (96%) stated that steps are taken and documented to improve or rectify the situation. This is the case for 91% of small institutions.
Figure 17 - Text version
All institutions: 96%; small institutions: 91%; and large and key institutions: 100%. Airport authorities did not have to answer this question.
Informing the deputy head
Of all institutions, 93% stated that their deputy head is informed of the results of monitoring activities. The rate is 84% for small institutions.
Figure 18 - Text version
All institutions: 93%; small institutions: 84%; and large and key institutions: 100%. Airport authorities did not have to answer this question.
Office of the Chief Human Resources Officer activities and follow-up
In fiscal year 2015 to 2016, the Office of the Chief Human Resources Officer (OCHRO) continued to provide horizontal support to federal institutions on key issues. To help institutions improve their outcomes in certain areas, OCHRO worked with them through the following:
- Clearspace, an external online platform (for example, information sharing, discussions)
- the activities of the departmental and Crown corporation advisory committees on official languages (for example, workshops, case studies, discussions)
- the Council of the Network of Official Languages Champions (for example, an annual conference, the Council’s regular meetings, and a best practices forum).
The topics that were discussed included the following:
- the role and responsibilities of persons responsible for official languages; institutions’ bilingual capacity; the availability of equivalent resources in both official languages (training, translation, software, documentation); the action plans on official languages
- identification of language requirements for positions and the bilingualism bonus, specifically for supervisory positions; staffing of bilingual positions; reclassification of positions; language of work; access to language training; second-language evaluations
- grievances; communications between administrative regions
- bilingual signature blocks; order of priority for official languages in digital postings and outside of Canada; translation of drafts, access to information requests, public tenders and documents containing a third language
- active offer; accessibility for visually impaired persons; publications on institutional websites, social media and Web 2.0; organizing public activities; signage, video productions, pictograms and emblems on uniforms and corporate identity
- grants and contributions, as well as reference tools for addressing official language requirements when drafting memorandums to Cabinet or Treasury Board submissions
OCHRO continued to support the departments’ and Crown corporations’ official languages advisory committees, which are made up of persons responsible for official languages, specifically by supporting the working group on language training and retention and the working group on active offer.
OCHRO was involved in developing the My GCHR (My Government of Canada Human Resources) portal, a new service-delivery model for human resources in the core public administration, to ensure the proper integration of official language requirements into the system. A working group made up of persons responsible for official languages and OCHRO representatives defined the business requirements so that portal functionalities better meet needs with respect to monitoring, data and alignment with Treasury Board policies.
OCHRO also contributed to various activities and initiatives led by the Council of the Network of Official Languages Champions (the Council) and the community of official languages champions, to help champions support deputy heads in implementing their official language obligations and in promoting official languages in their institutions.
For example, OCHRO took part in the Council’s working group on the 2014 Public Service Employee Survey, providing advice and more in-depth data analyses on the use of official languages. The analyses focused on the results for the six opinion questions on the use of official languages according to several demographic factors, such as respondents’ first official language, the linguistic designation of their position, their workplace, and their obligations with respect to language of service. The working group submitted its recommendations to the team responsible for the 2017 survey:
- keep the six questions relating to official languages
- give respondents who state that they have been the victim of discrimination on the job for a reason other than the 11 prohibited grounds of discrimination under the Canadian Human Rights Act the opportunity to specify the type of discrimination, such as language
On May 22, 2015, OCHRO worked with the Council of the Network of Champions and Canadian Heritage to hold a forum of language commissioners. The next day, it welcomed the Swiss federal delegate for plurilingualism, Nicoletta Mariolini, to discuss official languages policies and practices in Canada and Switzerland.
OCHRO also promoted the sharing of good practices by supporting the organization of the Best Practices Forum, which was held in Ottawa in December 2015 and brought together 180 participants. The format chosen for the forum, which was organized by the Council of the Network of Official Language Champions, was short promotional presentations on good practices that have been successful in an institution, so that others could adopt them.
For the first time, in February 2016, OCHRO offered, through web broadcasting in the form of a radio show, a session for human resources practitioners on identifying linguistic profiles and on staffing bilingual positions. OCHRO also worked with the Canada School of Public Service on updating the introductory course on official languages, the series on official languages and the course entitled “Language of Work: Knowing One’s Rights and Responsibilities and Maintaining One’s Skills,” which are now all available online.
These activities, as well as discussions and dialogues in the official languages community through the Clearspace platform, promoted the sharing of good practices and contributed to improved results and a better understanding of official languages obligations. This platform makes it possible to reach the community of persons responsible for official languages quickly and efficiently. As of March 31, 2016, it had enabled 388 discussions and the sharing of 108 documents among the 272 members of the community since its inception.
In January 2016, the Commissioner of Official Languages tabled the final report on the audit of the Treasury Board of Canada Secretariat within the context of the 2011–2012 Strategic and Operating Review, which revealed some weaknesses regarding compliance with Part VII of the Official Languages Act. The Office of the Chief Human Resources Officer, within the Treasury Board of Canada Secretariat (TBS-OCHRO), believes that, during this review, it provided explicit guidance on the responsibility of federal institutions to consider the impact of savings proposals on official language minority communities. TBS-OCHRO consulted and engaged with Canadian Heritage to seek feedback on the effectiveness of the Secretariat’s guidance on conducting impact assessments related to proposals. TBS-OCHRO indicated that it would revise its guidance, if warranted, to ensure that it disseminates the relevant information to federal institutions early in the process, during expenditure review exercises. As of December 2015, TBS-OCHRO had modified its action plan on official languages to reflect its intention to continue the good practices noted in the audit report during future expenditure reviews. TBS-OCHRO worked on developing an official languages accountability framework, which it submitted to its senior management in March 2016 and posted on its intranet site for all of its employees. The framework clarifies its obligations, the roles and responsibilities of various sectors and individuals, and the coordination mechanisms in place within the Secretariat.
TBS-OCHRO began the process of renewing the Policy on Official Languages and the related policy instruments. It also developed a logic model specific to the Policy. This process will continue through the next year. It is part of the Secretariat’s efforts to streamline the Treasury Board policy suite by offering incentives and rules that clearly define responsibilities and that are easy to find and understand.
Finally, the Assistant Deputy Minister, Governance Planning and Policy, OCHRO, and the Executive Director of the Official Languages Centre of Excellence appeared before the House of Commons Standing Committee on Official Languages on March 7, 2016, to answer members’ questions on the Roadmap for Canada’s Official Languages. They largely addressed the legislative framework governing official languages, specifically in the public service, as well as performance evaluation, the bilingualism bonus, the reviews submitted by institutions, the Public Service Employee Survey, the use of social media by institutions and their compliance with policies.
Conclusion and trends
Large and small institutions that are subject to the Official Languages Act indicated in their reviews that they are determined to fully comply with their obligations under the act and the regulations, and to implement all the requirements of the Policy on Official Languages. Again this year, there are more bilingual public servants than incumbents of bilingual positions, and more incumbents who meet the linguistic requirements of their position than in the previous year. This is true even though more positions require a higher level of oral interaction in the other official language.
The federal public service is therefore becoming more and more bilingual. Managers and supervisors can ensure that language skills remain valued at work and are used every day to foster a workplace that is conducive to the use of both official languages in regions that are designated bilingual. The possibility to become bilingual, to improve one’s skills in the other official language, and in turn to better understand and serve all Canadians, must be a selling point, an incentive to bring people into the federal public service.
The Canada School of Public Service is offering more language training courses online, including a course on employees’ language rights, which public servants can take at their own pace and at no cost.
Bilingualism is a core value of the federal public service and the country. The public service is tasked with embodying this value in its practices and culture. As a follow-up to a research-action roundtable that he chaired as associate deputy minister of Canadian Heritage in 2003, the Clerk of the Privy Council asked two deputy heads, in the fall of 2016, to develop a plan on how to improve the use of official languages in the workplace. This project has started a dialogue, created momentum and aims to determine how to stimulate real change around the use of official languages in the workplace. Through consultations with federal public servants, ideas are being sought on how to make the work environment more conducive to the use of both official languages. TBS-OCHRO, through the Official Languages Centre of Excellence, is supporting the work on this project.
Another key initiative is the review of the Official Languages (Communications with and Services to the Public) Regulations. The regulations were adopted in 1991 and have not been comprehensively reviewed since. The composition of the Canadian population has changed, and so have government services and programs. The regulatory review launched on November 17, 2016, is part of the commitment to ensure that all federal services are delivered in full compliance with the Official Languages Act. The review will mainly seek to:
- develop an improved approach to the current calculation method that will better reflect the needs and interests of minority language communities, reflect current demographics and respond to changing demographics in the future
- explore opportunities presented by new technologies to improve service delivery in both official languages
- improve bilingual services in the area of transportation
By using an approach that is sensitive to demographic changes and leveraging new technologies, the Government of Canada will maintain and enhance access to bilingual services in full compliance with the Official Languages Act.
Appendix A: Federal institutions required to submit a review for fiscal year 2015 to 2016
Eighty-six federal institutions submitted a review for fiscal year 2015 to 2016. The distinction between small and large or key institutions was based on size and mandate in relation to official languages. Large and key institutions were required to respond to a longer questionnaire. In general, small institutions are those with fewer than 500 employees. This year, airport authorities were also invited to submit a review on official languages.
Large and key institutions
- Agriculture and Agri-Food Canada
- Air Canada
- Atlantic Canada Opportunities Agency
- Canada Border Services Agency
- Canada Mortgage and Housing Corporation
- Canada Revenue Agency
- Canada School of Public Service
- Canada Post
- Canadian Air Transport Security Authority
- Canadian Food Inspection Agency
- Canadian HeritageFootnote 15
- Canadian Space Agency
- Correctional Service Canada
- Department of Finance Canada
- Department of Justice Canada
- Employment and Social Development Canada
- Environment and Climate Change Canada
- Fisheries and Oceans Canada
- Global Affairs Canada
- Health Canada
- Immigration, Refugees and Citizenship Canada
- Indigenous and Northern Affairs Canada
- Innovation, Science and Economic Development Canada
- Library and Archives Canada
- National Defence
- National Research Council Canada
- NAV Canada
- Natural Resources Canada
- Public Prosecution Service of Canada
- Public Safety Canada
- Public Service Commission of Canada
- Public Services and Procurement Canada
- Privy Council Office
- Royal Canadian Mounted Police
- Shared Services Canada
- Transport Canada
- Treasury Board of Canada Secretariat
- Veterans Affairs Canada
- VIA Rail Canada Inc.
Small institutions
- Canada Council for the Arts
- Canada Economic Development for Quebec Regions
- Canadian Environmental Assessment Agency
- Canadian Museum for Human Rights
- Canadian Museum of Immigration at Pier 21
- Canadian Race Relations Foundation
- Canadian Security Intelligence Service
- Canadian Transportation Agency
- Civilian Review and Complaints Commission for the RCMP
- Copyright Board Canada
- Destination Canada
- Great Lakes Pilotage Authority Canada
- Infrastructure Canada
- Military Grievance External Review Committee
- Montreal Port Authority
- National Capital Commission
- National Film Board
- National Gallery of Canada
- Office of the Commissioner for Federal Judicial Affairs Canada
- Office of the Commissioner of Official Languages
- Office of the Public Sector Integrity Commissioner of Canada
- Sciences and Engineering Research Canada
- Social Sciences and Humanities Research Council of Canada
- St. Lawrence Seaway Management Corporation
- Status of Women Canada
- Supreme Court of Canada
- Telefilm Canada
- The Correctional Investigator Canada
- Toronto Port Authority
- Trois-Rivières Port Authority
- Western Economic Diversification Canada
Airport authorities
- Calgary Airport Authority
- Edmonton Regional Airports Authority
- Greater Fredericton Airport Authority Inc.
- Greater Moncton Airport Authority Inc.
- Greater Toronto Airports Authority
- Halifax International Airport Authority
- Montreal Airports
- Ottawa Macdonald-Cartier International Airport Authority
- Quebec Airport Inc.
- Regina Airport Authority
- Saint John Airport Inc.
- Saskatoon Airport Authority
- St. John’s International Airport Authority
- Vancouver International Airport Authority
- Victoria Airport Authority
- Winnipeg Airports Authority
Only one federal institution, the Blue Water Bridge Authority, did not submit a review for fiscal year 2015 to 2016. It was amalgamated with the Federal Bridge Corporation Limited, an institution that was not required to submit a review this year.
Appendix B: Sources of statistical data
There are three main sources of statistical data in Appendix D:
- Burolis is the official inventory of offices that indicates whether they have an obligation to communicate with the public in both official languages.
- The Position and Classification Information System (PCIS) covers the positions and employees of institutions that are part of the core public administration.
- The Official Languages Information System II (OLIS II) provides information on the resources held by institutions that are not part of the core public administration (in other words, Crown corporations and separate agencies).
The reference date for the data in the statistical tables is the same for the data systems: March 31, 2016, for the PCIS and Burolis, as well as for OLIS II.
One institution, Canadian Forces Morale and Welfare Services, was unable to provide complete information on the allocation of their resources serving the public in English or French for all of their offices designated bilingual. The Vancouver International Airport Authority provided no data on this subject.
Notes
Percentages in the tables in Appendix D may not add up to 100% due to rounding.
The data in this report that pertain to positions in the core public administration are compiled from the Position and Classification Information System.
Pursuant to the Public Service Official Languages Exclusion Approval Order, incumbents may not meet the language requirements of their position for two reasons:
- They are exempt
or - They have two years to meet the language requirements
The linguistic profile of a bilingual position is based on three levels of second language proficiency:
- Level A: Minimum proficiency
- Level B: Intermediate proficiency
- Level C: Superior proficiency
Appendix C: Definitions
“Position” means a position filled for an indeterminate period or a determinate period of three months or more, according to the information in the Position and Classification Information System.
“Resources” refers to the resources required to meet obligations on a regular basis, according to the information available in the Official Languages Information System II. Resources can consist of a combination of full-time and part-time employees as well as contract resources. Some cases involve automated functions, hence the need to use the term “resources” in this report.
“Bilingual position” is a position in which all or part of the duties must be performed in both English and French.
“Reversible” or “either/or position” is a position in which all the duties can be performed in English or French, depending on the employee’s preference.
“Incomplete record” means a position for which data on language requirements is incorrect or missing.
“Linguistic capacity outside Canada” refers to all rotational positions outside Canada (for example, rotational employees) that are staffed from a pool of employees with similar skills. Most of these positions are with Global Affairs Canada.
In statistical tables 5, 7, 10 and 12 in Appendix D, the levels required in second language proficiency refer only to oral interaction (understanding and speaking). The “Other” category refers to positions either requiring code P (specialized proficiency) or not requiring any second language oral interaction skills.
The terms “Anglophone” and “Francophone” refer to employees on the basis of their first official language. The first official language is the language declared by the employee as the one with which he or she has a primary personal identification.
Appendix D: Statistical tables
Table 1
Bilingual positions and pool of bilingual employees in the core public administration
From fiscal year 2014 to 2015 to fiscal year 2015 to 2016, the percentages of bilingual positions and bilingual employees in the core public administration decreased slightly to 43% and 45%, respectively.
Table 1 - Text version
| Year | Bilingual positions | Superior proficiency | Intermediate proficiency | Minimum proficiency | Total bilingual employees |
|---|---|---|---|---|---|
| 1978 | 25% | 6% | 11% | 4% | 21% |
| 2000 | 33% | 21% | 11% | 3% | 35% |
| 2015 | 43% | 29% | 14% | 2% | 46% |
| 2016 | 43% | 28% | 14% | 2% | 45% |
Table 2
Linguistic requirements of positions in the core public administration
From fiscal year 2014 to 2015 to fiscal year 2015 to 2016, the number and proportion of bilingual positions in the core public administration declined slightly, although the total number of positions increased again.
| Year | Bilingual positions | English essential positions | French essential positions | English or French essential positions | Incomplete records | Total positions | |||||
|---|---|---|---|---|---|---|---|---|---|---|---|
| 1978 | 52,300 | 24.7% | 128,196 | 60.5% | 17,260 | 8.1% | 14,129 | 6.7% | 0 | 0.0% | 211,885 |
| 2000 | 50,535 | 35.3% | 75,552 | 52.8% | 8,355 | 5.8% | 7,132 | 5.0% | 1,478 | 1.0% | 143,052 |
| 2015 | 78,748 | 43.3% | 90,298 | 49.7% | 6,485 | 3.6% | 5,908 | 3.2% | 427 | 0.2% | 181,866 |
| 2016 | 78,709 | 43.2% | 90,822 | 49.9% | 6,441 | 3.5% | 5,916 | 3.2% | 222 | 0.1% | 182,110 |
Table 3
Linguistic requirements of positions in the core public administration, by province, territory or region
Of the 182,110 positions in the core public administration in fiscal year 2015 to 2016, a total of 78,709 positions were bilingual. Most of the bilingual positions were in the National Capital Region (68%), Quebec (excluding the NCR) (67.2%) and New Brunswick (53.7%).
| Unilingual positions | |||||||||||
|---|---|---|---|---|---|---|---|---|---|---|---|
| Province, territory or region | Bilingual positions | English essential | French essential | English or French essential | Incomplete records | Total positions | |||||
| British Columbia | 492 | 3.1% | 15,599 | 96.7% | 1 | 0.0% | 32 | 0.2% | 5 | 0.0% | 16,129 |
| Alberta | 388 | 4.1% | 9,139 | 95.5% | 2 | 0.0% | 33 | 0.3% | 5 | 0.1% | 9,567 |
| Saskatchewan | 139 | 3.1% | 4,400 | 96.7% | 4 | 0.1% | 6 | 0.1% | 0 | 0.0% | 4,549 |
| Manitoba | 509 | 7.9% | 5,935 | 91.8% | 0 | 0.0% | 19 | 0.3% | 5 | 0.1% | 6,468 |
| Ontario (excluding the NCR) | 2,576 | 10.9% | 20,961 | 88.4% | 8 | 0.0% | 140 | 0.6% | 22 | 0.1% | 23,707 |
| National Capital Region (NCR) | 54,704 | 68.0% | 20,124 | 25.0% | 157 | 0.2% | 5,411 | 6.7% | 79 | 0.1% | 80,475 |
| Quebec (excluding the NCR) | 13,415 | 67.2% | 150 | 0.8% | 6,224 | 31.2% | 151 | 0.8% | 15 | 0.1% | 19,955 |
| New Brunswick | 3,569 | 53.7% | 2,976 | 44.7% | 28 | 0.4% | 73 | 1.1% | 6 | 0.1% | 6,652 |
| Prince Edward Island | 458 | 29.3% | 1,104 | 70.6% | 1 | 0.1% | 1 | 0.1% | 0 | 0.0% | 1,564 |
| Nova Scotia | 924 | 11.7% | 6,873 | 86.7% | 15 | 0.2% | 36 | 0.5% | 82 | 1.0% | 7,930 |
| Newfoundland and Labrador | 94 | 3.3% | 2,724 | 96.4% | 0 | 0.0% | 7 | 0.2% | 0 | 0.0% | 2,825 |
| Yukon | 18 | 6.6% | 255 | 93.1% | 0 | 0.0% | 1 | 0.4% | 0 | 0.0% | 274 |
| Northwest Territories | 12 | 3.2% | 368 | 96.8% | 0 | 0.0% | 0 | 0.0% | 0 | 0.0% | 380 |
| Nunavut | 13 | 5.9% | 206 | 92.8% | 0 | 0.0% | 3 | 1.4% | 0 | 0.0% | 222 |
| Outside Canada | 1,398 | 98.9% | 8 | 0.6% | 1 | 0.1% | 3 | 0.2% | 3 | 0.2% | 1,413 |
| Total | 78,709 | 43.2% | 90,822 | 49.9% | 6,441 | 3.5% | 5,916 | 3.2% | 222 | 0.1% | 182,110 |
Table 4
Bilingual positions in the core public administration and linguistic status of incumbents
Employees in bilingual positions in the core public administration continued to meet the linguistic requirements of their positions.
| Employees do not meet requirements | |||||||||
|---|---|---|---|---|---|---|---|---|---|
| Year | Employees meet requirements | Exempted | Must meet | Incomplete records | Total employees | ||||
| 1978 | 36,446 | 69.7% | 14,462 | 27.7% | 1,392 | 2.7% | 0 | 0.0% | 52,300 |
| 2000 | 41,832 | 82.8% | 5,030 | 10.0% | 968 | 1.9% | 2,705 | 5.4% | 50,535 |
| 2015 | 75,172 | 95.5% | 2,909 | 3.7% | 141 | 0.2% | 526 | 0.7% | 78,748 |
| 2016 | 75,200 | 95.5% | 2,780 | 3.5% | 143 | 0.2% | 586 | 0.7% | 78,709 |
Table 5
Bilingual positions in the core public administration and level of second-language proficiency required (oral interaction)
The percentage of bilingual positions in the core public administration that require Level C proficiency for oral interaction has increased by 0.7% since fiscal year 2014 to 2015.
| Year | Level C | Level B | Level A | Other | Total positions | ||||
|---|---|---|---|---|---|---|---|---|---|
| 1978 | 3,771 | 7.2% | 30,983 | 59.2% | 13,816 | 26.4% | 3,730 | 7.1% | 52,300 |
| 2000 | 12,836 | 25.4% | 34,677 | 68.6% | 1,085 | 2.1% | 1,937 | 3.8% | 50,535 |
| 2015 | 26,434 | 33.6% | 50,407 | 64.0% | 534 | 0.7% | 1,373 | 1.7% | 78,748 |
| 2016 | 27,008 | 34.3% | 49,977 | 63.5% | 414 | 0.5% | 1,310 | 1.7% | 78,709 |
Table 6
Service to the public: Bilingual positions in the core public administration and linguistic status of incumbents
From fiscal year 2014 to 2015 to fiscal year 2015 to 2016, the percentage of employees in the core public administration who provided services to the public and who met the linguistic requirements of their positions remained stable. This is an indication that institutions have the necessary capacity to serve the public in both official languages.
| Employees do not meet requirements | |||||||||
|---|---|---|---|---|---|---|---|---|---|
| Year | Employees meet requirements | Exempted | Must meet | Incomplete records | Total employees | ||||
| 1978 | 20,888 | 70.4% | 8,016 | 27.0% | 756 | 2.5% | 0 | 0.0% | 29,660 |
| 2000 | 26,766 | 82.3% | 3,429 | 10.5% | 690 | 2.1% | 1,631 | 5.0% | 32,516 |
| 2015 | 42,087 | 95.7% | 1,517 | 3.4% | 78 | 0.2% | 303 | 0.7% | 43,985 |
| 2016 | 41,382 | 95.7% | 1,457 | 3.4% | 75 | 0.2% | 333 | 0.8% | 43,247 |
Table 7
Service to the public: Bilingual positions in the core public administration and level of second language proficiency required (oral interaction)
Although the number of positions in the core public administration has decreased since fiscal year 2013 to 2014, the percentage of bilingual positions offering services to the public and requiring Level C proficiency for oral interaction increased to 39.4% in fiscal year 2015 to 2016.
| Year | Level C | Level B | Level A | Other | Total positions | ||||
|---|---|---|---|---|---|---|---|---|---|
| 1978 | 2,491 | 8.4% | 19,353 | 65.2% | 7,201 | 24.3% | 615 | 2.1% | 29,660 |
| 2000 | 9,088 | 27.9% | 22,421 | 69.0% | 587 | 1.8% | 420 | 1.3% | 32,516 |
| 2015 | 16,904 | 38.4% | 26,754 | 60.8% | 247 | 0.6% | 80 | 0.2% | 43,985 |
| 2016 | 17,022 | 39.4% | 26,002 | 60.1% | 158 | 0.4% | 65 | 0.2% | 43,247 |
Table 8
Service to the public: Positions in the core public administration and linguistic status of incumbents, by region
Of the 99,771 positions in the core public administration that offer services to the public, 43,247 positions offered services in both English and French; 41,382 of the 43,247 employees occupying bilingual positions met the language requirements of their positions.
| Bilingual positions | Unilingual positions | |||||||
|---|---|---|---|---|---|---|---|---|
| Province, territory or region | Employees do not meet requirements | English essential | French essential | English or French essential | Total employees | |||
| Employees meet requirements | Exempted | Must meet | Incomplete records | |||||
| Western and Northern Canada | 1,118 | 51 | 3 | 50 | 24,006 | 6 | 38 | 25,272 |
| Ontario (excluding the NCR) | 1,644 | 72 | 2 | 55 | 13,285 | 1 | 32 | 15,091 |
| National Capital Region (NCR) | 25,051 | 761 | 61 | 119 | 6,686 | 63 | 1,450 | 34,191 |
| Quebec (excluding the NCR) | 8,989 | 211 | 2 | 73 | 49 | 3,838 | 53 | 13,215 |
| New Brunswick | 2,605 | 105 | 6 | 17 | 1,710 | 14 | 8 | 4,465 |
| Other Atlantic provinces | 881 | 62 | 1 | 8 | 5,257 | 9 | 14 | 6,232 |
| Outside Canada | 1,094 | 195 | 0 | 11 | 4 | 0 | 1 | 1,305 |
| All regions | 41,382 | 1,457 | 75 | 333 | 50,997 | 3,931 | 1,596 | 99,771 |
Table 9
Personal and central services: Bilingual positions in the core public administration and linguistic status of incumbents
In fiscal year 2015 to 2016, 95.6% of the 55,235 employees who occupy positions in the core public administration that offer personal and central services met the linguistic requirements of their positions. This result is stable in comparison with the result for fiscal year 2014 to 2015.
| Employees do not meet requirements | |||||||||
|---|---|---|---|---|---|---|---|---|---|
| Year | Employees meet requirements | Exempted | Must meet | Incomplete records | Total employees | ||||
| 2014 | 53,486 | 95.7% | 1,924 | 3.4% | 114 | 0.2% | 379 | 0.7% | 55,903 |
| 2015 | 52,843 | 95.5% | 2,033 | 3.7% | 82 | 0.1% | 356 | 0.6% | 55,314 |
| 2016 | 52,797 | 95.6% | 1,966 | 3.6% | 83 | 0.2% | 389 | 0.7% | 55,235 |
Table 10
Personal and central services: Bilingual positions in the core public administration and level of second-language proficiency required (oral interaction)
In fiscal year 2015 to 2016, 35.2% of the 55,235 positions in the core public administration that offer personal and central services required Level C proficiency in oral interaction, which is an increase of 0.6% from fiscal year 2014 to 2015.
| Year | Level C | Level B | Level A | Other | Total positions | ||||
|---|---|---|---|---|---|---|---|---|---|
| 2014 | 19,085 | 34.1% | 35,472 | 63.5% | 248 | 0.4% | 1,098 | 2.0% | 55,903 |
| 2015 | 19,115 | 34.6% | 34,969 | 63.2% | 225 | 0.4% | 1,005 | 1.8% | 55,314 |
| 2016 | 19,437 | 35.2% | 34,671 | 62.8% | 197 | 0.4% | 930 | 1.7% | 55,235 |
Table 11
Supervision: Bilingual positions in the core public administration and linguistic status of incumbents
In fiscal year 2015 to 2016, 95.4% of incumbents in the core public administration’s 22,780 bilingual supervisory positions met the linguistic requirements of their positions.
| Employees do not meet requirements | |||||||||
|---|---|---|---|---|---|---|---|---|---|
| Year | Employees meet requirements | Exempted | Must meet | Incomplete records | Total employees | ||||
| Note: This table excludes employees working outside Canada. | |||||||||
| 2014 | 21,584 | 95.6% | 774 | 3.4% | 83 | 0.4% | 132 | 0.6% | 22,573 |
| 2015 | 21,474 | 95.1% | 906 | 4.0% | 80 | 0.4% | 127 | 0.6% | 22,587 |
| 2016 | 21,724 | 95.4% | 821 | 3.6% | 81 | 0.4% | 154 | 0.7% | 22,780 |
Table 12
Supervision: Bilingual positions in the core public administration and level of second-language proficiency required (oral interaction)
In fiscal year 2015 to 2016, 55.9% of the core public administration’s 22,780 bilingual supervisory positions required Level C proficiency in oral interaction, which is an increase of 1.2% from fiscal year 2014 to 2015.
| Year | Level C | Level B | Level A | Other | Total positions | ||||
|---|---|---|---|---|---|---|---|---|---|
| Note: This table excludes employees working outside Canada. | |||||||||
| 2014 | 12,085 | 53.5% | 10,408 | 46.1% | 40 | 0.2% | 40 | 0.2% | 22,573 |
| 2015 | 12,354 | 54.7% | 10,153 | 45.0% | 39 | 0.2% | 41 | 0.2% | 22,587 |
| 2016 | 12,734 | 55.9% | 9,987 | 43.8% | 31 | 0.1% | 28 | 0.1% | 22,780 |
Table 13
Participation of Anglophones and Francophones in the core public administration, by province, territory or region
In fiscal year 2015 to 2016, Newfoundland and Labrador had the highest percentage of Anglophones (98.6%) and Quebec (excluding the NCR) had the highest percentage of Francophones (90.3%) working in the core public administration. These results are similar to those for fiscal year 2014 to 2015.
| Province, territory or region | Anglophones | Francophones | Unknown | Total employees | |||
|---|---|---|---|---|---|---|---|
| British Columbia | 15,840 | 98.2% | 289 | 1.8% | 0 | 0.0% | 16,129 |
| Alberta | 9,284 | 97.0% | 283 | 3.0% | 0 | 0.0% | 9,567 |
| Saskatchewan | 4,473 | 98.3% | 76 | 1.7% | 0 | 0.0% | 4,549 |
| Manitoba | 6,211 | 96.0% | 257 | 4.0% | 0 | 0.0% | 6,468 |
| Ontario (excluding the NCR) | 22,436 | 94.6% | 1,270 | 5.4% | 1 | 0.0% | 23,707 |
| National Capital Region (NCR) | 47,946 | 59.6% | 32,528 | 40.4% | 1 | 0.0% | 80,475 |
| Quebec (excluding the NCR) | 1,943 | 9.7% | 18,012 | 90.3% | 0 | 0.0% | 19,955 |
| New Brunswick | 3,749 | 56.4% | 2,903 | 43.6% | 0 | 0.0% | 6,652 |
| Prince Edward Island | 1,391 | 88.9% | 173 | 11.1% | 0 | 0.0% | 1,564 |
| Nova Scotia | 7,419 | 93.6% | 511 | 6.4% | 0 | 0.0% | 7,930 |
| Newfoundland and Labrador | 2,785 | 98.6% | 40 | 1.4% | 0 | 0.0% | 2,825 |
| Yukon | 264 | 96.4% | 10 | 3.6% | 0 | 0.0% | 274 |
| Northwest Territories | 362 | 95.3% | 18 | 4.7% | 0 | 0.0% | 380 |
| Nunavut | 196 | 88.3% | 26 | 11.7% | 0 | 0.0% | 222 |
| Outside Canada | 971 | 68.7% | 442 | 31.3% | 0 | 0.0% | 1,413 |
| All regions | 125,270 | 68.8% | 56,838 | 31.2% | 2 | 0.0% | 182,110 |
Table 14
Participation of Anglophones and Francophones in the core public administration, by occupational category
In fiscal year 2015 to 2016, the Operations category had the highest percentage of Anglophones (78.7%) working in the core public administration, and the Administration and Foreign Service category had the highest percentage of Francophones (38.2%). These results are similar to those for fiscal year 2014 to 2015.
| Category | Anglophones | Francophones | Unknown | Total employees | |||
|---|---|---|---|---|---|---|---|
| Management (EX) | 3,406 | 67.1% | 1,667 | 32.9 % | 0 | 0.0% | 5,073 |
| Scientific and Professional | 24,171 | 74.6% | 8,242 | 25.4 % | 0 | 0.0% | 32,413 |
| Administration and Foreign Service | 51,133 | 61.8% | 31,651 | 38.2 % | 1 | 0.0% | 82,785 |
| Technical | 9,640 | 76.8% | 2,915 | 23.2 % | 0 | 0.0% | 12,555 |
| Administrative Support | 13,834 | 69.4% | 6,104 | 30.6 % | 1 | 0.0% | 19,939 |
| Operations | 23,086 | 78.7% | 6,259 | 21.3 % | 0 | 0.0% | 29,345 |
| All categories | 125,270 | 68.8% | 56,838 | 31.2 % | 2 | 0.0% | 182,110 |
Table 15
Service to the public: Number of resources serving the public, by region or method of delivery, in bilingual offices in institutions not part of the core public administration
In fiscal year 2015 to 2016, there were 80,625 resources offering services to the public at offices in institutions not part of the core public administration; 27,369 of these resources provided services in both English and French.
| Province, territory or region | English only resources | French only resources | Bilingual resources | Total resources |
|---|---|---|---|---|
| Western and Northern Canada | 22,733 | 6 | 2,048 | 24,787 |
| Ontario (excluding the NCR) | 13,011 | 34 | 1,836 | 14,881 |
| National Capital Region (NCR) | 4,479 | 1,746 | 7,167 | 13,392 |
| Quebec (excluding the NCR) | 90 | 1,852 | 9,464 | 11,406 |
| New Brunswick | 616 | 107 | 1,553 | 2,276 |
| Other Atlantic provinces | 4,034 | 7 | 873 | 4,914 |
| Outside Canada | 213 | 0 | 58 | 271 |
| Travel | 3,898 | 0 | 3,394 | 7,292 |
| Telephone | 430 | 0 | 976 | 1,406 |
| All regions | 49,504 | 3,752 | 27,369 | 80,625 |
Table 16
Participation of Anglophones and Francophones in institutions not part of the core public administration, by province, territory or region
In fiscal year 2015 to 2016, Newfoundland and Labrador had the highest percentage of Anglophones (97.7%) working in institutions that are not part of the core public administration, and Quebec (excluding the NCR) had the highest percentage of Francophones (81.1%). These results are similar to those for fiscal year 2014 to 2015.
| Province, territory or region | Anglophones | Francophones | Unknown | Total resources | |||
|---|---|---|---|---|---|---|---|
| British Columbia | 32,818 | 96.0% | 1,350 | 3.9% | 10 | 0.0% | 34,178 |
| Alberta | 26,449 | 94.6% | 1,511 | 5.4% | 4 | 0.0% | 27,964 |
| Saskatchewan | 7,346 | 96.2% | 289 | 3.8% | 1 | 0.0% | 7,636 |
| Manitoba | 13,831 | 94.8% | 756 | 5.2% | 0 | 0.0% | 14,587 |
| Ontario (excluding the NCR) | 71,218 | 92.3% | 5,904 | 7.7% | 13 | 0.0% | 77,135 |
| National Capital Region (NCR) | 30,724 | 69.1% | 13,727 | 30.9% | 7 | 0.0% | 44,458 |
| Quebec (excluding the NCR) | 9,274 | 18.9% | 39,820 | 81.1% | 2 | 0.0% | 49,096 |
| New Brunswick | 7,089 | 72.8% | 2,650 | 27.2% | 0 | 0.0% | 9,739 |
| Prince Edward Island | 1,861 | 94.8% | 102 | 5.2% | 0 | 0.0% | 1,963 |
| Nova Scotia | 13,415 | 91.6% | 1,227 | 8.4% | 2 | 0.0% | 14,644 |
| Newfoundland and Labrador | 4,992 | 97.7% | 118 | 2.3% | 0 | 0.0% | 5,110 |
| Yukon | 358 | 92.5% | 29 | 7.5% | 0 | 0.0% | 387 |
| Northwest Territories | 597 | 89.0% | 74 | 11.0% | 0 | 0.0% | 671 |
| Nunavut | 216 | 86.1% | 35 | 13.9% | 0 | 0.0% | 251 |
| Outside Canada | 1,261 | 81.3% | 291 | 18.8% | 0 | 0.0% | 1,552 |
| All regions | 221,449 | 76.5% | 67,883 | 23.5% | 39 | 0.0% | 289,371 |
Table 17
Participation of Anglophones and Francophones in institutions not part of the core public administration, by occupational category or equivalent category
In fiscal year 2015 to 2016, the Operations category had the highest percentage of Anglophones (80.3%) and the Professionals category had the highest percentage of Francophones (27.5%) working in institutions that are not part of the core public administration. These results are similar to those for fiscal year 2014 to 2015.
| Category | Anglophones | Francophones | Unknown | Total resources | |||
|---|---|---|---|---|---|---|---|
| Management | 10,217 | 72.8% | 3,469 | 24.7% | 347 | 2.5% | 14,033 |
| Professionals | 26,281 | 72.4% | 9,995 | 27.5% | 6 | 0.0% | 36,282 |
| Specialists and Technicians | 17,855 | 74.8% | 5,998 | 25.1% | 4 | 0.0% | 23,857 |
| Administrative Support | 29,768 | 75.4% | 9,694 | 24.6% | 2 | 0.0% | 39,464 |
| Operations | 73,244 | 80.3% | 17,972 | 19.7% | 15 | 0.0% | 91,231 |
| Canadian Forces and Regular Members of the Royal Canadian Mounted Police | 61,828 | 75.4% | 20,166 | 24.6% | 9 | 0.0% | 82,003 |
| Others | 389 | 50.0% | 292 | 37.5% | 97 | 12.5% | 778 |
| All categories | 219,582 | 76.3% | 67,586 | 23.5% | 480 | 0.2% | 287,648 |
Table 18
Participation of Anglophones and Francophones in all federal institutions subject to the Official Languages Act, by province, territory or region
In fiscal year 2015 to 2016, Newfoundland and Labrador had the highest percentage of Anglophones (98.0%) and Quebec (excluding the NCR) had the highest percentage of Francophones (83.8%) working in all institutions subject to the Official Languages Act. These results are similar to those for fiscal year 2014 to 2015.
| Province, territory or region | Anglophones | Francophones | Unknown | Total | |||
|---|---|---|---|---|---|---|---|
| British Columbia | 48,658 | 96.7% | 1,639 | 3.3% | 10 | 0.0% | 50,307 |
| Alberta | 35,733 | 95.2% | 1,794 | 4.8% | 4 | 0.0% | 37,531 |
| Saskatchewan | 11,819 | 97.0% | 365 | 3.0% | 1 | 0.0% | 12,185 |
| Manitoba | 20,042 | 95.2% | 1,013 | 4.8% | 0 | 0.0% | 21,055 |
| Ontario (excluding the NCR) | 93,654 | 92.9% | 7,174 | 7.1% | 14 | 0.0% | 100,842 |
| National Capital Region (NCR) | 78,670 | 63.0% | 46,255 | 37.0% | 8 | 0.0% | 124,933 |
| Quebec (excluding the NCR) | 11,217 | 16.2% | 57,832 | 83.8% | 2 | 0.0% | 69,051 |
| New Brunswick | 10,838 | 66.1% | 5,553 | 33.9% | 0 | 0.0% | 16,391 |
| Prince Edward Island | 3,252 | 92.2% | 275 | 7.8% | 0 | 0.0% | 3,527 |
| Nova Scotia | 20,834 | 92.3% | 1,738 | 7.7% | 2 | 0.0% | 22,574 |
| Newfoundland and Labrador | 7,777 | 98.0% | 158 | 2.0% | 0 | 0.0% | 7,935 |
| Yukon | 622 | 94.1% | 39 | 5.9% | 0 | 0.0% | 661 |
| Northwest Territories | 959 | 91.2% | 92 | 8.8% | 0 | 0.0% | 1,051 |
| Nunavut | 412 | 87.1% | 61 | 12.9% | 0 | 0.0% | 473 |
| Outside Canada | 2,232 | 75.3% | 733 | 24.7% | 0 | 0.0% | 2,965 |
| All regions | 346,719 | 73.5% | 124,721 | 26.5% | 41 | 0.0% | 471,481 |
Page details
- Date modified: