
Supporting information on lower-level programs
Official title: Employment and Social Development Canada 2015–2016 Departmental Performance Report
Supporting information on lower-level programs is available on the Employment and Social Development Canada website.
On this page
- Program: Service Network Supporting Government Departments
- Program: Delivery of Services for Other Government of Canada Programs
- Program: Skills and Employment
- Sub-Program: Employment Insurance
- Sub-Program: Labour Market Development Agreements
- Sub-Program: Canada Job Fund Agreements
- Sub-Program: Labour Market Agreements for Persons with Disabilities
- Sub-Program: Opportunities Fund for Persons with Disabilities
- Sub-Program: Youth Employment Strategy
- Sub-Program: Targeted Initiative for Older Workers
- Sub-Program: Enabling Fund for Official Language Minority Communities
- Sub-Program: Aboriginal Skills and Employment Training Strategy
- Sub-Program: Skills and Partnership Fund
- Sub-Program: First Nations Job Fund
- Sub-Program: Job Bank
- Sub-Program: Sectoral Initiatives Program
- Sub-Program: Literacy and Essential Skills
- Sub-Program: Skilled Trades and Apprenticeship (Red Seal Program)
- Sub-Program: Apprenticeship Grants
- Sub-Program: Foreign Credential Recognition Program
- Sub-Program: Temporary Foreign Worker Program
- Program: Learning
- Program: Labour
- Program: Income Security
- Program: Social Development
- Sub-Program: Homelessness Partnering Strategy
- Sub-Program: Social Development Partnerships Program
- Sub-Sub-Program: Children and Families
- Sub-Sub-Program: Disability
- Sub-Program: New Horizons for Seniors Program
- Sub-Program: Universal Child Care Benefit
- Sub-Program: Enabling Accessibility Fund
- Sub-Program: Federal Income Support for Parents of Murdered or Missing Children
Program: Service Network Supporting Government Departments
Sub-Program: Government of Canada Telephone General Enquiries Services
Sub-Program: Government of Canada Telephone General Enquiries Services Description
Government of Canada telephone general enquiries services support Canadians through 1 800 O-Canada as well as its customized information services. 1 800 O-Canada provides a single point of contact for all Canadians to access quick, up-to-date government information over the phone. It acts as the first point of contact for general information on all Government of Canada programs, services and initiatives; it supports key government priorities and messaging including those outlined in the Budget and Speech from the Throne; and it supports the Government’s communication needs in crisis situations. Customized Information Services provide support to Canadians on behalf of Government of Canada programs and services that require a service delivery partner to meet their communication needs, which can include ongoing requirements, targeted campaigns and temporary needs in crisis situations. Canadians who require specialized or client-specific information on programs are connected or are directed to appropriate online resources, program call centres or in person resources.
Sub-Program: Government of Canada Telephone General Enquiries Services Budgetary Financial Resources (dollars)
| 2015–16 Planned Spending | 2015–16 Actual Spending | 2015–16 Difference (actual minus planned) |
|---|---|---|
| 19,451,397 | 19,227,051 | (224,346) |
Sub-Program: Government of Canada Telephone General Enquiries Services Human Resources (full-time equivalents – FTEs)
| 2015–16 Planned | 2015–16 Actual | 2015–16 Difference (actual minus planned) |
|---|---|---|
| 23 | 22 | (1) |
Sub-Program: Government of Canada Telephone General Enquiries ServicesPerformance Results
| Expected Result | Performance Indicators | Targets | Actual and Historical Results |
|---|---|---|---|
| Canadians have easy, fast and convenient access to up-to-date government information over the phone as a first point of contact for general information on all Government of Canada programs, services and initiatives | Percentage of general enquiry calls answered by a 1 800 O-Canada agent within 18 seconds Source: administrative data |
85% | Actual Result: Historical Results: |
1 800 O-Canada information completeness, relevancy and accuracy assessment Source: administrative data |
85% | Actual Result: |
Sub-Program: Government of Canada Internet Presence
Sub-Program: Government of Canada Internet Presence Description
The Government of Canada Internet presence supports Canadians by providing easy, fast and convenient access to information and services online. Through Service Canada, ESDC is the principal publisher for a single Government of Canada website, Canada.ca. The site provides an enhanced user experience; citizen-centric, theme-based content; and a common and enhanced Government of Canada search. Canadians can locate detailed information on the programs and services offered through ESDC, as well as general information on all Government of Canada programs and services. Through Service Canada, ESDC also provides a simple and secure online access for Canadians to bring together a number of services and allow clients to, among other things, view and update their personal information and transact securely with ESDC.
Sub-Program: Government of Canada Internet Presence Budgetary Financial Resources (dollars)*
| 2015–16 Planned Spending | 2015–16 Actual Spending | 2015–16 Difference (actual minus planned) |
|---|---|---|
| 16,665,198 | 14,394,069 | (2,271,129) |
*The difference is mainly attributable to delays in the investment projects supporting this program.
Sub-Program: Government of Canada Internet Presence Human Resources (full-time equivalents – FTEs)
| 2015–16 Planned | 2015–16 Actual | 2015–16 Difference (actual minus planned) |
|---|---|---|
| 117 | 113 | (4) |
Sub-Program: Government of Canada Internet Presence Performance Results
| Expected Results | Performance Indicators | Targets | Actual and Historical Results |
|---|---|---|---|
| Canadians have easy, fast and convenient access to information and services online |
Percentage usability rating for Canada.ca Source: administrative data |
Baseline year | Actual Result: |
| Canadians have easy, fast and convenient access to information and services on a secure online portal when needed | Percentage usability rating for the Service Canada secure online portal Source: administrative data |
Baseline year | Actual Result: |
*Different measures for this indicator were piloted for baseline this fiscal year. The pilots enabled the development of measures that will be used in this coming year, but the data from the pilots was not valid for reporting purposes this fiscal year.
Sub-Program: In-Person Points of Service
Sub-Program: In-Person Points of Service Description
In-person points of service support the delivery of services and information for the Government of Canada. They provide information on how to self-serve; client authentication and identification; and services for clients who require one-on-one assistance. Canadians who require specialized or client-specific information for programs like Employment Insurance, the Canada Pension Plan or Old Age Security are directed to appropriate online resources and program call centres. Canadians have access to in-person points of service within reasonable distances from where they live through Service Canada Centres and scheduled outreach locations.
Sub-Program: In-Person Points of Service Budgetary Financial Resources (dollars)*
| 2015–16 Planned Spending | 2015–16 Actual Spending | 2015–16 Difference (actual minus planned) |
|---|---|---|
| 27,083,404 | 21,944,914 | (5,138,490) |
*This sub-program includes planned amounts for which expenditures are presented under other programs. This sub-program excludes amounts related to Employment Insurance, Old Age Security, Canada Pension Plan and Canada Pension Plan Disability Benefits which are presented under their respective programs (2.1.1, 4.1.1, 4.1.2 and 4.1.3).
Sub-Program: In-Person Points of Service Human Resources (full-time equivalents – FTEs*)
| 2015–16 Planned | 2015–16 Actual | 2015–16 Difference (actual minus planned) |
|---|---|---|
| 350 | 264 | (86) |
*This sub-program includes planned FTEs for which expenditures are presented under other programs. This sub-program excludes FTEs related to Employment Insurance, Old Age Security, Canada Pension Plan and Canada Pension Plan Disability Benefits which are presented under their respective programs (2.1.1, 4.1.1, 4.1.2 and 4.1.3).
Sub-Program: In-Person Points of Service Performance Results
| Expected Result | Performance Indicators | Targets | Actual and Historical Results |
|---|---|---|---|
| Canadians have access to program information and in-person services and have opportunities to self-serve | Percentage of clients served in person who received assistance within 25 minutes Source: administrative data |
80% | Actual Result: Historical Results: |
Program: Delivery of Services for Other Government of Canada Programs
Sub-Program: Passport
Sub-Program: Passport Description
Through Service Canada, ESDC delivers the Passport program on behalf of Citizenship and Immigration Canada. Service Canada is the provider of domestic passport service delivery within Canada through all service delivery channels. Service delivery includes provision of information, intake of applications, validation of identity, production of passports and their distribution to eligible applicants, on time and error-free.
Sub-Program: Passport Budgetary Financial Resources (dollars)*
| 2015–16 Planned Spending | 2015–16 Actual Spending | 2015–16 Difference (actual minus planned) |
|---|---|---|
| 157,636,259 | 130,634,082 | (27,002,177) |
*With the transfer of responsibility for the delivery of passport services to ESDC, the service was provided within dedicated resources. The difference is mainly due to the contingency reserve that was created for unexpected circumstances and not used. The unused funds remain in the non-lapsing Passport Revolving Fund.
Sub-Program: Passport Human Resources (full-time equivalents – FTEs*)
| 2015–16 Planned | 2015–16 Actual | 2015–16 Difference (actual minus planned) |
|---|---|---|
| 2,265 | 1,949 | (316) |
*With the transfer of responsibility for the delivery of passport services to ESDC, the service was provided within dedicated FTEs. The difference is mainly due to the contingency reserve that was created for unexpected circumstances and not used. The unused FTEs remain in the non-lapsing Passport Revolving Fund.
Sub-Program: Passport Performance Results
| Expected Result | Performance Indicators | Targets | Actual and Historical Results |
|---|---|---|---|
| Canadians can obtain a passport within Canada in a timely manner | Percentage of travel documents and other passport services processed within standards Source: administrative data |
90% | Actual Result: Historical Result: |
*Service Canada was able to perform substantially above target levels, resulting in better service to Canadians. The target is set in consultation with Immigration, Refugees and Citizenship Canada as a minimum operational standard. The importance of this measure to the overall quality of service, however, means that Service Canada makes every effort to exceed the target.
Sub-Program: Other Government Department Programs
Sub-Program: Other Government Department Programs Description
Services provided on behalf of other Government of Canada programs include: assistance to Canadians; provision of basic and detailed program and service information; application intake and review for completeness; client authentication and validation of identity documents; quick and direct access to specialized agents within other government departments; and provision of space in the service delivery network for other departments.
Sub-Program: Other Government Department Programs Budgetary Financial Resources (dollars)
| 2015–16 Planned Spending | 2015–16 Actual Spending | 2015–16 Difference (actual minus planned) |
|---|---|---|
| 2,388,334 | 2,805,972 | 417,638 |
Sub-Program: Other Government Department Programs Human Resources (full-time equivalents – FTEs)
| 2015–16 Planned | 2015–16 Actual | 2015–16 Difference (actual minus planned) |
|---|---|---|
| 21 | 28 | 7 |
Sub-Program: Other Government Department Programs Performance Results
| Expected Result | Performance Indicators | Targets | Actual and Historical Results |
|---|---|---|---|
| Canadians can access programs and services delivered on behalf of other Government of Canada departments | Number of in-person service requests on behalf of other Government of Canada departments Source: administrative data |
Baseline year | Actual Result: |
Percentage of in-person transactions that meet client department expectations as set out in service level agreements Source: administrative data |
Baseline year | Actual Result: |
*This indicator was included on the assumption that new agreements between Service Canada and other stakeholder departments would be formalized this fiscal year. Given that no new agreements have been signed this year, it is not possible to calculate a valid result for this measure at this time.
Program: Skills and Employment
Sub-Program: Employment Insurance
Sub-Program: Employment InsuranceDescription
The Employment Insurance (EI) program provides temporary financial assistance to unemployed workers while they look for employment or upgrade their skills. It is also provided to those who take time off work due to specific life events (illness, pregnancy, to care for a newborn or adopted child or to care for a family member who is gravely ill with a significant risk of death). As of January 1, 2011, self-employed workers may also receive this income support under special benefits. Unemployed individuals receive EI benefits if they have contributed to the program by paying premiums in the past year and meet qualifying and entitlement conditions. This program is governed by Part I of the Employment Insurance Act and associated Regulations. The Canada Employment Insurance Commission monitors and assists the Department in managing the program. Service Canada’s delivery of EI benefits involves answering program queries through specialized call centres, the Internet and at in-person points of service; collecting and processing applications and issuing payments; monitoring of claims for accuracy; administering requests for reconsideration of a decision; client authentication and identification; and preventing, detecting and deterring fraud and abuse. Complementary activities conducted under the authority of Part II of the Employment Insurance Act and delivered by provincial, territorial and other partners are captured under 2.1.2 Labour Market Development Agreements. This program is funded through Part I of the Employment Insurance Act.
Sub-Program: Employment Insurance Performance Analysis and Lessons Learned
The EI program continued to provide temporary financial assistance to workers who are in an adjustment situation. The proportion of regular EI claimants who did not exhaust all their weeks of benefits was 65.3 percent in 2014–15, which is similar to the previous year.
In addition, the proportion of regular EI claimants receiving benefits who are not frequent claimants was 77.3 percent in 2014–15, compared to 76.6 percent in 2013–14. Frequent claimants are defined as individuals who have had three or more claims for EI regular or fishing benefits, and who had collected more than 60 weeks of EI regular or fishing benefits, in the past five years.
Through EI special benefits, the EI program also continued to play an important role in supporting employees and self-employed individuals who were pregnant and caring for a newborn or newly adopted child. EI claimants who received both maternity and parental benefits used 94.2 percent of the 50 weeks of maternity and parental benefits available to them on average in 2014–15, a proportion similar to that of the previous year. For additional information, please refer to Chapter II of the 2014/2015 Employment Insurance Monitoring and Assessment Report.
In 2015–16, the Department worked to deliver on Government commitments to Canadians through the EI program, including eliminating the EI eligibility requirements that restrict access to the EI program for workers who were entering or re-entering the labour market, commonly referred to as new entrants and re-entrants (NEREs), and introducing a new EI Working While on Claim pilot project. The Department also monitored the economic situation in regions across Canada due to the downturn in the commodities sector. In Budget 2016, the Government announced early actions to improve the EI program including that additional weeks of EI regular benefits will be available for one year in 15* regions that were most affected by the downturn in the commodities sector.
In addition, the Department continued to work on the review of EI boundaries. The boundary review process is a multi-step process that analyzes and compares labour markets across the country. Based on this review, the Government will determine whether the current EI economic regions continue to reflect regional labour market characteristics. The current review of the EI regional boundaries was initiated on September 11, 2013.
Finally, the Department monitored the results of the Connecting Canadians to Available Jobs Initiative. In Budget 2016, the Government announced the reversal of the 2012 changes made to the EI program that specify the type of jobs that unemployed workers are expected to search for and accept.
*Budget 2016 announced 12 regions and 3 additional regions were announced in May 2016.
Sub-Program: Employment Insurance Budgetary Financial Resources (dollars)*
| 2015–16 Planned Spending | 2015–16 Actual Spending | 2015–16 Difference (actual minus planned) |
|---|---|---|
| 16,758,435,835 | 18,113,086,366 | 1,354,650,531 |
*EI benefit payments were higher than forecasted largely due to increased unemployment.
Sub-Program: Employment Insurance Human Resources (full-time equivalents – FTEs*)
| 2015–16 Planned | 2015–16 Actual | 2015–16 Difference (actual minus planned) |
|---|---|---|
| 6,242 | 7,354 | 1,112 |
*The difference in FTEs is mainly due to more employees dedicated to handle increased intake of EI claims.
Sub-Program: Employment Insurance Performance Results
| Expected Results | Performance Indicators | Targets | Actual and Historical Results |
|---|---|---|---|
| Workers in an adjustment situation have access to temporary financial assistance | Proportion of regular Employment Insurance claimants who do not exhaust all their weeks of benefits Source: Employment Insurance administrative data |
75% | Actual Result: Historical Results: |
Proportion of regular Employment Insurance claimants who receive benefits and are not frequent claimants Source: Employment Insurance administrative data |
75% | Actual Result: Historical Results: |
|
Proportion of the 50 weeks of Employment Insurance maternity and parental benefits used by parents of newborns Source: Employment Insurance administrative data |
90% | Actual Result: Historical Results: |
|
| Clients are accurately identified for the purpose of receiving the appropriate service or benefit for Social Insurance Number-based programs | Accuracy rate for legitimate Social Insurance Numbers in the Social Insurance Register Source: administrative data |
99.9% | Actual Result: Historical Results: |
| Eligible Canadians receive a Social Insurance Number in a timely manner | Percentage of Social Insurance Numbers issued in one in-person visit (based on complete applications with all supporting documentation) Source: administrative data |
90% | Actual Result: Historical Results: |
| Employment Insurance applicants receive a benefit payment or a non-payment notification in a timely manner | Percentage of Employment Insurance benefit payments or non-payment notifications issued within 28 days of filing Source: administrative data |
80% | Actual Result: Historical Results: |
| Clients making requests for reconsideration of Employment Insurance decisions receive a reconsideration decision in a timely manner | Percentage of request for reconsideration decisions finalized within 30 days from the request being received Source: administrative data |
70% | Actual Result: Historical Results: |
| Eligible Employment Insurance applicants receive a benefit payment in the right amount | Percentage of payment accuracy of Employment Insurance (12-month moving average) Source: administrative data |
95% | Actual Result: Historical Results: |
| Canadians have access to Employment Insurance information through specialized call centres | Percentage of specialized calls answered by an Employment Insurance agent within 10 minutes Source: administrative data |
80% | Actual Result: Historical Result: |
*There is a time lag in the availability of EI data for the reporting year 2015–16.
**This slightly lower rate is due in part to shorter EI entitlement, on average, in Canada resulting from improving regional unemployment rates in some regions.
***The most significant impact on the result was due to an unexpected increased intake of requests in western Canada, which is largely attributable to economic instability in the oil and gas industry. A number of measures have been implemented as part of an overall workload reduction/performance improvement plan.
****2014–15 results published in the 2014–15 Departmental Performance Report were revised from 95.3% to 95.5%. This rate was based on the fact that a few errors identified through the EI Payment Accuracy Review (PAAR) reviews were still considered to be “potential” errors. Once these outstanding issues were reviewed, the accuracy rate increased to 95.5%.
*****Overall, the service level results are largely attributed to call volumes exceeding the call handling capacity and increases in the complexity of calls, resulting in a longer average call handling time. While the EI Call Centre network did not meet the established target, agents did resolve approximately 87% of calls at the first point of contact. With the Budget 2016 announcement to invest $73 million over two years to improve access to EI Call Centres, it is expected that by March 2017, the accessibility and Service Level of EI Call Centres will significantly improve.
Sub-Program: Labour Market Development Agreements
Sub-Program: Labour Market Development AgreementsDescription
Labour Market Development Agreements are established under Part II of the Employment Insurance Act to help unemployed Canadians find and return to work and to develop a skilled labour force that meets the needs of employers. These agreements provide program and administration funding to provinces and territories annually for them to design and deliver employment benefits and support measures. Employment benefits provide Employment Insurance (EI)-eligible participants with benefits such as skills development, self-employment and wage subsidies, while employment services are available to all unemployed individuals in Canada. Complementary activities conducted under the authority of Part I of the Employment Insurance Act provide EI benefits to eligible individuals. This program is funded through Part II of the Employment Insurance Act.
Sub-Program: Labour Market Development AgreementsPerformance Analysis and Lessons Learned
Performance analyses for Labour Market Development Agreements (LMDAs) are published annually in the EI Monitoring and Assessment Report once the data are complete and verified with provinces and territories. Please refer to Chapter 3 of the EI Monitoring and Assessment Report available on the Employment and Social Development Canada website.
ESDC continues to monitor, assess and report on the performance of Employment Benefits and Support Measures (EBSMs). Performance indicators include “active clients served,” “return to employment” and “unpaid benefits.” LMDA evaluations are developed with provinces and territories, and results demonstrate the effectiveness of the LMDAs and overall positive outcomes for participants. Generally, participating in EBSMs resulted in improving the participants’ employment situation: increased employment earnings, gains in incidence of employment, as well as reduced use of EI benefits. LMDA incremental impacts compare well with those of similar programs internationally.
Additionally, the Department advanced amended information sharing agreements to the LMDAs and improved data systems to support more efficient information sharing and targeting of EI clients. In 2015–16, the Province of British Columbia signed an amended LMDA information sharing agreement and launched a pilot project to provide early intervention to recently unemployed clients.
Sub-Program: Labour Market Development AgreementsBudgetary Financial Resources (dollars)
| 2015–16 Planned Spending | 2015–16 Actual Spending | 2015–16 Difference (actual minus planned) |
|---|---|---|
| 2,145,648,192 | 2,145,374,628 | (273,564) |
Sub-Program: Labour Market Development AgreementsHuman Resources (full-time equivalents – FTEs)
| 2015–16 Planned | 2015–16 Actual | 2015–16 Difference (actual minus planned) |
|---|---|---|
| 43 | 39 | (4) |
Sub-Program: Labour Market Development AgreementsPerformance Results
| Expected Result | Performance Indicators | Targets | Actual and Historical Results |
|---|---|---|---|
| Through Labour Market Development Agreements, provinces and territories provide Employment Insurance-eligible clients with unemployment benefits and all unemployed Canadians with employment services | Number of insured clients employed following an employment program benefit or service intervention Source: Employment Insurance Monitoring and Assessment Report |
Provinces and territories set targets** | Actual Result: Historical Results: |
Proportion of insured clients who are employed following the completion of their benefit or service intervention* Source: Employment Insurance Monitoring and Assessment Report |
Provinces and territories set targets** | Actual Result: Historical Results: |
*Updated results are based on the most recent data published in the 2014–15 EI Monitoring and Assessment Report.
**Provinces and territories have jurisdiction over setting performance targets for programming funded under Labour Market Development Agreements.
Sub-Program: Canada Job Fund Agreements
Sub-Program: Canada Job Fund AgreementsDescription
The Canada Job Fund Agreements ensure direct employer involvement in training decisions and increase private-sector investment in the skills training system. The Government of Canada transfers funds to provinces and territories for them to deliver programs and services that aim to increase labour force participation and help Canadians develop the skills necessary to find and keep a job. This program consists of three streams: the Canada Job Grant to encourage greater employer involvement and investment in training by providing financial assistance to employers on a cost-shared basis in order to help Canadians develop the skills needed for available jobs; employer-sponsored training to support employer involvement in and contribution to demand-driven training programs and incentives; and employment services and supports to enhance labour market participation of Canadians, with priority given to the unemployed ineligible for Employment Insurance benefits and to low-skilled employed workers. A separate six-year agreement was signed with Quebec that does not include the delivery of the Canada Job Grant, recognizing that the core principles behind the Canada Job Grant are already embedded in Quebec’s training system. Quebec’s new agreement, however, includes a commitment to strengthened reporting and accountability. These agreements complement other provincial and territorial employment and skills training programs funded by the Government of Canada, for example, under the Labour Market Development Agreements and the Labour Market Agreements for Persons with Disabilities, and the Targeted Initiative for Older Workers. This program uses funding from the following transfer payment: Canada Job Fund Agreements.
Sub-Program: Canada Job Fund Agreements Performance Analysis and Lessons Learned
The Year Two Review of the Canada Job Grant (CJG) was undertaken. Key findings included that the CJG is generally meeting the needs of employers, flexibility is critical to ensuring labour market needs are met, and there are some administrative challenges. In total, over 37,000 participants benefitted from training under the CJG supported by over 5,000 employers in the first year (2014–15).
Sub-Program: Canada Job Fund Agreements Budgetary Financial Resources (dollars)
| 2015–16 Planned Spending | 2015–16 Actual Spending | 2015–16 Difference (actual minus planned) |
|---|---|---|
| 501,938,416 | 501,710,970 | (227,446) |
Sub-Program: Canada Job Fund Agreements Human Resources (full-time equivalents – FTEs)
| 2015–16 Planned | 2015–16 Actual | 2015–16 Difference (actual minus planned) |
|---|---|---|
| 17 | 14 | (3) |
Sub-Program: Canada Job Fund Agreements Performance Results
| Expected Result | Performance Indicators | Targets | Actual and Historical Results |
|---|---|---|---|
| Increase labour market participation of Canadians through funding for provincial/ territorial programs that aim to help them develop the skills necessary to find and keep a job, and increase employer involvement/investment in skills training | Number of participants benefiting from programs covered under the Canada Job Fund Source: administrative data |
Baseline year | Actual Result: Historical Result: |
Average employer contribution to the Canada Job Grant in a given year Source: administrative data |
Baseline year | Actual Result: Historical Result: |
|
Change in employment status of participants benefiting from programs covered under the Canada Job Fund Source: administrative data |
Baseline year | Actual Result: Historical Result: |
*Provincial/Territorial reporting is due in fall 2016.
**Based on reporting from a majority of provinces and territories.
Sub-Program: Labour Market Agreements for Persons with Disabilities
Sub-Program: Labour Market Agreements for Persons with Disabilities Description
In recognition of the barriers faced by persons with disabilities in the labour market, the Labour Market Agreements for Persons with Disabilities are designed to improve employment outcomes for persons with disabilities by enhancing their employability, increasing employment opportunities and demonstrating the best possible results for Canadians. This program transfers funds to provinces and territories under bilateral agreements (covering 50 percent of eligible costs, to a predetermined maximum) for programs and services. Provinces and territories agree to match the federal amount. As the needs of persons with disabilities may differ between jurisdictions, provinces and territories have flexibility to determine the design and delivery of programming in the following five priority areas: education and training; employment participation; employment opportunities; connecting employers and persons with disabilities; and building knowledge. These programs and services for persons with disabilities complement other provincial and territorial employment and skills training programs funded by the Government of Canada (e.g. Labour Market Development Agreements and the Opportunities Fund for Persons with Disabilities). This program uses funding from the following transfer payment: Labour Market Agreement for Persons with Disabilities.
Sub-Program: Labour Market Agreements for Persons with Disabilities Performance Analysis and Lessons Learned
Provinces and territories are responsible for reporting on outcomes for programs funded through the Labour Market Agreements for Persons with Disabilities (LMAPDs). Provincial and territorial annual reports containing this information for 2014–15 are available online.
Under the new generation of LMAPDs, provinces and territories have agreed to report on 10 new performance indicators. A one-year transition period (2014–15) was permitted for jurisdictions to phase-in reporting requirements with the expectation that full reporting would be available in the 2015–16 annual reports (unless a specific exception is jointly agreed to by the Government of Canada and the province or territory).
Sub-Program: Labour Market Agreements for Persons with Disabilities Budgetary Financial Resources (dollars)
| 2015–16 Planned Spending | 2015–16 Actual Spending | 2015–16 Difference (actual minus planned) |
|---|---|---|
| 222,904,863 | 222,786,942 | (117,921) |
Sub-Program: Labour Market Agreements for Persons with Disabilities Human Resources (full-time equivalents – FTEs)
| 2015–16 Planned | 2015–16 Actual | 2015–16 Difference (actual minus planned) |
|---|---|---|
| 8 | 7 | (1) |
Sub-Program: Labour Market Agreements for Persons with Disabilities Performance Results
| Expected Result | Performance Indicators | Targets | Actual and Historical Results |
|---|---|---|---|
| Improve employment outcomes for persons with disabilities by enhancing their employability, increasing employment opportunities and demonstrating the best possible results for Canadians | Number of provinces and territories with agreements in place Source: administrative data |
13 | Actual Result: Historical Result: |
Number of clients served Source: administrative data |
Baseline year (due to program changes) | Actual Result: Historical Result: |
*There is a one-year time lag in data availability.
**Number of clients served is taken from provincial and territorial annual reports for 2014–15 that have been made available to date. ESDC is currently waiting for confirmation from two remaining jurisdictions of the number of clients served. Additionally, in some cases, individual clients who have been served by more than one program funded through the LMAPD in a jurisdiction may have been counted more than once in the total.
Sub-Program: Opportunities Fund for Persons with Disabilities
Sub-Program: Opportunities Fund for Persons with Disabilities Description
The Opportunities Fund for Persons with Disabilities assists persons with disabilities to prepare for, obtain and maintain employment. It supports persons with disabilities in overcoming barriers to participation in the Canadian labour market, and it supports employers to hire persons with disabilities. This program supports a wide range of programs and services, including job search supports, skills development, wage subsidies and employer awareness initiatives to encourage employers to hire persons with disabilities. The Opportunities Fund is delivered across the country by Service Canada Centres, in partnership with organizations in the community. This program uses funding from the following transfer payment: Opportunities Fund for Persons with Disabilities.
Sub-Program: Opportunities Fund for Persons with DisabilitiesPerformance Analysis and Lessons Learned
Budget 2013 announced a permanent increase of $10 million per year in funding for the Opportunities Fund (OF) starting in 2015–16. It also announced that the OF would be reformed to provide more demand-driven training solutions for persons with disabilities and make it more responsive to the labour market needs.
As a result, the OF served more Canadians in 2015–16 than in the previous year. The number of clients served has increased to 4,509 in 2015–16 from 3,473 in 2014–15. The number of clients who found employment and returned to school after the intervention also increased, with the number of clients employed after their intervention rising from 1,455 to 1,950 and the number returning to school increasing from 192 in 2014–15 to 289 in 2015–16.
In 2015–16, the OF did not meet the target for the number of participants with enhanced employability given unforeseen delays due to the federal election. Despite these delays, the number of participants with enhanced employability increased to 3,133 in 2015–16 from 3,075 in 2014–15.
Sub-Program: Opportunities Fund for Persons with Disabilities Budgetary Financial Resources (dollars)*
| 2015–16 Planned Spending | 2015–16 Actual Spending | 2015–16 Difference (actual minus planned) |
|---|---|---|
| 49,704,737 | 39,680,765 | (10,023,972) |
*In fiscal year 2015–16, there were some delays in approving and implementing projects due to the federal election.
Sub-Program: Opportunities Fund for Persons with Disabilities Human Resources (full-time equivalents – FTEs)
| 2015–16 Planned | 2015–16 Actual | 2015–16 Difference (actual minus planned) |
|---|---|---|
| 62 | 51 | (11) |
Sub-Program: Opportunities Fund for Persons with Disabilities Performance Results
| Expected Result | Performance Indicators | Targets | Actual and Historical Results |
|---|---|---|---|
| Persons with disabilities have enhanced their employability, obtained employment, become self-employed or returned to school | Number of clients with enhanced employability Source: administrative data |
4,700 | Actual Result: Historical Results: |
Number of clients employed or self-employed Source: administrative data |
2,000 | Actual Result: Historical Result: |
*In fiscal year 2015–16, there were some delays implementing projects due to the federal election.
Sub-Program: Youth Employment Strategy
Sub-Program: Youth Employment Strategy Description
The Youth Employment Strategy (YES) helps youth aged 15 to 30 gain the skills, career information and work experience they need to find and maintain employment. YES is an ESDC-led horizontal initiative involving 10 other federal departments and agencies that assist youth in making a successful transition into today’s changing labour market. YES has three program streams—Skills Link, Career Focus and Summer Work Experience, which includes Canada Summer Jobs. This program is delivered nationally, regionally and locally via contribution agreements. This program uses funding from the following transfer payment: YES.
Sub-Program: Youth Employment StrategyPerformance Analysis and Lessons Learned
Budget 2014 committed to review YES to better align it with the evolving realities of the job market and to ensure federal investments in youth employment provide young Canadians with real-life work experience in high-demand fields such as science, technology, engineering, mathematics and the skilled trades. In 2015–16, the Department:
- collaborated with other government departments to implement new directions;
- began to implement reforms from the YES review; and
- continued ongoing policy development.
Overall, YES has helped a significant number of youth gain the skills, job experience and abilities they need to make a successful transition into the workplace. In 2015–16, ESDC, through YES, served 42,279 young Canadians. Of these, 34,470 obtained summer jobs with the Canada Summer Jobs program, and in addition, 679 returned to school and about 5,469 became employed or self-employed under the Career Focus and Skills Link programs.
The Horizontal Summative Evaluation of YES was released on July 29, 2015. The evaluation found that YES remains relevant in the current labour market context and continues to make a difference in the lives of Canadian youth. The summative evaluation report is available online.
Sub-Program: Youth Employment Strategy Budgetary Financial Resources (dollars)*
| 2015–16 Planned Spending | 2015–16 Actual Spending | 2015–16 Difference (actual minus planned) |
|---|---|---|
| 264,210,526 | 215,810,545 | (48,399,981) |
*In fiscal year 2015–16, there were some delays in approving and implementing projects due to the federal election.
Sub-Program: Youth Employment Strategy Human Resources (full-time equivalents – FTEs)
| 2015–16 Planned | 2015–16 Actual | 2015–16 Difference (actual minus planned) |
|---|---|---|
| 312 | 359 | 47 |
Sub-Program: Youth Employment Strategy Performance Results
| Expected Result | Performance Indicators | Targets | Actual and Historical Results |
|---|---|---|---|
| Youth have access to programs that allow them to acquire the skills, learning experiences and opportunities they need to find and maintain employment or return to school | Number of clients served who have started one or more interventions within the current fiscal year Source: administrative data |
46,000 | Actual Result: Historical Result: |
Number of clients employed or self-employed Source: administrative data |
6,000 | Actual Result: Historical Result: |
Sub-Program: Targeted Initiative for Older Workers
Sub-Program: Targeted Initiative for Older Workers Description
The Targeted Initiative for Older Workers is a federal-provincial/territorial cost shared initiative that provides unemployed older workers (normally between the ages of 55 and 64) with employment assistance services, skills upgrading and work experience to reintegrate them into the workforce and/or increase their employability. The Initiative assists unemployed older workers in small communities of 250,000 or less that are experiencing high unemployment, significant downsizing/closures, unfulfilled employer demand and/or skills mismatches. Under this program, provinces and territories are responsible for identifying specific communities for participation in the Initiative, designing and delivering projects, and monitoring and reporting on projects. All projects must include employment assistance activities such as résumé writing, interview techniques, counselling and job search techniques and at least two employability improvement activities such as prior learning assessment, skills training, work experience or preparation for self-employment. The Government of Canada’s investment in the Initiative complements other funding provided through various labour market transfers to provinces and territories to support Canadians in receiving the training they need to secure employment, including the Canada Job Fund Agreements, Labour Market Development Agreements and Labour Market Agreements for Persons with Disabilities. This program uses funding from the following transfer payment: Targeted Initiative for Older Workers.
Sub-Program: Targeted Initiative for Older Workers Performance Analysis and Lessons Learned
In 2015–16, provinces and territories (P/Ts) implemented the Targeted Initiative for Older Workers (TIOW) program through the delivery of over 130 projects that targeted over 3,580 unemployed older workers. Through continuous engagement with P/Ts via multilateral calls, annual workshops and program evaluations, P/Ts have gained an appreciation for best practices and lessons learned. They have also leveraged the flexibilities within their bilateral agreements to design and deliver innovative and effective programming for older workers, thereby helping this cohort to obtain employment and/or become more employable within the unique and changing labour markets across the country.
Findings from various phases of program evaluations completed to date indicate consistent results. The most recent findings highlighted by the Summative Evaluation Report, released in July 2014, indicate that 75 percent of TIOW project participants found paid employment following their participation in TIOW and that the majority of former TIOW survey respondents believed that their TIOW participation improved their employability.
Sub-Program: Targeted Initiative for Older Workers Budgetary Financial Resources (dollars)
| 2015–16 Planned Spending | 2015–16 Actual Spending | 2015–16 Difference (actual minus planned) |
|---|---|---|
| 25,073,735 | 22,610,439 | (2,463,296) |
Sub-Program: Targeted Initiative for Older Workers Human Resources (full-time equivalents – FTEs)
| 2015–16 Planned | 2015–16 Actual | 2015–16 Difference (actual minus planned) |
|---|---|---|
| 9 | 10 | 1 |
Sub-Program: Targeted Initiative for Older Workers Performance Results
| Expected Result | Performance Indicators | Targets | Actual and Historical Results |
|---|---|---|---|
| Unemployed older workers in small communities have access to programs that allow them to acquire the skills, learning experiences and opportunities they need to return to work and/or become more employable | Number of approved/extended Targeted Initiative for Older Workers projects Source: administrative data |
Baseline year | Actual Result: Historical Result: |
Number of clients targeted by provinces and territories for participation in Targeted Initiative for Older Workers projects Source: administrative data |
Baseline year | Actual Result: Historical Result: |
Sub-Program: Enabling Fund for Official Language Minority Communities
Sub-Program: Enabling Fund for Official Language Minority Communities Description
The Enabling Fund for Official Language Minority Communities is an integral component of the Government of Canada’s strategy for official languages as expressed in the Roadmap for Canada's Official Languages 2013–18: Education, Immigration, Communities. This program aims to enhance the development and vitality of these communities by strengthening their capacity in the areas of human resources and community economic development, and by promoting partnerships at all levels, including with federal partners. This program provides funds to official language minority communities in every province and territory by supporting professional local capacity to deliver services and supports to jobseekers, businesses and communities; generate strategic partnerships; spur investment; and consolidate efforts and resources of stakeholders to take action on priorities. The Enabling Fund is designed so that official language minority communities can plan and implement community-specific development initiatives and better access a range of labour market services and programs. In addition to contributing to community development, the Enabling Fund allows the Department to deliver on its commitments and obligations related to the Official Languages Act. This program uses funding from the following transfer payment: Enabling Fund for Official Language Minority Communities.
Sub-Program: Enabling Fund for Official Language Minority Communities Performance Analysis and Lessons Learned
The Enabling Fund represents a sustained investment in economic and human resource development in official language minority communities (OLMCs). Stable funding enables Enabling Fund organizations to develop long-term partnerships and leverage other funding sources. In 2015–16, organizations leveraged over $22 million in funding. Partnership approaches and leveraging are important as they help to avoid duplication, build credibility, create synergies and strengthen the work of economic development organizations, and they allowed for the delivery of successful outcomes including the creation of 575 jobs.
Over the 2015–16 fiscal year, the Department focused efforts in three key areas to help advance the work of Enabling Fund organizations:
- Implementing its Performance Measurement Strategy and Framework, while piloting an outcomes and impact measurement and reporting system. The pilot is showing success in satisfying reporting requirements while measuring some of the more intangible benefits.
- Increasing availability of more local data including on the economic health of labour markets, on the supply of and demand for skills and on other key indicators. Combined with local intelligence, this information has supported more evidence-based approaches in OLMCs.
- Continuing to implement the Economic Action Network (EAN) for OLMCs. The EAN included regular meetings of thematic sub-groups, the executive committee and federal departments and agencies with economic mandates. This is a concrete mechanism for consultation and collaboration which has led to the development of a number of collaborative initiatives.
Sub-Program: Enabling Fund for Official Language Minority Communities Budgetary Financial Resources (dollars)
| 2015–16 Planned Spending | 2015–16 Actual Spending | 2015–16 Difference (actual minus planned) |
|---|---|---|
| 13,432,316 | 13,378,410 | (53,906) |
Sub-Program: Enabling Fund for Official Language Minority Communities Human Resources (full-time equivalents – FTEs)
| 2015–16 Planned | 2015–16 Actual | 2015–16 Difference (actual minus planned) |
|---|---|---|
| 14 | 12 | (2) |
Sub-Program: Enabling Fund for Official Language Minority Communities Performance Results
| Expected Result | Performance Indicators | Targets | Actual and Historical Results |
|---|---|---|---|
| Official language minority communities are better able to implement and sustain community economic and human resource development | Amount invested by non-Enabling Fund (EF) funded partners* for every dollar invested by the EF in community economic development and human resources development Source: administrative data |
$2** | Actual Result: Historical Result: |
*Not-for-profit groups, private-sector organizations and other governmental partners.
**Two dollars invested for each dollar allocated to official language minority communities through the EF program.
Sub-Program: Aboriginal Skills and Employment Training Strategy
Sub-Program: Aboriginal Skills and Employment Training Strategy Description
Indigenous communities have historically experienced significantly higher rates of unemployment, lower rates of labour force participation and higher rates of social assistance than other Canadian communities. The Aboriginal Skills and Employment Training Strategy aims to increase Indigenous participation in the Canadian labour market, ensuring that First Nations, Inuit and Métis people are engaged in sustainable, meaningful employment. Funding from the Strategy supports over 80 Indigenous service delivery organizations, which deliver employment and training services through over 600 points of service across Canada. Specific attention is given to working with partners in the private sector, educational institutions and other levels of government in demand-driven labour markets. This program is linked to the Employment Insurance Act, which enables Indigenous groups to deliver programs similar to those established by Part II of the Act. The Strategy is also linked to the First Nations and Inuit Child Care Initiative, which provides supports for childcare to assist Indigenous parents/caregivers accessing labour market programs. Currently, the Strategy supports labour market obligations specified in Treaty and Self-Government Agreements that are in place with some Indigenous groups. The Aboriginal Skills and Employment Training Strategy network of agreement holders is used for the delivery of the First Nations Job Fund under the Income Assistance Reform. Transfer payments are managed through contribution agreements with Indigenous organizations. This program uses funding from the following transfer payment: Aboriginal Skills and Employment Training Strategy.
Sub-Program: Aboriginal Skills and Employment Training Strategy Performance Analysis and Lessons Learned
The Aboriginal Skills and Employment Training Strategy (ASETS) was extended to March 31, 2017, to ensure continuity of skills and job training and employment support services to Indigenous Canadians all across the country until renewed programming is announced. The program target for ASETS (2010–2017) is 14,000 to 16,500 clients employed per year. Data related to the return to school is considered a good indicator of results, but has not been given a program target number. In 2015–16, 49,576 new clients were served, 10,646 clients have returned to school and 19,465 were employed. This represents a client success rate of 61 percent under ASETS.
ASETS is also a primary way in which ESDC meets skills and training obligations in specific modern treaties with Indigenous communities.
Sub-Program: Aboriginal Skills and Employment Training Strategy Budgetary Financial Resources (dollars)
| 2015–16 Planned Spending | 2015–16 Actual Spending | 2015–16 Difference (actual minus planned) |
|---|---|---|
| 272,619,268 | 268,292,630 | (4,326,638) |
Sub-Program: Aboriginal Skills and Employment Training Strategy Human Resources (full-time equivalents – FTEs)*
| 2015–16 Planned | 2015–16 Actual | 2015–16 Difference (actual minus planned) |
|---|---|---|
| 263 | 160 | (103) |
*The difference between planned and actual FTEs is due to an overstatement of planned FTEs in the RPP. Planned spending was stated correctly. This issue will be addressed in the 2017–2018 Report on Plans and Priorities.
Sub-Program: Aboriginal Skills and Employment Training Strategy Performance Results
| Expected Result | Performance Indicators | Targets | Actual and Historical Results |
|---|---|---|---|
| Through pre-employment support, skills development and demand-driven job training, an increasing number of Indigenous people are employed and integrated into the Canadian labour market | Number of clients who obtained employment or returned to school following service intervention(s) Source: administrative data |
Baseline year | Actual Result: Historical Result: |
Sub-Program: Skills and Partnership Fund
Sub-Program: Skills and Partnership Fund Description
As a complement to the Aboriginal Skills and Employment Training Strategy, the Skills and Partnership Fund supports over 80 short-term projects by Indigenous organizations and their private-sector and government partners. Funding recipients deliver supports and services to First Nations, Inuit and Métis people to help them develop the necessary skills and job training to secure jobs. This program focuses on emerging or untapped economic development opportunities to meet the needs of high-demand sectors, as well as areas with skills shortages. Attention is given to ensuring that partnerships are in place prior to project initiation and that the focus of projects are responsive to demonstrated need with supports in the areas of training-to-employment, skills development and service innovation. Currently, the Skills and Partnership Fund supports labour market obligations specified in various Treaty and Self-Government Agreements that are in place with some Indigenous groups. Transfer payments are managed through contribution agreements with Indigenous organizations. This program uses funding from the following transfer payment: Skills and Partnership Fund.
Sub-Program: Skills and Partnership Fund Performance Analysis and Lessons Learned
The Skills and Partnership Fund (SPF) was renewed as an ongoing program at $50 million per year starting in 2016–17 to 2020–21. Transition funding of $16.5 million was allocated to support the continuation of successful projects in priority sectors. The annual program target for the SPF is approximately 1,600 employed clients.
In 2015–16, the results indicate that 3,494 new clients started their “training to employment” intervention, 1,766 clients were employed and 272 clients have returned to school under the SPF program. This represents a client employment success rate of 51 percent under the SPF program. The success rate increases to 59 percent when returned to school clients are taken into account.
Sub-Program: Skills and Partnership Fund Budgetary Financial Resources (dollars)*
| 2015–16 Planned Spending | 2015–16 Actual Spending | 2015–16 Difference (actual minus planned) |
|---|---|---|
| 4,960,613 | 21,084,845 | 16,124,232 |
*In 2015–16, transition funding of $16.5 million (from internal reallocations) has been allowed to support successful projects in priority sectors in order to preserve the continuity of the program before the 2016–17 renewal.
Sub-Program: Skills and Partnership Fund Human Resources (full-time equivalents – FTEs)*
| 2015–16 Planned | 2015–16 Actual | 2015–16 Difference (actual minus planned) |
|---|---|---|
| 53 | 44 | (9) |
*The variance in FTE utilization is resulting from a realignment of staffing to match Sub-Program Activity within the Program.
Sub-Program: Skills and Partnership Fund Performance Results
| Expected Result | Performance Indicators | Targets | Actual and Historical Results |
|---|---|---|---|
| Through partnership-based and project-specific skills development and employment training, an increasing number of Indigenous people are employed and integrated into the Canadian labour market | Number of clients who obtained employment following service intervention(s) Source: administrative data |
Baseline year | Actual Result: Historical Result: |
Sub-Program: First Nations Job Fund
Sub-Program: First Nations Job Fund Description
The Indigenous youth population is growing in First Nations communities, where there are high unemployment rates and a high dependency on Income Assistance, especially on reserves. The First Nations Job Fund (FNJF) aims to provide on-reserve First Nations Income Assistance recipients between 18 and 24 years of age, who are able to work and who are trainable within one year, with the personalized training necessary to access jobs. Clients are referred to the Fund through the Indigenous and Northern Affairs Canada (INAC) Enhanced Service Delivery system. This program is delivered through the Aboriginal Skills and Employment Training Strategy (ASETS) delivery network. Selected organizations work with local training facilities and employers to ensure that Income Assistance recipients referred from the Enhanced Service Delivery system are provided with the training-to-employment and employment supports they need to secure jobs. The Fund is one of two components of the First Nations Income Assistance Reform Initiative—a joint initiative between INAC, which delivers the enhanced Service Delivery, and ESDC, which administers the FNJF. This program uses funding from the following transfer payment: First Nations Job Fund.
Sub-Program: First Nations Job Fund Performance Analysis and Lessons Learned
In 2015–16, the results indicate that 1,130 new clients were served, 396 became employed and 106 returned to school.
As part of the Income Assistance Reform, the First Nations Job Fund is delivered by Aboriginal Skills and Employment Training Strategy (ASETS) agreement holders for job training of individuals who are referred from Enhanced Service Delivery. A joint evaluation of the on-reserve Income Assistance Reform was undertaken in 2015–16, which indicated that the initiative had not been fully implemented as expected (i.e. evidenced by the low referrals to the First Nations Job Fund). However, it was also noted that the program was successfully facilitating on-reserve youth to access training and obtain jobs.
Sub-Program: First Nations Job Fund Budgetary Financial Resources (dollars)*
| 2015–16 Planned Spending | 2015–16 Actual Spending | 2015–16 Difference (actual minus planned) |
|---|---|---|
| 60,849,312 | 10,497,889 | (50,351,423) |
*Spending for the First Nations Job Fund (FNJF) is based on cost per client. Of the 5,988 clients expected to be referred by Enhanced Service Delivery (ESD) to the FNJF, 1,110 clients (as of March 2016), 18% of expected, were actually referred and served by the FNJF, accounting for lower than planned spending.
Sub-Program: First Nations Job Fund Human Resources (full-time equivalents – FTEs)
| 2015–16 Planned | 2015–16 Actual | 2015–16 Difference (actual minus planned) |
|---|---|---|
| 13 | 15 | 2 |
Sub-Program: First Nations Job Fund Performance Results
| Expected Result | Performance Indicators | Targets | Actual and Historical Results |
|---|---|---|---|
| First Nations Job Fund clients on-reserve are employed and integrated into the labour market | Proportion of the clients who obtained employment following service intervention(s) Source: administrative data |
30% | Actual Result: Historical Result: |
Sub-Program: Job Bank
Sub-Program: Job Bank Description
Job Bank provides timely and relevant labour market information on employment opportunities across Canada to help workers find suitable employment and help employers find suitable workers. This program targets employers, individuals (e.g. job seekers, unemployed Canadians, students, newcomers and potential immigrants), career practitioners (e.g. employment and vocational counselling organizations, education/learning institutions and community organizations) and government analysts and decision makers (including federal-provincial/territorial government organizations and programs, ESDC/Service Canada). Job Bank offers a free and bilingual online job board, delivered in collaboration with all provinces and territories, which allows employers to post available job opportunities and job seekers to search for jobs. In addition, the Web portal includes a variety of economic, labour market and demographic reports, including sectoral and occupational profiles and projections. This program is legislated by Employment Insurance Act subsections 60 (1) and (2); section 58, subsection C of the National Employment Service (Employment Insurance Regulations); and the International Labour Organization Convention 88. The Department collaborates with provinces and territories through the Forum of Labour Market Ministers and its Labour Market Information Working Group. Through the Working Group, jurisdictions share information and undertake projects that address areas of mutual interest and concern related to the development and delivery of labour market information.
Sub-Program: Job Bank Performance Analysis and Lessons Learned
Job Bank launched several enhanced services in 2015–16 as part of its modernization. The staggered approach employed allowed Job Bank to gradually improve its services based on user experience. The number of accounts created, usage and survey results indicate that Job Bank has been successful in connecting job seekers with suitable employment and helping employers find qualified workers.
Job Bank was able to partner with two provincial/territorial governments in 2015 and continued to discuss co-delivery options with the remaining provinces that maintain their own job boards. A uniform employment service across Canada would provide a more effective labour exchange service as well as more accurate and extensive LMI.
The LMI National Work Plan 3.0 (NWP) was implemented as planned. LMI on wages was updated in November 2015 and outlooks for the projection period ending in 2017 were prepared for dissemination in April 2016. Other core products were produced and disseminated on Job Bank.
Sub-Program: Job Bank Budgetary Financial Resources (dollars)
| 2015–16 Planned Spending | 2015–16 Actual Spending | 2015–16 Difference (actual minus planned) |
|---|---|---|
| 20,431,191 | 20,707,271 | 276,080 |
Sub-Program: Job Bank Human Resources (full-time equivalents – FTEs)
| 2015–16 Planned | 2015–16 Actual | 2015–16 Difference (actual minus planned) |
|---|---|---|
| 227 | 196 | (31) |
Sub-Program: Job Bank Performance Results
| Expected Result | Performance Indicators | Targets | Actual and Historical Results |
|---|---|---|---|
| Labour market information responds to the needs of students, workers, employers, policy makers, governments and stakeholder organizations | Number of active employers using Job Bank Source: administrative data |
Baseline year | Actual Result: Historical Result: |
Number of people who report finding a job as a result of Job Alerts Source: administrative data |
Baseline year | Actual Result: Historical Result: |
|
Number of jobs matched to individuals Source: administrative data |
Baseline year | Actual Result: Historical Result: |
|
Number of available jobs disseminated through Job Bank and related tools Source: administrative data |
Baseline year | Actual Result: Historical Result: |
*47,995 represents the number of active employer accounts on the new Job Bank for Employers module. This number does not account for additional employers who, over the course of 2015–16, only posted on the old Job Bank employer module and did not transition to the new module. 82,756 represents the number of employers whose jobs were supplied to Job Bank through a feed from another job board. This number may include duplicates since it considers multiple external sources.
**Job Alerts users who unsubscribe from the service are asked to complete a voluntary exit survey. Of the 69,381 respondents, 4,913 (7.1%) reported finding a job as a result of Job Alerts. 54,078 represents the estimated number of users who found a job as a result of Job Alerts out of the 761,657 users on Job Alerts in 2015–16 based on a 7.1% success rate.
Sub-Program: Sectoral Initiatives Program
Sub-Program: Sectoral Initiatives Program Description
The Sectoral Initiatives Program is a grants and contributions program with the objective of addressing current and future skills shortages by supporting the development and distribution of sector-specific labour market intelligence, national occupational standards and skills certification and accreditation systems. The mandate is to help industry identify, forecast and address human resources and skills issues through partnership-based projects for key sectors of the Canadian economy to help ease labour mobility and labour market adjustment. This program uses funding from the following transfer payment: Sectoral Initiatives Program.
Sub-Program: Sectoral Initiatives Program Performance Analysis and Lessons Learned
In 2015–16, the Sectoral Initiatives Program (SIP) effectively managed a total of 29 multi year projects, which resulted in products that are enhancing sectoral intelligence. As per the SIP’s recipient survey, key results include: providing timely labour market reports and forecasting systems which enabled industry sectors, such as construction, mineral extraction, forestry and information, computer and technology (ICT) to make well-informed investment decisions; and promptly identify and address human resources challenges.
Likewise, as a result of the development of National Occupations Standards (NOS), employers were able to produce current human resource management tools and training institutions were able to adapt their curricula to better reflect current labour market needs. In addition, certification programs provided workers with an official recognition of having obtained relevant competencies demanded by employers while accreditation regimes ensured high-quality training standards, which were endorsed by industry.
While the percentage of intended beneficiaries that used the SIP products that were released in 2015–16 was not reported, approximately 50 percent of SIP recipients reported that 152,007 beneficiaries used SIP-funded products in 2015–16. However, some recipients reported only users to whom they directly distributed products, and did not report referrals to others or use of the products by other organizations’ members. Therefore, in several cases, the number of users could be underestimated. For these reasons, the SIP will adjust the indicator and data collection tools for future years, and has strengthened contribution agreements wording to ensure that program recipients implement a results measurement plan, which will increase the program’s capacity to report on results.
Additionally, the SIP actively engaged with potential and actual funding recipients to continue to develop and maintain partnerships and projects. The SIP also tested new approaches to work integrated learning via a pilot project and used lessons/best practices from this initiative to inform consultation and policy/program design work for the 2016 Budget announcement for the new Post-Secondary Industry Partnership and Coop Placement Initiative.
Sub-Program: Sectoral Initiatives Program Budgetary Financial Resources (dollars)
| 2015–16 Planned Spending | 2015–16 Actual Spending | 2015–16 Difference (actual minus planned) |
|---|---|---|
| 10,325,095 | 9,361,940 | (963,155) |
Sub-Program: Sectoral Initiatives Program Human Resources (full-time equivalents – FTEs)
| 2015–16 Planned | 2015–16 Actual | 2015–16 Difference (actual minus planned) |
|---|---|---|
| 46 | 39 | (7) |
Sub-Program: Sectoral Initiatives Program Performance Results
| Expected Result | Performance Indicators | Targets | Actual and Historical Results |
|---|---|---|---|
| Sectoral stakeholders benefit from industry-validated labour market intelligence products, national occupational standards and certification and accreditation programs | Number of labour market information reports or forecasting systems, national occupational standards, certification and accreditation regimes developed or updated via Sectoral Initiatives Program projects Source: administrative data |
Baseline year | Actual Result:
Historical Result: |
Percentage of intended beneficiaries that are using the Sectoral Initiatives Program products (labour market information, National Occupational Standards, certification and accreditation) Source: administrative data |
Baseline year | Actual Result: Historical Result: |
*Sectoral Initiatives Program (SIP) recipients reported that approximately 152,007 individuals or organizations used the SIP-funded products that were released in 2015–16. See the “Performance Analysis and Lessons Learned” section for further explanation.
Sub-Program: Literacy and Essential Skills
Sub-Program: Literacy and Essential Skills Description
Some Canadians, particularly from vulnerable groups, may not have the literacy and essential skills needed to fully participate in the labour force. In addition, Canadian employers' business and productivity needs also require pools of skilled workers. Literacy and essential skills contribute to the employability and adaptability of workers, and they are critical building blocks for the development of other skills. The Adult Learning and Literacy and Essential Skills Program contributes to increased literacy and essential skills of adult Canadians by targeting labour market stakeholders (including employers, associations, workers and those looking for work) as well as groups that are under-represented in the labour force (such as Indigenous and immigrant populations) and providing grants and contributions funding to projects that promote skills upgrading in and for the workplace. This program, administered by the Office of Literacy and Essential Skills, also develops partnerships with labour market stakeholders, supports the development and adoption of literacy and essential skills tools and resources, and pilots innovative approaches to literacy and essential skills development. The program links with the Roadmap for Canada's Official Languages 2013–18. This program uses funding from the following transfer payment: Adult Learning, Literacy and Essential Skills Program.
Sub-Program: Literacy and Essential Skills Performance Analysis and Lessons Learned
The Program focused its efforts towards making more strategic investments and working with organizations with a broader reach. This has resulted in a lower number of organizations receiving funding and offering services; however, the projects funded have led to an increase in the number of Canadians having access to essential skills training or supports as compared to the previous year.
An open call for innovative essential skills training models was held in February 2015, with an annual budget of approximately $10 million per year over five years. As of March 2016, no decisions were rendered on the call and as a result, less funds than anticipated were expended in 2015–16.
Significant progress has been made across the country to better understand "what works" to support people to develop the skills needed for the job market. Current focus is on taking the knowledge of effective models and practices and making strategic investments to scale them up more broadly. For instance, the Program is working closely with provincial and territorial governments to support the integration of essential skills into employment and training programs, supported by $2.7 billion in federal labour market transfers such as the Labour Market Development Agreements and the Canada Job Fund.
In addition, ESDC is enhancing the availability of essential skills supports for those most in need through programs such as the Aboriginal Skills and Employment Training Strategy, the Strategic Partnerships Fund and the First Nations Job Fund. As well, over 230,000 literacy and essential skills tools and resources were accessed or downloaded, including through partners such as Service Canada, Red Seal and the Canada Business Network.
Sub-Program: Literacy and Essential Skills Budgetary Financial Resources (dollars)*
| 2015–16 Planned Spending | 2015–16 Actual Spending | 2015–16 Difference (actual minus planned) |
|---|---|---|
| 26,663,160 | 12,717,328 | (13,945,832) |
*An open call for innovative essential skills training models was held in February 2015, with an annual budget of approximately $10 million per year over five years. As of March 2016, no decisions were rendered on the call and as a result, less funds than anticipated were expended in 2015–16.
Sub-Program: Literacy and Essential Skills Human Resources (full-time equivalents – FTEs)*
| 2015–16 Planned | 2015–16 Actual | 2015–16 Difference (actual minus planned) |
|---|---|---|
| 54 | 41 | (13) |
*The variance in FTE utilization is resulting from a realignment of staffing to match Sub-Program Activity within the Program.
Sub-Program: Literacy and Essential Skills Performance Results
| Expected Result | Performance Indicators | Targets | Actual and Historical Results |
|---|---|---|---|
| Adult Canadians have the literacy and essential skills they need to do their job, adapt and succeed in the labour market and contribute to their communities and families | Number of organizations supporting essential skills training and development* Source: administrative data |
Baseline year | Actual Result: Historical Result: |
Number of Canadians having accessed essential skills training or supports* Source: administrative data |
Baseline year | Actual Result: Historical Result: |
*Number only includes organizations funded under the Adult Learning, Literacy and Essential Skills Program including partners and pilot participants, the Aboriginal Skills and Employment Training Strategy, the Strategic Partnerships Fund and the First Nations Job Fund, and the clients they serve.
Sub-Program: Skilled Trades and Apprenticeship (Red Seal Program)
Sub-Program: Skilled Trades and Apprenticeship (Red Seal Program) Description
Tradespeople are a key component of the highly skilled workforce that supports Canadian competitiveness. Skilled Trades and Apprenticeship targets skilled trades workers and registered apprentices, working with jurisdictions through the Canadian Council of Directors of Apprenticeship (CCDA) to deliver the Interprovincial Standards Red Seal Program. The CCDA comprises the apprenticeship authorities from each province and territory and representatives from ESDC. The Red Seal Program helps to develop a highly qualified, productive and mobile skilled trades workforce by developing high-quality Red Seal products, including National Occupational Analyses and interprovincial examinations for the trades in collaboration with industry. Tradespersons who meet the Red Seal standards receive a Red Seal endorsement on their provincial/territorial trade certificates. The CCDA also collaborates to develop common apprenticeship training resources such as interprovincial program guides as well as tools for building essential skills.
Sub-Program: Skilled Trades and Apprenticeship (Red Seal Program) Performance Analysis and Lessons Learned
ESDC funds and delivers the Red Seal Program in collaboration with provinces and territories through the Canada Council of Director of Apprenticeship (CCDA). In 2015–16, under the Strengthening the Red Seal Initiative, a new enhanced Red Seal Occupational Standard was approved following the completion of two successful pilots that tested a new standard for Construction Electrician and Steamfitter/Pipefitter. The new standard places increased emphasis on training and assessment with industry-defined learning objectives, outcomes and performance criteria.
Significant work was also done to advance the harmonization of apprenticeship training in Red Seal trades. Pan-Canadian consultations were held for the first 10 Red Seal trades, resulting in the implementation of recommendations in most jurisdictions by September 2016.
There were 27,281 Red Seals issued in 2015, which remained consistent over the last year. Additionally, in 2015, there were approximately 463,000 visitors to the Red Seal website. Through the Red Seal Info Line, ESDC, as the secretariat for the program, responded to more than 1,500 emails and 525 telephone messages.
The Forum of Labour Market Ministers led a review of initiatives currently offered by governments across the country, which is informing recommendations for Ministers for further collaborative efforts to promote and encourage employer participation.
The Department awarded 10 Flexibility and Innovation in Apprenticeship Technical Training (FIATT) pilot projects to test alternatives to block training. The Canadian Apprenticeship Forum (CAF) will be evaluating the pilots and will report on their results, outcomes and best practices.
Sub-Program: Skilled Trades and Apprenticeship (Red Seal Program) Budgetary Financial Resources (dollars)*
| 2015–16 Planned Spending | 2015–16 Actual Spending | 2015–16 Difference (actual minus planned) |
|---|---|---|
| 9,675,987 | 7,650,206 | (2,025,781) |
*The difference is mainly due to contract delays. Spending of the travel budget was not as high as expected due to a number of factors including cancelled meetings, reduced attendance at meetings and high initial forecasting.
Sub-Program: Skilled Trades and Apprenticeship (Red Seal Program) Human Resources (full-time equivalents – FTEs)
| 2015–16 Planned | 2015–16 Actual | 2015–16 Difference (actual minus planned) |
|---|---|---|
| 47 | 43 | (4) |
Sub-Program: Skilled Trades and Apprenticeship (Red Seal Program) Performance Results
| Expected Results | Performance Indicators | Targets | Actual and Historical Results |
|---|---|---|---|
| The Red Seal Program is recognized by industry as a standard for certification of competency in the skilled trades | Percentage of Red Seal occupational standards that are up-to-date and reflect labour market needs Source: administrative data |
100% | Actual Result: Historical Results: |
| Through increased progression in the first two years of an apprenticeship program, completions are enhanced in the designated Red Seal trades | Percentage of apprentices covered by a Red Seal trade Source: Registered Apprenticeship Information System, Statistics Canada |
75% | Actual Result: Historical Results: |
Percentage of apprentices who complete an apprenticeship program and obtain certification in a Red Seal trade Source: Registered Apprenticeship Information System, Statistics Canada |
50% | Actual Result: Historical Results: |
*The Red Seal Occupational Standards are normally updated based on a four- to five-year cycle and when changes in trades are identified by stakeholders. However, the normal revision cycle was superseded by harmonization priorities of certain trades and does not allow for a comparable measure against previous years.
**RAIS data is collected on a calendar year basis and there is a time lag in data availability. Historical data are adjusted accordingly. The most recent RAIS data available is for the 2013 calendar year.
***This indicator is calculated for 2013 by dividing the number of individuals who registered in an apprenticeship program in a Red Seal trade five years previously (i.e. 2008) by the number of individuals who completed their program and obtained certification in a Red Seal trade (i.e. 2013).
Sub-Program: Apprenticeship Grants
Sub-Program: Apprenticeship Grants Description
Apprenticeship grants are incentives to attract Canadians to the trades and to assist apprentices in the Red Seal trades to progress and complete their training. This program targets eligible Canadian citizens, permanent residents and protected persons who are out of high school and are registered apprentices in one of the 56 designated Red Seal trades. It comprises two grants: the Apprenticeship Incentive Grant, a taxable cash grant of $1,000 per year for registered apprentices (up to a maximum of $2,000 per apprentice) who have successfully completed the technical and on-the-job training requirements for the first or second year/level of an apprenticeship program; and the Apprenticeship Completion Grant, an additional $2,000 taxable cash grant to registered apprentices upon completion of apprenticeship training and receipt of journeyperson certification. Eligibility for this program is tied to the Red Seal trades, as the Red Seal represents a standard of excellence which promotes the mobility of skilled tradespeople based on national standards. Delivery of apprenticeship grants to eligible registered apprentices involves responding to calls for information, collecting and processing applications, issuing payments and monitoring accuracy of payments. This program uses funding from the following transfer payment(s): Apprenticeship Grants.
Sub-Program: Apprenticeship Grants Performance Analysis and Lessons Learned
The number of apprenticeship grants issued remained fairly constant in 2015–16 compared to the previous fiscal year. Apprenticeship Incentive Grants increased from 52,166 in 2014–15 to 52,415 in 2015–16, and Apprenticeship Completion Grants slightly changed from 24,043 in 2014–15 to 24,210 in 2015–16.
In 2015–16, the Department continued to work with provincial/territorial apprenticeship authorities to identify opportunities and implement measures to increase program efficiency while offering individuals applying for an apprenticeship grant with a more streamlined application process.
Sub-Program: Apprenticeship Grants Budgetary Financial Resources (dollars)*
| 2015–16 Planned Spending | 2015–16 Actual Spending | 2015–16 Difference (actual minus planned) |
|---|---|---|
| 118,804,367 | 105,712,319 | (13,092,048) |
*The variance between planned and actual spending in 2015–16 is attributable to the program’s overall take-up rate, where eligible apprentices are not applying for the grants to which they are entitled, or not providing the necessary documentation to complete the application process.
Sub-Program: Apprenticeship Grants Human Resources (full-time equivalents – FTEs*)
| 2015–16 Planned | 2015–16 Actual | 2015–16 Difference (actual minus planned) |
|---|---|---|
| 53 | 66 | 13 |
*The variance in FTE utilization is resulting from a realignment of staffing to match Sub-Program Activity within the Program.
Sub-Program: Apprenticeship Grants Performance Results
| Expected Results | Performance Indicators | Targets | Actual and Historical Results |
|---|---|---|---|
| Increased participant progression in and completion of an apprenticeship program in a designated Red Seal trade | Number of Apprenticeship Incentive Grants issued Source: administrative data |
59,080 | Actual Result: Historical Results: |
Number of Apprenticeship Completion Grants issued Source: administrative data |
25,053 | Actual Result: Historical Results: |
|
| Apprenticeship Incentive Grant applicants receive a payment, or a non-payment notification, in a timely manner | Percentage of initial Apprenticeship Incentive Grant payments and non-payment notifications issued within 28 calendar days Source: administrative data |
95% | Actual Result: Historical Results: |
| Apprenticeship Completion Grant applicants receive a payment, or a non-payment notification, in a timely manner | Percentage of initial Apprenticeship Completion Grant payments and non-payment notifications issued within 28 calendar days Source: administrative data |
95% | Actual Result: Historical Results: |
*The variance between the target number of Apprenticeship Incentive Grants and the actual number of grants issued was more than 5% in 2015–16 and can be attributed to lower than expected take-up rate, where eligible apprentices are not applying for the grants to which they are entitled, or not providing the necessary documentation to complete the application process. The program forecast model for Apprenticeship Incentive Grants has been adjusted to better reflect take-up rates observed over the past five years.
Sub-Program: Foreign Credential Recognition Program
Sub-Program: Foreign Credential Recognition Program Description
The Foreign Credential Recognition Program targets internationally trained professionals and tradespersons, working with provincial and territorial governments and various organizations (such as regulatory bodies, national associations and credential assessment agencies), to facilitate credential recognition processes and ensure they are fair, consistent, transparent and timely. This program provides strategic financial support to its stakeholders through contribution agreements for key high-demand professions and skilled trades as well as other occupations to ensure that professionals and tradespersons who have obtained their credentials in another country can fully use their skills in Canada’s labour market. In order to streamline foreign credential recognition processes, this program facilitates national coordination among provinces and territories and other partners. The Foreign Credential Recognition Program also works to implement domestic labour mobility initiatives, and complements the Agreement on Internal Trade, by facilitating national coordination among partners and reducing barriers faced by workers in regulated occupations as they pursue employment opportunities across the country. This program uses funding from the following transfer payment: Foreign Credential Recognition Program.
Sub-Program: Foreign Credential Recognition Program Performance Analysis and Lessons Learned
In 2015–16, the Foreign Credential Recognition Program continued to work with provinces/territories to implement the Action Plan for Better Foreign Qualification Recognition (FQR). This included working with provinces/territories to engage with the third set of target occupations under the Pan Canadian Framework, working with the Red Seal trades on the implementation of pre-arrival supports and the development of a database for international certifications. Furthermore, ESDC consulted extensively with provinces/territories, national associations and provincial regulatory bodies in the development and roll-out of the Monitoring and Evaluation surveys—a priority in the FQR Action Plan. Portals for Labour Mobility and Foreign Credential Recognition were designed and launched to provide more online information for Canadians.
Additionally, the Foreign Credential Recognition Program continued to support its objectives in contributing to a fast, fair and transparent credentialing process for internationally trained professionals by providing financial support to provincial/territorial partners and stakeholders, including regulatory bodies, to develop systems and processes for assessing and recognizing qualifications in targeted occupations and sectors.
Sub-Program: Foreign Credential Recognition Program Budgetary Financial Resources (dollars)*
| 2015–16 Planned Spending | 2015–16 Actual Spending | 2015–16 Difference (actual minus planned) |
|---|---|---|
| 27,990,336 | 15,688,909 | (12,301,427) |
*The variance between planned and actual spending in 2015–16 is attributable to unused funding from contribution agreements with provincial and territorial governments and delays in implementing new projects due to the time required for project assessments.
Sub-Program: Foreign Credential Recognition Program Human Resources (full-time equivalents – FTEs*)
| 2015–16 Planned | 2015–16 Actual | 2015–16 Difference (actual minus planned) |
|---|---|---|
| 64 | 41 | (23) |
*The variance in FTE utilization is resulting from a realignment of staffing to match Sub-Program Activity within the Program..
Sub-Program: Foreign Credential Recognition Program Performance Results
| Expected Result | Performance Indicators | Targets | Actual and Historical Results |
|---|---|---|---|
| The labour market needs of immigrant workers, employers and other stakeholders are met | Portion of skilled immigrants in regulated occupations targeted by systemic foreign credential recognition interventions Source: Citizenship and Immigration Canada, Statistics Canada and administrative data |
78% | Actual Result: Historical Results: |
Sub-Program: Temporary Foreign Worker Program
Sub-Program: Temporary Foreign Worker Program Description
The Temporary Foreign Worker Program enables employers to hire foreign workers on a temporary basis to fill short-term labour needs only when Canadians and permanent residents are not available. This program is delivered in partnership with Immigration, Refugees and Citizenship Canada (IRCC) and the Canada Border Services Agency (CBSA). ESDC assesses applications from employers requesting permission to hire temporary foreign workers and conducts a labour market impact assessment to determine the likely effect these workers would have on the Canadian job market. This program assesses the impact by looking at available labour market information for the region and the occupation, the employers’ recruitment and advertisement efforts, wages and working conditions, labour shortages and the transfer of skills and knowledge to Canadians. ESDC works closely with IRCC, the CBSA and the provinces and territories to monitor and share information that has an impact on the integrity of the Temporary Foreign Worker Program. This program is legislated through the Immigration and Refugee Protection Act and Regulations. In Quebec, the Temporary Foreign Worker Program is administered in partnership with the province.
Sub-Program: Temporary Foreign Worker ProgramPerformance Analysis and Lessons Learned
The Temporary Foreign Worker Program (TFWP) exceeded its target of:
- Ensuring employers have timely access to foreign workers only when Canadians genuinely are unable to fill the available jobs by processing 87.9 percent of eligible applications received during the fiscal year within 10 business days.
- Improving the integrity of the Program, with the implementation of stronger enforcement and tougher penalties. This work included the coming into force (December 1, 2015) of the new Administrative Monetary Penalties (AMP) and varied bans legislation. In addition, 25.7 percent of employers were inspected or selected for a compliance review.
To strengthen protections for foreign workers, ESDC has a number of Information Sharing Agreements (ISAs) in place with provinces that support the compliance activities for each level of government, and with other departments and government agencies. Accomplishments include:
- An updated ISA with Ontario, and completed ISA negotiations with Alberta and British Columbia (final signature anticipated fall 2016).
- Commenced ISA negotiations with New Brunswick.
- Completed and signed ISAs with the Canada Border Services Agency and Canada Revenue Agency; an updated ISA is also fully negotiated and expected to be finalized with Immigration, Refugees and Citizenship Canada in fall 2016.
Additionally, the TFWP made progress on the planning of a new online application system for employers, and continued to increase the transparency of the Program by updating the statistics available to the public on the Canada.gc.ca website and by expanding the availability of these statistics to the Open Data Portal in March 2016.
Furthermore, at the end of 2015–16, the Government announced that a review of the Program would be undertaken by a Parliamentary Committee.
Sub-Program: Temporary Foreign Worker Program Budgetary Financial Resources (dollars)*
| 2015–16 Planned Spending | 2015–16 Actual Spending | 2015–16 Difference (actual minus planned) |
|---|---|---|
| 29,831,502 | 48,623,627 | 18,792,125 |
*Planned spending of $29.8 million at the time of the Report on Plans and Priorities did not include incremental funding approved for the Temporary Foreign Worker Program which was allocated to continue implementation of the 2014 reforms to the Program in fiscal year 2015–16. Actual spending of $48.6 million, and the associated variance with planned spending, reflect expenditures associated with this incremental funding and associated activities.
Sub-Program: Temporary Foreign Worker Program Human Resources (full-time equivalents – FTEs*)
| 2015–16 Planned | 2015–16 Actual | 2015–16 Difference (actual minus planned) |
|---|---|---|
| 348 | 562 | 214 |
*Planned spending at the time of the Report on Plans and Priorities did not include incremental funding approved for the Temporary Foreign Worker Program which was allocated to continue implementation of the 2014 reforms to the Program in fiscal year 2015–16. The increase in FTEs reflects the incremental funding and associated activities.
Sub-Program: Temporary Foreign Worker Program Performance Results
| Expected Results | Performance Indicators | Targets | Actual and Historical Results |
|---|---|---|---|
| Employers have timely access to temporary foreign workers only when Canadians genuinely are unable to fill the available jobs | Percentage of eligible applications received during the fiscal year are processed within 10 business days Source: administrative data |
80% | Actual Result: Historical Result: |
| Improve the integrity of the Temporary Foreign Worker Program, with the implementation of stronger enforcement and tougher penalties | Percentage of employers receiving a positive Labour Market Impact Assessment subject to compliance activities (e.g. inspections) Source: administrative data |
25% | Actual Result: Historical Result: |
| Canadians have access to Temporary Foreign Worker Program information through the Employer Contact Centre in the specialized call centres | Percentage of specialized calls answered by an Employer Contact Centre agent within 10 minutes Source: administrative data |
80% | Actual Result: Historical Result: |
*During the 2015–16 fiscal year, the Temporary Foreign Worker Program (TFWP) processed approximately 88% of eligible applications received during the fiscal year within 10 business days, which is above the target of 80%. 2015–16 was the first full fiscal year in which the 10 business day service was provided for eligible LMIAs that met specific criteria established as part of the TFWP reforms. As such there are no historical results available for comparison.
Program: Learning
Sub-Program: Canada Loans and Grants for Students and Apprentices Program
Sub-Program: Canada Loans and Grants for Students and Apprentices Program Description
The Canada Loans and Grants for Students and Apprentices Program provides repayable loans and non-repayable grants to help Canadians finance their participation in post-secondary education. The clients and beneficiaries include full- and part-time students from low- and middle-income families, students with dependants and students with permanent disabilities. The Program also offers apprenticeship loans targeting apprentices registered in a Red Seal trade to help cover the cost of technical training. Students and apprentices who receive loans also have access to debt management measures if they are experiencing financial difficulty in repaying their loans. These are managed in partnership with the participating provinces and territories, educational institutions and agencies, financial aid administrators, financial institutions and a service provider. Activities are enabled by the Canada Student Financial Assistance Act, the Canada Student Loans Act and the Apprentice Loans Act and related Regulations. Provinces and territories that do not participate in the Canada Loans and Grants for Students and Apprentices Program are provided with an alternative payment to fund similar programs and services. The Program complements the Canada Education Savings Program. The Program uses funding from the following transfer payment(s):
- Canada Loans and Grants for Students and Apprentices Program – Interest Payments and Liabilities (Statutory)
- Canada Loans and Grants for Students and Apprentices Program – Direct Financing Arrangement (Statutory)
- Canada Loans and Grants for Students and Apprentices Program – Canada Student Grants Program (Statutory)
- Pathways to Education Canada
Sub-Program: Canada Loans and Grants for Students and Apprentices Program Budgetary Financial Resources (dollars)*
| 2015–16 Planned Spending | 2015–16 Actual Spending | 2015–16 Difference (actual minus planned) |
|---|---|---|
| 1,450,659,053 | 1,540,326,675 | 89,667,622 |
*The variance is primarily due to $172 million in write-offs of directly funded student loans which received parliamentary approval in the Supplementary Estimates 2015–16. This variance is offset by two major components: firstly, by the fact that the Alternative Payment was mainly affected by the Bank of Canada holding interest rates low in 2015; and secondly, by a lower than anticipated value of Canada Student Grants being disbursed.
Sub-Program: Canada Loans and Grants for Students and Apprentices Program Human Resources (full-time equivalents – FTEs*)
| 2015–16 Planned | 2015–16 Actual | 2015–16 Difference (actual minus planned) |
|---|---|---|
| 248 | 223 | (25) |
*The difference between Planned and Actual FTEs utilization can be explained by delays in staffing and unexpected departures.
Sub-Program: Canada Loans and Grants for Students and Apprentices Program Performance Results
| Expected Results | Performance Indicators | Targets | Actual and Historical Results |
|---|---|---|---|
| Canadians, including those from under-represented groups, have access to financing for their post-secondary education | Percentage and number of full-time post-secondary students (aged 15 to 29) in participating provinces/territories who used a Canada Student Loan, and/or a Canada Student Grant and/or an in-study interest subsidy, to help finance their participation in post-secondary education Source: CLGSAP administrative data and the Canada Student Loans Program Actuarial Report |
48% (574,000) |
Actual Result: Historical Results: |
| Student loan borrowers can and do repay their loans | Default rate each year is within +/- three percentage points of default rate in previous year Source: CLGSAP administrative data |
+/- 3 percentage points* | Actual Result: Historical Results: |
| Clients are satisfied with the quality of services they receive | Percentage of in-study and in-repayment borrowers who are satisfied with the overall loan experience provided by the Canada Loans and Grants for Students and Apprentices Program Source: CLGSAP Client Satisfaction Survey |
78–80% | Actual Result: Historical Results: |
| Apprentices registered in Red Seal trades benefit from financing for apprenticeship training | Number of Red Seal apprentices who received Canada Apprentice Loans Source: CLGSAP administrative data |
Baseline year | Actual Result: |
*While the percentage of students has increased, the number of students has decreased as a result of declining enrolment in post-secondary education.
**This indicator shows the three-year default rate of those Canada Student Loans borrowers who entered repayment in 2013–14 and will finish their third year of repayment in the current reporting year (2015–16). At the time of reporting, the 2015–16 loan year has not yet finished, therefore the three-year default rate is projected using the first two years of data
Sub-Program: Canada Education Savings Program
Sub-Program: Canada Education Savings Program Description
The Canada Education Savings Program was created through an Act of Parliament in 1998 (and re-enacted as the Canada Education Savings Act in 2004). It is intended to make post-secondary education more affordable by encouraging early planning and saving for education. Funds can later be withdrawn to help finance children’s post-secondary education. The Canada Education Savings Grant provides matching grants on savings in Registered Education Savings Plans for Canadian children aged 17 and under. Eligible low-income families can also benefit from the Canada Learning Bond, which provides funds that are added to the Registered Education Savings Plans of children born on or after January 1, 2004. The program is delivered through an alternative service delivery arrangement with financial institutions, banks, mutual fund companies and scholarship foundations. The Canada Education Savings Program complements the Canada Student Loans Program and other labour market and skills development programs offered by ESDC. Funding and activities under this program are governed by the Canada Education Savings Act and related Regulations. This program uses funding from the following transfer payment: Canada Education Savings Program.
Sub-Program: Canada Education Savings Program Budgetary Financial Resources (dollars)
| 2015–16 Planned Spending | 2015–16 Actual Spending | 2015–16 Difference (actual minus planned) |
|---|---|---|
| 940,725,041 | 949,192,326 | 8,467,285 |
Sub-Program: Canada Education Savings Program Human Resources (full-time equivalents – FTEs)
| 2015–16 Planned | 2015–16 Actual | 2015–16 Difference (actual minus planned) |
|---|---|---|
| 105 | 100 | (5) |
Sub-Program: Canada Education Savings Program Performance Results
| Expected Results | Performance Indicators | Targets | Actual and Historical Results |
|---|---|---|---|
| Canadians are able to finance their participation in post-secondary education using Registered Education Savings Plan savings | Percentage and number of full- and part-time post-secondary students (aged 15 to 29) who used Registered Education Savings Plan funds to help finance their participation in post-secondary education Source: administrative data and Statistics Canada, Labour Force Survey |
21.5% | Actual Result: Historical Results: |
| Children under 18 have savings for post-secondary education in Registered Education Savings Plans | Total amount of Registered Education Savings Plan assets at the end of the current calendar year Source: administrative data |
$44.3 billion | Actual Result: Historical Results: |
Percentage of children under 18 (in the current calendar year) who have ever received a Canada Education Savings Grant Source: administrative data |
49.1% | Actual Result: Historical Results:* |
|
| Low-income families open Registered Education Savings Plans for their children's post-secondary education | Percentage of eligible children, in the current calendar year, who have ever received a Canada Learning Bond Source: administrative data |
33% | Actual Result: Historical Results:* |
*The historical data has been updated to more accurately reflect program performance. Due to the nature of financial transactions, historical numbers can change. For example, subscribers can apply for and receive benefits from prior years in which they were entitled to receive a grant or bond, which would show up in the Program’s administrative database in the current year.
Program: Labour
Sub-Program: Labour Relations
Sub-Program: Labour Relations Description
This program seeks to promote and sustain cooperative workplace relations in the federal jurisdiction (interprovincial transportation, post office and courier companies, telecommunications, banking, grain handling, nuclear facilities, federal Crown corporations, companies that have contracts with the federal government, Indigenous governments and certain Indigenous enterprises). The program provides mediation and conciliation services to assist employers and unions in achieving a collective agreement without resorting to a work stoppage. It seeks to support constructive labour management relations through preventive mediation services that identify opportunities for employers and unions to meet and discuss issues of mutual interest and to support new and innovative approaches to collective bargaining. This program also appoints arbitrators, adjudicators and referees for grievances under Part I of the Canada Labour Code, for unjust dismissal and wage recovery appeals under Part III of the Code and for appeals under the Wage Earner Protection Program Act.
Sub-Program: Labour Relations Budgetary Financial Resources (dollars)
| 2015–16 Planned Spending | 2015–16 Actual Spending | 2015–16 Difference (actual minus planned) |
|---|---|---|
| 14,310,769 | 15,241,125 | 930,356 |
Sub-Program: Labour Relations Human Resources (full-time equivalents – FTEs)
| 2015–16 Planned | 2015–16 Actual | 2015–16 Difference (actual minus planned) |
|---|---|---|
| 129 | 134 | 5 |
Sub-Program: Labour Relations Performance Results
| Expected Result | Performance Indicators | Targets | Actual and Historical Results |
|---|---|---|---|
| Potential labour disputes are resolved without a work stoppage through mediation and conciliation | Percentage of labour disputes settled under Part I (Industrial Relations) of the Canada Labour Code without work stoppages, where parties were assisted by Labour Program Officers Source: administrative data |
90% | Actual Result: Historical Results: |
Sub-Program: Workplace Health and Safety
Sub-Program: Workplace Health and Safety Description
This program seeks to promote and sustain safe workplaces in the federal jurisdiction (interprovincial transportation, post office and courier companies, telecommunications, banking, grain handling, nuclear facilities, federal Crown corporations, and Indigenous governments and their employees). It seeks to ensure federal employers’ compliance with relevant occupational health and safety standards through employer and employee cooperation to ensure healthy and safe workplaces in targeted high-risk industries. It also provides income support and rehabilitation support to injured federal workers and merchant seamen.
Sub-Program: Workplace Health and Safety Budgetary Financial Resources (dollars)*
| 2015–16 Planned Spending | 2015–16 Actual Spending | 2015–16 Difference (actual minus planned) |
|---|---|---|
| 199,393,411 | 187,978,149 | (11,415,262) |
*Traditionally, the Federal Workers' Compensation forecasts are much higher than actuals. Starting in 2016–17, expenditure forecasts have been lowered to align with trends.
Sub-Program: Workplace Health and Safety Human Resources (full-time equivalents – FTEs)
| 2015–16 Planned | 2015–16 Actual | 2015–16 Difference (actual minus planned) |
|---|---|---|
| 282 | 270 | (12) |
Sub-Program: Workplace Health and Safety Performance Results
| Expected Result | Performance Indicators | Targets | Actual and Historical Results |
|---|---|---|---|
| The number of injuries and fatalities in high-risk industries are reduced | Percentage annual (year-over-year) decrease in the disabling injuries incidence rate in targeted high-risk federal jurisdiction sectors Source: Federal Jurisdiction Injuries Database |
1% | Actual Result: Historical Result: |
Sub-Sub-Program: Occupational Health and Safety
Sub-Sub-Program: Occupational Health and Safety Description
This program has the goal of reducing work-related accidents and illnesses in federal jurisdiction workplaces. It also develops and amends occupational health and safety legislation and regulations for federally regulated workplaces and the federal public service and produces tools to assist employers and employees in understanding their roles and responsibilities under the Canada Labour Code. The program develops and disseminates promotional material and advises employers on how to achieve compliance with the Canada Labour Code. It also conducts inspections and investigations, issues directions to employers to comply with the legislation and, if necessary, initiates prosecutions. Further, a grant is disbursed that supports federal workplace health and safety objectives linked to Part II of the Canada Labour Code.
Sub-Sub-Program: Occupational Health and Safety Budgetary Financial Resources (dollars)
| 2015–16 Planned Spending | 2015–16 Actual Spending | 2015–16 Difference (actual minus planned) |
|---|---|---|
| 21,585,179 | 24,648,722 | 3,063,543 |
Sub-Sub-Program: Occupational Health and Safety Human Resources (full-time equivalents – FTEs*)
| 2015–16 Planned | 2015–16 Actual | 2015–16 Difference (actual minus planned) |
|---|---|---|
| 235 | 205 | (30) |
*The difference between planned and actual FTEs reflects the need for a realignment of FTEs among the two sub-sub-programs under the Workplace Health and Safety sub-program. This is a continuation of realignment of FTEs from previous years.
Sub-Sub-Program: Occupational Health and Safety Performance Results
| Expected Result | Performance Indicators | Targets | Actual and Historical Results |
|---|---|---|---|
| Employers comply with occupational health and safety legislation and regulations once a violation has been identified and Assurances of Voluntary Compliance or Workplans have been received | Percentage of violations that are corrected by the employer following receipt by the Labour Program of Assurances of Voluntary Compliance or Workplans Source: Labour Application 2000 |
90% | Actual Result: Historical Results: |
Sub-Sub-Program: Federal Workers’ Compensation
Sub-Sub-Program: Federal Workers’ Compensation Description
This program oversees income maintenance, medical benefits, support of the return to work process and vocational rehabilitation services to workers in the federal public sector who sustain an occupational injury or illness. It also provides benefits to injured merchant seamen, survivors of employees slain on duty and inmates. The program ensures compliance with federal statutes through collaboration with federal departments and agencies, employees and provincial workers’ compensation boards. Shorter reporting times will result in earlier intervention and, subsequently, quicker returns to work, positively influencing worker productivity and social and financial costs.
Sub-Sub-Program: Federal Workers’ Compensation Budgetary Financial Resources (dollars)*
| 2015–16 Planned Spending | 2015–16 Actual Spending | 2015–16 Difference (actual minus planned) |
|---|---|---|
| 177,808,232 | 163,329,427 | (14,478,805) |
*Traditionally, the Federal Workers' Compensation forecasts are much higher than actuals. Starting in 2016–17, expenditure forecasts have been lowered to align with trends.
Sub-Sub-Program: Federal Workers’ Compensation Human Resources (full-time equivalents – FTEs*)
| 2015–16 Planned | 2015–16 Actual | 2015–16 Difference (actual minus planned) |
|---|---|---|
| 47 | 65 | 18 |
*The difference between planned and actual FTEs reflects the need for a realignment of FTEs among the two sub-sub-programs under the Workplace Health and Safety sub-program. This is a continuation of realignment of FTEs from previous years.
Sub-Sub-Program: Federal Workers’ Compensation Performance Results
| Expected Result | Performance Indicators | Targets | Actual and Historical Results |
|---|---|---|---|
| Federal workers have timely access to the compensation, benefits and remedies to which they are entitled under the Government Employees Compensation Act | Percentage of claims with reporting times of under 15 days from the date the claim is reported Source: National Injury Compensation System |
60% | Actual Result: Historical Result: |
*The performance during the period of adjustment before and after centralization over the last few years was not consistent and made it challenging for the Department to forecast an exact target for the first year.
Sub-Program: Labour Standards and Equity
Sub-Program: Labour Standards and Equity Description
This program seeks to promote and sustain fair and equitable workplaces in the federal jurisdiction (interprovincial transportation, post office and courier companies, telecommunications, banking, grain handling, nuclear facilities, federal Crown corporations, companies that have contracts with the federal government, and some First Nations employers and employees). The program administers and enforces labour standards through education and compliance activities. It also seeks to identify and eliminate barriers to employment for the four designated groups (women, Indigenous peoples, persons with disabilities and visible minorities) in the federal jurisdiction. The program also reduces the economic insecurity of workers through the protection of wages and vacation, severance and termination pay when their employer declares bankruptcy or becomes subject to receivership.
Sub-Program: Labour Standards and Equity Budgetary Financial Resources (dollars)*
| 2015–16 Planned Spending | 2015–16 Actual Spending | 2015–16 Difference (actual minus planned) |
|---|---|---|
| 70,717,840 | 43,069,566 | (27,648,274) |
*The annual program spending remains well below the statutory envelope allocated to the Wage Earner Protection Program ($49.3 million) due to relatively low demand on the program year over year.
Sub-Program: Labour Standards and Equity Human Resources (full-time equivalents – FTEs)
| 2015–16 Planned | 2015–16 Actual | 2015–16 Difference (actual minus planned) |
|---|---|---|
| 194 | 209 | 15 |
Sub-Program: Labour Standards and Equity Performance Results
| Expected Result | Performance Indicators | Targets | Actual and Historical Results |
|---|---|---|---|
| Federally regulated employers comply with set conditions of employment | Three-year average number of violations under Part III of the Canada Labour Code per 1,000 federally regulated employees Source: Labour Application 2000 |
Under 5 | Actual Result: Historical Results: |
Sub-Sub-Program: Labour Standards
Sub-Sub-Program: Labour Standards Description
This program seeks to support fair and equitable workplaces through the administration and enforcement of labour standards (Part III of the Canada Labour Code) that define minimum conditions of employment in the federal jurisdiction. The program also develops educational materials to assist employers and workers in understanding their rights and obligations; provides advice to employers and workers who have questions about their rights and responsibilities; and engages in proactive inspections of employer records to verify compliance, while targeting those employers with a history of non compliance. The Federal Mediation and Conciliation Service contributes to the dispute resolution process when it becomes necessary to appoint adjudicators to hear unjust dismissal complaints and referees to hear wage recovery appeals under Part III of the Canada Labour Code.
Sub-Sub-Program: Labour Standards Budgetary Financial Resources (dollars)
| 2015–16 Planned Spending | 2015–16 Actual Spending | 2015–16 Difference (actual minus planned) |
|---|---|---|
| 14,470,027 | 16,114,020 | 1,643,993 |
Sub-Sub-Program: Labour Standards Human Resources (full-time equivalents – FTEs*)
| 2015–16 Planned | 2015–16 Actual | 2015–16 Difference (actual minus planned) |
|---|---|---|
| 126 | 168 | 42 |
*The difference between planned and actual FTEs reflects the need for a realignment of FTEs across sub-programs. This is a continuation of realignment of FTEs from previous years.
Sub-Sub-Program: Labour Standards Performance Results
| Expected Result | Performance Indicators | Targets | Actual and Historical Results |
|---|---|---|---|
| Fair and equitable workplaces are achieved through the enforcement of labour standards legislation and regulations | Percentage change over a three-year period in the rate of recurring monetary violations Source: Labour Application 2000, Federal Jurisdiction Injuries Database |
1% decrease | Actual Result: Historical Result: |
Sub-Sub-Program: Workplace Equity
Sub-Sub-Program: Workplace Equity Description
This program helps to achieve equitable representation in workplaces by requiring federally regulated private-sector employers and federal contractors to identify and eliminate employment barriers for the four designated groups (women, Indigenous peoples, persons with disabilities and members of visible minorities) under the Employment Equity Act. It also seeks to prevent the emergence of future employment barriers and to foster a climate of equity in these organizations by enforcing the Employment Equity Act through mandatory employer reporting as well as engagement initiatives. The program administers the Legislated Employment Equity Program and the Federal Contractors Program in order to support the federal government’s objectives and policies on employment equity.
Sub-Sub-Program: Workplace Equity Budgetary Financial Resources (dollars)*
| 2015–16 Planned Spending | 2015–16 Actual Spending | 2015–16 Difference (actual minus planned) |
|---|---|---|
| 5,359,371 | 1,354,739 | (4,004,632) |
*The actual spending is lower than anticipated; internal reallocation of resources continues to be necessary across the sub-programs to reflect a more accurate allocation of resources throughout the Program Alignment Architecture.
Sub-Sub-Program: Workplace Equity Human Resources (full-time equivalents – FTEs*)
| 2015–16 Planned | 2015–16 Actual | 2015–16 Difference (actual minus planned) |
|---|---|---|
| 48 | 14 | (34) |
*The difference between planned and actual FTEs reflects the need for a realignment of FTEs across sub-programs. This is a continuation of realignment of FTEs from previous years.
Sub-Sub-Program: Workplace Equity Performance Results
| Expected Result | Performance Indicators | Targets | Actual and Historical Results |
|---|---|---|---|
| Increased representation of designated groups in federally regulated private-sector workplaces | Percentage of employment equity reports submitted on time Source: Workplace Equity Information Management System |
95% | Actual Result: Historical Results: |
Sub-Sub-Program: Wage Earner Protection Program
Sub-Sub-Program: Wage Earner Protection Program Description
This program is designed to reduce the economic insecurity of Canadian workers who are owed unpaid wages and vacation, termination and severance pay when their employer declares bankruptcy or becomes subject to receivership. Individuals can receive an amount up to four weeks’ maximum insurable earnings under the Employment Insurance Act. When eligible individuals receive payments under the Wage Earner Protection Program Act, they sign over their rights as creditors of the employer to the federal government to the extent of the Wage Earner Protection Program (WEPP) payment. Applicants who disagree with initial eligibility decision can request a review within 30 days of the initial decision and file a request for appeal within 60 days of the review decision. The appeals are handled by an independent adjudicator appointed by the Federal Mediation and Conciliation Service. The federal government seeks recovery of the amounts as the creditor of the employer in the bankruptcy or receivership process. This program covers workers in all labour jurisdictions. This program uses funding from the following transfer payment: Wage Earner Protection Program.
Sub-Sub-Program: Wage Earner Protection Program Budgetary Financial Resources (dollars)*
| 2015–16 Planned Spending | 2015–16 Actual Spending | 2015–16 Difference (actual minus planned) |
|---|---|---|
| 50,888,442 | 25,600,807 | (25,287,635) |
*The difference between planned and actual spending is mainly the result of unused funds under the Wage Earner Protection Program due to relatively low demand on the program year after year.
Sub-Sub-Program: Wage Earner Protection Program Human Resources (full-time equivalents – FTEs*)
| 2015–16 Planned | 2015–16 Actual | 2015–16 Difference (actual minus planned) |
|---|---|---|
| 20 | 27 | 7 |
*The difference between planned and actual FTEs reflects the need for a realignment of FTEs across sub-programs. This is a continuation of realignment of FTEs from previous years.
Sub-Sub-Program: Wage Earner Protection ProgramPerformance Results
| Expected Result | Performance Indicators | Targets | Actual and Historical Results |
|---|---|---|---|
| Wage Earner Protection Program applicants receive a payment, or a non-payment notification, in a timely manner | Percentage of initial Wage Earner Protection Program payments and non-payment notifications issued within the 42-day service standard Source: administrative data |
80% | Actual Result: Historical Results: |
*The target was exceeded as a result of additional training provided to processing resources. Performance improvement can also be attributed to updated procedure and reference material, which increased efficiencies in claims processing. Additionally, there were improvements made to the online Wage Earner Protection Program application system. These changes resulted in more accurate and complete client information, which improved claim processing performance.
Sub-Program: International Labour Affairs
Sub-Program: International Labour Affairs Description
This program seeks to protect Canadian workers and employers from unfair competition from other countries with poor labour standards or lax labour law enforcement. The program negotiates international labour standards that reflect Canadian values and oversees Canada’s participation in international labour forums. The program also promotes fundamental labour rights internationally to support equitable growth and social stability in developing countries, protect human rights and contribute to reducing the growing global divide between rich and poor. The program negotiates and implements international labour cooperation agreements and other frameworks and provides technical assistance to partner countries.
Sub-Program: International Labour Affairs Budgetary Financial Resources (dollars)
| 2015–16 Planned Spending | 2015–16 Actual Spending | 2015–16 Difference (actual minus planned) |
|---|---|---|
| 5,328,450 | 5,582,470 | 254,020 |
Sub-Program: International Labour Affairs Human Resources (full-time equivalents – FTEs)
| 2015–16 Planned | 2015–16 Actual | 2015–16 Difference (actual minus planned) |
|---|---|---|
| 33 | 32 | (1) |
Sub-Program: International Labour Affairs Performance Results
| Expected Result | Performance Indicators | Targets | Actual and Historical Results |
|---|---|---|---|
| Increased partner countries’ enforcement of internationally accepted labour legislation | Percentage of technical assistance projects successfully implemented (i.e. developmental targets have been fully or partially met) Source: Labour Funding Program database |
85% | Actual Result: Historical Result: |
Program: Income Security
Sub-Program: Old Age Security
Sub-Program: Old Age Security Description
The Old Age Security (OAS) program is one of the cornerstones of Canada's public pension system. The objective of the OAS program is to ensure a minimum base upon which individuals can add income from other sources such as the Canada Pension Plan or Quebec Pension Plan, employer-sponsored pension plans and personal registered retirement savings plans, as well as investments and personal savings, to address their particular financial circumstances. The OAS program provides benefits to all seniors aged 65 and over who meet the legal status and residence requirements and to eligible low-income near-seniors. The benefits under the OAS program include the basic monthly OAS pension to eligible seniors aged 65 and over; the Guaranteed Income Supplement (GIS) for OAS pensioners with little or no income; as well as the income-tested Allowances for low-income individuals aged 60 to 64 who are the spouses or common-law partners of GIS recipients, or who are widows or widowers. Eligibility for OAS benefits is based on age, legal status and residence in Canada after the age of 18, and on income and marital status for the income-tested benefits targeted to low-income individuals. Service Canada’s delivery of OAS benefits involves: answering program queries through specialized call centres, the Internet and at in-person points of service; collecting and processing applications and issuing payments; monitoring of claims for accuracy; administering requests for reconsideration of a decision; client authentication and identification; and preventing, detecting and deterring fraud and abuse. This program uses funding from the following transfer payments:
- Old Age Security Pension
- Guaranteed Income Supplement
- Allowances
Sub-Program: Old Age Security Budgetary Financial Resources (dollars)*
| 2015–16 Planned Spending | 2015–16 Actual Spending | 2015–16 Difference (actual minus planned) |
|---|---|---|
| 46,185,505,159 | 45,645,829,008 | (539,676,151) |
*The difference is mainly attributable to an overestimation of the number of beneficiaries that receive OAS pension benefits and an overestimation of the OAS Benefit Repayment in the planned spending 2015–16.
Sub-Program: Old Age Security Human Resources (full-time equivalents – FTEs*)
| 2015–16 Planned | 2015–16 Actual | 2015–16 Difference (actual minus planned) |
|---|---|---|
| 1,387 | 2,010 | 623 |
*The difference between planned and actual FTE utilization is mainly a result of additional resources to address the demographically driven increase in service delivery workload requirements of the OAS program and realignment of resources between program activities due to shifting priorities.
Sub-Program: Old Age Security Performance Results
| Expected Results | Performance Indicators | Targets | Actual and Historical Results |
|---|---|---|---|
| Canada's eligible seniors have a basic income to live and receive the Old Age Security pension benefits to which they are entitled | Percentage of seniors receiving the Old Age Security pension in relation to the total number of eligible seniors (Old Age Security take-up rate) Source: Statistics Canada, custom tabulation from the Longitudinal Administrative Databank |
98% | Actual Result: Historical Results: |
Percentage of seniors receiving the Guaranteed Income Supplement in relation to the total number of eligible seniors (Guaranteed Income Supplement take-up rate) Source: Statistics Canada, custom tabulation from the Longitudinal Administrative Databank |
90% | Actual Result: Historical Results: |
|
| Eligible Old Age Security pension applicants receive a benefit payment in the right amount and in a timely manner | Percentage of Old Age Security basic benefits paid within the first month of entitlement Source: administrative data |
90% | Actual Result: Historical Results: |
Percentage of payment accuracy of Old Age Security/Guaranteed Income Supplement/Allowance and Allowance for the Survivor (12-month moving average) Source: administrative data |
95% | Actual Result: Historical Results: |
|
| Canadians have access to Old Age Security information through specialized call centres | Percentage of specialized calls answered by a Canada Pension Plan/Old Age Security agent within 10 minutes Source: administrative data |
80% | Actual Result: Historical Result: |
*Beginning in July 2013, seniors could defer receipt of their OAS pension and those seniors are included in this figure.
**The Canada Pension Plan (CPP), Canada Pension Plan Disability (CPPD) and Old Age Security (OAS) specialized call centres answered 86% of calls within 10 minutes, exceeding the established target. The target was exceeded in the CPP/OAS specialized call centres due to effective management of resources by efficiently scheduling off phone activities and effective peak management strategies, resulting in optimized performance.
Sub-Program: Canada Pension Plan
Sub-Program: Canada Pension Plan Description
The Canada Pension Plan (CPP) is an income security plan that is funded by the contributions of employees, employers and self-employed persons as well as the revenue earned on CPP investments. The CPP covers virtually all employed and self-employed persons in Canada, excluding Quebec, which operates its own comprehensive plan, the Quebec Pension Plan. The CPP is a main pillar of Canada’s retirement income system. In addition, it provides monthly income benefits in the event of death of the contributor. There are over 5 million recipients of benefits. The CPP is a statutory program that is governed by the federal government and the provinces. It is enabled by the CPP legislation and the Canada Pension Plan Investment Board Act. Applicants must meet the eligibility criteria in order to receive benefits. Service Canada’s delivery of CPP benefits involves: answering program queries through specialized call centres, the Internet and at in-person points of service; collecting and processing applications and issuing payments; monitoring of claims for accuracy; administering requests for reconsideration of a decision; client authentication and identification; and preventing, detecting and deterring fraud and abuse.
Sub-Program: Canada Pension Plan Budgetary Financial Resources (dollars)*
| 2015–16 Planned Spending | 2015–16 Actual Spending | 2015–16 Difference (actual minus planned) |
|---|---|---|
| 37,225,928,190 | 36,593,303,719 | (632,624,471) |
*The difference is mainly due to an overestimation of CPP benefits to be paid in the planned spending 2015–16.
Sub-Program: Canada Pension Plan Human Resources (full-time equivalents – FTEs)
| 2015–16 Planned | 2015–16 Actual | 2015–16 Difference (actual minus planned) |
|---|---|---|
| 1,378 | 1,320 | (58) |
Sub-Program: Canada Pension Plan Performance Results
| Expected Results | Performance Indicators | Targets | Actual and Historical Results |
|---|---|---|---|
| Eligible Canada Pension Plan contributors are provided with a measure of income security in the event of retirement | Proportion of new retirement pension beneficiaries receiving: the highest reduction for early take-up; no actuarial adjustment (65 years old); and any actuarial increases for late take-up Source: CPP Administrative Database |
(Actuarial reductions: 65%) (No actuarial adjustment: 30%) (Actuarial increases: 5%) | Actual Result: Historical Result: |
Percentage of Canada Pension Plan contributors aged 70+ not receiving retirement benefits Source: Office of the Superintendent of Financial Institutions |
1% | Actual Result: Historical Results:* |
|
| Eligible survivors and/or dependent children of deceased Canada Pension Plan contributors are protected against loss of earnings in the event of a contributor's death | Percentage of Canada Pension Plan contributors who have contributory coverage for survivor benefits Source: Office of the Superintendent of Financial Institutions |
75% | Actual Result: Historical Results:** |
| Eligible Canada Pension Plan retirement applicants receive a benefit payment in the right amount and in a timely manner | Percentage of Canada Pension Plan retirement benefits paid within the first month of entitlement Source: administrative data |
90% | Actual Result: Historical Results: |
Percentage of payment accuracy of Canada Pension Plan (12-month moving average) Source: administrative data |
95% | Actual Result: Historical Results: |
|
| Canadians have access to Canada Pension Plan information through specialized call centres | Percentage of specialized calls answered by a Canada Pension Plan/Old Age Security agent within 10 minutes Source: administrative data |
80% | Actual Result: Historical Result: |
*The Canada Pension Plan (CPP), Canada Pension Plan Disability (CPPD) and Old Age Security (OAS) specialized call centres answered 86% of calls within 10 minutes, exceeding the established target. The target was exceeded in the CPP/OAS specialized call centres due to effective management of resources, efficient scheduling of phone activities and effective peak management strategies, resulting in optimized performance.
**Historical results were revised based on the 2016 CPP Record of Earnings.
Sub-Program: Canada Pension Plan Disability Benefits
Sub-Program: Canada Pension Plan Disability Benefits Description
The Canada Pension Plan Disability (CPPD) benefit is designed to provide partial income replacement to eligible CPP contributors who are under age 65 with a severe and prolonged disability, as defined in the Canada Pension Plan legislation. There are two eligibility criteria for the CPPD program. First, applicants must have made contributions to the program in four of the last six years, with minimum levels of earnings in each of these years, or three of the last six years for those with 25 or more years of contributions. Second, they must demonstrate that their physical or mental disability prevents them from working regularly at any job that is substantially gainful, and that it is long term and of indefinite duration, or is likely to result in death. Children of CPPD beneficiaries are also eligible for a flat-rate monthly benefit up to the age of 18, or up to age 25 if attending school full-time. Service Canada’s delivery of CPPD benefits involves answering program queries through specialized call centres, the Internet and at in-person points of service; collecting and processing applications and issuing payments; monitoring of claims for accuracy; and administering requests for reconsideration of a decision.
Sub-Program: Canada Pension Plan Disability Benefits Budgetary Financial Resources (dollars)*
| 2015–16 Planned Spending | 2015–16 Actual Spending | 2015–16 Difference (actual minus planned) |
|---|---|---|
| 4,638,080,865 | 4,366,876,652 | (271,204,213) |
*The difference is mainly due to an overestimation of CPP disability benefits to be paid in the planned spending for 2015–16
Sub-Program: Canada Pension Plan Disability Benefits Human Resources (full-time equivalents – FTEs*)
| 2015–16 Planned | 2015–16 Actual | 2015–16 Difference (actual minus planned) |
|---|---|---|
| 1,329 | 1,028 | (301) |
*The difference between planned and actual FTE utilizations is mainly a result of a realignment of resources between program activities due to shifting priorities.
Sub-Program: Canada Pension Plan Disability Benefits Performance Results
| Expected Results | Performance Indicators | Targets | Actual and Historical Results |
|---|---|---|---|
| Eligible working-age Canadians with severe and prolonged disabilities have a measure of income security | Percentage of Canada Pension Plan (CPP) contributors who have contributory coverage for CPP-Disability Source: Office of the Superintendent of Financial Institutions |
68% | Actual Result: Historical Results: |
Percentage of beneficiaries who leave the benefit each year to return to work, excluding those who leave due to death or retirement Source: CPP administrative database |
Not applicable (contextual indicator) | Actual Result: Historical Results: |
|
| Canada Pension Plan disability benefit applicants receive a benefit payment decision in a timely manner | Percentage of Canada Pension Plan Disability initial application decisions made in 120 calendar days of receipt of a completed application Source: administrative data |
75% | Actual Result: Historical Results: |
| Clients making requests for reconsideration of CPPD decisions receive a reconsideration decision in a timely manner | Percentage of decisions made within 120 calendar days of receipt of the reconsideration request Source: administrative data |
70% | Actual Result: Historical Results: |
| Canadians have access to Canada Pension Plan disability benefit information through specialized call centres | Percentage of specialized calls answered by a Canada Pension Plan/Old Age Security agent within 10 minutes Source: administrative data |
80% | Actual Result: Historical Result: |
*The Department has been reviewing CPP Disability service standards in order to meet the commitments made in response to the 2015 Fall Report of the Auditor General of Canada on the Canada Pension Plan Disability (CPP-D) program. With an increased focus on CPP Disability service delivery, the network adjusted its workload management strategies and exceeded targets for the year.
**The Canada Pension Plan (CPP), Canada Pension Plan Disability (CPPD) and Old Age Security (OAS) specialized call centres answered 86% of calls within 10 minutes, exceeding the established target. The target was exceeded in the CPP/OAS specialized call centres due to effective management of resources by efficiently scheduling off phone activities and effective peak management strategies, resulting in optimized performance.
***Total beneficiaries who leave the benefit each year to return to work relative to total beneficiaries who leave the benefit each year (return to work, are deceased, the CPP retirement benefit).
Sub-Program: Canada Disability Savings Program
Sub-Program: Canada Disability Savings Program Description
Canadians with severe and prolonged disabilities often have low income and have to rely on family and others for support and care, leaving them financially vulnerable. The Registered Disability Savings Plan (RDSP) was introduced in 2008 to help people with disabilities achieve long-term financial security by providing a tool to encourage them and their families to save for the future. This program complements the RDSP by providing Canada Disability Savings Grants and Canada Disability Savings Bonds as additional supports to encourage savings. Canadian residents who have a Social Insurance Number and are eligible for the Disability Tax Credit can open an RDSP up until the end of the calendar year in which they turn 59, while grants and bonds can be paid up until the end of the calendar year in which they turn 49. Money paid to a beneficiary out of their RDSP will not affect their eligibility for federal benefits, such as the Canada Child Tax Benefit, the Goods and Services Tax/Harmonized Sales Tax Credit, Old Age Security and Employment Insurance. This program is enabled by the Income Tax Act, the Canada Disability Savings Act and associated Regulations.
This program uses funding from the following transfer payment(s): Canada Disability Savings Program – Grants and Bonds.
Sub-Program: Canada Disability Savings Program Budgetary Financial Resources (dollars)*
| 2015–16 Planned Spending | 2015–16 Actual Spending | 2015–16 Difference (actual minus planned) |
|---|---|---|
| 400,813,859 | 436,377,079 | 35,563,220 |
*The planned spending of bond and grant payments for the 2015–16 fiscal year was based on the estimated growth rate of registered plans and the observed average monthly payments of bonds and grants until September 2014. The difference between planned and actual spending of grants and bonds is largely explained by higher than anticipated take-up of the program.
Sub-Program: Canada Disability Savings Program Human Resources (full-time equivalents – FTEs)
| 2015–16 Planned | 2015–16 Actual | 2015–16 Difference (actual minus planned) |
|---|---|---|
| 24 | 22 | (2) |
Sub-Program: Canada Disability Savings Program Performance Results
| Expected Results | Performance Indicators | Targets | Actual and Historical Results |
|---|---|---|---|
| People with severe and prolonged disabilities have a measure of long-term financial security | Percentage of individuals (aged 0 to 49) in receipt of the Disability Tax Credit that have a Registered Disability Savings Plan Source: Canada Disability Savings Program Administrative Database and CRA DTC data |
17% | Actual Result: Historical Results: |
Percentage of individuals (aged 0 to 59) in receipt of the Disability Tax Credit that have a Registered Disability Savings Plan Source: Canada Disability Savings Program Administrative Database and CRA DTC data |
14% | Actual Result: Historical Results: |
|
Percentage of Registered Disability Savings Plans receiving a government contribution (a Canada Disability Savings Grant and a Canada Disability Savings Bond) Source: Canada Disability Savings Program Administrative Database and CRA DTC data |
30% | Actual Result: Historical Results:* |
|
| Eligible beneficiaries receive Canada Disability Savings Bonds | Average annual Canada Disability Savings Bond Source: Canada Disability Savings Program Administrative Database |
$1,700 | Actual Result: Historical Results: |
| Eligible beneficiaries receive Canada Disability Savings Grants | Average annual Canada Disability Savings Grant Source: Canada Disability Savings Program Administrative Database |
$4,300 | Actual Result: Historical Results: |
*Two mail-outs undertaken in 2015, targeting Canadians eligible for the Disability Tax Credit who do not have an RDSP, resulted in a significant increase in the number of RDSPs opened.
**The target was based on an indicator that measured the percentage of all beneficiaries with a registered plan who received both a bond and a grant payment. This indicator was reported up until 2013–14. The current indicator, which was first reported in the 2014–15 Departmental Performance Report, measures the percentage of all beneficiaries with a registered plan who received a bond and/or a grant. This better reflects the program’s performance because not all beneficiaries are eligible to receive a bond. Receiving a bond or a grant, or both, contributes to helping the long-term financial security of all people with severe disabilities and therefore best represents the purpose of the program.
***The actual result is higher than the target number due to a higher than expected take-up in new RDSPs as a result of a November 2015 mailout. A higher average bond payout occurred because most new plans attract bond from previous periods, resulting in very high payouts in the first year of a plan.
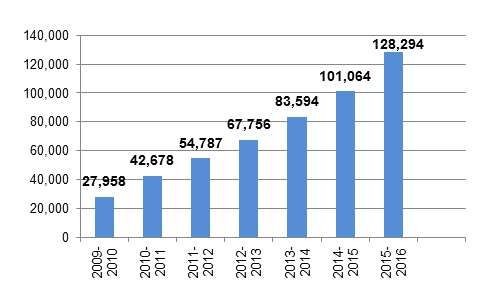
Text description of the Cumulative Registered Disability Savings Plan graph
| Fiscal Year | 2009-2010 | 2010-2011 | 2011-2012 | 2012-2013 | 2013-2014 | 2014-2015 | 2015-2016 |
|---|---|---|---|---|---|---|---|
| Cumulative Number of RDSPs | 27,958 | 42,678 | 54,787 | 67,756 | 83,594 | 101,064 | 128,294 |
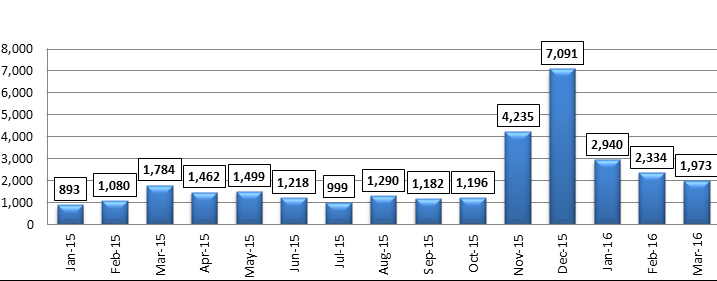
Text description of the New Registered Disability Savings Plans by Month graph
| Month | New Registered Savings Plans |
|---|---|
| January 2015 | 893 |
| February 2015 | 1080 |
| March 2015 | 1784 |
| April 2015 | 1462 |
| May 2015 | 1499 |
| June 2015 | 1218 |
| July 2015 | 999 |
| August 2015 | 1290 |
| September 2015 | 1182 |
| October 2015 | 1196 |
| November 2015 | 4235 |
| December 2015 | 7091 |
| January 2016 | 2940 |
| February 2016 | 2334 |
| March 2016 | 1973 |
Mail-outs
- February 2015
- November 2015
Sub-Program: National Child Benefit
Sub-Program: National Child Benefit Description
The National Child Benefit (NCB) initiative, a partnership among federal, provincial and territorial governments, with a First Nations component, is designed to help prevent and reduce the depth of child poverty, promote attachment to the labour market by ensuring families are always better off as a result of working and reduce program overlap and duplication. The NCB initiative provides income support and other benefits and services to low-income families with children. The Government of Canada’s contribution to the NCB initiative is the NCB Supplement. The NCB Supplement is an additional benefit paid to low-income families with children through the Canada Child Tax Benefit and complements other federal supports for families with children. While the NCB Supplement is delivered by the Canada Revenue Agency, ESDC is responsible for policy development with respect to the federal–provincial/territorial (F–P/T) NCB initiative and coordinates annual F–P/T reports to Canadians on progress.
Sub-Program: National Child Benefit Budgetary Financial Resources (dollars)*
| 2015–16 Planned Spending | 2015–16 Actual Spending | 2015–16 Difference (actual minus planned) |
|---|---|---|
| 182,665 | 137,834 | (44,831) |
*The variance is due to an unexpected employee departure.
Sub-Program: National Child Benefit Human Resources (full-time equivalents – FTEs*)
| 2015–16 Planned | 2015–16 Actual | 2015–16 Difference (actual minus planned) |
|---|---|---|
| 2 | 1 | (1) |
*The variance is due to an unexpected employee departure.
Sub-Program: National Child Benefit Performance Results
| Expected Result | Performance Indicators | Targets | Actual and Historical Results |
|---|---|---|---|
| Poverty among low-income families with children is reduced and prevented | Impact on child poverty, as measured by the percentage point change in the rate of children living below the after-tax low income cut-off (LICOs-AT) as a direct result of the NCB initiative in any given year – This is obtained by comparing a structure with the NCB initiative in place to the structure in place prior to the existence of the NCB initiative. Source: Statistics Canada Survey data (Canadian Income Survey) |
The low-income rate for children (based on LICOs-AT) will be at least 1.5 percentage points lower than it would have been without the NCB initiative in place | Actual Result: Historical Result: |
Impact on child poverty, as measured by the number of children prevented from living below the after-tax low income cut-off (LICOs-AT) as a direct result of the NCB initiative in any given year – This is obtained by comparing a structure with the NCB initiative in place to the structure in place prior to the existence of the NCB initiative. Source: Statistics Canada Survey data (Canadian Income Survey) |
The number of children prevented from living in low income (based on LICOs-AT) as a direct result of the NCB initiative will be at least 110,000 | Actual Result: Historical Result: |
*The performance results for the National Child Benefit Supplement were produced through simulation using Statistics Canada’s official source of income data. Beginning in 2012, that source of data became the Canadian Income Survey (CIS), which replaced the long-standing Survey of Labour and Income Dynamics (SLID). Simulation results for 2012 and subsequent years are not available. As announced in Budget 2016, the National Child Benefit is replaced with the new Canada Child Benefit. The Department of Finance will report on performance of the Canada Child Benefit going forward.
Program: Social Development
Sub-Program: Homelessness Partnering Strategy
Sub-Program: Homelessness Partnering Strategy Description
Homeless individuals and families can face a wide range of personal, financial and social challenges. Addressing these challenges in a sustainable manner requires the coordinated action of a number of partners including the federal government. The objective of the Homelessness Partnering Strategy is to support the implementation of effective, sustainable and community-based solutions to prevent and reduce homelessness across Canada. As a community-based strategy, it provides grant and contribution funding to communities and service providers across the country with a focus on the Housing First approach, providing access to permanent housing and supports to help clients remain housed. These services target individuals, families and Indigenous people who are homeless or at imminent risk of becoming homeless in major urban centres, rural communities and the North. Federal funding is prioritized based on input from Community Advisory Boards, in recognition that communities are best placed to identify their own unique homelessness-related needs. Complementary activities under the Strategy include promoting data development and collection; disseminating knowledge among communities, partners and stakeholders; and exploring innovative approaches to homelessness such as social enterprise. Grants to not-for-profit organizations, municipal governments, Band/tribal councils and other Indigenous organizations help communities more effectively address homelessness issues, and contributions to not-for-profit organizations, municipal governments, Band/tribal councils and other Indigenous organizations support activities to help alleviate and prevent homelessness across Canada. This program uses funding from the following transfer payment(s): Homelessness Partnering Strategy.
Sub-Program: Homelessness Partnering Strategy Budgetary Financial Resources (dollars)
| 2015–16 Planned Spending | 2015–16 Actual Spending | 2015–16 Difference (actual minus planned) |
|---|---|---|
| 119,091,348 | 116,151,358 | (2,939,990) |
Sub-Program: Homelessness Partnering Strategy Human Resources (full-time equivalents – FTEs)
| 2015–16 Planned | 2015–16 Actual | 2015–16 Difference (actual minus planned) |
|---|---|---|
| 128 | 122 | (6) |
Sub-Program: Homelessness Partnering Strategy Performance Results
| Expected Results | Performance Indicators | Targets | Actual and Historical Results |
|---|---|---|---|
| Housing stability for homeless individuals and those at risk of becoming homeless | Percentage of individuals receiving a housing loss prevention intervention who, when contacted at three months, had remained housed Source: Homelessness Electronic Reporting Information Network |
80%* | Actual Result: Historical Result: |
Reduction in the usage of emergency shelters, as measured by number of “bednights” utilized Source: National Homelessness Information System (NHIS) |
15% | Actual Result: |
|
Reduction in the estimated number of shelter users who are episodically or chronically homeless Source: National Homelessness Information System (NHIS) |
20% reduction from 2013 baseline | Actual Result: Historical Results:***** |
|
| Partners are engaged to maximize and coordinate collective efforts | Amount invested by external partners for every dollar invested by the Homelessness Partnering Strategy Source: Community Entity Activity Reporting |
$1.50 | Actual Result: Historical Results: |
*This target was set before the renewed 2014–19 Homelessness Partnering Strategy was implemented. As the transition to Housing First continues, fluctuations in the actual results will occur.
**Cumulative result since April 1, 2014. Data approved as of April 27, 2016. Not all of the 2015–16 data are available yet; this result includes what is available as of April 27, 2016.
***There is a lag in data availability.
****There was a 6.1% reduction from 2013 to 2014 and a 6.3% increase from 2014 to 2015, which essentially negated the gains from 2013 to 2014. Overall, when comparing 2015 to the 2013 baseline, there has been a 0.3% reduction in the number of chronic and episodic shelter users.
*****Historical results for 20 communities 2014: 2,392 (3.4% reduction) and 2013: 2,477 (baseline year).
******Data is not available for some of the original 20 sample communities. Therefore, the sample size used for 2015 is15 communities. Historical results have been updated to match sample size for accurate comparison.
Sub-Program: Social Development Partnerships Program
Sub-Program: Social Development Partnerships Program Description
The Social Development Partnerships Program makes strategic investments to support government priorities related to children and families, people with disabilities, the voluntary sector, official language minority communities and other vulnerable populations by playing a unique role in furthering broad social goals. It provides an opportunity to work in partnership with social not-for-profit organizations to help improve life outcomes of these target groups. Activities funded by the program are expected to lead to the development and sharing of knowledge of existing and emerging social issues; the creation of collaboration, partnerships, alliances and networks; and the development of approaches to respond to existing and emerging social issues. Over the long term, program support for these activities will help the not-for-profit sector and partners be more effective in addressing existing and emerging social issues, and will help target populations have access to information, programs and services tailored to their unique needs.
Sub-Program: Social Development Partnerships Program Budgetary Financial Resources (dollars)*
| 2015–16 Planned Spending | 2015–16 Actual Spending | 2015–16 Difference (actual minus planned) |
|---|---|---|
| 32,934,781 | 23,590,554 | (9,344,227) |
*The variance is mainly due to the Children and Families component of the Program which primarily develops intermediary model projects that leverage funds from partners across sectors to maximize the impact of federal funding for projects benefitting vulnerable populations. Developing projects under the intermediary model takes longer than in the previous funding model and therefore spending was lower than expected. Projects are currently being developed to maximize the Program’s budget going forward.
Sub-Program: Social Development Partnerships Program Human Resources (full-time equivalents – FTEs*)
| 2015–16 Planned | 2015–16 Actual | 2015–16 Difference (actual minus planned) |
|---|---|---|
| 110 | 87 | (23) |
*The difference between planned and actual FTE utilization can be explained by delays in staffing and unexpected departures.
Sub-Program: Social Development Partnerships Program Performance Results
| Expected Result | Performance Indicators | Targets | Actual and Historical Results |
|---|---|---|---|
| Not-for-profit sector and partners have improved capacity to respond to existing and emerging social issues for target populations | Percentage of Social Development Partnerships Program (SDPP) projects that leverage funds from non-federal partners Source: administrative data |
90% | Actual Result: Historical Result: |
*In the last fiscal year, only the Children and Families component of the SDPP was mandated leveraging. The Disability component is in the midst of a program renewal. While funding recipients were highly encouraged to leverage cash and/or in-kind funds, this was not currently a mandatory requirement of the Disability component. This accounts for the variance between actual results and the target.
Sub-Sub-Program: Children and Families
Sub-Sub-Program: Children and Families Description
Children and families can face unique personal, social and economic pressures which challenge their ability to adapt and thrive. As a result, families may experience a diminished quality of life, with limited ability to participate in the workplace or to contribute to their communities. With the objective of supporting the creation of more responsive programs, services or tools to better serve the diverse need of children and their families, particularly those living in disadvantaged circumstances, the Children and Families program makes strategic grant and contributions-based investments. Grant and contribution funding supports projects of the not-for-profit sector to meet the social needs and aspirations of children and families. Funding recipients are also encouraged to find new partners across the private and public sectors to complement federal money in order to maximize the effect of interventions on complex social issues at the community level. This program uses funding from the following transfer payment: Social Development Partnerships Program.
Sub-Sub-Program: Children and Families Budgetary Financial Resources (dollars)*
| 2015–16 Planned Spending | 2015–16 Actual Spending | 2015–16 Difference (actual minus planned) |
|---|---|---|
| 15,312,618 | 7,442,409 | (7,870,209) |
*This component of the program primarily develops intermediary model projects that leverage funds from partners across sectors to maximize the impact of federal funding for projects benefitting vulnerable populations. Developing projects under the intermediary model takes longer than in the previous funding model and therefore spending was lower than expected. Projects are currently being developed to maximize the program’s budget going forward.
Sub-Sub-Program: Children and Families Human Resources (full-time equivalents – FTEs*)
| 2015–16 Planned | 2015–16 Actual | 2015–16 Difference (actual minus planned) |
|---|---|---|
| 54 | 40 | (14) |
*The difference between planned and actual FTE utilization can be explained by delays in staffing and unexpected departures.
Sub-Sub-Program: Children and Families Performance Results
| Expected Result | Performance Indicators | Targets | Actual and Historical Results |
|---|---|---|---|
| Not-for-profit organizations have improved capacity to respond to existing and emerging social issues related to children and families | Percentage of SDPP Children and Families projects that leverage funds from non-federal partners Source: administrative data |
100% | Actual Result: Historical Results: |
Percentage of cash and/or in-kind resources invested by non-federal partners for every dollar invested through SDPP Children and Families projects ending in the 2015–16 fiscal year Source: administrative data |
200% | Actual Result: Historical Result: |
*Data not available; year-end project reports were not in at the time of compilation.
Sub-Sub-Program: Disability
Sub-Sub-Program: Disability Description
Canadians with disabilities can face unique personal, social and economic pressures. As a result, they may experience a diminished quality of life, with limited ability to participate in the workplace or to contribute to their communities. With the objective of promoting the full participation of Canadians with disabilities in learning, work and community life by increasing the effectiveness of the not-for-profit sector, this program makes strategic grant and contributions-based investments. Funded projects support a wide range of community-based initiatives that address social issues and barriers that face persons with disabilities. Funding recipients are encouraged to find new partners across the private and public sectors to complement federal money in order to maximize the effect of interventions on complex social issues at the community level. This program uses funding from the following transfer payment: Social Development Partnerships Program.
Sub-Sub-Program: Disability Budgetary Financial Resources (dollars)
| 2015–16 Planned Spending | 2015–16 Actual Spending | 2015–16 Difference (actual minus planned) |
|---|---|---|
| 17,622,163 | 16,148,145 | (1,474,018) |
Sub-Sub-Program: Disability Human Resources (full-time equivalents – FTEs)
| 2015–16 Planned | 2015–16 Actual | 2015–16 Difference (actual minus planned) |
|---|---|---|
| 56 | 47 | (9) |
Sub-Sub-Program: Disability Performance Results
| Expected Result | Performance Indicators | Targets | Actual and Historical Results |
|---|---|---|---|
| Not-for-profit organizations have improved capacity to respond to existing and emerging social issues related to disabilities | Percentage of SDPP Disability projects that leverage funds from non-federal partners Source: administrative data |
90% | Actual Result: Historical Result: |
Percentage of cash and/or in-kind resources invested by non-federal partners for every dollar invested through SDPP Disability Source: administrative data |
15% | Actual Result: Historical Result: |
*During the 2015–16 period, 12 out of 19 organizations reported leveraged funds (either cash or in-kind) from other sources than federal partners. It should be noted that projects funded under the 2012 call for proposals did not have a leveraging requirement.
Sub-Program: New Horizons for Seniors Program
Sub-Program: New Horizons for Seniors Program Description
The growth in the population of seniors in Canada is accelerating, with the total number of seniors projected to reach approximately 10 million by 2036. This presents both opportunities and risks for seniors and their communities. Empowering seniors, encouraging them to share their knowledge, skills and experience with others in the community, and enhancing seniors' social well-being and community vitality are goals of the New Horizons for Seniors Program. This program provides grants and contributions funding for projects led or inspired by seniors who want to make a difference in the lives of others and in their communities. The program has five objectives: promoting volunteerism among seniors and other generations; engaging seniors in the community through mentoring of others; expanding awareness of elder abuse, including financial abuse; supporting social participation and inclusion of seniors; and providing capital assistance for new and existing community projects and/or programs for seniors. Community-based projects are typically eligible to receive up to $25,000 in grant funding per project for up to one year. Pan-Canadian projects are eligible to receive up to $750,000 for up to three years in duration. In order to test elements of the Social Partnerships Agenda in the New Horizons for Seniors Program, pilot projects involving the leveraging of funds commenced in 2014–15 for a period of two years. This program is complemented by a range of policies, programs and services targeted at seniors such as the Canada Pension Plan, Old Age Security and the National Seniors Council. This program uses funding from the following transfer payment: New Horizons for Seniors Program.
Sub-Program: New Horizons for Seniors Program Budgetary Financial Resources (dollars)
| 2015–16 Planned Spending | 2015–16 Actual Spending | 2015–16 Difference (actual minus planned) |
|---|---|---|
| 48,987,508 | 42,864,123 | (6,123,385) |
Sub-Program: New Horizons for Seniors Program Human Resources (full-time equivalents – FTEs)
| 2015–16 Planned | 2015–16 Actual | 2015–16 Difference (actual minus planned) |
|---|---|---|
| 51 | 60 | 9 |
Sub-Program: New Horizons for Seniors Program Performance Results
| Expected Result | Performance Indicators | Targets | Actual and Historical Results |
|---|---|---|---|
| Seniors participate in and contribute to communities | Total number of New Horizons for Seniors Program projects that primarily promote volunteerism among seniors and other generations Source: administrative data |
230 | Actual Result:* Historical Results: |
Total number of New Horizons for Seniors Program projects that primarily engage seniors in the community through mentoring of others Source: administrative data |
298 | Actual Result:* Historical Results: |
|
Total number of New Horizons for Seniors Program projects that primarily expand awareness of elder abuse Source: administrative data |
120 | Actual Result: Historical Results: |
|
Total number of New Horizons for Seniors Program projects that primarily support social participation and inclusion of seniors Source: administrative data |
1,269** | Actual Result: Historical Results: |
*Targets were set based on actual data of completed projects from two preceding years. The types of projects completed vary year to year depending on the uptake, making it difficult to forecast (as targets) the precise number of projects for each of the five program objectives. Furthermore, despite the expressed objective in the application, most projects conduct activities that address more than one of the five program objectives.
**Targets were set based on trends of historical actual data from the 2012–13 and 2013–14 calls for proposals.
Sub-Program: Universal Child Care Benefit
Sub-Program: Universal Child Care Benefit Description
The Universal Child Care Benefit (UCCB) provides financial support to help all Canadian families with young children choose the child care option that best suits their families’ needs, whether they work in the paid labour force or stay at home with their children, or live in a small town, rural community or large urban centre. Effective January 1, 2015, the UCCB was enhanced to provide eligible families with $160 per month (up to $1,920 per year) for each child under age six, and a new benefit of $60 per month (up to $720 per year) for each child aged six through 17. The new amounts began to be reflected in month payments to recipients in July 2015 and included payments retroactive to January 2015. UCCB benefits do not affect the eligibility of families to receive other benefits under the Canada Child Tax Benefit and the National Child Benefit Supplement programs, or the Child Care Expense Deduction. The UCCB is enabled by the Universal Child Care Benefit Act.
The UCCB was replaced by the new Canada Child Benefit (CCB) effective July 1, 2016.
Sub-Program: Universal Child Care Benefit Budgetary Financial Resources (dollars)*
| 2015–16 Planned Spending | 2015–16 Actual Spending | 2015–16 Difference (actual minus planned) |
|---|---|---|
| 2,851,851,926 | 8,763,436,033 | 5,911,584,107 |
*The variance between 2015–16 planned and actual spending is mainly the result of the Budget 2015 enhancements to the UCCB program that became effective in January 2015.
Sub-Program: Universal Child Care Benefit Human Resources (full-time equivalents – FTEs)
| 2015–16 Planned | 2015–16 Actual | 2015–16 Difference (actual minus planned) |
|---|---|---|
| 4 | 4 | - |
Sub-Program: Universal Child Care Benefit Performance Results
| Expected Result | Performance Indicators | Targets | Actual and Historical Results |
|---|---|---|---|
| Canadian parents with children under age 18 have financial support for choice in child care | Percentage of eligible children for whom parents are receiving the UCCB (UCCB take-up rate) Source: Canada Revenue Agency and Statistics Canada Population Estimates |
97% | Actual Result: Historical Results: |
Sub-Program: Enabling Accessibility Fund
Sub-Program: Enabling Accessibility Fund Description
People with disabilities often experience barriers to their full participation and inclusion in activities of everyday living. The objective of the Enabling Accessibility Fund is to improve accessibility, remove barriers and enable Canadians with disabilities to participate in and contribute to their community. The Fund supports capital costs of construction and renovations related to improving accessibility and safety for people with disabilities in Canadian communities and workplaces. Grants or contributions are provided to eligible recipients for capital cost projects that increase access for people with disabilities to their programs and services or create employment opportunities for people with disabilities. This program uses funding from the following transfer payment: Enabling Accessibility Fund.
Sub-Program: Enabling Accessibility Fund Budgetary Financial Resources (dollars)
| 2015–16 Planned Spending | 2015–16 Actual Spending | 2015–16 Difference (actual minus planned) |
|---|---|---|
| 17,131,891 | 14,783,610 | (2,348,281) |
Sub-Program: Enabling Accessibility Fund Human Resources (full-time equivalents – FTEs*)
| 2015–16 Planned | 2015–16 Actual | 2015–16 Difference (actual minus planned) |
|---|---|---|
| 36 | 14 | (22) |
*The difference between planned and actual FTE utilization can be explained by delays in staffing and unexpected departures.
Sub-Program: Enabling Accessibility Fund Performance Results
| Expected Results | Performance Indicators | Targets | Actual and Historical Results |
|---|---|---|---|
| Recipient organizations have accessible facilities, technologies and transportation | Number of communities with funded projects Source: administrative data |
172 | Actual Result: Historical Results: |
Percentage of project costs for funded projects that are from other sources of funding Source: administrative data |
35% | Actual Result: Historical Results: |
|
| Accessible communities and workplaces which allow people with disabilities to have access to programs, services and employment opportunities | Accessible communities and workplaces which allow people with disabilities to have access to programs, services and employment opportunities Number of job opportunities created or maintained as a result of the project Source: administrative data Source: administrative data |
Not applicable*** | Actual Result: Historical Result: |
*The program exceeded the target due to a greater number of projects funded in comparison to previous years.
**Program funding is often allocated towards the accessibility portions of larger infrastructure projects. For the 2015 call for proposals, the maximum allowable program funding per project was set at $50,000 with a mandatory leveraging of 35% from other sources of funding. The program exceeded the target significantly since half of funded projects had a total project cost between $77,000 and $16.1 million; therefore, most of the project costs were funded from other sources.
***The number of people that benefit from this program greatly depends on the types of projects that are funded (small versus mid-sized projects, community versus workplace projects). There currently is not enough data collected to provide a target for this measure, but with time the Department will be able to aggregate and analyze data and identify a target in future years.
Sub-Program: Federal Income Support for Parents of Murdered or Missing Children
Sub-Program: Federal Income Support for Parents of Murdered or Missing Children Description
The Federal Income Support for Parents of Murdered or Missing Children is an income support grant available to eligible parents who have suffered a loss of income as a result of taking time away from work to cope with the death or disappearance of their child (or children) under the age of 18 as a result of a probable Criminal Code offence. This program uses funding from the following transfer payment: Federal Income Support for Parents of Murdered or Missing Children.
Sub-Program: Federal Income Support for Parents of Murdered or Missing Children Performance Analysis and Lessons Learned
Despite ongoing efforts by ESDC since 2013 to increase public and stakeholder awareness of the grant, take-up continues to be lower than estimated. The program continues to engage key stakeholders while seeking opportunities to promote the Parents of Murdered or Missing Children grant. Awareness raising activities include encouraging partners to promote the program, engaging law enforcement agencies, and increasing awareness among missing children networks and victims’ support organizations.
Sub-Program: Federal Income Support for Parents of Murdered or Missing Children Budgetary Financial Resources (dollars)*
| 2015–16 Planned Spending | 2015–16 Actual Spending | 2015–16 Difference (actual minus planned) |
|---|---|---|
| 11,660,729 | 275,189 | (11,385,540) |
*When the Parents of Murdered or Missing Children grant was launched on January 1, 2013, the forecast was based on available data and interdepartmental consultations. Despite ongoing efforts by ESDC since 2013 to increase public and stakeholder awareness of the grant, take-up continues to be lower than estimated. The program continues to engage key stakeholders while seeking opportunities to promote the Parents of Murdered or Missing Children grant. Awareness raising activities include encouraging partners to promote the program, engaging federal and provincial law enforcement agencies, and increasing awareness among missing children networks and victims’ support organizations.
Sub-Program: Federal Income Support for Parents of Murdered or Missing Children Human Resources (full-time equivalents – FTEs*)
| 2015–16 Planned | 2015–16 Actual | 2015–16 Difference (actual minus planned) |
|---|---|---|
| 16 | 2 | (14) |
*The difference between planned and actual FTE utilization is mainly due to a reflection of workforce requirements based on actual program workload.
Sub-Program: Federal Income Support for Parents of Murdered or Missing Children Performance Results
| Expected Results | Performance Indicators | Targets | Actual and Historical Results |
|---|---|---|---|
| The financial burden on parents of children who are deceased or missing due to a probable Criminal Code offence and who take time away from work to cope with the tragic situation is eased | Proportion of successful applicants Source: administrative data |
Not applicable | Actual Result: Historical Results: |
Average number of weeks paid per incident** Source: administrative data |
Not applicable | Actual Result: Historical Results: |
|
| Parents receive an initial benefit payment or a non-payment notification in a timely manner | Percentage of initial Federal Income Support for Parents of Murdered or Missing Children payments or non-payment notifications issued within 35 calendar days Source: administrative data |
90% | Actual Result: Historical Results: |
*There is a time lag in the availability of data.
**The recipients are able to share a grant related to the same incident.
***Due to the sensitive nature of this grant, and that take-up continues to be lower than estimated, processing staff have been able to prioritize their work in order to achieve high results. In addition, collaboration with clients and victims services agencies has been highly effective.