
Section II: Expenditure Overview - DPR 2015-16
Actual Expenditures
Budgetary Financial Resources (dollars)
The following table summarizes National Defence’s total planned and actual spending for fiscal year (FY) 2015-16.
| 2015–16 Main Estimates |
2015–16 Planned Spending | 2015–16 Total Authorities Available for Use |
2015–16 Actual Spending(authorities used) |
Difference(actual minus planned) |
|---|---|---|---|---|
| 18,942,053,629 | 18,942,053,629 | 19,997,410,380 | 18,666,073,243 | (275,980,386) |
National Defence’s final authorities for 2015-16 were $19,997.4 million while actual expenditures were $18,666.1 million. The difference between total authorities and actual spending of $1,331.3* million consists of:
- $1,203.6 million in authorities that will be available to the Department in future years related primarily to:
- $706.0 million for adjustments to spending on major capital equipment and infrastructure;
- $200.2 million in operating funding carry forward;
- $181.3 million for collective bargaining agreements;
- $61.8 million for Federal Contaminated Sites;
- $50.0 million for the Federal Investment Infrastructure Plan; and
- $4.3 million in proceeds from the disposal of surplus Crown assets.
- $36.1 million related primarily to:
- $5.3 million for Canada’s international operations; and
- $30.8 million in other frozen allotments.
- $91.8 million in residual lapses related to:
- $14.6 million lower than planned contribution payments; and
- $77.2 million lower than planned in capital projects due to issues such as price reductions through negotiations, vendor performance and fluctuating exchange rates.
*Note: Due to rounding, figures may not add up to totals shown.
Departmental Spending for 2015-16 by Program (dollars)
Description of Figure: Departmental Spending for 2015-16 by Program (dollars)
This pie chart illustrates the Department of National Defence’s spending for Fiscal Year 2015-16, broken down by Program.
The percentages allocated to each section, from largest to smallest, are:
- 67%, $12,577,878,081 for Defence Capability Element Production;
- 18%, $3,401,386,557 for Defence Ready Force Element Production;
- 7%, $1,360,079,139 for Defence Combat and Support Operations;
- 3%, $453,694,400 for Defence Services and Contributions to Government;
- 2%, $448,245,658 for Internal Services; and
- 2%, $424,789,408 for Defence Capability Development and Research.
Human Resources (Full-Time Equivalents [FTEs])
The Regular Force personnel total strength is currently 2,000 personnel below its authorized strength of 68,000 +/- 500, due to unachieved recruiting targets and higher than anticipated attrition. Enhanced recruiting and retention strategies have been developed which will increase intake and mitigate attrition in order to enable the Regular Force to attain its full authorized strength as soon as practicable.
National Defence’s civilian population increased slightly; however, the approved 24,418 civilian FTE ceiling was not reached. The Department is in a transition period and is currently focussed on aligning civilian resources with renewed departmental priorities which will help ensure that we have the right people, in the right place, at the right time while respecting human resources and budget allocations.
| Planned | Actual | Difference (actual minus planned) | |
|---|---|---|---|
| Military – Regular Force | 68,000 | 65,879 | (2,121) |
| Civilian | 24,418 | 22,154 | (2,264) |
| TOTAL | 92,418 | 88,033 | (4,385) |
Notes:
- One FTE does not necessarily equal one employee (i.e. two part-time employees may count as one FTE). See Appendix: Definitions.
- Regular Force personnel strength is measured as the total Regular Force population regardless of their status, and therefore includes an average of 1,100 personnel on leave without pay (90% related to parental leave), 1,650 personnel on Service Personnel Holding List and Retirement Leave, and 8,000 personnel on basic training and subsidized university training.
- Due to rounding, the FTE count at the Sub-Program and the Sub-Sub-Program levels may not add up to the totals shown.
Human Resources – Reserve Force Personnel
The Reserve Force is a unique and valued component of the Canadian Armed Forces. The Primary Reserve is currently below the Government of Canada-directed average paid strength due to a higher than forecasted attrition and challenges in meeting recruiting quotas. Mitigating actions are underway to improve recruiting success and to reduce voluntary attrition in order to re-establish and expand the Primary Reserve’s strength by 1,500 to a Government-authorized 28,500 personnel. In addition, the CAF Regular Force recruiting plan includes the annual component transfer of 800 personnel from the Primary Reserve. The remaining two active sub-components of the Reserve Force – the Canadian Rangers and the Cadet Organization Administration and Training Service – were maintained at the current approved total strength targets of 5,000 and 8,000 respectively. Institutionally, a major review of Primary Reserve requirements will continue so as to ensure the allocation and employment of personnel is consistent with Defence priorities, is sustainable and remains within Government of Canada direction.
The following table summarizes National Defence’s total planned and actual human resources for Reserve Force Personnel for FY 2015-16 16.
| Planned | Actual | Difference (actual minus planned) | |
|---|---|---|---|
| Primary Reserve | 27,000 | 21,636 | (5,364) |
| Cadet Organization Administration and Training Service | 8,000 | 7,625 | (375) |
| Canadian Rangers | 5,000 | 5,016 | 16 |
| Programs, and Internal Services |
2015-16 Main Estimates |
2015-16 Planned Spending |
2016-17 Planned Spending |
2017-18 Planned Spending |
2015-16 Total Authorities Available for Use |
2015-16 Actual Spending (authorities used) |
2014-15 Actual Spending (authorities used) |
2013-14 Actual Spending (authorities used) |
| 1.0 Defence Combat and Support Operations |
1,294,500,580 |
1,294,500,580 |
1,235,618,328 |
1,248,194,497 |
1,577,586,094 |
1,360,079,139 |
1,229,363,372 |
1,488,574,710 |
| 2.0 Defence Services and Contributions to Government |
382,286,293 |
382,286,293 |
323,558,922 |
325,949,892 |
388,622,170 |
453,694,400 |
497,418,597 |
520,303,388 |
| 3.0 Defence Ready Force Element Production |
3,102,147,905 |
3,102,147,905 |
3,469,027,157 |
3,505,575,556 |
3,245,508,752 |
3,401,386,557 |
3,284,882,232 |
3,340,624,380 |
| 4.0 Defence Capability Element Production |
13,336,464,765 |
13,336,464,765 |
12,775,597,776 |
13,540,527,595 |
13,933,619,105 |
12,577,878,081 |
12,504,965,147 |
12,464,777,545 |
| 5.0 Defence Capability Development and Research |
373,537,801 |
373,537,801 |
397,614,790 |
401,175,948 |
384,217,147 |
424,789,408 |
462,489,089 |
437,853,050 |
| 6.0 Internal Services |
453,116,285 |
453,116,285 |
438,851,960 |
440,638,054 |
467,857,112 |
448,245,658 |
474,820,024 |
512,241,132 |
| Total |
18,942,053,629 |
18,942,053,629 |
18,640,268,933 |
19,462,061,542 |
19,997,410,380 |
18,666,073,243 |
18,453,938,461 |
18,764,374,206 |
Sources: Vice-Chief of the Defence Staff Group / Assistant Deputy Minister (Finance) / Chief Financial Officer Group
Notes:
- Due to rounding, figures may not add up to totals shown.
- Where the actual spending amount is higher than the total authorities, this does not represent an over-expenditure of Parliamentary authorities. Parliamentary authorities are allocated by vote and not by individual Programs, Sub-Programs, and Sub-Sub Programs.
- Significant variances in financial resources are explained below and complemented in Section IV of this report.
The differences between planned and final spending authorities used are summarized as follows:
| Explanation of Change |
Change (dollars) |
| Funding in Statutory related to military Employee Benefit Plans |
289,393,788 |
| Funding related to military operations overseas |
204,126,571 |
| Funding associated with Federal Infrastructure Investment Plan |
169,837,019 |
| Other miscellaneous departmental requirements |
19,414,747 |
| Total Increases |
682,772,125 |
| Net adjustments to the spending profile of major capital equipment and infrastructure projects to align financial resources with project acquisition timeliness |
(838,540,982) |
| Funding related to the Canadian Forces Superannuation Act |
(73,085,353) |
| Net transfers to Other Government Organizations |
(29,382,040) |
| Funding related to Grants and Contributions Programs |
(17,744,136) |
| Total Decreases |
(958,752,511) |
| Net Change |
(275,980,386) |
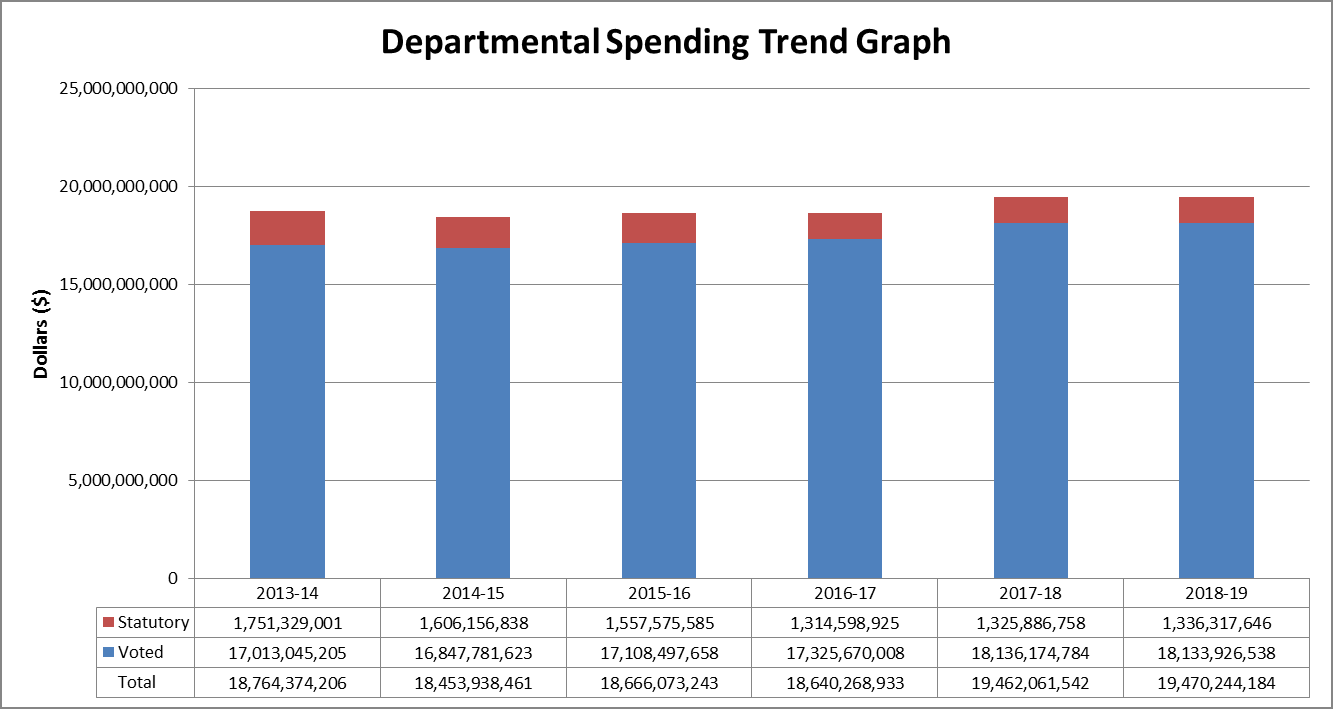
Departmental Spending Trend Graph
Description of Figure: Departmental Spending Trend Graph
This bar graph depicts Defence's financial spending trend starting with fiscal year 2013-14.
On the Y-axis are dollars ranging from 0 to 25,000,000,000. On the X-axis is Fiscal Year 2013-14 through 2018-19.
Statutory Financial Spending Trend is:
- $1,751,329,001 in 2013-14;
- $1,606,156,838 in 2014-15;
- $1,557,575,585 in 2015-16;
- $1,314,598,925 in 2016-17;
- $1,325,886,758 in 2017-18; and
- $1,336,317,646 in 2018-19
Voted Financial Spending Trend is:
- $17,013,045,205 in 2013-14;
- $16,847,781,623 in 2014-15;
- $17,108,497,658 in 2015-16;
- $17,325,670,008 in 2016-17;
- $18,136,174,784 in 2017-18; and
- $18,133,926,538 in 2018-19.
Total Financial Spending Trend is:
- $18,764,374,206 in 2013-14;
- $18,453,938,461 in 2014-15;
- $18,666,073,243 in 2015-16;
- $18,640,268,933 in 2016-17;
- $19,462,061,542 in 2017-18; and
- $19,470,244,184 in 2018-19.
Departmental Spending Trend
- Total spending for 2013-14, 2014-15, and 2015-16 represent the final spending on a cash basis, as provided in the Public Accounts.
- Planned spending for 2016-17, 2017-18, and 2018-19 as provided in the Report on Plans and Priorities 2016-17.
- Spending includes Internal Services.
Actual spending for 2015-16 is higher than planned spending for 2016-17. Major contributing factors to the net change include funding related to military operations overseas, the Federal Infrastructure Investment Plan and adjustments to the spending profile of major capital equipment and infrastructure projects in order to align financial resources with project acquisition timelines.
Expenditures by Vote
For information on National Defence’s organizational voted and statutory expenditures, consult the Public Accounts of Canada 2016 17.
Alignment of Spending with the Whole-of-Government Framework
Alignment of 2015-16 Planned Spending with the Whole-of-Government Framework 18 (dollars)
| Program |
Sub-Program |
Spending Area |
Government of Canada Outcome |
2015-16 |
| 1.0 Defence Combat and Support Operations |
1.1 Domestic and Continental Defence Operations |
Social Affairs |
A safe and secure Canada |
213,343,198 |
| 1.2 International Combat Operations |
International Affairs |
A safe and secure world through international engagement |
383,438,209 |
|
| 1.3 Ongoing Centralized Operations and Operational Enablement |
International Affairs |
A safe and secure world through international engagement |
763,297,732 |
|
| 2.0 Defence Services and Contributions to Government |
2.1 Disaster Relief and Humanitarian Operations |
International Affairs |
A safe and secure world through international engagement |
24,511,999 |
| 2.2 Defence Services for Canadian Safety and Security |
Social Affairs |
A safe and secure Canada |
108,831,628 |
|
| 2.3 Military Heritage and Outreach |
Social Affairs |
A vibrant Canadian culture and heritage |
320,350,773 |
|
| 3.0 Defence Ready Force Element Production |
3.1 Force Elements Readiness Sustainment |
Social Affairs |
A safe and secure Canada |
770,730,696 |
| 3.2 Force Elements Integration Training |
Social Affairs |
A safe and secure Canada |
314,641,278 |
|
| 3.3 Force Elements Production |
Social Affairs |
A safe and secure Canada |
1,783,173,839 |
|
| 3.4 Operational Readiness Production, Coordination and Command and Control |
Social Affairs |
A safe and secure Canada |
532,840,744 |
|
| 4.0 Defence Capability Element Production |
4.1 Military Personnel and Organization Lifecycle |
Social Affairs |
A safe and secure Canada |
3,717,170,522 |
| 4.2 Materiel Lifecycle |
Social Affairs |
A safe and secure Canada |
6,065,754,232 |
|
| 4.3 Real Property Lifecycle |
Social Affairs |
A safe and secure Canada |
2,024,596,124 |
|
| 4.4 Information Systems Lifecycle |
Social Affairs |
A safe and secure Canada |
770,357,203 |
|
| 5.0 Defence Capability Development and Research |
5.1 Capability Design, Development and Integration |
Social Affairs |
A safe and secure Canada |
387,949,569 |
| 5.2 Strategic Direction and Planning Support |
Social Affairs |
A safe and secure Canada |
36,839,839 |
Total Spending by Spending Area (dollars)
| Spending Area | Total Planned Spending | Total Actual Spending |
|---|---|---|
| Economic Affairs | 0 | 0 |
| Social Affairs | 17,422,774,199 | 17,046,579,645 |
| International Affairs | 1,066,163,147 | 1,171,247,940 |
| Government Affairs | 0 | 0 |
| Total (does not include Internal Services) | 18,488,937,346 | 18,217,827,585 |
Financial Statements
The Department’s financial statements 19 can be found on the National Defence website.
Financial Statements Highlights
The financial information presented within this report is intended to serve as a general overview of National Defence’s financial position and operations.
| Financial Information |
2015-16 |
2015-16 |
2014-15 |
Difference (2015-16 actual minus 2015-16 planned) |
Difference (2015-16 actual minus 2014-15 actual) |
| Total expenses |
19,580,125,000 |
20,003,676,991 |
19,170,851,515 |
423,551,991 |
832,825,476 |
| Total revenues |
463,781,000 |
578,893,293 |
600,889,739 |
115,112,293 |
(21,996,446) |
| Net cost of operations before government funding and transfers |
19,116,344,000 |
19,424,783,698 |
18,569,961,776 |
308,439,698 |
854,821,922 |
Note: The Departmental Financial Statement is prepared on an accrual accounting basis in accordance with Treasury Board Accounting Standard 1.2 and includes non-cash transactions. Financial information provided in other sections of the 2015-16 Departmental Performance Report is cash-based (planned and actual spending) and tied to annual Parliamentary Appropriations (Authorities).
| Financial Information |
2015-16 |
2014-15 |
Difference |
| Total net liabilities |
5,474,333,480 |
5,055,083,243 |
419,250,237 |
| Total net financial assets |
3,228,020,132 |
2,885,595,960 |
342,424,172 |
| Departmental net debt |
2,246,313,348 |
2,169,487,283 |
76,826,065 |
| Total non-financial assets |
39,270,565,236 |
39,307,671,596 |
(37,106,360) |
| Departmental net financial position |
37,024,251,888 |
37,138,184,313 |
(113,932,425) |