
2024–25 Departmental Results Report
On this page
Copyright information
© His Majesty the King in Right of Canada, as represented by the Minister of Industry and Minister
responsible for Canada Economic Development for Quebec Regions, 2025
Catalogue Number: Iu90-1/16E-PDF
ISSN: 2561-0015
Aussi disponible en français sous le titre : Rapport
sur les résultats ministériels 2024-2025
Results at a glance
This departmental results report details the actual accomplishments of Canada Economic Development for Quebec Regions (CED) against the plans, priorities and expected results outlined in its 2024–25 Departmental Plan.
Key priorityCED identified the following key priority for 2024–25:
- Invest strategically in the sustainable and inclusive growth of SMEs and communities
In an economic context marked by uncertainty and new challenges for businesses, Canada Economic Development for Quebec Regions (CED) continued to implement its programs aimed at supporting the competitiveness, inclusive growth and sustainable vitality of Quebec’s small and medium-sized enterprises (SMEs) and communities. Building on its strong regional presence and its proximity to businesses and communities, CED worked closely with its local, provincial and federal partners to optimize the scope of its interventions; ensure the complementarity of its efforts; and strengthen its niche in the federal program continuum. By responding strategically, the Agency has been able to maximize its impact and added value. Among CED’s strategic investments, of particular note are those targeting the adoption of cutting-edge technologies and the development of innovative solutions, notably in the residential construction industry; the integration of artificial intelligence; the sustainable reindustrialization of Montréal’s east end; and the growth of the tourism sector.
Highlights for CED in 2024–25
- Total actual spending (including internal services): $337,630,440
- Total full-time equivalent staff (including internal services): 378
For complete information on CED’s total spending and human resources, read the Spending and human resources section of its full departmental results report.
Summary of results
The following provides a summary of the results the department achieved in 2024–25 under its main areas of activity, called “core responsibilities.”
-
Core responsibility 1: Develop Quebec’s economy
Actual spending: $312,884,341
Actual full-time equivalent staff: 211In 2024–25, CED continued to support SMEs and communities in all regions of Quebec through its programs and services and its ongoing collaboration with various economic players and regional partners. Through investments totalling $282.4M in 913 projects, CED was a key partner in terms of helping businesses grow, innovate, penetrate new markets and become more competitive. CED also signed 609 new funding agreements that will ultimately contribute to creating or maintaining nearly 4,900 jobs through total investments of $1,836.4M from both CED and other partners.
At the same time, CED monitored its $3B investment portfolio, notably supporting businesses with respect to their projects approved in previous years to ensure the completion of these projects and the collection of repayable contributions.
The following is an overview of the results achieved for the various key themes.
New temporary and targeted initiatives
Remaining agile and proactive in order to respond to the emerging needs of its clients and to government priorities, CED implemented three new initiatives in 2024–25: the Northern Isolated Community Initiatives (NICI) Fund - Canada.ca, the Regional Artificial Intelligence Initiative (RAII) and the Regional Homebuilding Innovation Initiative (RHII). By adapting its programs and services, CED has helped build a more resilient, sustainable and inclusive economy for Canadians.
Business innovation, productivity and growth
Through targeted investments, CED has fostered innovation, productivity and growth among Quebec businesses by supporting, either directly or with the help of specialized organizations, the adoption of new cutting-edge technologies such as robotization and digitization. CED also helped businesses become more competitive on international markets (in compliance with applicable international agreements), while promoting the capabilities of SMEs and research centres among major contractors, particularly those with ties to defence markets. CED has made extensive efforts to showcase Quebec’s expertise among major contractors in order to increase business opportunities arising from the Industrial and Technological Benefits (ITB) Policy in Quebec.
Inclusive economy
CED pursued its efforts to encourage greater economic participation by rural communities and under represented groups in local development and community vitality efforts by supporting projects such as those targeting the development and upgrading of regional tourism destinations and social economy enterprises. With a view to upholding the principles of equity, diversity and inclusion (EDI), CED maintained its commitment to promoting inclusive economic participation: of the projects approved, 262 (43%) had a proponent from at least one under-represented group. In addition, 465 approved projects (76%) were submitted by proponents who indicated that they intended to initiate or pursue EDI efforts in their organizational practices. Furthermore, with a view to ensuring equitable regional coverage, CED invested in 97 of Quebec’s 104 regional county municipalities (RCMs) in order to promote prosperous and inclusive economies in all regions of the province.
Green economy
In line with its 2023–27 Departmental Sustainable Development Strategy and its Accelerating the Green Transition action plan, CED continued to support SMEs and regional economies, thereby contributing to Canada’s ambitious objectives for fighting climate change and protecting the environment. The Agency funded 183 green projects worth a total of $65.4M; of this amount, $19.4M was dedicated to clean technologies, thus helping to improve the environmental performance of businesses and communities. This funding supported projects that, for example, significantly reduce environmental impacts, limit greenhouse gas emissions, minimize the degradation of natural environments, or optimize resource use. CED actually exceeded its investment target of $45M for 2024–25 and has relaxed its funding conditions to encourage businesses to go ahead with their projects.
Business Information Services
For the second year in a row, Quebec’s small businesses and aspiring entrepreneurs had access to CED’s Business Information Services. This single window provides support for users and directs them to funding programs, including CED programs, as well as to resources tailored to their business needs. Furthermore, against a backdrop of protectionism and tariff issues, CED has made two new reference tools available to its clients and business offices: one to support market diversification, the other to facilitate compliance with the Canada-United States-Mexico Agreement (CUSMA).
Of the over 6,600 interactions that took place, 45% involved referral services and market information. These services were delivered to the great satisfaction of entrepreneurs, as evidenced by the 94% satisfaction rate among those who received them.
For more information on CED’s core responsibility to develop Quebec’s economy, read the “Results - what we achieved“ section of the Agency’s departmental results report.
From the Minister

Minister of Industry and
Minister responsible for Canada Economic Development for Quebec Regions
I am pleased to present the Canada Economic Development for Quebec Regions (CED) 2024–25 Departmental Results Report.
The 2024–25 fiscal year began amid economic recovery, before being marked by geopolitical and trade uncertainty. At the same time, several challenges persisted for Quebec's regional economies, including labor shortages and productivity gaps in certain sectors. To fully assume its role, CED invested strategically in the sustainable and inclusive growth of SMEs and communities all across Quebec.
Over the past year, CED focused on innovation development and commercialization to help drive SME growth. In practical terms, the Agency implemented this approach both through its regular programs and new regional initiatives, notably in the areas of artificial intelligence and innovation in residential construction.
These measures were specifically designed to help Quebec businesses become more productive and competitive. They aimed to support the development of new markets, the adoption of cutting-edge technologies and the robotization and automation of production lines.
CED also maintained its support for communities with a view to promoting a strong, diversified and inclusive economy. It worked with regional partners and economic players to foster the development and enhancement of regional tourism destinations; accelerate the transition to eco-responsible practices in the regions; and facilitate the increased participation of Indigenous and diversity communities. The creation of the Northern Isolated Community Initiatives Fund, the pursuit of the Black Entrepreneurship Program and the retention of the Tourism Growth Program – Quebec are eloquent examples of this commitment.
Through these growth-generating initiatives and its outreach work with Quebec’s SMEs and regions, CED contributed to the advancement of regional economic development in Canada.
On the strength of these results, the Agency will pursue its mission to build a strong, resilient economy that benefits all communities.
I invite you to read this report to learn more about CED’s results for fiscal 2024–25.
Enjoy!
Results - what we achieved
Core responsibilities and internal services
Core responsibility 1: Develop Quebec’s economy
Description
Support economic growth and prosperity and job creation in Quebec by means of inclusive clean growth; help small and medium-sized enterprises (SMEs) grow through trade and innovation; and leverage competitive regional strengths.
Quality of life impacts
CED’s core responsibility mainly contributes to the “Prosperity” domain of the Quality of Life Framework for Canada, and in particular to the following indicators: firm dynamism, employment, productivity, GDP per capita, and investment in in-house research and development. The benefits generated by CED’s activities over the past year fostered sustainable economic growth in all regions of Quebec and helped improve the prosperity of Canadians.
CED’s core responsibility also contributes, to a certain degree, to the “Environment” domain since CED supports the enhancement of the environmental performance of businesses and communities from a sustainable economic development perspective. Finally, CED is contributing to the cross-cutting “equity and inclusion” perspective by pursuing its efforts to create an inclusive economy and increase the participation of various under-represented groups.
Progress on results
This section details the department’s performance against its targets for each departmental result under Core responsibility 1: Develop Quebec’s economy.
| Departmental result indicator | Target | Date to achieve target | Actual results |
|---|---|---|---|
| Number of high-growth businesses in Quebec | 3,420 | March 31, 2025 | 2022–23: 4,020* (2021) 2023–24: 4,700* (2022) 2024–25: Not updated** |
| Value of Quebec’s goods’ exports (in dollars) | $100B | March 31, 2025 | 2022–23: $107B* (2022) 2023–24: $114* (2023) 2024–25: $122B* (2024) |
| Value of Quebec’s clean tech exports (in dollars) | $2.7B | March 31, 2025 | 2022–23: $2.9B* (2021) 2023–24: $2.6B* (2022) 2024–25: $2.4B* (2023) |
| Revenue growth rate of businesses supported by CED programs | 4.0% | March 31, 2025 | 2022–23: 11.8% (2022) 2023–24: 8.5% (2023) 2024–25: Not updated** |
| *The data in the table corresponds to the most recent results
published by Statistics Canada. The figures provided for previous years are those available
and may be updated in current or future fiscal years. **“Not updated” means that the data has not been updated since the last results presented in the table. |
|||
| Departmental result indicator | Target | Date to achieve target | Actual results |
|---|---|---|---|
| Percentage of SMEs in Quebec that are majority-owned by women, Indigenous peoples, youth, visible minorities or persons with disabilities |
Women: 16.0% Indigenous Peoples: 1.1% Youth: 14.4% Visible minorities: 4.3% Persons with disabilities: 0.4% |
March 31, 2025 |
Women: Indigenous Peoples: Youth: Visible minorities: Persons with disabilities: |
| Percentage of professional jobs in science and technology in the Quebec economy | 38.6% | March 31, 2025 |
2022–23: 38.1%**(2022) |
| Amount leveraged per dollar invested by CED in community projects | $2.20 | March 31, 2025 |
2022–23: $2.91 (2023) |
| *”Not available" indicates that data will never be published for
the years in question, as the Statistics Canada survey is conducted on a triennial
basis. ** The data in the table corresponds to the most recent results published by Statistics Canada. The figures provided for previous years are those available and may be updated in current or future fiscal years. |
|||
| Departmental result indicator | Target | Date to achieve target | Actual results |
|---|---|---|---|
| Value of R&D spending by businesses receiving CED program funding (in dollars) | No forecast* | March 31, 2025 |
2022–23: $290M** (2020) |
| Percentage of businesses that collaborate with Quebec institutions of higher learning | 22% | March 31, 2025 |
2022–23: 17.3%** (2020- 2022) |
| *“No forecast” means a target that CED could not set at the time
of the drafting of the 2024–25 Departmental Plan owing to the improvement of its
methodology. **The data in the table corresponds to the most recent results published by Statistics Canada. The figures provided for previous years are those available and may be updated in current or future fiscal years. ***“Not updated” means that the data has not been updated since the last results presented in the table. |
|||
In addition to the information presented in the above-mentioned Departmental Results Framework, CED monitors and evaluates various program performance indicators for each of the projects it supports, while aiming to continuously improve its performance measurement practices in order to support evidence-based decision-making and promote results-based management.
The Results section of the Infographic for CED on GC Infobase page provides additional information on results and performance related to its program inventory.
Details on results
The following section describes the results for Develop Quebec’s economy in 2024–25 compared with the planned results set out in CED’s departmental plan for the year.In measuring progress toward fulfilling its core responsibility, CED seeks to contribute to, and influence, the three departmental results below. Achievement of these objectives depends on a number of factors and CED’s intervention contributes to their achievement within the limits of the organization’s budgets. The results achieved in 2024–25 demonstrate CED’s continued commitment to innovation, sustainable and inclusive growth, and economic diversification and resilience in all regions of Quebec.
-
Departmental result 1: Quebec businesses are innovative and growing
Through the Regional Economic Growth through Innovation (REGI) program and its associated temporary initiatives, CED supported growth and innovation among Quebec businesses by helping them become more productive and competitive and reach new markets. This support translates into $178.65M invested in 606 projects carried out both by SMEs and non-profit organizations (NPOs) that provide business support services. Through this program, CED supported the acceleration of efforts by businesses to go digital and adopt cutting-edge technologies to foster the robotization and automation of their production activities, particularly in the manufacturing sector. By doing so, CED was able to help address structural issues such as the labour shortage and lagging business productivity in certain sectors, in a context in which Quebec businesses continued to be impacted by the uncertainty of the national and international economic situation and persistently high borrowing rates.
- Regional
Artificial Intelligence Initiative (RAII): $1.7M invested in 22
projects.
By fostering innovation and supporting the development and commercialization of artificial intelligence (AI)–based technologies and solutions, CED has helped strengthen Canada’s leadership in this field. Since responsible AI is a Government of Canada priority, CED also pursued its awareness activities among businesses aimed at encouraging an ethical and inclusive adoption of AI that respects human rights and democratic values, notably by means of tools available free of charge on the website. - Regional
Homebuilding Innovation Initiative (RHII): $3.1M invested in 6
projects.
CED supported manufacturing SMEs and NPOs that develop innovative solutions for the multi unit residential construction sector and its supply chain. By doing so, CED contributed to Canada’s Housing Plan, the goal of which is to address the housing crisis by facilitating access to housing for Canadians. - Business
incubators and accelerators: $2.7M invested in 12 projects.
Business incubators and accelerators play a key role in the creation and growth of innovative start-ups in Quebec. They support start-ups at all stages of their development and act as levers for innovation, thus enabling them to generate tangible economic benefits all across Quebec. To maximize the impact of its interventions and improve access to the expertise of regional incubators and accelerators, CED has renewed its funding approach and launched a call for proposals. - Environmental transition of businesses: $58.2M invested in 170 projects.
CED supported projects targeting the development and adoption of clean technologies, and changes to business practices, from a sustainable growth perspective. In addition to having a positive impact on the economic development of the regions involved, these projects also helped reduce greenhouse gases, while contributing to the production of cleaner products; the development of bioenergy, alternative energies and electric vehicles; and improved energy efficiency. These projects were funded through the REGI program, as well as through temporary initiatives implemented under the terms and conditions of the REGI program.
Examples of Projects Under Departmental Result 1
Project Funded Through the RAII
Where: Saint-Augustin-de-Desmaures; served by the Québec‒Chaudière-Appalaches Business Office (BO)
Who: Lime Health Inc., a company specializing in the development of life sciences software solutions
What: The $300,000 repayable contribution supports the commercialization of their AI-powered platform to support healthcare institutions in their decision-making and the development of personalized care for their patients.
Project Funded Through the RHII
Where: Belœil; served by the Greater Montréal BO
Who: Les Industries Bonneville ltée, a manufacturer of modular prefabricated buildings
What: The $1.5M repayable contribution supports the acceleration of housing construction in Quebec by helping the business increase its productivity and production capacity through the acquisition of equipment.
Environmental Transition Project Funded Through the REGI
Where: All Quebec; served by the Inter-Regional Initiatives Directorate
Who: Fonds d’action québécois pour le développement durable
What: The $7.5M non-repayable contribution will allow Quebec SMEs to benefit from coaching and consulting services regarding the implementation of their sustainable development action plans and, specifically, the improvement of their environmental performance.
Incubator or Accelerator Project
Where: All Quebec; served by the Inter-Regional Initiatives Directorate
Who: Québec Tech, an organization whose mission is to support and propel the international growth of Quebec technology start-ups with high export potential
What: The $800,000 non-repayable contribution will be used for coaching activities aimed at facilitating the commercialization of emerging technologies.
CED also made extensive efforts to showcase Quebec’s expertise among major contractors in order to increase business opportunities arising from the Industrial and Technological Benefits (ITB) Policy in Quebec. CED assisted multiple SMEs at various defence and security industry events to help them better understand the business opportunities and potential economic benefits associated with this sector. At CANSEC, Canada’s largest defence trade show, CED organized a networking evening attended by almost 200 people. This event provided an opportunity for Quebec businesses and research centres to directly interact with major defence sector contractors in order to promote their expertise and capabilities. CED also organized a number of networking meetings involving Quebec SMEs and major contractors with a view to maximizing economic benefits for Quebec.
- Regional
Artificial Intelligence Initiative (RAII): $1.7M invested in 22
projects.
-
Departmental result 2: Quebec communities are economically diversified
Through the Quebec Economic Development Program (QEDP) and its associated temporary initiatives, CED invested $68.9M in 237 projects aimed at helping communities pursue promising economic development and diversification opportunities. CED focused particularly on those local and regional businesses that play a central role in communities that are less economically diversified. CED’s support targeted local business projects; the development of regional tourism; the national and international marketing of tourist attractions to encourage spending by tourists from outside Quebec; and efforts to attract foreign investment.
- Tourism Growth Program – Quebec (TGP): $7.8M invested in 31 projects that help strengthen the capacity of local attractions in all regions of Quebec to build and consolidate a tourism offer with a high potential to attract visitors from outside the province. This temporary initiative aims to develop and improve regional tourism destinations in order to boost the competitiveness of Quebec’s regions among international tourist destinations.
- East Montréal Economic Development Initiative (EMEDI): $4.7M invested in 42 projects, including 20 social innovation projects totalling almost $1M. By doing so, CED helped foster the revitalization, attractiveness and sustainable reindustrialization of east-end Montréal, an area that has been grappling with major socio-economic challenges for many years.
- Support for economic-sector NPOs – QEDP and related initiatives: some 7,000 clients received various services through 54 projects. Each year, CED provides NPOs with funding to create, develop and/or maintain regional economic development ecosystems that meet the needs of businesses and foster an entrepreneurial environment conducive to the development and economic diversification of Quebec’s regions.
- Environmental transition of businesses – QEDP: $7.1M invested in 13 projects. CED pursued its commitment to foster the environmental transition of Quebec businesses, specifically by helping businesses fund their green transition and acquire the necessary expertise to carry it out, thus contributing to sustainable community development.
- Hurricane Fiona Recovery Fund (HFRF): $2M invested in 2 projects. This initiative helps SMEs and communities in eastern Quebec (Gaspésie and Îles-de-la-Madeleine regions) get back on their feet, and supports their economic recovery efforts.
Examples of Projects Under Departmental Result 2
Project Funded Through the Through the TGP
Where: Anticosti Island; served by the Côte-Nord BO
Who: 9517-9008 Québec inc., a business specializing in adventure tourism
What: The $80,000 repayable contribution will allow the business to develop its tourism offer by adding a marine cruise activity for observing the coastline of Anticosti Island and its marine wildlife.
Project Funded Through the Through the EMEDI
Where: East-end Montréal; served by the Greater Montréal BO
Who: Vestechpro, a technology transfer centre affiliated with Cégep Marie-Victorin
What: The $215,485 non-repayable contribution targets the acquisition of equipment to help SMEs in the textile and clothing sector contribute to the circularity and reuse of clothing.
NPO Project Funded Through the QEDP
Where: Val d’Or; served by the Abitibi-Témiscamingue–Nord-du-Québec BO
Who: Secretariat for the Cree Nation – Abitibi-Témiscamingue Economic Alliance
What: The purpose of the $300,000 non-repayable contribution is to fund activities that facilitate networking between Indigenous and non-Indigenous businesses operating in an English-speaking environment.
Project Funded Through the HFRF
Where: Îles-de-la-Madeleine; served by the Gaspésie-Îles-de-la-Madeleine BO
Who: Les moules de culture des Iles inc.
What: The $162,700 non-repayable contribution allowed the business to replace production equipment and relocate some of its operations to restore economic activity and reduce its vulnerability to extreme weather events.
Environmental Transition Project Funded Through the QEDP
Where: Havre-Saint-Pierre; served by the Côte-Nord BO
Who: Port of Havre-Saint-Pierre
What: The $279,694 non-repayable contribution was used for a feasibility study on the expansion and improvement of the port facilities, including the addition of shore electrical terminals for cruise ships and the installation of a system to treat wastewater discharged from ships.
Through the Community Futures Program (CFP), CED supports the operations of the Community Futures Development Corporations (CFDCs) and Business Development Centres (BDCs), which offer financing and technical assistance to small businesses, and support various local economic development initiatives. The annual investment of $34.9M allowed these organizations to support local projects and pursue their mission of supporting the economic development of SMEs and communities in the rural regions of Quebec. Over the course of the year, the CFDCs and BDCs provided $86M in the form of loans and $2M for technical assistance to support 1,664 businesses in the regions of Quebec. In addition, 788 local economic development projects were created this year as a result of the commitment of the CFDCs and BDCs to the vitality of the communities they serve. These projects represent a total investment of $5M.
Inclusive Economy
In 2024–25, CED continued to implement the following targeted initiatives aimed at fostering an inclusive economy in all regions of Quebec:
- Economic Development Initiative – Official Languages (EDI-OL): $1.8 M$ invested in 14 projects aimed at fostering the economic development of official language minority communities (OLMCs) through various activities, such as innovation, entrepreneurship, partnerships and economic diversification.
- Black Entrepreneurship Program (BEP) – Ecosystem Fund: $6.4M invested in 10 projects involving business associations led by Black community members to enable them to develop new services or expand existing ones, such as mentoring, networking, financial planning and business management coaching for Black entrepreneurs.
- Northern Isolated Community Initiatives (NICI) Fund: $97,608 invested in a project to support existing and new food initiatives, thereby helping to strengthen and diversify economic activity in Nunavik.
- Tourism Growth Program – Quebec (TGP) – Fund for Indigenous Tourism projects: $1.6M invested in a project to strengthen Indigenous tourism attractions in Quebec (more than 15% of all CED spending under the TGP).
- Quebec Green Initiative (QGI): 16 projects jointly administered by CED and Indigenous Services Canada (ISC). The two organizations work together to help Indigenous communities seize economic opportunities related to green energy and participate in Quebec’s energy transition. This collaboration involves identifying, analysing and recommending projects that create jobs, foster business creation and increase community revenues.
Inclusive Economy – Indigenous Communities
In addition to the temporary initiatives mentioned above, CED continued to support Indigenous communities, taking into account the specific realities of First Nations, Inuit and Métis in its programs and services. The aim of this approach is to promote the growing participation of these communities in Quebec’s economy, in keeping with the United Nations Declaration on the Rights of Indigenous Peoples Act. With this in mind, CED continued to relax some of the criteria for its regular programs in order to step up its interventions targeting these communities, tailor its actions to their specific context and ensure that they have adequate access to funding.
CED pursued the implementation of the Inuit Nunangat Policy, in effect since April 2022, to promote intervention based on an understanding of the specific needs and circumstances of the Inuit in its services, programs and initiatives. CED introduced various measures in this regard, such as the rollout of communication tools in Inuktitut, including on its website.
Finally, CED has played a growing role in the Government of Canada’s efforts to advance reconciliation and the inclusion of Indigenous peoples in the Canadian economy. This is reflected in the Agency’s participation in the federal government’s reflections on the Framework for Economic Reconciliation with Indigenous Peoples, with a particular focus on issues specific to Quebec.
The Gender-based Analysis Plus section of this report, along with the Supplementary Information Table on this topic, include additional information on CED’s intervention to promote the economic participation of under-represented groups in the regions of Quebec.
-
Departmental result 3: Businesses invest in the development and commercialization of innovative technologies in Quebec
In 2024–25, CED provided $29M in funding for 49 innovation development and technology transfer projects, and $162M for 125 innovation commercialization and export projects, in order to help businesses improve their capacity to identify market opportunities, access potential clients, manage business relationships, penetrate domestic and international markets (in compliance with applicable international agreements), integrate global value chains and access public markets and ITBs. CED also pursued its commitment to the green transition and supported projects involving the development and commercialization of new sustainable technologies with a view to fostering the green shift in Quebec’s regional economies, in accordance with its green transition acceleration action plan.
- Support for economic-sector NPOs – REGI and related initiatives: $60.8M invested in 119 projects. CED provided a number of NPOs with funding to create, strengthen or maintain regional economic development ecosystems. These projects—led by NPOs that provide services for businesses in support of their business projects—involve the development, adoption, adaptation and commercialization of various technologies. In 2024–25, under the REGI and related initiatives, these NPOs provided services for nearly 9,800 clients in response to businesses’ need for support, while promoting an entrepreneurial environment conducive to innovation, growth and competitiveness.
- Regional Quantum Innovation (RQI): $7.8M invested in 14 projects. In accordance with the commercialization pillar of the National Quantum Strategy (NQS), CED’s support has helped Quebec businesses expand and commercialize quantum technologies through the main regional centres of quantum expertise. Quantum technologies have the potential to transform key sectors of our economy such as information technology, communications, cybersecurity, sensing technology, imaging and the development of innovative materials.
Finally, CED also helped SMEs build their capacity to market innovative products through the Regional Artificial Intelligence Initiative (RAII) and the Regional Homebuilding Innovation Initiative (RHII), the results of which are cited above. CED thus contributed to the development of innovative products, the adoption and scaling-up of new methods and technologies and the commercialization of innovative technologies.
Examples of Projects Under Departmental Result 3
Innovation Commercialization Project Funded
Where: Montréal; served by the Greater Montréal BO
Who: CarbiCrete Inc., a company that has developed a patented, carbon-neutral process for producing precast concrete without cement by utilizing industrial by-products and captured CO2
What: The $500,000 repayable contribution will be used to set up a technology showcase for this new process in a concrete block manufacturing plant.
NPO Project Funded Through the REGI
Where: Rimouski; served by the Bas-Saint-Laurent BO
Who: Innovation maritime (IMAR), an applied research centre dedicated to the development of SMEs through innovation
What: The $124,500 non-repayable contribution will fund the acquisition of equipment to allow SMEs in the marine industry to develop innovative market development products.
Project Funded Through the RQI
Where: Sherbrooke; served by the of Eastern Townships BO
Who: Nord Quantique Inc., a start-up SME specializing in quantum error correction that is developing and manufacturing its first reliable quantum computer
What: The $1.8M repayable contribution will support the SME in the acquisition of equipment for the production and marketing of its innovation.
Project Funded Through the RAII
Where: East-end Montréal; served by the Greater Montréal BO
Who: ARA Robotics Inc., an innovative manufacturer of automated drones and a high-technology integrator
What: The aim of the $350,000 repayable contribution is to support the commercialization activities of this business, which integrates AI into its turnkey aerial robotics solutions used in aerial inspection and mapping for the commercial and defence sectors.
Project Funded Through the RHII
Where: Gaspésie; served by the Gaspésie–Îles-de-la-Madeleine BO
Who: Les Habitations Mont Carleton Inc., an innovative manufacturing SME specializing in the manufacture of modular housing for the single-family, multi-unit and commercial sectors
What: The $1.5M repayable contribution targets the acquisition of digital equipment that will enable the company to increase its production capacity and productivity.
Key risks
In 2024–25, Quebec businesses continued to operate in an uncertain economic context marked by geopolitical and trade tensions and persistently high interest rates—although the latter did start to fall by the end of the year. In this context, the needs and expectations of SMEs in terms of investment support to help them adapt, grow and build their resilience were particularly high. To mitigate the risk that its offer would not be fully adapted to the rapidly changing needs of SMEs, and to ensure strategic and sustainable support for business projects, CED put various measures in place.
The Agency continued to tailor its programs to better meet emerging and priority needs, while taking into account the various regional realities and government priorities. It developed, implemented and shared regional response plans with local stakeholders. It also modernized its client feedback process, and the pilot implementation of the Client Space, with its new transactional portal, helped improve services and enhance the client experience.
Through its 12 regional business offices and its integrated approach to information, assistance and investment, CED continued to support SMEs and NPOs in the development and diversification of the economies of Quebec’s regions.
Resources used to achieve results
| Resource | Planned | Actual |
|---|---|---|
| Spending | 293,604,291 | 312,884,341 |
| Full-time equivalents | 216 | 211 |
The Finances section of the Infographic for CED on GC Infobase page and the People section of the Infographic for CED on GC Infobase page provide complete financial and human resources information related to its program inventory.
Related government priorities
-
Gender-based Analysis Plus
CED pursued the implementation of its Gender-based Analysis Plus (GBA PLUS) policy and governance framework to better integrate gender and diversity considerations into the development of policies, programs, internal practices and client services.
To this end, CED proactively updated GBA PLUS for its two main programs, the REGI program and the QEDP. This aim of this initiative is to measure progress in terms of supporting the full participation of under-represented groups, while ensuring that these programs do not contain any new barriers or negative impacts that could affect these groups. The findings will support the ongoing management of CED programs with a view to promoting the full participation of members of under-represented groups in all regions of Quebec.
CED also pursued the implementation of its equity, diversity and inclusion (EDI) approach that applies to all its clients and programs, and which is based on the 2018 GBA PLUS findings:
- EDI appendix to the funding application, to educate CED clients about the importance of EDI and to provide an estimate of its integration: Of the 609 SME and NPO projects that were approved in 2024–25, 262 (43%) indicated that their organizational practices included an EDI component, and 465 (76%) indicated that they intended to start or continue EDI efforts.
- Client resources: The tools available to CED clients to raise awareness of the competitive advantages of EDI are among the most visited pages on the Agency’s website.
GBA PLUS: Highlights of our investments in 2024–25
CED primarily bases its reports on funding for under-represented groups on the data collected in the voluntary self-identification form, in which clients applying for funding are asked to indicate whether they belong to one or more of the target groups. Consequently, although indicative, this data may be incomplete. Since the form is completed on a voluntary basis, there may be gaps due to incomplete, inaccurate or insufficient information.
Funding for SMEs: $24.8M invested in 143 SME projects whose majority owners self-identified as belonging to under-represented groups; these 143 projects accounted for 21% of the overall funding and 28% of the total number of SME projects.
Funding for NPOs: $66.5M invested in 205 NPO projects that were led or majority led by members who self-identified as belonging to under-represented groups; these 205 projects accounted for 40% of the overall funding and 51% of the total number of NPO projects.
The following is a breakdown of 2024–25 funding broken down by the nine categories of under represented groups identified by CED. Definitions can be found on the CED website. The amounts below should not be added up, since clients may self-identify as belonging to more than one group:
- 2SLGBTQI+: 26 projects ($8.3M)
- Indigenous peoples: 47 projects ($11.5M)
- Women: 227 projects ($63.9M)
- Youth: 106 projects ($25.9M)
- Racialized communities: 34 projects ($7M)
- Black communities: 26 projects ($11M)
- OLMC: 47 projects ($13.7M)
- Newcomers to Canada and immigrants: 37 projects ($11.6M)
- Persons with disabilities: 5 projects ($2.4M)
For more information on CED’s intervention with respect to GBA PLUS and under-represented groups, please refer to the GBA PLUS Supplementary Information Table
-
United Nations 2030 Agenda for Sustainable Development and the Sustainable Development Goals
CED adheres to an economic development approach that contributes to the advancement of Quebec’s economy while respecting the environment and promoting inclusive, sustainable economic growth. Four of the goals of the 2022–26 Federal Sustainable Development Strategy, which is framed by the UN Sustainable Development Goals, apply to CED:
- Goal 8: Encourage inclusive and sustainable economic growth in Canada
- Goal 10: Advance reconciliation with Indigenous Peoples and take action to reduce inequality
- Goal 12: Reduce waste and switch to zero-emission vehicles
- Goal 13: Take action on climate change and its impacts
CED also contributes to certain goals through some of its temporary initiatives, notably:
- Goal 9: Foster innovation and green infrastructure in Canada
- Goal 11: Improve access to affordable housing, clean air, transportation, parks, and green spaces, as well as cultural heritage in Canada
More information on CED’s contributions to Canada’s Federal Implementation Plan on the 2030 Agenda and the Federal Sustainable Development Strategy can be found in our Departmental Sustainable Development Strategy.
Program inventory
- Program: Regional Innovation
- Program: Community Vitality
- Program: Targeted or Temporary Support
Additional information related to the program inventory for Develop Quebec’s economy is available on the Results page on GC InfoBase.
Internal services
Description
Internal services refer to the activities and resources that support a department in its work to meet its corporate obligations and deliver its programs. The 10 categories of internal services are:
- Management and Oversight Services
- Communications Services
- Legal Services
- Human Resources Management
- Financial Management
- Information Management
- Information Technology
- Real Property
- Materiel
- Acquisitions
Progress on results
This section presents details on how the department performed to achieve results and meet targets for internal services.
In 2024–25, CED began implementing CED 2027, its new three-year strategic plan. Developed in response to an organizational reflection exercise, this plan reflects a shared vision for the future and establishes strategic objectives based on three supporting pillars: Our Team, Our Internal Services, and Our External Programs and Services.
The 2024–25 fiscal year marks the first year of this three-year plan, which guides CED’s internal actions. In this context, all sectors, including Internal Services, helped create conditions conducive to the success of CED 2027 by supporting the modernization of the organization, the development of skills and the continuous improvement of its practices.
The following are some examples of the results achieved:
- Rollout of CED’s 2024–27 digital strategy
This strategy is the result of a collective effort and symbolizes the organization’s intention to make its services even more accessible, efficient and secure. Building digital skills—particularly cybersecurity, data management and digital literacy skills—was a priority in 2024–25. One example is the launch of a digital skills framework that includes customized learning paths to better equip teams. A community of practice on generative artificial intelligence was also set up, and work has begun to optimize data governance and use.
- Improving the work environment and making changes to hybrid work
As part of the return to the office three days a week, CED stepped up its efforts to provide a modern, inclusive and engaging workplace.
Consultations have made it possible to adapt practices to staff needs. Concrete measures include:
- modernizing several videoconferencing rooms;
- deploying softphone telephony via Teams;
- installing a new area at Head Office dedicated to in-depth work known as "the bubble”—a quiet, low-light space that promotes concentration and individual work; and
- setting up two diversity employee networks to help create a positive work environment that promotes collaboration and inclusion.
-
Modernizing our business model
CED continued to work on improving its internal processes, specifically through the introduction of the “Employee Space,” a new centralized platform for the delivery of corporate services. This single access point allows staff to make and track various service requests (IT, compensation, information management, etc.); it also facilitates the monitoring and measurement of internal service performance. New services will be added gradually.
CED continued to modernize its operational tools and processes in 2024–25, notably the gradual rollout of the Client Space; the implementation of the new version of the grant and contribution management system and various other automations; and the review of our key operational tools to ensure that they are better aligned with advisors’ needs and that they facilitate the response to requests submitted by businesses. CED also simplified certain procedures in response to the challenges of clients facing financial difficulties because of the tariff situation.
Resources required to achieve results
Table 5: Resources required to achieve results for internal services this year
| Resource | Planned | Actual |
|---|---|---|
| Spending | 22,330,430 | 24,746,099 |
| Full-time equivalents | 167 | 167 |
The Finances section of the Infographic for CED on GC Infobase page and the People section of the Infographic for CED on GC Infobase page provide complete financial and human resources information related to its program inventory.
Contracts awarded to Indigenous businesses
Government of Canada departments are required to award at least 5% of the total value of contracts to Indigenous businesses every year.
CED’s results for 2024–25:
Table 6: Total value of contracts awarded to Indigenous businessesFootnote 1
| Contracting performance indicators | 2024–25 results |
|---|---|
| Total value of contracts awarded to Indigenous businessesFootnote 2 (A) | $349,443.02 |
| Total value of contracts awarded to Indigenous and non-Indigenous businesses (B) | $1,795,116.54 |
| Value of exceptions approved by deputy head (C) | $0 |
| Proportion of contracts awarded to Indigenous businesses [A / (B–C) × 100] | 19.47% |
In its 2025–26 Departmental Plan, CED estimated that it would award 5% of the total value of its contracts to Indigenous businesses by the end of 2024–25. The result achieved exceeds the target by 5%, thanks to the commitment of the various directorates and the maintenance of the strategies put in place by the Department, including:
- The inclusion of awareness sessions in annual presentations, emphasizing the importance and obligation of always verifying whether needs in terms of goods and services can be met by Indigenous businesses.
- Maintaining CED’s strategic procurement plan, which stems from the Procurement Strategy for
Indigenous Business (PSIB) and includes the following key actions:
- Determining at the outset of the procurement process whether the Indigenous market is able to meet the needs of the contract.
- Systematically checking the Indigenous Business Directory to find qualified suppliers in various sectors.
- Using mandatory standing offers / supply arrangements (SO/SA) for the acquisition of goods.
- Using set-aside methods (mandatory, voluntary and conditional set-asides).
- Inviting and informing unregistered Indigenous businesses identified during our research to register in the Indigenous Business Directory in order to meet the recognition criteria required for government contracts.
Furthermore, it should be noted that the fact that the target was exceeded is also due to a significant decrease in the total amount of contracts awarded by CED in 2024–25, which automatically increased the proportion of contracts awarded to Indigenous businesses.
Spending and human resources
-
In this section
Spending
This section presents an overview of the department’s actual and planned expenditures from 2022–23 to 2027–28.
Refocusing Government Spending
In Budget 2023, the government committed to reducing spending by $14.1B over five years, starting in 2023–24, and by $4.1B annually after that.
As part of meeting this commitment, CED identified the following spending reductions.2024–25: $517,240
- 2025–26: $807,349
- 2026–27 and after: $1,205,331
During 2024–25, CED worked to realize these reductions through the following measures: Reduction in workforce, notably through i) non-renewal of the majority of-term employee contracts and ii) non-replacement of certain vacant positions;
- Restrictions on travel;
- Reduction in the use of professional services.
Budgetary performance summary
Actual three-year spending on the core responsibility and internal services (dollars)
| Core responsibility and internal services | 2024–25 Main Estimates | 2024–25 total authorities available for use | Actual spending over three years (authorities used) |
|---|---|---|---|
| Develop Quebec’s economy | 293,684,163 | 315,416,953 |
|
| Internal services | 22,505,318 | 25,416,721 |
|
| Total | 316,189,481 | 340,833,674 |
|
-
Analysis of the past three years of spending
CED’s budget consists of recurrent funding used to deliver its regular programs and temporary funding for specific, targeted initiatives. The budget varies depending on the programs and initiatives that CED is required to implement, particularly in response to economic conditions or events that have a significant impact on Quebec businesses or communities.
In recent years, CED has administered a large number of grant and contribution programs and initiatives to fulfill its core responsibility to develop Quebec’s economy. In fiscal years 2022–23 and 2023–24, the Agency saw record levels of spending owing to the continuation of economic recovery initiatives implemented in response to the COVID-19 pandemic.
In 2024–25, planned and actual spending was significantly lower than in previous years as a result of the end of the economic recovery initiatives on March 31, 2024, and CED returned to baseline levels comparable to pre-pandemic levels. The variance of $21.4M (6.8%) between planned and actual spending for 2024–25 is due to the in-year approval of new initiatives:
- The Northern Isolated Community Initiatives (NICI) Fund
- The top-up for the Regional Economic Growth through Innovation (REGI) program and the Regional Homebuilding Innovation Initiative (RHII)
- The Regional Artificial Intelligence Initiative (RAII)
As concerns internal services, several collective agreements were ratified in 2023–24, which explains the year-over-year increase in payroll expenditures. Then, in 2024–25, CED responded to the intergovernmental effort to refocus public spending by reducing its spending on professional services and travel, in accordance with its management plan.
Actual spending remained stable overall in 2022–23 and 2023–24, reflecting the continuation and end of economic recovery initiatives. In 2024–25, CED will continue to deliver its grant and contribution programs, primarily through its regular programming.
The Finances section of the Infographic for CED on GC Infobase page offers more financial information from previous years.
| Core responsibility and internal services | 2025–26 planned spending | 2026–27 planned spending | 2027–28 planned spending |
|---|---|---|---|
| Develop Quebec’s economy | 307,850,857 | 203,194,650 | 200,256,348 |
| Internal services | 23,378,466 | 21,148,480 | 21,063,857 |
| Total | 331,229,323 | 224,323,130 | 221,320,205 |
-
Analysis of the next three years of spending
Over the next few years, CED intends to continue core mandate, assuming that spending levels will return to pre-pandemic levels. The spending forecast for 2025–26 remains stable compared to those for 2024–25.
However, the repayable contribution reinvestment mechanism—a financing source representing approximately 40% of CED’s grant and contribution budget—is currently under review. As a result, the amounts associated with this mechanism cannot be included in the spending forecasts for 2026–27 and 2027–28, which explains the sharp decline in the spending forecasts for these two years.
In addition to its regular programs, CED anticipates spending on temporary and targeted initiatives, with the following deadlines:
- Tourism Growth Program (TGP) (2025–26)
- Northern Isolated Community Initiatives (NICI) Fund (2026–27)
- Regional Quantum Innovation Initiative (RQI) (2027–28)
- Regional Artificial Intelligence Initiative (RAII) (2028–29)
- Black Entrepreneurship Program (BEP) (2029–30)
The Finances section of the Infographic for CED on GC Infobase offers information on the alignment of CED’s spending with Government of Canada’s spending and activities.
Funding
This section provides an overview of the department’s voted and statutory funding for its core responsibility and for internal services. Consult the Government of Canada budgets and expenditures for further information on funding authorities.
Graph 1: Approved funding (statutory and voted) over a six-year period
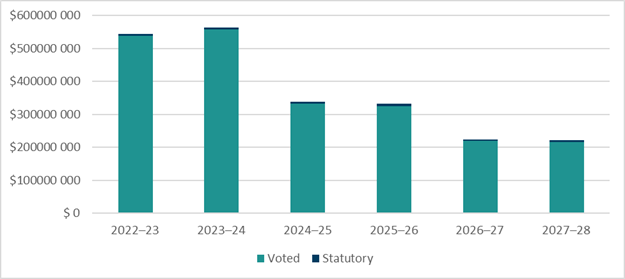
Text version: Approved voted and statutory funding from 2022–23 to 2027–28
| Fiscal year | Statutory | Voted | Total |
|---|---|---|---|
| 2022–23 | 5,596 577 | 538,518,143 | 544,114,720 |
| 2023–24 | 6,196,772 | 556,986,030 | 563,182,802 |
| 2024–25 | 6,068,106 | 331,562,334 | 337,630,440 |
| 2025–26 | 6,133,162 | 325,096,161 | 331,229,323 |
| 2026–27 | 5,476,370 | 218,866,760 | 224,343,130 |
| 2027–28 | 5,476,370 | 215,843,835 | 221,320,205 |
-
Analysis of statutory and voted funding over a six-year period
CED’s spending varies over time and largely depends on the temporary and targeted funding received to support specific initiatives in response to the economic situation or to events that have a significant impact on Quebec businesses or communities. For more details on spending fluctuations over the six fiscal years in question, see the preceding sections.
Voted appropriations correspond to funding approved by parliamentary vote each year as part of the budget bill. These appropriations are allocated to finance the Department’s programs and activities, whether regular or temporary.
Statutory items, on the other hand, refer to funding that has been previously established by existing legislation and does not require annual parliamentary approval. At CED, statutory funding refers primarily to the employee benefit plan. Consult the Public Accounts of Canada for further information CED’s departmental voted and statutory expenditures.
Financial statement highlights
CED’s Financial Statements (Audited/Unaudited) for the Year Ended March 31, 2025.
Table 9: Condensed Statement of Operations (unaudited or audited) for the year ended March 31, 2025 (dollars)
| Financial information | 2024–25 actual results | 2024–25 planned results | Difference (actual results minus planned) |
|---|---|---|---|
| Total expenses | 213,522,467 | 225,446,417 | (11,923,950) |
| Total revenues | 0 | 0 | 0 |
| Net cost of operations before government funding and transfers | 213,522,467 | 225,446,417 | (11,923,950) |
Analysis of expenses and revenues for 2024–25
The difference between actual expenses for 2024–25 and projected net expenses is $11.9 million (5.3%), mainly due to lower-than-expected transfer payments.
The 2024–25 planned results information is provided in CED’s Future-Oriented Statement of Operations and Notes 2024–25.
Table 10: Condensed Statement of Operations (unaudited or audited) for 2023–24 and 2024–25 (dollars)
| Financial information | 2024–25 actual results | 2023–24 actual results | Difference (2024–25 minus 2023–24) |
|---|---|---|---|
| Total expenses | 213,522,467 | 375,422,465 | (161,899,998) |
| Total revenues | 0 | 0 | 0 |
| Net cost of operations before government funding and transfers | 213,522,467 | 375,422,465 | (161,899,998) |
Analysis of differences in expenses and revenues between 2023–24 and 2024–25
ExpensesIn 2024–25, CED's total expenses amounted to $213.5M, a decrease of $161.9M from the previous fiscal year. This 43.12% decrease is mainly attributable to lower transfer payments and non-repayable contributions under the Community Vitality program, as well as the completion of several initiatives.
Transfer payment expenses—totaling $151.3M—decreased by 51.40% between 2023–24 and 2024–25.
Operating expenses amounted to $62.2M, down 2.95% from last year.
RevenuesReturned to the Treasury, CED's revenues are reported in its financial statements as earned on behalf of the government. The organization's total net revenues are therefore zero. Revenues consist mainly of interest charges billed for late payments.
Table 11: Condensed Statement of Financial Position (unaudited or audited) as at March 31, 2025 (dollars)
| Financial information | Actual fiscal year (2024–25) | Previous fiscal year (2023–24) | Difference (2024–25 minus 2023–24) |
|---|---|---|---|
| Total net liabilities | 19,165,226 | 66,418,832 | (47,253,606) |
| Total net financial assets | 15,514,703 | 62,115,143 | (46,600,440) |
| Departmental net debt | 3,650,522 | 4,430,689 | (653,167) |
| Total non-financial assets | 1,249,062 | 2,003,712 | (754,650) |
| Departmental net financial position | (2,401,461) | (2,299,977) | (101,484) |
Analysis of department’s liabilities and assets since last fiscal year
LiabilitiesAs of March 31, 2025, DEC's net liabilities amounted to $19.1 million, a decrease of 71.1% compared to 2023–24. This decrease is mainly attributable to the decline in net accounts payable and accrued liabilities, which represent 75% ($15.5M) of total net liabilities.
Vacation pays and compensatory leave, as well as future employee benefits, account for 14.9% ($2.9 million) and 4.2% ($0.8M) of the organization's net liabilities, respectively.
AssetsAs of March 31, 2025, net financial assets amounted to $15.5M, down 75% from total assets in the previous fiscal year. This decrease is mainly attributable to a decrease in amounts receivable from the Treasury to settle liabilities (marginal profits and accrued expenses), which also declined.
DEC's non-financial assets stood at $1.2M as of March 31, 2025, down 37.7% from the previous fiscal year. This decrease is due to a reduction in property, plant, and equipment and prepaid expenses.
Human resources
This section presents an overview of the department’s actual and planned human resources from 2022–23 to 2027–28.
Table 12: Actual human resources for core responsibilities and internal services
| Core responsibility and internal services | 2022–23 actual full-time equivalents | 2023–24 actual full-time equivalents | 2024–25 actual full-time equivalents |
|---|---|---|---|
| Develop Quebec’s economy | 212 | 215 | 211 |
| Internal services | 168 | 164 | 167 |
| Total | 380 | 379 | 378 |
-
Analysis of human resources for the last three years
Over the past three years, the number of CED employees has remained stable. The 2022–23 fiscal year marked the end of economic recovery initiatives and their funding. However, in order to allow for the monitoring of initiatives, a transfer of grant and contribution appropriations to operations was carried out as of 2023–24, thereby maintaining the level of full-time equivalents needed to manage the monitoring of measures associated with the COVID-19 pandemic and the economic recovery.
For 2024–25, following the announcement in Budget 2023 of the end of the repayable contribution reinvestment mechanism, provisional operating funding was put in place pending a decision on the implementation of a new methodology to replace this mechanism.
Table 13: Human resources planning summary for the core responsibility and internal services
| Core responsibility and internal services | 2025–26 planned full-time equivalents | 2026–27 planned full-time equivalents | 2027–28 planned full-time equivalents |
|---|---|---|---|
| Develop Quebec’s economy | 206 | 177 | 177 |
| Internal services | 164 | 141 | 141 |
| Total | 370 | 318 | 318 |
-
Analysis of human resources for the next three years
The 2025–26 fiscal year marks the end of the interim capacity-building funding associated with the monitoring of COVID-19-and economic recovery initiatives.
In 2025–26, CED reallocated its grant and contribution funds to the operating budget to ensure monitoring and other essential activities aimed at closing out the emergency and recovery initiatives put in place in response to the COVID-19 pandemic, and to ensure the effective management of CED’s investment portfolio (active projects), worth nearly $3B.
CED is also contributing to efforts to refocus government spending on government priorities and better meet Canadians’ needs. These factors explain the decrease in the number of full-time equivalents for the 2026–27 and 2027–28 fiscal years.
CED will continue to carry out its operations by reassigning its workforce to priorities in order to optimize efficiency and maintain the quality of services provided for SMEs and communities in Quebec.
Supplementary information tables
The following supplementary information tables are available on the CED website:
Federal tax expenditure
The tax system can be used to achieve public policy objectives through the application of special measures such as low tax rates, exemptions, deductions, deferrals and credits. The Department of Finance Canada publishes cost estimates and projections for these measures each year in the Report on Federal Tax Expenditures. This report also provides detailed background information on tax expenditures, including descriptions, objectives, historical information and references to related federal spending programs as well as evaluations and GBA Plus of tax expenditures.
Corporate information
-
Departmental profile
Appropriate minister(s): The Honourable Mélanie Joly
Institutional head: Sony Perron
Ministerial portfolio: Canada Economic Development for Quebec Regions
Enabling instrument(s): Economic Development Agency of Canada for the Regions of Quebec Act
Year of incorporation/commencement: 2005
-
Departmental contact information
Mailing address:
800 René Lévesque Blvd. West, Suite 500
Montréal, Quebec
H3B 1X9Telephone: 514-283-6412
Fax: 514-283-3302
Website: https://www.canada.ca/en/economic-development-quebec-regions.html
Definitions
-
Definitions
appropriation (crédit)
Any authority of Parliament to pay money out of the Consolidated Revenue Fund.
budgetary expenditures (dépenses budgétaires)
Operating and capital expenditures; transfer payments to other levels of government, departments or individuals; and payments to Crown corporations.
core responsibility (responsabilité essentielle)
An enduring function or role of a department. The departmental results listed for a core responsibility reflect the outcomes that the department seeks to influence or achieve.
Departmental Plan (plan ministériel)
A report that outlines the anticipated activities and expected performance of an appropriated department over a 3-year period. Departmental Plans are usually tabled in Parliament in spring.
departmental priority (priorité)
A plan, project or activity that a department focuses and reports on during a specific planning period. Priorities represent the most important things to be done or those to be addressed first to help achieve the desired departmental results.
departmental result (résultat ministériel)
A high-level outcome related to the core responsibilities of a department.
departmental result indicator (indicateur de résultat ministériel)
A quantitative or qualitative measure that assesses progress toward a departmental result.
departmental results framework (cadre ministériel des résultats)
A framework that connects the department’s core responsibilities to its departmental results and departmental result indicators.
Departmental Results Report (rapport sur les résultats ministériels)
A report outlining a department’s accomplishments against the plans, priorities and expected results set out in the corresponding Departmental Plan.
Full-time equivalent (équivalent temps plein)
Measures the person years in a departmental budget. An employee's scheduled hours per week divided by the employer's hours for a full-time workweek calculates a full-time equivalent. For example, an employee who works 20 hours in a 40-hour standard workweek represents a 0.5 full-time equivalent.
gender-based analysis plus (GBA Plus) (analyse comparative entre les sexes plus [ACS Plus])
An analytical tool that helps to understand the ways diverse individuals experience policies, programs and other initiatives. Applying GBA Plus to policies, programs and other initiatives helps to identify the different needs of the people affected, the ways to be more responsive and inclusive, and the methods to anticipate and mitigate potential barriers to accessing or benefitting from the initiative. GBA Plus goes beyond biological (sex) and socio-cultural (gender) differences to consider other factors, such as age, disability, education, ethnicity, economic status, geography (including rurality), language, race, religion, and sexual orientation.
government priorities (priorités pangouvernementales)
For the purpose of the 2024–25 Departmental Results Report, government priorities are the high-level themes outlining the government’s agenda as announced in the 2021 Speech from the Throne.
horizontal initiative (initiative horizontale)
A program, project or other initiative where two or more federal departments receive funding to work collaboratively on a shared outcome usually linked to a government priority, and where the ministers involved agree to designate it as horizontal. Specific reporting requirements apply, including that the lead department must report on combined expenditures and results.
Indigenous business (entreprise autochtones)
For the purposes of a Departmental Result Report, this includes any entity that meets the Indigenous Services Canada’s criteria of being owned and operated by Elders, band and tribal councils, registered in the Indigenous Business Directory or registered on a modern treaty beneficiary business list.
non-budgetary expenditures (dépenses non budgétaires)
Net outlays and receipts related to loans, investments and advances, which change the composition of the financial assets of the Government of Canada.
performance (rendement)
What a department did with its resources to achieve its results, how well those results compare to what the department intended to achieve, and how well lessons learned have been identified.
performance indicator (indicateur de rendement)
A qualitative or quantitative measure that assesses progress toward a departmental-level or program-level result, or the expected outputs or outcomes of a program, policy or initiative.
plan (plan)
The articulation of strategic choices, which provides information on how a department intends to achieve its priorities and associated results. Generally, a plan will explain the logic behind the strategies chosen and tend to focus on actions that lead to the expected result.
planned spending (dépenses prévues)
For Departmental Plans and Departmental Results Reports, planned spending refers to the amounts presented in Main Estimates. Departments must determine their planned spending and be able to defend the financial numbers presented in their Departmental Plans and Departmental Results Reports.
program (programme)
An Individual, group, or combination of services and activities managed together within a department and focused on a specific set of outputs, outcomes or service levels.
program inventory (répertoire des programmes)
A listing that identifies all the department’s programs and the resources that contribute to delivering on the department’s core responsibilities and achieving its results.
result (résultat)
An outcome or output related to the activities of a department, policy, program or initiative.
statutory expenditures (dépenses législatives)
Spending approved through legislation passed in Parliament, other than appropriation acts. The legislation sets out the purpose and the terms and conditions of the expenditures.
target (cible)
A quantitative or qualitative, measurable goal that a department, program or initiative plans to achieve within a specified time period.
voted expenditures (dépenses votées)
Spending approved annually through an appropriation act passed in Parliament. The vote also outlines the conditions that govern the spending.