
Quarterly Financial Report for the Quarter Ended
December 31, 2025
Table of contents
- Introduction
- Highlights of fiscal quarter and fiscal year-to-date results
- Risks and uncertainties
- Significant changes to operations, personnel and programs
- Approval by senior officials
- Appendices
1. Introduction
This quarterly financial report has been prepared by Canada Economic Development for Quebec Regions (CED) as required under section 65.1 of the Financial Administration Act and in the form and manner prescribed by the Treasury Board.
This report should be read in conjunction with the 2025–26 Estimates and the 2025–2026 Departmental Plan.
This document has not been subject to external audit or review.
1.1 Authorities, mandate and programs
Canada Economic Development for Quebec Regions (CED)’s mission is to promote the long-term economic development of the regions of Quebec by giving special attention to those where slow economic growth is prevalent or opportunities for productive employment are inadequate.
CED is the key federal organization for economic development in the regions and among small and medium-sized businesses (SMEs) in Quebec. It aims to stimulate the start-up and growth of businesses to make the regions more innovative, productive and competitive. CED thus offers adapted services and fosters local collaboration. This support also attracts investments for greater economic prosperity in Quebec and Canada.
CED plays a crucial role in dynamizing regional economies by drawing on regional strengths. We help communities diversify their economy, especially those hit by economic shocks. We support SMEs and NPOs through strategic investments.
CED offers advisory services adapted to the needs of businesses, NPOs and communities. Specialized advisors provide personalized guidance to facilitate access to funding, establish partnerships and support the growth of Quebec businesses. CED also offers information services to help small businesses and future entrepreneurs develop.
CED keeps abreast of the needs of Quebec’s regions and businesses through its 11 business offices across the province and through the links it establishes with other economic development players.
CED has three categories of programs that support its core responsibility:
- Regional Innovation
- Community Vitality
- Targeted or Temporary Support
Additional information about CED’s authority, mandate and programs can be found in the 2025–26 Estimates and the 2025–2026 Departmental Plan.
1.2 Basis of presentation
This quarterly report was prepared by CED using an expenditure basis of accounting. The accompanying Statement of Authorities includes CED’s spending authorities granted by Parliament and used by CED, consistent with the 2025–2026 Main Estimates. This quarterly report was prepared using a special-purpose financial reporting framework designed to meet financial information needs with respect to the use of spending authorities.
Prior authority from Parliament is required before funds can be spent by the Government. Authorities available for use are given in the form of annually approved limits through appropriation acts or through legislation in the form of statutory authority for specific purposes.
When Parliament is dissolved for the purposes of a general election, section 30 of the Financial Administration Act authorizes the Governor General, under certain conditions, to issue a special warrant authorizing the government to withdraw funds from the Consolidated Revenue Fund. A special warrant is deemed to be an appropriation for the fiscal year in which it is issued.
CED uses the full accrual method of accounting to prepare and present its annual financial statements that make up part of the departmental results reporting process. However, the spending authorities voted by Parliament remain on an expenditure basis of accounting.
1.3 Financial structure of Canada Economic Development for Quebec Regions (CED)
CED manages its expenditures under two annual votes:
- Vote 1 – Net operating expenditures, which includes CED authorities related to personnel costs and operating and maintenance expenditures
- Vote 5 – Grants and contributions, which includes all authorities related to transfer payments
Expenses under budgetary statutory authorities, for which payments are made under legislation previously approved by Parliament and which are not part of the annual appropriations bills, include items such as the employer’s share of the employee benefit plan.
2. Highlights of fiscal quarter and fiscal year-to-date results
This section presents a variety of financial information as at December 31, 2025, including the authorities available for the year and expenditures incurred during the third quarter, as compared with the previous fiscal year.
The explanation of variances is based on the premise that discrepancies of less than 5% have a minimal impact on the interpretation of results.
The details of this financial information are provided in sections 2.1, 2.2 and in the tables in the Appendix.
2.1 Analysis of authorities
Authorities as at December 31, 2025, totalled $423.1M, compared with $337.3M as at December 31, 2024.
This year’s variance of $85.8M (+25.5%) is due to the following changes:
- Vote 1 – Net operating expenditures: +$2.9M
- Vote 5 – Grants and contributions: +$82.1M
- Budgetary statutory authorities: +$0.8M.
NB: Totals in the report may not add up due to rounding.
The chart below shows the annual budgetary appropriation authorities as at December 31, 2025, compared with the previous fiscal year.
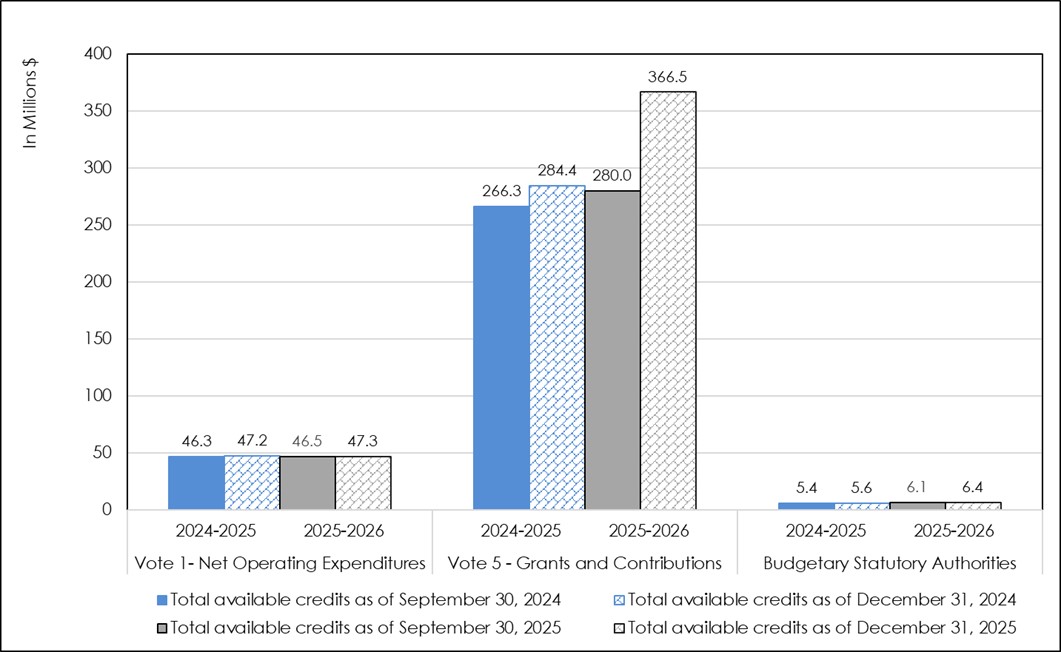
Graphic 1 - Text version: Annual budgetary appropriation authorities
Analysis of annual budgetary appropriation authorities: subdivided into three sections, this graph provides an overview of net available budgetary authorities (Vote 1 – Net Operating Expenditures; Vote 5 – Grants and Contributions; and Budgetary Statutory Authorities) as at September 30 and as at December 31st, 2025, including a comparison as at September 30 and as at December 31st, 2024.
As at December 31st, 2025, annual authorities under Vote 1 – Net Operating Expenditures, Vote 5 – Grants and Contributions, and Budgetary Statutory Authorities, totalled $50.2M ($47.3M in 2024–2025); $366.5M ($284.4M in 2024–2025); and $6.4M ($5.6M in 2024–2025), respectively.
As at September 30, 2025, annual authorities under Vote 1 – Net Operating Expenditures, Vote 5 – Grants and Contributions, and Budgetary Statutory Authorities, totalled $46.5M ($46.3M in 2024–2025); $280.0M ($266.3M in 2024–2025); and $6.1M ($5.4M in 2024–2025), respectively.
Vote 1 authorities (Net operating expenditures)
As at December 31, 2025, the authorities totalled $50.2M, compared with $47.3M as at December 31, 2024. This represents an increase of $2.9M (+6.1%) this year.
The increase in available operating credits is due primarily to the implementation of new initiatives during the fiscal year as well as the ratification of a new collective agreement. In effect, two initiatives providing funding for operating expenditures were approved over the year, the Regional Defence Investment Initiative (RDII) and the Regional Tariff Response Initiative (RTRI). Additional credits were also received following the ratification of the collective agreement for the Commerce and Purchasing group.
Vote 5 authorities (Grants and contributions)
As at December 31, 2025, authorities totalled $366.5M, compared with $284.4M as at December 31, 2024. This represents an increase of $82.1M (+28.9%) this year.
This variance stems from a number of items, some of which varied upward, others downward, amounting in a net decrease of $82.1M:
- Increase in funding (+$91.9M)
- Regional Tariff Response Initiative (RTRI): +$56.0M
- Regional Defense Investment Initiative (RDII): +$21.7M
- Support for Festivals: +$6.0M
- Regional Artificial Intelligence Initiative (RAII): +$3.6M
- Funding for a graphite mine expansion project: +$2.7M
- Miscellaneous items: +$1.9M
- Decrease in or end of funding for initiatives (-$9.8M)
- Regional Quantum Initiative (RQI): -$3.3M
- International Sustainability Standards Board (ISSB): -$2.7M
- Modernization of the slipway at the Port of Cap-aux-Meules: -$2.0M
- Hurricane Fiona Recovery Fund: -$1.8M
Budgetary statutory authorities
As at December 31, 2025, the authorities totalled $6.4M, compared with $5.6M as at December 31, 2024. The increase of $0.8M (+14.3%) can be attributed to the increase in credits associated with the employee benefits plan following a cost review by the Treasury Board Secretariat.
2.2 Analysis of expenditures
CED expenditures in the third quarter of 2025–2026 totalled $83.9M, compared with $88.8M for the same period last year. This represents a net year-over-year decrease of $4.9M (-5.5%).
This variance can be broken down as follows:
- Vote 1 – Net operating expenditures: -$0.6M
- Vote 5 – Grants and contributions: -$4.4M
- Budgetary statutory authorities: +$0.1M
On a cumulative basis as at December 31, 2025, expenditures amounted to $186.0M, compared with $195.4M for the same period a year ago. This represents a decrease of $9.4M (-4.8%) this year.
This variance can be broken down as follows:
- Vote 1 – Net operating expenditures: -$1.1M
- Vote 5 – Grants and contributions: -$8.8M
- Budgetary statutory authorities: +$0.5M
The chart below shows expenditures in the third quarter of 2025–2026 by budgetary appropriation, compared with the previous fiscal year.
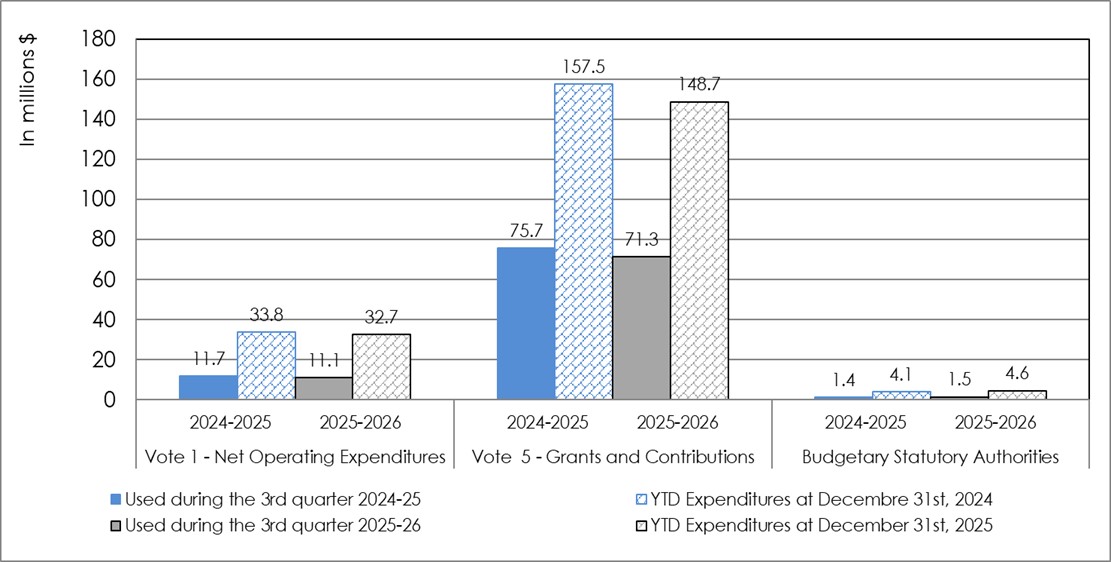
Graphic 2 - Text version Third quarter expenditures by budgetary appropriation as at September 30 and as at December 31st, fiscal year 2025 2026, compared with 2024–2025:
Analysis of third quarter expenditures and presentation of year-to-date expenditures by budgetary appropriation as at December 31st, fiscal year 2025–2026, compared with 2024–2025: subdivided into three sections, namely Vote 1 – Net Operating Expenditures, Vote 5 – Grants and Contributions, and Budgetary Statutory Authorities. This graph shows expenditures incurred during the third quarter of 2025–2026, as well as year-to-date expenditures as at September 30, 2025, and includes a comparison with fiscal year 2024–2025.
In the third quarter of 2025–2026, expenditures under Vote 1 (Net Operating Expenditures), Vote 5 (Grants and Contributions), and Budgetary Statutory Authorities, amounted to $11.1M ($11.7M in 2024–2025); $71.3M ($75.7M in 2024–2025); and $1.5M ($1.4M in 2024–2025), respectively.
Year-to-date expenditures as at December 31st, 2025, under Vote 1 (Net Operating Expenditures), Vote 5 (Grants and Contributions), and Budgetary Statutory Authorities, totalled $32.7M ($33.8M in 2024–2025); $148.7M ($157.5M in 2024–2025); and $4.6M ($4.1M in 2024–2025), respectively.
Vote 1 expenditures (Net operating expenditures)
CED’s net operating expenditures for the third quarter of 2025–2026 totalled $11.1M, compared with $11.7M in 2024–2025. This represents a decrease of $0.6M (-5.1%) this year.
In the third quarter of 2024–2025, the Agency achieved savings in professional services and in rental expenses. Over the past year, several analyses and one-time cost-sharing agreements have been implemented. Moreover, the centralization of certain information technology expenditures with Shared Services Canada, combined with the reduction of costs associated with certain licences, also contributes to the decrease in expenditures compared with the previous year.
Cumulative expenditures totalled $32.7M as at December 31, 2025, compared to $33.8M as at December 31, 2024. This is a non-significant decrease of $1.1M (-3.3%).
(For further details on these expenditures, see the table entitled “Departmental budgetary expenditures by standard object” in Appendix 6.2.)
Vote 5 expenditures (Grants and Contributions)
Grant and contribution expenditures for the third quarter of 2025–2026 totalled $71.3M, compared with $75.7M in 2024–2025, for a net year-over-year decrease of $4.4M (-5.8%).
In the third quarter, the decrease in expenditures observed is attributed primarily to the Community Futures Program (CFP). In 2024–2025, the agreements with the Centres d’aide aux entreprises and Community Futures were renegotiated, resulting in a shift of expenditures to the second and third quarters of 2024–2025.
On a cumulative basis as at December 31, 2025, expenditures totalled $148.7M, compared with $157.5M as at December 31, 2024, for a year-over-year decrease of $8.8M (-5.6%).
The decrease in spending is attributed primarily to the Regional Economic Growth through Innovation Fund (REGI). At the same time, the Agency focused on the launch and implementation of new one-time initiatives throughout the year, which partially offset the decrease in expenditures. These include the Regional Defense Investment Initiative (RDII) and the Regional Tariff Response Initiative (RTRI), which align with current government priorities.
Expenses under budgetary statutory authorities
Spending on statutory authorities in the third quarter of 2025–2026 totalled $1.5M, compared with $1.4M as at December 31, 2024, a year-over-year increase of $0.1M. Expenditures remained stable during the third quarters, with no significant variances to report.
Cumulative expenditures as at December 31, 2025, stood at $4.6M and consisted solely of employee benefit plan remittances. For comparison, as at December 31, 2024, expenditures totalled $4.1M, an increase of $0.5M (+12.2%). This variance is explained by a slight monthly increase in employee benefit remittances to the Treasury Board Secretariat.
(For further details on these expenditures, see the table entitled “Departmental budgetary expenditures by standard object” in Appendix 6.2.)
3. Risks and uncertainties
In an uncertain economic context marked by the rapidly changing needs of businesses and regions in Quebec, combined with the ongoing transformation of the governmental digital environment, CED faces some risks that could affect its ability to achieve its results and ensure the effective and safe delivery of its programs and services. The main risks identified during the quarter relate to the delivery of programs and services and information technology security.
Programs and services
The increasing complexity and diversity of the challenges faced by businesses and communities, particularly in the context of geopolitical and trade tensions and adjustments to the availability of government programs, may impact CED's ability to intervene effectively across the entire economic development continuum. This context increases the risk of diluting the impact of interventions and puts pressure on the Agency’s ability to target and carry out projects that generate significant outcomes.
To mitigate this risk, CED continues to adapt its interventions to regional and sectoral realities, implement its programs with flexibility and improve collaboration with its partners and other levels of government. The Agency relies on its network of regional business offices and an integrated approach to information, support and investment monitoring to better prioritize high-potential projects. The simplification and modernization of processes, particularly through the gradual deployment of transactional digital solutions, also help improve access to services and efficient delivery.
Information technologies
In a digital environment characterized by the intensification and sophistication of cyberthreats, CED remains exposed to the risk of cybersecurity incidents that could disrupt its operations, compromise the availability or integrity of its systems or harm its reputation.
To reduce this risk, CED continues to implement measures aimed at strengthening information security and organizational resilience. These include raising awareness and reinforcing training for personnel, the deployment and improvement of technical controls to prevent and detect incidents, updating business continuity plans and conducting simulation exercises. These actions aim to support the continuity of services, protect information and maintain the trust of clients and partners.
4. Significant changes to operations, personnel and programs
CED has completed the comprehensive review of expenditures to reduce and refocus spending based on the priorities set by the government for the coming fiscal years. CED will implement two new initiatives announced in Budget 2025. First, the Regional Tariff Response Initiative aims to help small and medium-sized enterprises boost their productivity, catalyze their growth and diversify their markets. Second, the Regional Defense Investment Initiative will support the scale-up of businesses and their integration into defence sector supply chains. It will also help build industrial capacities and strengthen innovation to meet Canada’s defence and security needs while fostering regional economic development.
5. Approval by senior officials
The purpose of this section is to provide the approval of senior officials, as required by the Policy on Financial Management, as follows:
Approved by:
_____________________________________
Sony Perron
Deputy Minister / President
Montréal, Canada
__________________________________
Maxime Garon
Chief Financial Officer
Montréal, Canada
6 Appendices
6.1 Statement of authorities (unaudited)
| Total available for use for the year ended March 31, 2026* | Used during the quarter ended December 31, 2025 | Year-to-date used at quarter-end | |
|---|---|---|---|
| Vote 1 – Net operating expenses | 50,220 | 11,098 | 32,683 |
| Vote 5 – Grants and contributions | 366,502 | 71,292 | 148,696 |
| Total budgetary statutory authorities | 6,433 | 1,533 | 4,600 |
| Total authorities | 423,155 | 83,923 | 185,979 |
| Total available for use for the year ended March 31, 2025* | Used during the quarter ended December 31, 2024 | Year-to-date used at quarter-end | |
|---|---|---|---|
| Vote 1 – Net operating expenses | 47,249 | 11,740 | 33,801 |
| Vote 5 – Grants and contributions | 284,428 | 75,684 | 157,455 |
| Total budgetary statutory authorities | 5,616 | 1,360 | 4,080 |
| Total authorities | 337,293 | 88,784 | 195,336 |
| *Includes only authorities available for use and granted by Parliament at quarter-end. | |||
6.2 Departmental budgetary expenditures by standard object (unaudited)
| Planned expenditures for the year ended March 31, 2026 | Used during quarter ended December 31, 2025 | Year-to-date used at quarter-end | |
|---|---|---|---|
| Expenditures: | |||
| Personnel* | 54,513 | 11,529 | 34,506 |
| Transport and communications | 327 | 210 | 418 |
| Information | 232 | 83 | 118 |
| Professional and special services | 2,932 | 427 | 1,062 |
| Rent | 913 | 338 | 912 |
| Repair and maintenance services | 47 | 12 | 42 |
| Public utilities, materials and supplies | 50 | 14 | 30 |
| Acquisition of land, buildings and works | 0 | 0 | 0 |
| Acquisition of machinery and equipment | 639 | 21 | 163 |
| Transfer payments | 366,502 | 71,292 | 148,696 |
| Other grants and payments | 0 | -3 | 32 |
| Total net budgetary expenditures | 423,155 | 83,923 | 185,979 |
| *Includes employee benefit plans (EBPs) | |||
| Planned expenditures for the year ended March 31, 2025 | Used during quarter ended December 31, 2024 | Year-to-date used at quarter end | |
|---|---|---|---|
| Expenditures: | |||
| Personnel* | 47,771 | 11,511 | 34,257 |
| Transport and communications | 345 | 174 | 633 |
| Information | 221 | 25 | 131 |
| Professional and special services | 3,029 | 627 | 1,211 |
| Rent | 773 | 552 | 1,034 |
| Repair and maintenance services | 19 | 89 | 116 |
| Utilities, materials and supplies | 59 | 24 | 64 |
| Acquisition of land, buildings and works | 0 | 0 | 0 |
| Acquisition of machinery and equipment | 648 | 112 | 391 |
| Transfer payments | 284,428 | 75,684 | 157,455 |
| Other grants and payments | 0 | -14 | 44 |
| Total net budgetary expenditures | 337,293 | 88,784 | 195,336 |
| * Includes employee benefits plans (EBPs) | |||