
Quarterly Financial Report for the Quarter Ended June 30, 2024
Table of contents
- Introduction
- Highlights of Fiscal Quarter and Fiscal Year-to-Date Results
- Risks and Uncertainties
- Significant Changes to Operations, Personnel and Programs
- Approval by Senior Officials
- Appendices
1. Introduction
This quarterly financial report has been prepared by Canada Economic Development for Quebec Regions (CED) as required under section 65.1 of the Financial Administration Act and in the form and manner prescribed by the Treasury Board.
This report should be read in conjunction with the 2024–2025 Estimates and the 2024–2025 Departmental Plan.
This document has not been subject to external audit or review.
1.1 Authorities, mandate and programs
The mission of Canada Economic Development for Quebec Regions (CED) is to promote the long-term economic development of the regions of Quebec by giving special attention to those where slow economic growth is prevalent or opportunities for productive employment are inadequate.
CED is the key federal player in Quebec for the promotion of economic development in the regions and among small and medium-sized businesses (SMEs). To achieve its core responsibility, which consists of developing the Quebec economy, CED fosters business startups and performance. It helps businesses become more innovative and enhance their productivity and competitiveness. It also supports community engagement efforts in the various regions of Quebec and helps attract investments designed to boost the economic prosperity of Quebec and Canada.
CED contributes to the economic vitality of all regions of Quebec by leveraging their regional competitive advantages . It supports the transition and diversification of communities that remain dependent on a limited number of sectors, or that have been affected by an economic shock, such as the closure of the chrysotile mines.
CED achieves its results by supporting businesses —primarily SMEs —and non-profit organizations (NPOs ) through strategic investments. With the help of its 12 business offices located in the various regions of Quebec, and relying on the ties it has developed with the other economic development players, CED stays abreast of the needs of the regions and businesses and is able to provide funding for projects that support the development of businesses and communities.
CED has three categories of programs that support its core responsibility:
- Regional Innovation
- Community Vitality
- Targeted or Temporary Support
Additional information about CED’s authority, mandate and programs can be found in the 2024–2025 Estimates and the 2024–2025 Departmental Plan.
1.2 Basis of presentation
This quarterly report was prepared by CED using an expenditure basis of accounting. The accompanying Statement of Authorities includes CED’s spending authorities granted by Parliament and used by CED, consistent with the 2024–2025 Main Estimates. This quarterly report was prepared using a special-purpose financial reporting framework designed to meet financial information needs regarding the use of spending authorities.
Prior authority from Parliament is required before funds can be spent by the Government. Authorities available for use are given in the form of annually approved limits through appropriation acts or through legislation in the form of statutory authority for specific purposes.
When Parliament is dissolved for the purposes of a general election, section 30 of the Financial Administration Act gives the Governor General the power, under certain conditions, to issue a special warrant authorizing the government to withdraw funds from the Consolidated Revenue Fund. A special warrant is deemed to be an appropriation for the fiscal year in which it is issued.
CED uses the full accrual method of accounting to prepare and present its annual financial statements that make up part of the departmental results reporting process. However, the spending authorities voted by Parliament remain on an expenditure basis of accounting.
1.3 Financial structure of Canada Economic Development for Quebec Regions (CED)
CED manages its expenditures under two annual votes:
- Vote 1 – Net operating expenditures, which includes CED authorities related to personnel costs and operating and maintenance expenditures
- Vote 5 – Grants and contributions, which includes all authorities related to transfer payments
Expenses under budgetary statutory authorities, for which payments are made under legislation previously approved by Parliament and which are not part of the annual appropriations bills, include items such as the employer’s share of the employee benefit plan.
2. Highlights of fiscal quarter and fiscal year-to-date results
This section presents a variety of financial information as at June 30, 2024, including the authorities available for the year and expenditures incurred during the first quarter, as compared with the previous fiscal year.
The explanation of variances is based on the premise that discrepancies of less than 5% have a minimal impact on the interpretation of results.
Details regarding this financial information can be found in sections 2.1 and 2.2, and in the tables in the appendices.
2.1 Analysis of authorities
Authorities as at June 30, 2024, totalled $316.2M, compared with $484.7M as at June 30, 2023.
This year’s variance of $168.5M (-34.8%) is due to the following changes:
- Vote 1 – Net operating expenditures: -$0.8M
- Vote 5 – Grants and contributions: -$167.4M
- Budgetary statutory authorities: -$0.3M
NB: Totals in the report may not add up because of rounding off.
The chart below shows the annual budgetary appropriation authorities as at June 30, 2024, compared with the previous fiscal year.
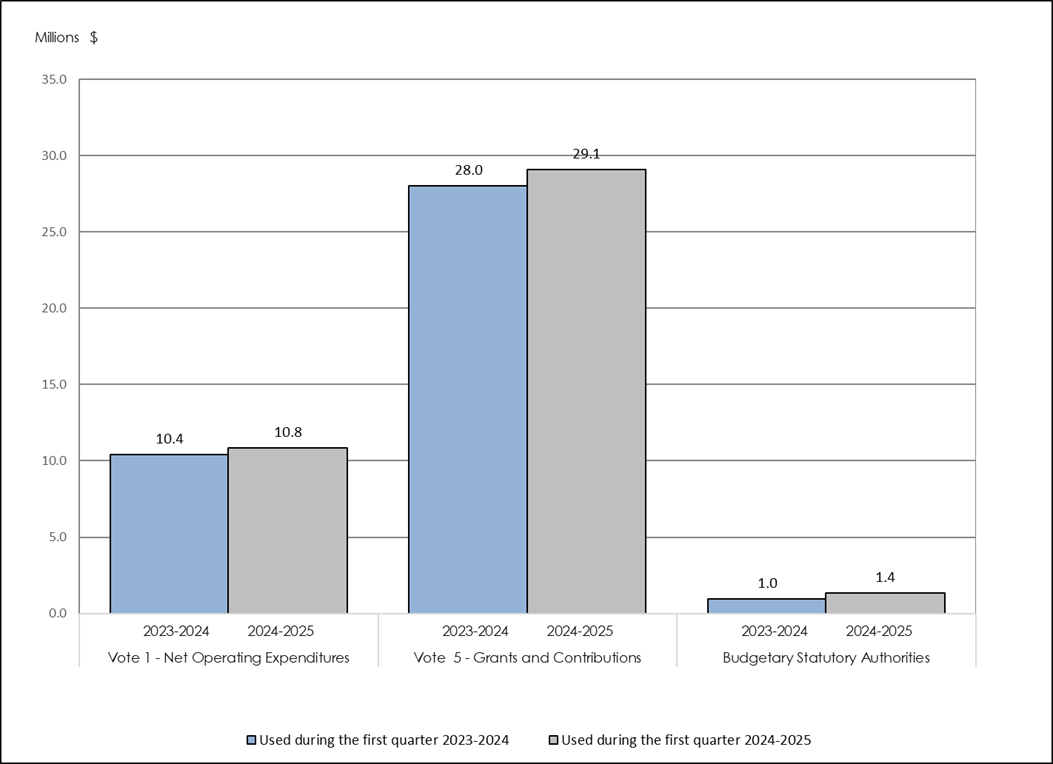
Image 1 - Text Version:
Analysis of annual budgetary appropriation authorities: subdivided into three sections, this graph provides an overview of net available budgetary authorities (Vote 1 – Net Operating Expenditures; Vote 5 – Grants and Contributions; and Budgetary Statutory Authorities) as at June 30, 2024, including a comparison as at June 30, 2023.As at June 30, 2024, annual authorities under Vote 1 – Net Operating Expenditures, Vote 5– Grants and Contributions, and Budgetary Statutory Authorities, totalled $44.5M ($45.3M in 2023-2024), $266.3M ($433.7M in 2023–2024) and $5.4M ($5.7M in 2023 2024), respectively.
Vote 1 authorities (Net operating expenditures)
As at June 30, 2024, authorities totalled $44.5M, compared with $45.3M as at June 30, 2023. This represents a drop of $0.8M this year.
The 1.8% variance is considered insignificant.
Vote 5 authorities (Grants and contributions)
As at June 30, 2024, grant and contribution (G&C) authorities totalled $266.3M, compared with $433.7M as at June 30, 2023, representing a net decrease of $167.4M (-38.6%) this year.
This variance consists of a number of items, some of which varied upward, others downward.
The main reason for this decrease is the end, on March 31, 2024,(*) of several temporary economic recovery initiatives put in place to address the impacts of the pandemic.
The most significant variances are:
-
- Increase in funding (+$20.7M)
- Tourism Growth Program: +$8.6M
- Transfers to/from other departments: +$3.9M
- Support for Regional Quantum Innovation initiative: +$3.5M
- Modernisation of the slipway at the port of Cap-aux-Meules on the Magdalen Islands: +$2.0M
- Hurricane Fiona Recovery Fund: +$1.8M
- Other elements: +$0.9M
- Increase in funding (+$20.7M)
-
- Decrease in, or end of, funding (-$188.1M)
- Jobs and Growth Fund: -$57.9M
- Aerospace Regional Recovery Initiative: -$43.9M
- Canada Community Revitalization Fund: -$30.5M
- Major Festivals and Events Support Initiative: -$26.1M
- Tourism Relief Fund: -$22.5M
- Initiative for the development of regional economic infrastructure in Quebec: -$4.8M
- Black Entrepreneurship Program: -$2.4M
- Decrease in, or end of, funding (-$188.1M)
* Most of the operational funding provided for temporary economic recovery initiatives ended in 2022–2023 ; however, the initiatives were extended, and unused funds from 2022–2023 were carried over to 2023–2024.
Budgetary statutory authorities
As at June 30, 2024, authorities totalled $5.4M, compared with $5.7M as at June 30, 2023. This represents a decrease of $0.3M (-5.2%) this year. This decrease can be explained by the end, on March 31, 2024, of funding for salaries associated with economic recovery initiatives, which resulted in a drop in employee benefit plan authorizations.
2.2 Analysis of expenditures
CED expenditures in the first quarter of 2024–2025 totalled $41.3M, compared with $39.4M in the same period in the previous year. This represents a net year-over-year increase of $1.9M (4.8 %).
This variance can be broken down as follows:
- Vote 1 – Net operating expenditures: +$0.4M
- Vote 5 – Grants and contributions: +$1.1M
- Budgetary statutory authorities: +$0.4M
The chart below shows expenditures in the first quarter of 2024–2025 by budgetary appropriation, compared with the previous fiscal year.
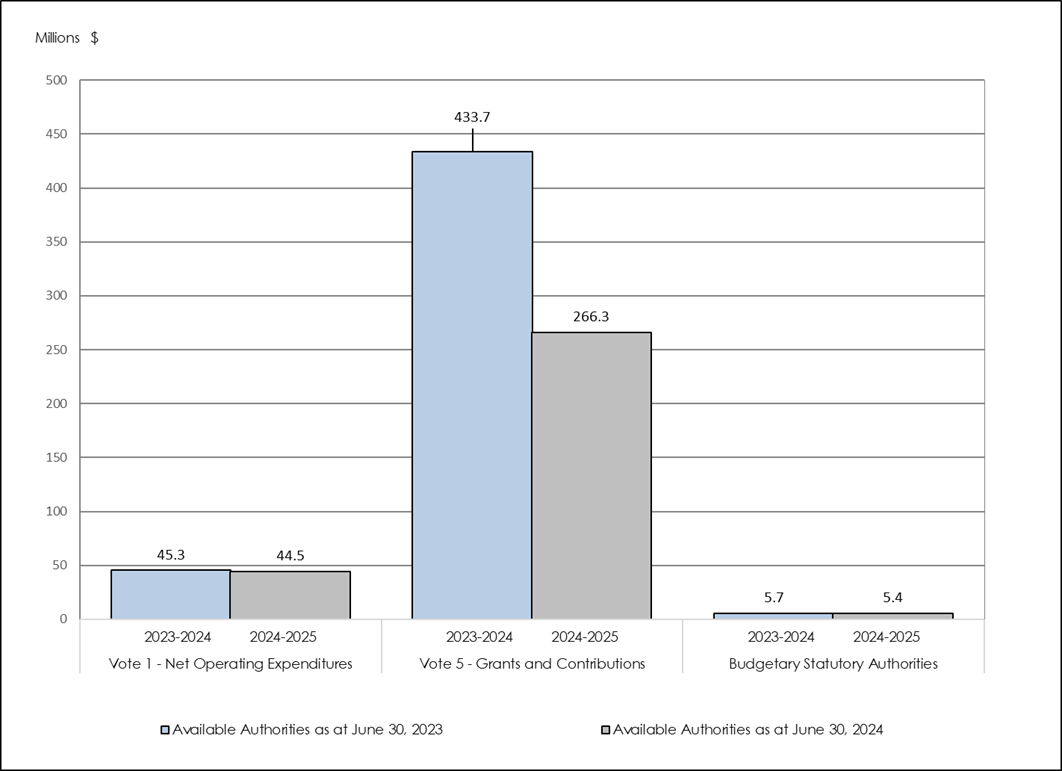
Image 2 - Text Version:
Analysis of first quarter expenditures and presentation of year-to-date expenditures by budgetary appropriation as at June 30, fiscal year 2024–2025, compared with 2023 2024: subdivided into three sections, namely Vote 1 – Net Operating Expenditures, Vote 5 – Grants and Contributions, and Budgetary Statutory Authorities. This graph shows expenditures incurred during the first quarter of 2024–2025 and includes a comparison with fiscal year 2023-2024.
In the first quarter of 2024–2025, expenditures under Vote 1 (Net Operating Expenditures), Vote 5 (Grants and Contributions), and Budgetary Statutory Authorities, amounted to $10.8M ($10.4M in 2023–2024), $29.1M ($28.0M in 2023–2024) and $1.4M ($1.0M in 2023–2024), respectively.
Vote 1 expenditures (Net operating expenditures)
CED’s net operating expenditures for the first quarter of 2024–2025 totalled $10.8M, compared with $10.4M in 2023–2024. This represents an increase of $0.4M ( 4.4%) this year.
On the one hand, operating expenditures included a significant rise in payroll expenditures in the first quarter of 2024–2025 resulting from the ratification of numerous collective agreements in 2023–2024 and the repatriation of in-house expertise from business information services in mid-2023–2024, which required the hiring of staff. Spending on professional services, on the other hand, fell sharply.
Vote 5 expenditures (Grants and contributions)
Grant and contribution (G&C) expenditures for the first quarter of 2024–2025 totalled $29.1M, compared with $28.0M in 2023 –2024, representing a net increase of $1.1M (3.9%) this year.
A significant decrease was reported in spending on temporary and targeted initiatives, resulting from the end of economic recovery initiatives on March 31, 2024. However, CED is still delivering its regular programs, i.e., the Quebec Economic Development Program (PDEQ) and the Regional Economic Growth through Innovation (REGI) program, for which there was a significant increase in spending in the first quarter of 2024–2025. These variations offset each other, resulting in an increase in G&C spending (+$1.1M). Total spending remains stable, year‑over‑year.
Expenditures under budgetary statutory authorities budgétaires
Spending on statutory authorities in the first quarter of 2024–2025 totalled $1.4M, compared with $1.0M as at June 30, 2023, representing a year-over-year increase of $0.4M (40.0%).
This increase can be explained by timing differences for employee benefit remittances to the Treasury Board Secretariat: in 2023-2024, expenditures for June were paid in July, whereas in 2024–2025, the payments were made in June. A variance is therefore foreseeable for the next quarter.
(For further details on these expenditures, see the table entitled “Departmental budgetary expenditures by standard object” in Appendix 6.2.)
3. Risks and uncertainties
The COVID-19 pandemic highlighted the dependence on technological infrastructure and the related risks, as well as the risks associated with data protection. Public organizations are a prime target, and hackers are becoming increasingly creative in their activities. As a result, there is a risk that a cybersecurity incident could disrupt CED’s operations and harm the organization’s reputation.
With a view to mitigating these risks, CED continues to take active cybersecurity measures. The organization has also implemented a cybersecurity awareness and training strategy to equip and prepare staff to adopt the right reflexes when dealing with situations involving cybersecurity issues.
In recent years, CED has faced challenges in terms of worker attraction and retention, given the competitive job market and the lack of skilled and diversified workers. The organization has also had to deal with the challenge of developing the digital skills of its workforce to keep up with rapid technological advances and changing business models. Consequently, there is a risk that CED’s workforce will not be sufficiently skilled, well-equipped, committed and diversified to support the service modernization agenda and meet the needs of businesses and economic development support organizations in all regions of Quebec.
Hence, CED is preparing the launch of its digital skills framework with a view to fostering a culture of continuous learning and providing its staff with professional development opportunities that focus on digital skills to ensure that they are ready to meet the challenges of the future.
The unfavourable economic context—inflationary pressures, high interest rates and the reorganization of supply chains—is having a negative impact on Quebec businesses. The needs and expectations of SMEs are high in terms of support for the investments they need to make to adapt and grow. Consequently, there is a risk that CED’s programs will not be sufficiently tailored to the needs of SMEs, and this could have a negative impact on CED’s capacity to provide strategic and ongoing support for their business projects.
To help Quebec businesses deal with the upheaval of this new economic context, CED is continuing to tailor the implementation of its regular programs to meet emerging and priority needs based on the realities in the various regions. CED also provides referral and information services to help connect businesses with the most appropriate support and funding organizations.
4. Significant changes to operations, personnel, and programs
The most noteworthy change for CED in 2024–2025 stems from the end, on March 31, 2024, of the economic recovery initiatives announced in Budget 2021. These initiatives made up the bulk of temporary and targeted initiative budgets and spending. CED is returning to pre-pandemic budget levels as it deals with a significant reduction in these grant and contribution budgets.
In addition, CED is continuing its efforts as part of the Refocusing Government Spending exercise, announced in Budget 2023, by reducing its spending on travel and professional services.
5. Approval by Senior Officials
The purpose of this section is to provide the approval of senior officials, as required by the Policy on Financial Management, as follows:
Approved by :
_____________________________________
Sony Perron
Deputy Minister / President
Montréal, Canada
__________________________________
Maxime Garon
Chief Financial Officer
Montréal, Canada
6 Appendices
6.1 Statement of authorities (unaudited)
| Total available for use for the year ended March 31, 2025* | Used during the quarter ended June 30, 2024 | Year-to-date used at quarter-end | |
|---|---|---|---|
| Vote 1 – Net Operating expenditures | 44, 487 | 10, 857 | 10, 857 |
| Vote 5 – Grants and contributions | 266, 262 | 29, 084 | 29, 084 |
| Total budgetary statutory authorities | 5, 440 | 1, 360 | 1, 360 |
| Total authorities | 316, 189 | 41, 301 | 41, 301 |
| Total available for use for the year ended March 31, 2024* | Used during the quarter ended June 30, 2023 | Year-to-date used at quarter-end | |
|---|---|---|---|
| Vote 1 – Net Operating expenditures | 45 283 | 10 403 | 10 403 |
| Vote 5 – Grants and contributions | 433 653 | 28 022 | 28 022 |
| Total budgetary statutory authorities | 5 733 | 955 | 955 |
| Total authorities | 484 669 | 39 380 | 39 380 |
| * Includes only authorities available for use and granted by Parliament at quarter-end. | |||
6.2 Departmental budgetary expenditures by standard object (unaudited)
| Planned expenditures for the year ended March 31, 2025 | Expenditures during the quarter ended June 30, 2024 | Year-to-date used at quarter-end | |
|---|---|---|---|
| Dépenses : | |||
| Personnel* | 44, 864 | 11, 198 | 11, 198 |
| Transport and communications | 341 | 263 | 263 |
| Information | 218 | 62 | 62 |
| Professional and special services | 3, 024 | 188 | 188 |
| Leasing | 763 | 381 | 381 |
| Repairs and maintenance | 19 | 17 | 17 |
| Public utilities, materials and supplies | 58 | 28 | 28 |
| Acquisition of land and buildings, and works | 0 | 0 | 0 |
| Acquisition of machinery and equipment | 640 | 36 | 36 |
| Transfer payments | 266 262 | 29 084 | 29 084 |
| Other grants and payments | 0 | 44 | 44 |
| Total net budgetary expenditures | 316 189 | 41 301 | 41 301 |
| * Includes employee benefit plans (EBPs). | |||
| Planned expenditures for the year ended March 31, 2024 | Expenditures during the quarter ended June 30, 2023 | Year-to-date used at quarter-end | |
|---|---|---|---|
| Expenses: | |||
| Personnel* | 43 456 | 9 692 | 9 692 |
| Transport and communications | 580 | 137 | 137 |
| Information | 308 | 38 | 38 |
| Professional and special services | 4 646 | 945 | 945 |
| Rentals | 886 | 457 | 457 |
| Repairs and maintenance | 28 | 21 | 21 |
| Public utilities, materials and supplies | 102 | 9 | 9 |
| Acquisition of land and buildings, and works | 0 | 0 | 0 |
| Acquisition of machinery and equipment | 1 010 | 17 | 17 |
| Transfer payments | 433 653 | 28 022 | 28 022 |
| Other grants and payments | 0 | 42 | 42 |
| Total net budgetary expenditures | 484 669 | 39 380 | 39 380 |
| * Includes employee benefit plans (EBPs). | |||