
Quarterly Financial Report for the Quarter Ended
September 30, 2024
About this publication
Publication author: Canada Economic Development for Quebec Regions
ISSN: 2368-6545
ISBN/Catalogue : Iu90-1/19E-PDF
Publish date: November 19, 2024
Table of contents
- Introduction
- Highlights of Fiscal Quarter and Fiscal Year-to-Date Results
- Risks and Uncertainties
- Significant Changes to Operations, Personnel and Programs
- Approval by Senior Officials
- Appendices
1. Introduction
This quarterly financial report has been prepared by Canada Economic Development for Quebec Regions (CED) as required under section 65.1 of the Financial Administration Act and in the form and manner prescribed by the Treasury Board.
This report should be read in conjunction with the 2024–2025 Estimates and the 2024–2025 Departmental Plan.
This document has not been subject to external audit or review.
1.1 Authorities, mandate and programs
The mission of Canada Economic Development for Quebec Regions (CED) is to promote the long-term economic development of the regions of Quebec by giving special attention to those where slow economic growth is prevalent or opportunities for productive employment are inadequate.
CED is the key federal player in Quebec for the promotion of economic development in the regions and among small and medium-sized businesses (SMEs). To achieve its core responsibility, which consists of developing the Quebec economy, CED fosters business startups and performance. It helps businesses become more innovative and enhance their productivity and competitiveness. It also supports community engagement efforts in the various regions of Quebec and helps attract investments designed to boost the economic prosperity of Quebec and Canada.
CED contributes to the economic vitality of all regions of Quebec by leveraging their regional competitive advantages . It supports the transition and diversification of communities that remain dependent on a limited number of sectors, or that have been affected by an economic shock, such as the closure of the chrysotile mines.
CED achieves its results by supporting businesses —primarily SMEs —and non-profit organizations (NPOs) through strategic investments. With the help of its 12 business offices located in the various regions of Quebec, and relying on the ties it has developed with the other economic development players, CED stays abreast of the needs of the regions and businesses and is able to provide funding for projects that support the development of businesses and communities .
CED has three categories of programs that support its core responsibility:
- Regional Innovation
- Community Vitality
- Targeted or Temporary Support
Additional information about CED’s authority, mandate and programs can be found in the 2024–2025 Estimates and the 2024–2025 Departmental Plan.
1.2 Basis of presentation
This quarterly report was prepared by CED using an expenditure basis of accounting. The accompanying Statement of Authorities includes CED’s spending authorities granted by Parliament and used by CED, consistent with the 2024–2025 Main Estimates. This quarterly report was prepared using a special-purpose financial reporting framework designed to meet financial information needs regarding the use of spending authorities.
Prior authority from Parliament is required before funds can be spent by the Government. Authorities available for use are given in the form of annually approved limits through appropriation acts or through legislation in the form of statutory authority for specific purposes.
When Parliament is dissolved for the purposes of a general election, section 30 of the Financial Administration Act gives the Governor General the power, under certain conditions, to issue a special warrant authorizing the government to withdraw funds from the Consolidated Revenue Fund. A special warrant is deemed to be an appropriation for the fiscal year in which it is issued.
CED uses the full accrual method of accounting to prepare and present its annual financial statements that make up part of the departmental results reporting process. However, the spending authorities voted by Parliament remain on an expenditure basis of accounting.
1.3 Financial structure of Canada Economic Development for Quebec Regions (CED)
CED manages its expenditures under two annual votes:
- Vote 1 – Net operating expenditures, which includes CED authorities related to personnel costs and operating and maintenance expenditures
- Vote 5 – Grants and contributions, which includes all authorities related to transfer payments
Expenses under budgetary statutory authorities, for which payments are made under legislation previously approved by Parliament and which are not part of the annual appropriations bills, include items such as the employer’s share of the employee benefit plan.
2. Highlights of fiscal quarter and fiscal year-to-date results
This section presents a variety of financial information as at September 30, 2024, including the authorities available for the year and expenditures incurred during the first quarter, as compared with the previous fiscal year.
The explanation of variances is based on the premise that discrepancies of more or less than 5% have a minimal impact on the interpretation of results.
The details of this financial information are provided in sections 2.1 and 2.2, and in the tables in the Appendix.
2.1 Analysis of authorities
Authorities as at September 30, 2024, totalled $318M, compared with $316.2M as at June 30, 2024. The $1.8M (0.6%) variance is considered not significant.
On a cumulative basis, a decrease was observed in CED’s total annual authorities year-over-year. As at September 30, 2023, they stood at $486.2M.
This year’s variance of $168.5M (-34.8%) is due to the following changes:
- Vote 1 – Net operating expenditures: -$0.5M
- Vote 5 – Grants and contributions: -$167.4M
- Budgetary statutory authorities: -$0.3M
NB: Totals in the report may not add up because of rounding off.
The chart below shows the annual budgetary appropriation authorities as at September 30, 2024, compared with the previous fiscal year.
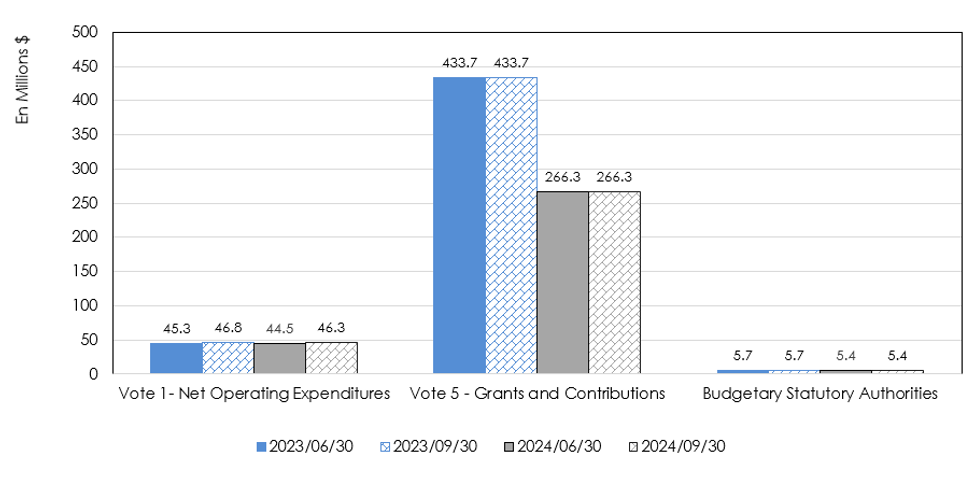
Image 1 - Text Version:
Analysis of annual budgetary appropriation authorities: subdivided into three sections, this graph provides an overview of net available budgetary authorities (Vote 1 – Net Operating Expenditures; Vote 5 – Grants and Contributions; and Budgetary Statutory Authorities) as at June 30 and as at September 30, 2024, including a comparison as at June 30 and as at September 30, 2023.
As at September 30, 2024, annual authorities under Vote 1 – Net Operating Expenditures, Vote 5 – Grants and Contributions, and Budgetary Statutory Authorities, totalled $46.3M ($46.8M in 2023–2024); $266.3M ($433.7M in 2023–2024); and $5.4M ($5.7M in 2023–2024), respectively.
As at June 30, 2024, annual authorities under Vote 1 – Net Operating Expenditures, Vote 5 – Grants and Contributions, and Budgetary Statutory Authorities, totalled $44.5M ($45.3M in 2023–2024); $266.3M ($433.7M in 2023–2024); and $5.4M ($5.7M in 2023–2024), respectively.
Vote 1 authorities (Net operating expenditures)
As at September 30, 2024, authorities totalled $46.3M, compared with $46.8M as at September 30, 2023. This represents a drop of $0.5M (-1.1 %) this year.
Vote 5 authorities (Grants and contributions)
As at September 30, 2024, grant and contribution (G&C) authorities totalled $266.3M, compared with $433.7M as at September 30, 2023, representing a decrease of $167.4M (-38.6%).
This variance consists of several items, some of which varied upward, others downward, for a net decrease of $167.4M:
- Increase in funding (+$18.4M)
- Tourism Growth Program: +$8.6M
- End of transfer to Fisheries and Oceans Canada for the Quebec Fisheries Fund: +$6.0M
- Support for Regional Quantum Innovation initiative: +$3.5M
- Other elements: +$0.3M
- End of funding for various initiatives (-$185.8M)
- Jobs and Growth Fund: -$57.9M
- Aerospace Regional Recovery Initiative: -$43.9M
- Canada Community Revitalization Fund: -$30.5M
- Major Festivals and Events Support Initiative: -$26.1M
- Tourism Relief Fund: -$22.5M
- Initiative for the development of regional economic infrastructure in Quebec: -$4.9M
Budgetary statutory authorities
As at September 30, 2024, authorities totalled $5.4M, compared with $5.7M as at September 30, 2023. This represents a decrease of $0.3M (-5.3%). This decrease can be explained by the absence of carryover of funding for salaries associated with economic recovery initiatives in the operating budget for the 2024-2025 financial year, which resulted in a drop in employee benefit plan authorizations.
2.2 Analysis of expenditures
CED expenditures in the second quarter of 2024–2025 totalled $65.2M, compared with $78.0M for the same period a year ago. This represents a net year-over-year decrease of $12.8M (-16.4%).
This variance can be broken down as follows:
- Vote 1 – Net operating expenditures: +$0.9M
- Vote 5 – Grants and contributions: -$13.1M
- Budgetary statutory authorities: -$0.6M
On a cumulative basis, as at September 30, 2024, expenditures amounted to $106.5M, compared with $117.4M for the same period a year ago. This represents a decrease of $10.9M (-9.3%) this year.
This variance can be broken down as follows:
- Vote 1 – Net operating expenditures: +$1.4M
- Vote 5 – Grants and contributions: -$12.1M
- Budgetary statutory authorities: -$0.2M
The chart below shows expenditures in the second quarter of 2024–2025 by budgetary appropriation, compared with the previous fiscal year.
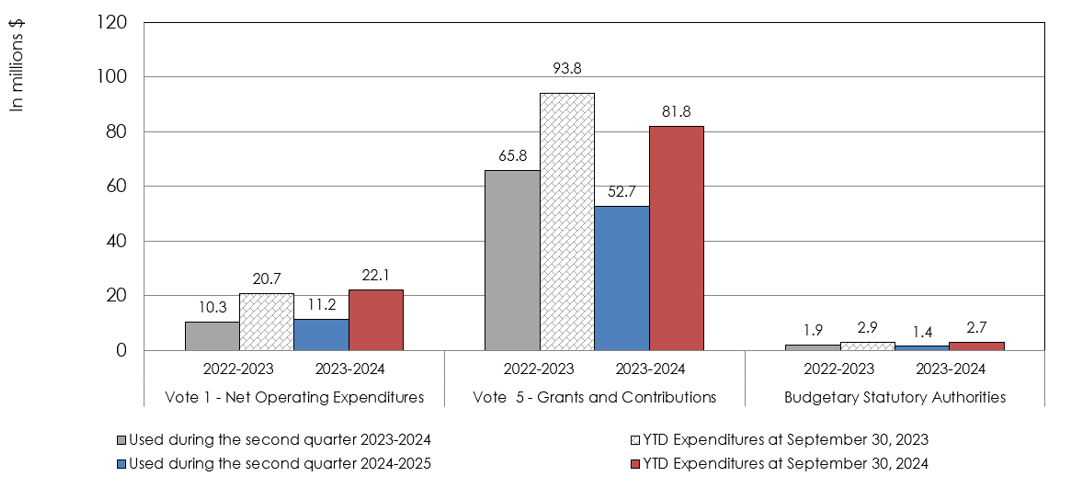
Image 2 - Text Version:
In the second quarter of 2024–2025, expenditures under Vote 1 (Net Operating Expenditures), Vote 5 (Grants and Contributions), and Budgetary Statutory Authorities, amounted to $11.2M ($10.3M in 2023–2024); $52.7M ($65.8M in 2023–2024); and $1.4M ($1.9M in 2023–2024), respectively.
Year-to-date expenditures as at September 30, 2024, under Vote 1 (Net Operating Expenditures), Vote 5 (Grants and Contributions), and Budgetary Statutory Authorities, totalled $22.1M ($20.7M in 2023-2024); $81.8M ($93.8M in 2023–2024); and $2.7M ($2.9M in 2023–2024), respectively.
Vote 1 expenditures (Net operating expenditures)
CED’s net operating expenditures for the second quarter of 2024–2025 totalled $11.2M, compared with $10.3M in 2023–2024. This represents an increase of $0.9M (8.7%) this year.
Operating expenses, including payroll expenditures, rose in the second quarter of 2024–2025. This increase can be attributed to the ratification of several collective agreements in 2023–2024, covering several years, as well as the repatriation of in-house expertise from business information services in mid–2023-2024, which required the hiring of additional personnel. Furthermore, fit-up costs were incurred because of the increased number of employees working in the office. Spending on professional services, on the other hand, fell sharply.
Cumulative expenditures totalled $22.1M as at September 30, 2024, compared with $20.7M as at September 30, 2023. This represents an increase of $1.4M (6.8%) this year and is primarily attributable to the salary expenditures and office equipment mentioned above.
(For further details on these expenditures, see the table entitled “Departmental budgetary expenditures by standard object” in Appendix 6.2.)
Vote 5 expenditures (Grants and contributions)
Grant and contribution expenditures for the second quarter of 2024–2025 totalled $52.7M, compared with $65.8M in 2023–2024. This represents a year-over-year drop of $13.1M (-19.9%).
Spending on temporary and targeted initiatives fell with the end of the economic recovery programs on March 31, 2024. However, CED is still delivering its regular programs, namely the Quebec Economic Development Program (QEDP) and the Regional Economic Growth through Innovation (REGI) program, for which there was a significant increase in spending in the second quarter of 2024–2025.
On a cumulative basis, as at September 30, 2024, expenditures amounted to $81.8M, compared with $93.8M for the same period a year ago. This represents a decrease of $12.0M (-12.8%) this year, for the same reasons noted above.
Expenditures under budgetary statutory authorities
Spending on statutory authorities in the second quarter of 2024–2025 totalled $1.4M, compared with $1.9M as at September 30, 2023, for a year-over-year decrease of $0.5M (-26.3%). This variance can be explained by the advance payment made in the first quarter of 2023–2024 as a result of an accounting difference regarding employee benefit remittances to the Treasury Board Secretariat. In 2023–2024, expenditures for June were paid in July, whereas in 2024–2025, the payments were made in June.
On a cumulative basis, as at September 30, 2024, expenditures amounted to $2.7M, compared with $2.9M as at September 30, 2023. This represents a drop of $0.2M (-6.9%) this year. This decrease can be exclusively attributed to the quarterly employee benefit remittances to the Treasury Board Secretariat in 2023–2024.
(For further details on these expenditures, see the table entitled “Departmental budgetary expenditures by standard object” in Appendix 6.2.)
3. Risks and uncertainties
The post-pandemic context marked by an anticipated economic slowdown is fuelling the risk that businesses, now more indebted and having exhausted their contingency funds, will cancel their investment projects to modernize their operations. Businesses have also had to deal with related challenges, such as supply chain disruptions, rising interest rates and operating costs, and labour shortages. To help Quebec businesses in this new and changing economic context, CED will continue to implement some of the economic recovery initiatives announced in Budget 2021. Furthermore, to facilitate the delivery of services to its clients, CED will be setting up a new client portal and reviewing its continuum of services.
CED manages the allocation of resources within a well-defined framework of accountability, policies and procedures. The organization will continue to develop financial risk mitigation measures by rigorously managing its budgetary and allocation processes, supported by a series of financial controls. Internal controls over financial reporting, such as entity controls, general IT controls, and business process controls, are only a few examples of mitigation measures designed to support the sound management of public funds, within the limits of available resources and parliamentary authorities.
CED is also pursuing the stabilization of the SAP solution and the development of complementary tools. It should be noted that the rollout of the new SAP system has had a significant impact on the business intelligence tools required for G&C program delivery. To mitigate this risk, a governance structure has been put in place to ensure better planning and to optimize investment in the development of management reports and dashboards.
4. Significant changes to operations, personnel, and programs
The most noteworthy change for CED in 2024–2025 stems from the end, on March 31, 2024, of the economic recovery initiatives announced in Budget 2021. These initiatives made up the bulk of temporary and targeted initiative budgets and spending. CED is returning to pre-pandemic budget levels as it deals with a significant reduction in these grant and contribution budgets.
In addition, CED is continuing its efforts as part of the Refocusing Government Spending exercise , announced in Budget 2023, by reducing its spending on travel and professional services.
CED will also be called upon to contribute to the government-wide effort Refocusing Government Spending Version II announced in Budget 2024.
5. Approval by Senior Officials
The purpose of this section is to provide the approval of senior officials, as required by the Policy on Financial Management, as follows:
Approved by :
_____________________________________
Sony Perron
Deputy Minister / President
Montréal, Canada
__________________________________
Maxime Garon
Chief Financial Officer
Montréal, Canada
6. Appendices
6.1 Statement of authorities (unaudited)
| Total available for use for the year ended March 31, 2025* | Used during the quarter ended September 30, 2024 | Year-to-date used at quarter-end | |
|---|---|---|---|
| Vote 1 – Net Operating expenditures | 46,270 | 11,204 | 22,061 |
| Vote 5 – Grants and contributions | 266,262 | 52,687 | 81,771 |
| Total budgetary statutory authorities | 5,440 | 1,360 | 2,721 |
| Total authorities | 317,972 | 65,251 | 106,553 |
| Total available for use for the year ended March 31, 2024* | Used during the quarter ended September 30, 2023 | Year-to-date used at quarter-end | |
|---|---|---|---|
| Vote 1 – Net Operating expenditures | 46,824 | 10,297 | 20,699 |
| Vote 5 – Grants and contributions | 433,653 | 65,819 | 93,841 |
| Total budgetary statutory authorities | 5,734 | 1,911 | 2,867 |
| Total authorities | 486,211 | 78,027 | 117,407 |
| * Includes only authorities available for use and granted by Parliament at quarter-end. | |||
6.2 Departmental budgetary expenditures by standard object (unaudited)
| Planned expenditures for the year ended March 31, 2025 | Expenditures during the quarter ended September 30, 2024 | Year-to-date used at quarter-end | |
|---|---|---|---|
| Expenses: | |||
| Personnel* | 46,647 | 11,548 | 22,746 |
| Transport and communications | 341 | 196 | 459 |
| Information | 218 | 43 | 105 |
| Professional and special services | 3,024 | 396 | 583 |
| Leasing | 763 | 102 | 483 |
| Repairs and maintenance | 19 | 10 | 27 |
| Public utilities, materials and supplies | 58 | 12 | 41 |
| Acquisition of land and buildings, and works | 0 | 0 | 0 |
| Acquisition of machinery and equipment | 640 | 242 | 279 |
| Transfer payments | 266,262 | 52,687 | 81,771 |
| Other grants and payments | 0 | 15 | 59 |
| Total net budgetary expenditures | 317,972 | 65,251 | 106,553 |
| * Includes employee benefit plans (EBPs). | |||
| Planned expenditures for the year ended March 31, 2024 | Expenditures during the quarter ended September 30, 2023 | Year-to-date used at quarter-end | |
|---|---|---|---|
| Expenses: | |||
| Personnel* | 45,253 | 11,117 | 20,809 |
| Transport and communications | 356 | 259 | 397 |
| Information | 308 | 54 | 92 |
| Professional and special services | 4,615 | 643 | 1,588 |
| Rentals | 886 | 118 | 575 |
| Repairs and maintenance | 28 | 10 | 32 |
| Public utilities, materials and supplies | 102 | 16 | 25 |
| Acquisition of land and buildings, and works | 0 | 0 | 0 |
| Acquisition of machinery and equipment | 1,010 | 52 | 69 |
| Transfer payments | 433,653 | 65,819 | 93,841 |
| Other grants and payments | 0 | -61 | -20 |
| Total net budgetary expenditures | 486,211 | 78,027 | 117,408 |
| * Includes employee benefit plans (EBPs). | |||