
Quarterly Financial Report for the Quarter Ended September 30, 2025
Table of contents
- Introduction
- Highlights of fiscal quarter and fiscal year-to-date results
- Risks and uncertainties
- Significant changes to operations, personnel and programs
- Approval by senior officials
- Appendices
1. Introduction
This quarterly financial report has been prepared by Canada Economic Development for Quebec Regions (CED) as required under section 65.1 of the Financial Administration Act and in the form and manner prescribed by the Treasury Board.
This report should be read in conjunction with the 2025–26 Estimates and the 2025–2026 Departmental Plan.
This document has not been subject to external audit or review.
1.1 Authorities, mandate and programs
The mission of Canada Economic Development for Quebec Regions (CED) is to promote the long-term economic development of the regions of Quebec by giving special attention to those where slow economic growth is prevalent or opportunities for productive employment are inadequate.
CED is the key federal organization for economic development in the regions and among small and medium-sized enterprises (SMEs) in Quebec. It aims to stimulate the start-up and growth of businesses to make the regions more innovative, productive and competitive. CED thus offers adapted services and fosters local collaboration. This support also attracts investments for greater economic prosperity in Quebec and Canada.
CED plays a crucial role in dynamizing regional economies by drawing on regional strengths. We help communities diversify their economies, especially those hit by economic shocks. We support SMEs and NPOs through strategic investments.
CED offers advisory services adapted to the needs of businesses, NPOs and communities. Specialized advisors provide personalized guidance to facilitate access to funding, establish partnerships and support the growth of Quebec businesses. CED also offer information services to help small businesses and future entrepreneurs develop.
CED keeps abreast of the needs of Quebec’s regions and businesses through its 11 business offices across the province and through the links it establishes with other economic development players.
CED has three categories of programs that support its core responsibility:
- Regional Innovation
- Community Vitality
- Targeted or Temporary Support
Additional information about CED’s authority, mandate and programs can be found in the 2025–26 Estimates and the 2025–2026 Departmental Plan.
1.2 Basis of presentation
This quarterly report was prepared by CED using an expenditure basis of accounting. The accompanying Statement of Authorities includes CED’s spending authorities granted by Parliament and used by CED, consistent with the 2025–2026 Main Estimates. This quarterly report was prepared using a special-purpose financial reporting framework designed to meet financial information needs regarding the use of spending authorities.
Prior authority from Parliament is required before funds can be spent by the Government. Authorities available for use are given in the form of annually approved limits through appropriation acts or through legislation in the form of statutory authority for specific purposes.
When Parliament is dissolved for the purposes of a general election, section 30 of the Financial Administration Act gives the Governor General the power, under certain conditions, to issue a special warrant authorizing the government to withdraw funds from the Consolidated Revenue Fund. A special warrant is deemed to be an appropriation for the fiscal year in which it is issued.
CED uses the full accrual method of accounting to prepare and present its annual financial statements that make up part of the departmental results reporting process. However, the spending authorities voted by Parliament remain on an expenditure basis of accounting.
1.3 Financial structure of Canada Economic Development for Quebec Regions (CED)
CED manages its expenditures under two annual votes:
- Vote 1 – Net operating expenditures, which includes CED authorities related to personnel costs and operating and maintenance expenditures
- Vote 5 – Grants and contributions, which includes all authorities related to transfer payments
Expenses under budgetary statutory authorities, for which payments are made under legislation previously approved by Parliament and which are not part of the annual appropriations bills, include items such as the employer’s share of the employee benefit plan.
2. Highlights of fiscal quarter and fiscal year-to-date results
This section presents a variety of financial information as at September 30, 2025, including the authorities available for the year and expenditures incurred during the first quarter, as compared with the previous fiscal year.
The explanation of variances is based on the premise that discrepancies of +/-5% have a minimal impact on the interpretation of results.
Details regarding this financial information can be found in sections 2.1 and 2.2, and in the tables in the appendices.
2.1 Analysis of authorities
Authorities as at September 30, 2025, totalled $332.6 M, with $331.2M as at June 30, 2025. The $1.4M (0.4%) variance is considered insignificant.
On a cumulative basis, CED’s total annual authorities rose year-over-year from $318.0M as at September 30, 2024, to $332.6M as at September 30, 2025.
The $14.6M (4.6%) upward variance is due to the following changes:
- Vote 1 – Net operating expenditures: +$0.2M
- Vote 5 – Grants and contributions: +$13.7M
- Budgetary statutory authorities: +$0.7M
NB: Totals in the report may not add up because of rounding off.
The chart below shows the annual budgetary appropriation authorities as at September 30, 2025, compared with the previous fiscal year.
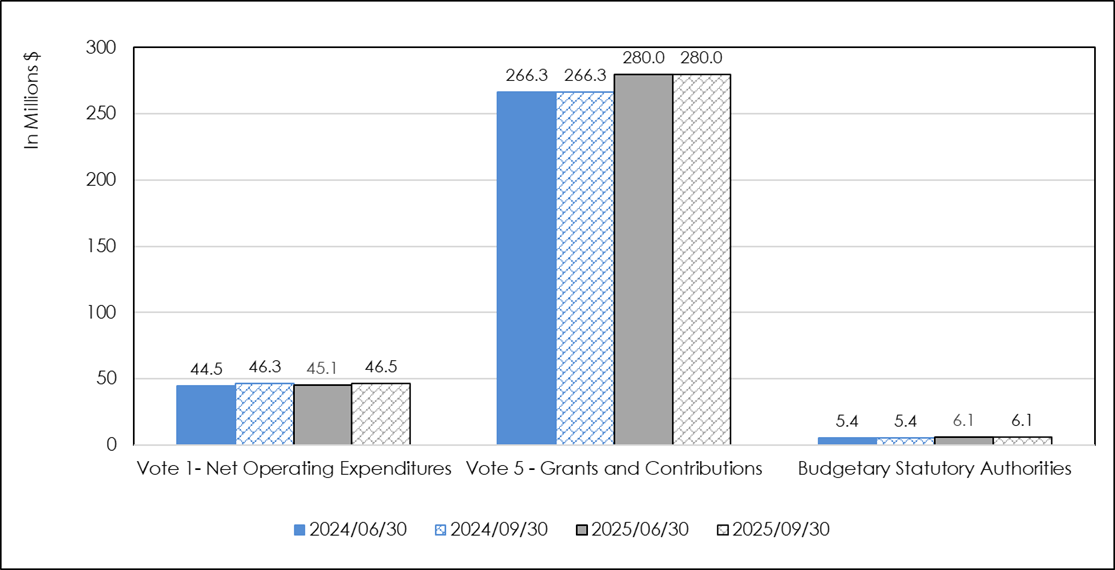
Graphic 1 - Text version:
Analysis of annual budgetary appropriation authorities: subdivided into three sections, this graph provides an overview of net available budgetary authorities (Vote 1 – Net Operating Expenditures; Vote 5 – Grants and Contributions; and Budgetary Statutory Authorities) as at June 30 and as at September 30, 2025, including a comparison as at June 30 and as at September 30, 2024.As at September 30, 2025, annual authorities under Vote 1 – Net Operating Expenditures, Vote 5 – Grants and Contributions, and Budgetary Statutory Authorities, totalled $46.5M ($46.3M in 2024–2025); $280.0M ($266.3M in 2024–2025); and $6.1M ($5.4M in 2024–2025), respectively.
As at June 30, 2025, annual authorities under Vote 1 – Net Operating Expenditures, Vote 5 – Grants and Contributions, and Budgetary Statutory Authorities, totalled $45.1M ($44.5M in 2024–2025); $280.0M ($266.3M in 2024–2025); and $6.1M ($5.4M in 2024–2025), respectively.
Vote 1 authorities (Operating expenditures)
As at September 30, 2025, authorities totalled $46.5M, compared with $46.3M as at September 30, 2024. The year over-year increase of $0.2M (0.4 %) is considered insignificant.
Vote 5 authorities (Grants and contributions)
As at September 30, 2025, authorities totalled $280.0M, compared with $266.3M as at September 30, 2024, representing an increase of $13.7 million (5.1%).
This variance consists of a number of items, some of which varied upward, others downward, for a net increase of $13.7M:
- Increase in funding (+$23.5M)
- Regional Economic Growth through Innovation (REGI) program top-up: +$8.3M
- Regional Artificial Intelligence Initiative: +$6.6M
- Regional Homebuilding Innovation Initiative: +$6.3M
- Northern Isolated Communities Initiatives Fund: +$1.1M
- Black Entrepreneurship Program: +$0.6M
- Other: +$0.6M
- Decrease in, or end of, funding (-$9.8M)
- Support for Regional Quantum Innovation Initiative: -$3.3M
- International Sustainability Standards Board: -$2.7M
- Modernisation of the slipway at the port of Cap-aux-Meules on the Magdalen Islands: $-2.0M
- Hurricane Fiona Recovery Fund: $-1.8M
Budgetary statutory authorities
As at September 30, 2025, authorities totalled $6.1M, compared with $5.4M as at September 30, 2024. This represents an increase of $0.7M (13.0%). This increase is the result of an adjustment to the actual effective rate for the employee benefit plan.
2.2 Analysis of expenditures
CED expenditures in the second quarter of 2025–2026 totalled $57.9M, compared with $65.3M for the same period a year ago. This represents a net year-over-year decrease of $7.4M (-11.3%).
This variance can be broken down as follows:
- Vote 1 – Net operating expenditures: +$1.2M
- Vote 5 – Grants and contributions: -$8.7M
- Budgetary statutory authorities: +$0.1M
On a cumulative basis, as at September 30, 2025, expenditures amounted to $102.1M, compared with $106.6M in the same period a year ago. This year’s $4.5M (-4.2%) decrease is considered insignificant.
This variance can be broken down as follows:
- Vote 1 – Net operating expenditures: -$0.5M
- Vote 5 – Grants and contributions: --$4.4M
- Budgetary statutory authorities: +$0.4M
The chart below shows expenditures in the second quarter of 2025–2026 by budgetary appropriation, compared with the previous fiscal year.
Second-quarter expenditures by budgetary appropriation as at June 30 and September 30, fiscal year 2025–2026, compared with 2024–2025
Graphic 2 - Text version:
Analysis of second-quarter expenditures and presentation of year-to-date expenditures by budgetary appropriation as at September 30, fiscal year 2025–2026, compared with 2024 2025: subdivided into three sections, namely Vote 1 – Net Operating Expenditures, Vote 5 – Grants and Contributions, and Budgetary Statutory Authorities. This graph shows expenditures incurred during the second quarter of 2025–2026, as well as year-to-date expenditures as at September 30, 2025, and includes a comparison with fiscal year 2024–2025.
In the second quarter of 2025–2026, expenditures under Vote 1 (Net Operating Expenditures), Vote 5 (Grants and Contributions), and Budgetary Statutory Authorities, amounted to $12.4M ($11.2M in 2024–2025); $44.0M ($52.7M in 2024–2025); and $1.5M ($1.4M in 2024–2025), respectively.
Year-to-date expenditures as at September 30, 2025, under Vote 1 (Net Operating Expenditures), Vote 5 (Grants and Contributions), and Budgetary Statutory Authorities, totalled $21.6M ($22.1M in 2024-2025); $77.4M ($81.8M in 2024–2025); and $3.1M ($2.7M in 2024–2025), respectively.
Vote 1 expenditures (Net operating expenditures)
CED’s net operating expenditures for the second quarter of 2025–2026 totalled $12.4M, compared with $11.2M in 2024–2025. This represents an increase of $1.2M (10.7%) year-over-year.
Operating expenditures—primarily payroll spending—increased in the second quarter. An understated accounting entry between periods accounted for most of this $1.2M variance. This understated entry has no impact on cumulative expenditures.
Cumulative expenditures totalled $21.6M as at September 30, 2025, compared with $22.1M as at September 30,2024. The $0.5M (-2.2%) decrease this year is considered insignificant.
(For further details on expenditures, see the table entitled “Departmental budgetary expenditures by standard object” in Appendix 6.2.)
Vote 5 expenditures (Grants and contributions)
Grant and contribution expenditures for the second quarter of 2025–2026 totalled $44.0M, compared with $52.7M in 2024–2025, a year-over-year drop of -$8.7M (-16.5%).
The observed decline in spending applies mainly to regular programs such as the Community Futures Program (CFP) and the Regional Economic Growth through Innovation (REGI) fund. At the same time, a number of temporary and targeted initiatives were launched, resulting in a slight increase in spending. These include the Northern Isolated Communities Initiatives Fund, the Regional Homebuilding Innovation Initiative and the Regional Artificial Intelligence Initiative. The renegotiation of the CFP in the first quarter of fiscal 2024-2025 resulted in a deferral of spending to the second quarter of fiscal 2024-2025.
Cumulative expenditures as at September 30, 2025, totalled $77.4 million, compared with $81.8M as at September 30, 2024, a year-over-year decrease of $4.4M (-5.4%) this year, for the same reasons as noted above.
Expenditures under budgetary statutory authorities
Spending on statutory authorities in the second quarter of 2025–2026 totalled $1.5M, compared with $1.4M as at September 30, 2024, a year-over-year increase of $0.1M (-7.1%). Spending in the first two quarters remained stable, with no significant variations to report.
On a cumulative basis, expenditures as at September 30, 2025, totalled $3.1M, compared with $2.7M as at September 30, 2024, a year-over-year increase of $0.4M (-14.8%) this year. This increase can be exclusively attributed to the payment of employee benefits to the Treasury Board Secretariat in this quarter of 2025–2026.
(For further details on these expenditures, see the table entitled “Departmental budgetary expenditures by standard object” in Appendix 6.2.)
3. Risks and uncertainties
In a context of economic uncertainty and government transformation, CED must deal with certain risks that could affect its ability to achieve its objectives and ensure the optimal delivery of its mandate.
Financial situation
Budgetary constraints, combined with the public service expenditure review and the uncertainty surrounding the availability of funds over the next few years, could pose challenges for CED in terms of its capacity to intervene. To mitigate this risk, CED will ensure the rigorous and sustained management of its human and financial resources; focus on simplifying its internal processes and modernizing its digital environment, thereby generating efficiency gains; and pursue the transformation of certain business models, notably as concerns collections.
Programs and services
The current context, and in particular the global economic situation and changes to government programs for SMEs, has increased the challenges faced by CED’s clients and poses a risk to the Agency’s ability to effectively intervene across the entire continuum of economic development projects. To address these challenges, CED is adjusting its programs; pursuing its collaboration with its partners and other levels of government in order to strengthen its capacity to identify and carry out strategic projects; and simplifying access to its services, notably through the gradual roll-out of its transactional portal.
IT security
As cyberthreats intensify, CED remains exposed to the risk of a cybersecurity incident that could disrupt the Agency's activities or damage its reputation. To build its resilience, the organization is continuing to implement targeted cybersecurity training courses, update business continuity plans, hold simulation exercises and assess potential impacts on key organizational functions.
4. Significant changes to operations, personnel, and programs
CED has completed the comprehensive expenditure review exercise aimed at reducing and refocusing spending in line with the priorities set by the government for the coming fiscal years. CED will implement two new initiatives announced in Budget 2025. The first of these, the Regional Tariff Response Initiative, aims to help small and medium-sized businesses boost their productivity, catalyze their growth and diversify their markets. The second, the Regional Defence Investment Initiative, will support the scale-up of businesses and their integration into defence sector supply chains. It will also help build industrial capacity and strengthen innovation to meet Canada’s defence and security needs, while fostering regional economic development.
5. Approval by senior officials
The purpose of this section is to provide the approval of senior officials, as required by the Policy on Financial Management, as follows:
Approved by:
_____________________________________
Sony Perron
Deputy Minister / President
Montréal, Canada
__________________________________
Maxime Garon
Chief Financial Officer
Montréal, Canada
6 Appendices
6.1 Statement of authorities (unaudited)
| Total available for use for the year ended March 31, 2026* | Used during the quarter ended September 30, 2025 | Year-to-date used at quarter-end | |
|---|---|---|---|
| Vote 1 – Net operating expenditures | 46,500 | 12,394 | 21,585 |
| Vote 5 – Grants and contributions | 279,995 | 43,964 | 77,404 |
| Total budgetary statutory authorities | 6,133 | 1,533 | 3,066 |
| Total authorities | 332,628 | 57,891 | 102,055 |
| Total available for use for the year ended March 31, 2025* | Used during the quarter ended September 30, 2024 | Year-to-date used at quarter-end | |
|---|---|---|---|
| Vote 1 – Net operating expenditures | 46,270 | 11,204 | 22,061 |
| Vote 5 – Grants and contributions | 266,262 | 52,687 | 81,771 |
| Total budgetary statutory authorities | 5,440 | 1,360 | 2,721 |
| Total authorities | 317,972 | 62,251 | 106,553 |
| *Includes only authorities available for use and granted by Parliament at quarter-end. | |||
6.2 Departmental budgetary expenditures by standard object (unaudited)
| Planned expenditures for the year ended March 31, 2026 | Expenditures during the quarter ended September 30, 2025 | Year-to-date used at quarter-end | |
|---|---|---|---|
| Expenses: | |||
| Personnel* | 47,618 | 13,031 | 22,977 |
| Transport and communications | 318 | 87 | 208 |
| Information | 225 | 6 | 35 |
| Professional and special services | 2,869 | 448 | 635 |
| Rent | 887 | 174 | 574 |
| Repair and maintenance services | 46 | 18 | 30 |
| Public utilities, materials and supplies | 49 | 8 | 16 |
| Acquisition of land, buildings and works | 0 | 0 | 0 |
| Acquisition of machinery and equipment | 621 | 132 | 142 |
| Transfer payments | 279,995 | 43,964 | 77,404 |
| Other grants and payments | 0 | 23 | 34 |
| Total net budgetary expenditures | 332,628 | 57,891 | 102,055 |
| *Includes employee benefit plans (EBPs) | |||
| Planned expenditures for the year ended March 31, 2025 | Expenditures during the quarter ended September 30, 2024 | Year-to-date used at quarter-end | |
|---|---|---|---|
| Expenses: | |||
| Personnel* | 46,647 | 11,548 | 22,746 |
| Transport and communications | 341 | 196 | 459 |
| Information | 218 | 43 | 105 |
| Professional and special services | 3,024 | 396 | 583 |
| Rent | 763 | 102 | 483 |
| Repair and maintenance services | 19 | 10 | 27 |
| Utilities, materials and supplies | 58 | 12 | 41 |
| Acquisition of land, buildings and works | 0 | 0 | 0 |
| Acquisition of machinery and equipment | 640 | 242 | 279 |
| Transfer payments | 266,262 | 52,687 | 81,771 |
| Other grants and payments | 0 | 15 | 59 |
| Total net budgetary expenditures | 317,972 | 65,251 | 106,553 |
| *Includes employee benefit plans (EBPs) | |||