
The evolving Canadian workplace
From: Employment and Social Development Canada
Overall summary
This infographic presents key trends and observations that show how Canadian workplaces are evolving. These are important factors that influence policy development within the Government of Canada.
Alternate formats

The evolving Canadian workplace (complete version) [PDF – 1,000 KB]
The Government of Canada’s Labour Program is responsible for promoting safe, healthy, fair and inclusive work conditions and cooperative in federal private-sector industries and, in some cases, for the federal public service and other federal establishments.
Many Canadians remain outside of the labour market in a context of labour shortages

Figure 1 – Text description
| Year | Male | Female | Female (with young children)** | Indigenous (off reserve) | Persons with disabilities*** |
|---|---|---|---|---|---|
| 1990 | 93.10% | 75.50% | 64.30% | No data | No data |
| 1991 | 92.40% | 75.90% | 66.10% | No data | No data |
| 1992 | 91.40% | 75.30% | 65.40% | No data | No data |
| 1993 | 91.40% | 75.70% | 65.70% | No data | No data |
| 1994 | 91.20% | 75.40% | 65.90% | No data | No data |
| 1995 | 90.90% | 75.70% | 66.70% | No data | No data |
| 1996 | 90.80% | 76.00% | 67.60% | No data | No data |
| 1997 | 90.90% | 76.80% | 68.60% | No data | No data |
| 1998 | 91.10% | 77.60% | 69.20% | No data | No data |
| 1999 | 91.10% | 78.20% | 69.60% | No data | No data |
| 2000 | 91.00% | 78.50% | 70.30% | No data | No data |
| 2001 | 91.10% | 79.10% | 70.70% | No data | 61.4% |
| 2002 | 91.50% | 80.40% | 71.30% | No data | No data |
| 2003 | 91.60% | 81.10% | 71.90% | No data | No data |
| 2004 | 91.60% | 81.50% | 73.00% | No data | No data |
| 2005 | 91.50% | 81.10% | 73.50% | No data | No data |
| 2006 | 91.10% | 81.30% | 72.10% | No data | 65.2% |
| 2007 | 91.10% | 82.10% | 74.10% | 76.7% | No data |
| 2008 | 91.40% | 82.00% | 72.60% | 77.9% | No data |
| 2009 | 90.70% | 82.20% | 73.10% | 77.7% | No data |
| 2010 | 90.50% | 82.30% | 73.70% | 74.8% | No data |
| 2011 | 90.50% | 82.10% | 73.40% | 75.7% | No data |
| 2012 | 90.80% | 82.30% | 73.90% | 77.7% | 62.3% |
| 2013 | 90.70% | 82.50% | 74.90% | 77.0% | No data |
| 2014 | 90.50% | 81.80% | 74.20% | 76.9% | No data |
| 2015 | 90.90% | 82.00% | 73.70% | 75.9% | No data |
| 2016 | 90.90% | 82.20% | 74.60% | 77.4% | No data |
| 2017 | 91.10% | 82.90% | 75.40% | 77.8% | 73.4% |
| 2018 | 90.80% | 83.20% | 74.50% | 77.9% | No data |
*25 to 54 years
**Women with children aged 5 years and under.
***Data not comparable over time due to different survey methodologies.
Source: Statistics Canada, Labour Force Survey, Canadian Survey on Disability, Participation and Activity Limitation Survey.
A little over 1/3 of Canadian workers are in non-standard employment; some of these workers do not enjoy any labour standards protections

Figure 2 – Text description
| Form of employment | 1997 | 2007 | 2018 |
|---|---|---|---|
| Non-standard employment | 38.1% | 37.2% | 37.1% |
| Self-employed | 17.1% | 15.5% | 15.3% |
| Permanent part time | 11.6% | 10.7% | 10.5% |
| Temporary | 9.4% | 11.0% | 11.3% |
Source : Statistics Canada, Labour Force Survey (1997, 2007 and 2018).
Canadian private-sector union coverage has declined; it remains higher in the federally regulated private sector

Figure 3 – Text description
| Year | Canada | Public sector | Private sector | Federally regulated private sector* |
|---|---|---|---|---|
| 1997 | 34% | 75% | 21% | 41% |
| 2007 | 32% | 75% | 19% | 37% |
| 2018 | 30% | 75% | 16% | 34% |
* Includes federal crown corporations.
Source: Statistics Canada, Labour Force Survey (1997, 2007 and 2018); Labour Program calculations.
Canadians’ work-life balance is average when compared with similar economies

Figure 4 – Text description
| Country | Score |
|---|---|
| Japan | 4.6 |
| Iceland | 5.1 |
| Australia | 5.6 |
| New Zealand | 5.9 |
| United States | 6.0 |
| United Kingdom | 6.4 |
| Austria | 6.8 |
| Portugal | 7.0 |
| Greece | 7.1 |
| Canada | 7.3 |
| Ireland | 7.9 |
| Finland | 8.0 |
| Luxembourg | 8.0 |
| Switzerland | 8.4 |
| Sweden | 8.4 |
| Germany | 8.4 |
| Belgium | 8.4 |
| Norway | 8.5 |
| France | 8.7 |
| Spain | 8.8 |
| Denmark | 9.0 |
| Italy | 9.4 |
| Netherlands | 9.5 |
*Based on % of employees working very long hours and amount of time devoted to leisure and personal care (index ranges from 0 to 10).
Source: OECD, Better life Index (2017).
New technologies are leading to longer hours for some, but also more flexibility

Figure 5 – Text description
Question: Do technologies such as the Internet, email and cell/smart phones allow you more flexibility in the hours you work?
- Yes: 49%
- No: 51 %
Source: Angus Reid Institute, Canadians at Work, 2015.
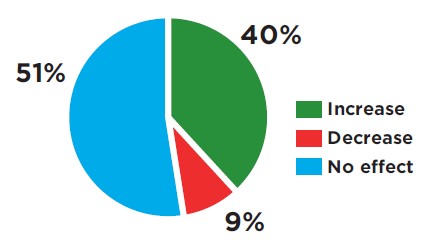
Figure 6 – Text description
Question: Have technologies such as internet, email and cell / smartphones affected the amount of time you spend working?
- Increase: 40%
- Decrease: 9%
- No effect: 51 %
Source: Angus Reid Institute, Canadians at Work, 2015.
Gender earning gaps persist
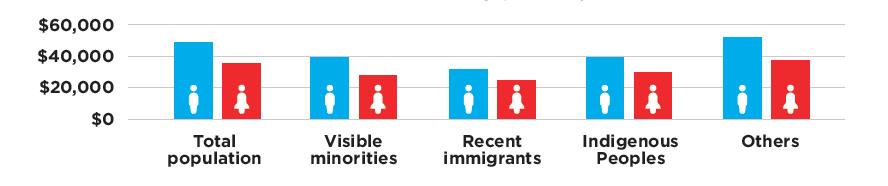
Figure 7 – Text description
| Group | Men | Women |
|---|---|---|
| Total population | $46,000 | $33,000 |
| Visible minorities | $38,000 | $28,000 |
| Recent immigrants | $31,000 | $21,000 |
| Indigenous peoples | $38,000 | $29,000 |
| Others | $50,000 | $35,000 |
Note: Sample limited to only employees (full- and part-time) with applicable and available employment incomes; negative income values are dropped. Recent immigrants are defined as those who settled in Canada less than five years prior to the Census. Others include non-visible minorities, non-recent immigrants and non-Indigenous peoples.
Source: Statistics Canada, Census of Population (2016).
A smaller proportion of private-sector employees are covered by a registered pension plan, and more of these plans are defined contribution plans or other types of plans (for example, hybrid)

Figure 8 – Text description
| Types of plans | 1997 | 2007 | 2017 |
|---|---|---|---|
| Private sector overall | 28.2% | 25.7% | 22.7% |
| Defined benefit | 21.9% | 15.8% | 9.2% |
| Defined contribution | 5.6% | 6.7% | 7.6% |
| Other types of plans | 0.6% | 3.1% | 5.8% |
Source : Statistics Canada, Pension Plans in Canada (1997, 2007 and 2017).
Both the median wage and the average minimum wage have increased slightly since the early 1980s

Figure 9 – Text description
| Year | Median hourly wage | Average minimum wage |
|---|---|---|
| 1970 | No data | $8.74 |
| 1971 | No data | $9.51 |
| 1972 | No data | $9.55 |
| 1973 | No data | $10.02 |
| 1974 | No data | $10.55 |
| 1975 | No data | $11.07 |
| 1976 | No data | $11.67 |
| 1977 | No data | $11.34 |
| 1978 | No data | $10.77 |
| 1979 | No data | $10.37 |
| 1980 | No data | $9.81 |
| 1981 | $20.56 | $9.50 |
| 1982 | $20.76 | $9.02 |
| 1983 | $20.97 | $8.59 |
| 1984 | $21.18 | $8.53 |
| 1985 | $20.70 | $8.39 |
| 1986 | $20.23 | $8.18 |
| 1987 | $20.54 | $8.26 |
| 1988 | $20.97 | $8.32 |
| 1989 | $20.79 | $8.39 |
| 1990 | $20.68 | $8.42 |
| 1991 | $20.70 | $8.37 |
| 1992 | $20.74 | $8.88 |
| 1993 | $20.76 | $9.08 |
| 1994 | $20.81 | $9.35 |
| 1995 | $20.83 | $9.44 |
| 1996 | $20.85 | $9.56 |
| 1997 | $20.89 | $9.52 |
| 1998 | $20.95 | $9.50 |
| 1999 | $20.85 | $9.50 |
| 2000 | $20.87 | $9.33 |
| 2001 | $21.03 | $9.22 |
| 2002 | $21.05 | $9.12 |
| 2003 | $20.64 | $8.99 |
| 2004 | $20.91 | $9.03 |
| 2005 | $21.07 | $9.11 |
| 2006 | $21.28 | $9.29 |
| 2007 | $21.42 | $9.38 |
| 2008 | $21.85 | $9.76 |
| 2009 | $22.31 | $10.24 |
| 2010 | $22.78 | $10.66 |
| 2011 | $22.14 | $10.74 |
| 2012 | $22.02 | $10.94 |
| 2013 | $22.70 | $11.01 |
| 2014 | $22.33 | $11.06 |
| 2015 | $23.05 | $11.26 |
| 2016 | $22.74 | $11.43 |
| 2017 | $22.96 | $11.63 |
| 2018 | $23.17 | $12.86 |
Note : The average minimum wage is weighted by the number of employees in each province. The median hourly wage includes all employees aged 17 to 64 years old.
Source: Statistics Canada (“Changing characteristics of Canadian jobs, 1981 to 2018” (2018), and Labour Force Survey); Labour Program calculations (2019); Labour Program calculations.
Real wage growth for middle income earners has remained modest since the late 1990s

Figure 10 – Text description
| Percentile | 1997-2018 |
|---|---|
| 10th | 32% |
| 25th | 15% |
| 50th | 12% |
| 75th | 15% |
| 90th | 20% |
Note : The percentiles refer to the wage growth at specific points in the wage distribution (low value refers to low wage while higher value refers to higher wage). For example, an individual whose real wage is located at the 50th percentile of the overall wage distribution from 1997-2018 experienced cumulative real wage growth of 12% over the period.
Source: Statistics Canada, Labour Force Survey.