
Employment and Social Development Canada plays a key role in providing and supporting programs and services focussed on the well-being of Canadians
From: Employment and Social Development Canada
Overall summary
Federal, provincial, territorial, and local governments are responsible for various programs and services that have significant impacts on the well-being of Canadians. At the federal level, Employment and Social Development Canada (ESDC) plays a key role in providing and supporting programs and services focussed on the well-being of Canadians. Through income security, training and learning as well as partnerships and other initiatives, ESDC helps support Canadians throughout their entire life cycle, from childhood, through working age (18 to 64), and finally as seniors.
The provinces have primary responsibility and authority for social programming, including health, education and social services. The provincial governments, along with territorial and local governments, play a significant role in funding and delivering programs and services that contribute to the well-being of Canadians.
Alternate formats

Employment and Social Development Canada plays a key role in providing and supporting programs and services focussed on the well-being of Canadians (complete version) [PDF – 786 KB]
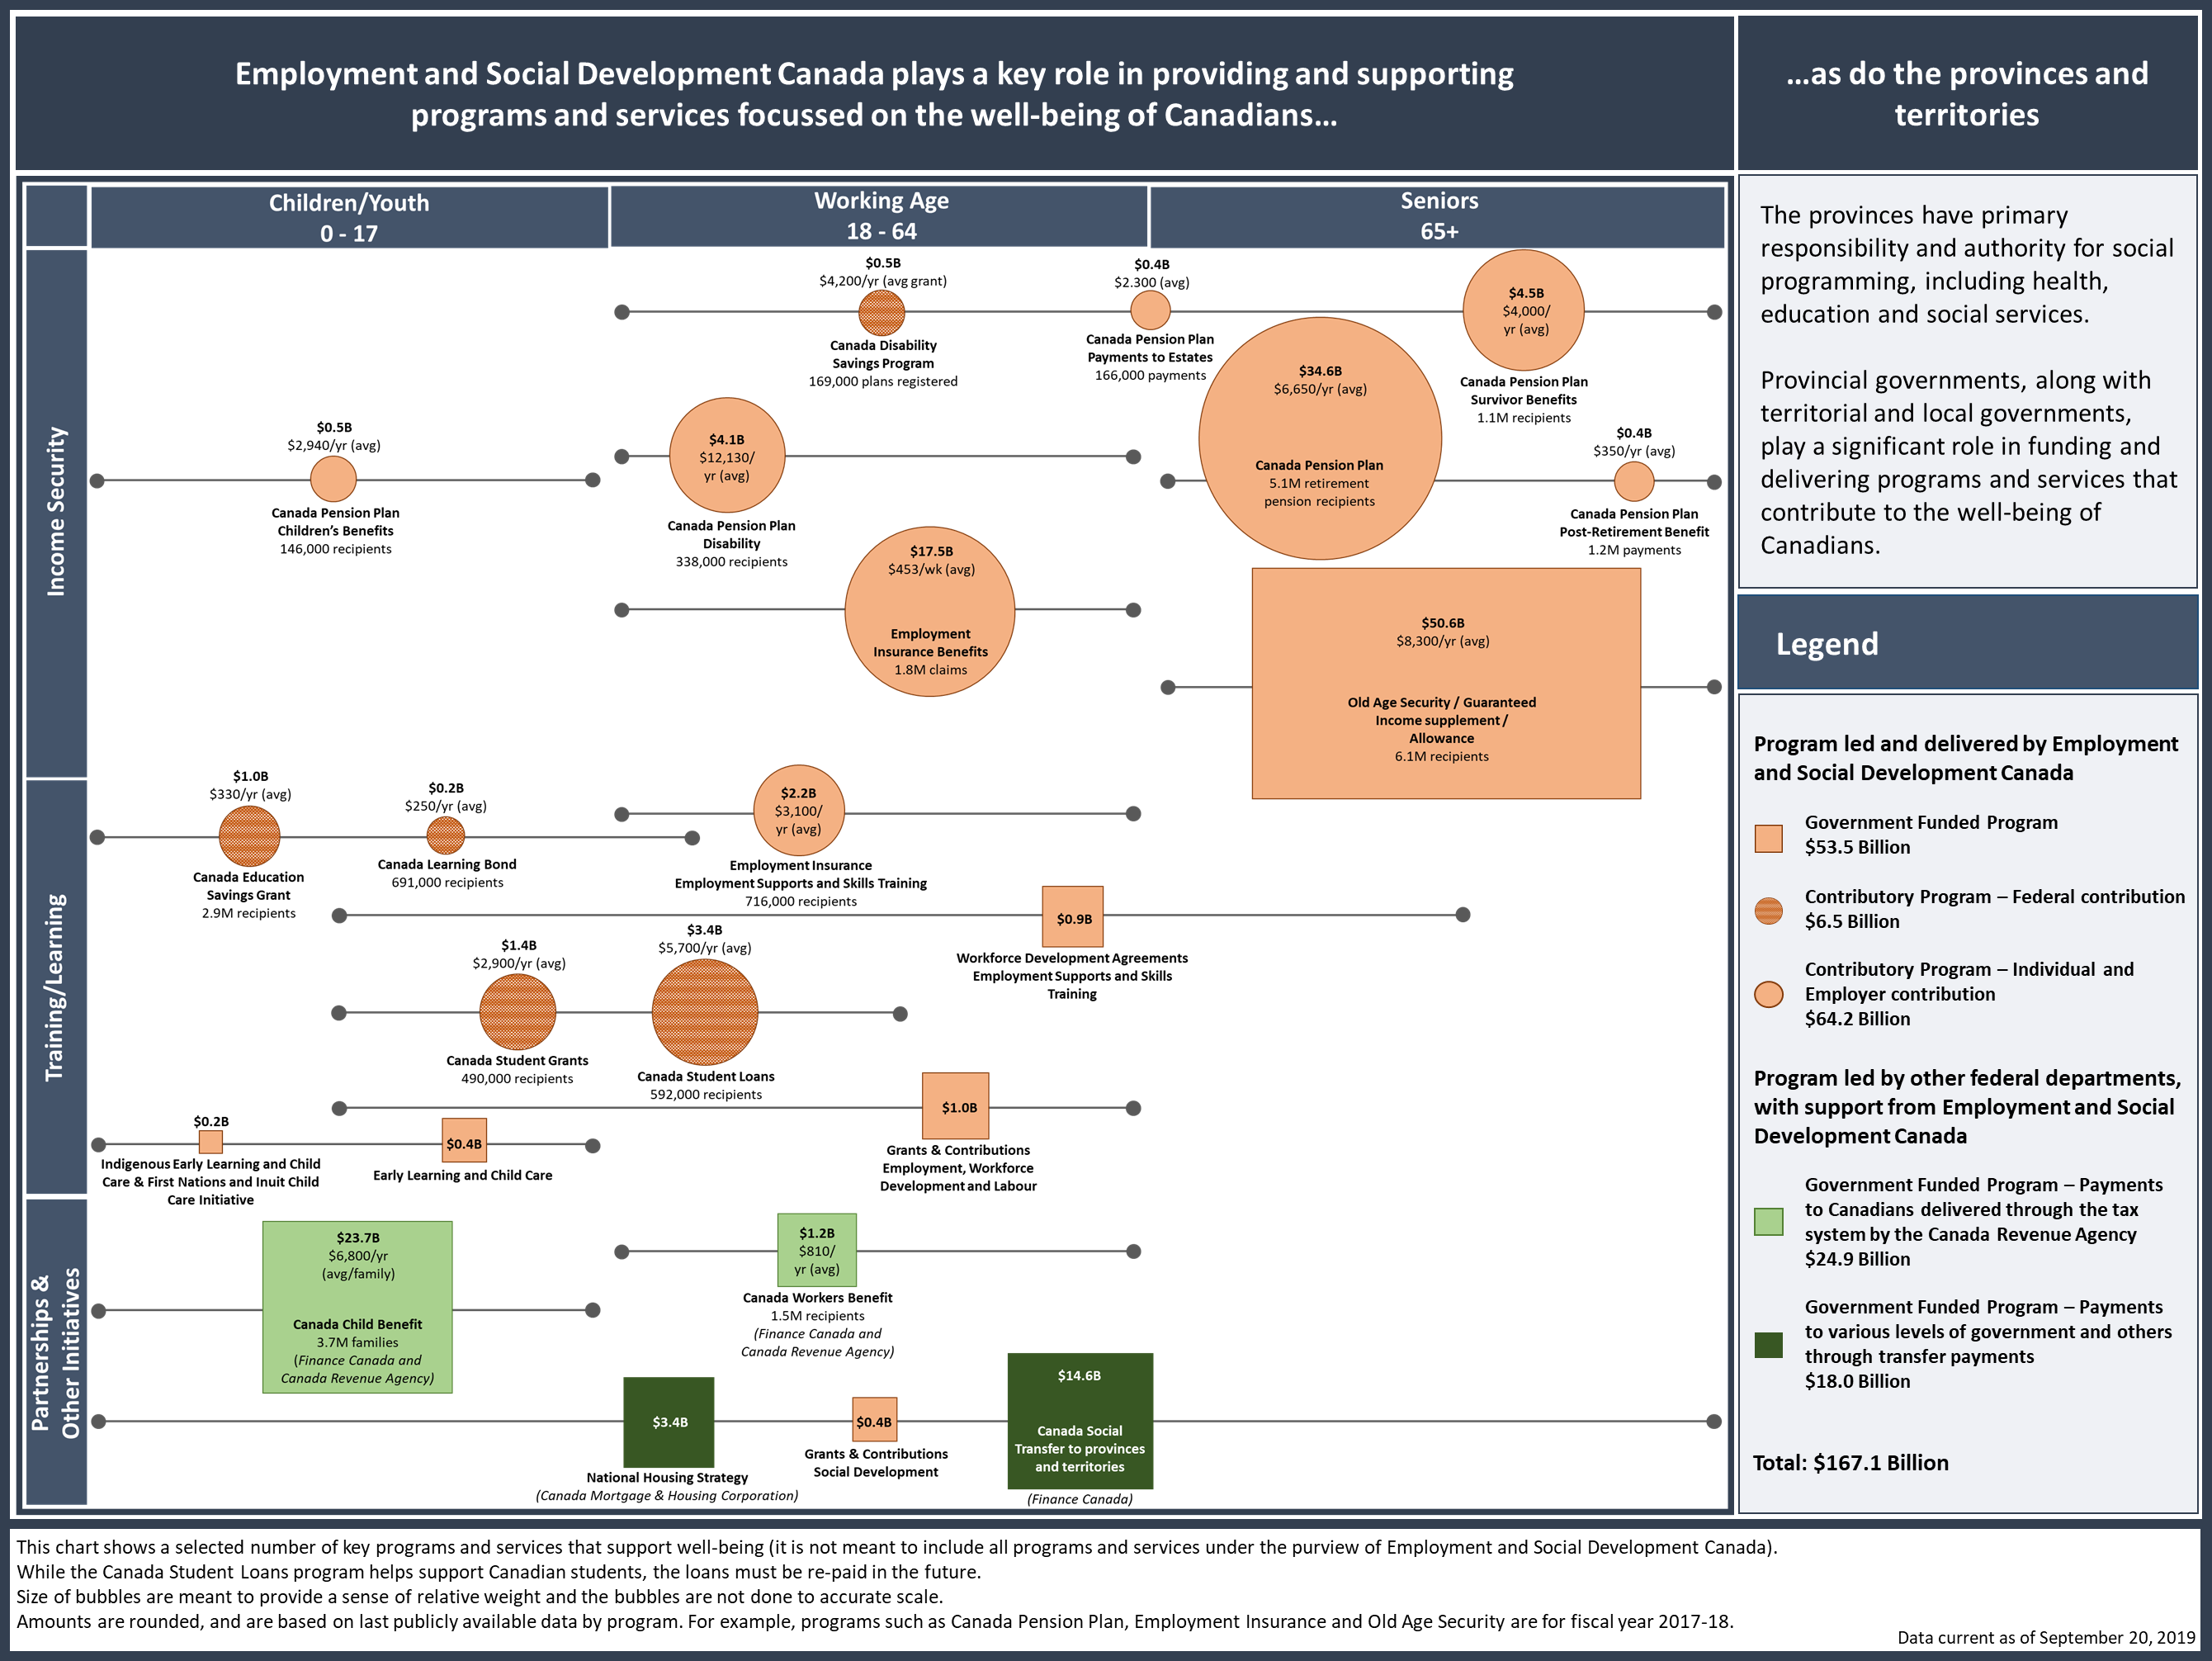
Figure 1 – Text version
The chart shows total expenditures paid to recipients for 23 selected key programs and services that support the well-being of Canadians, with a focus on areas of responsibility for Employment and Social Development Canada. Each bubble represents a single program or initiative (or in some cases a grouping of similar or related programs and initiatives) where the colours represent the department leads and funding structures. The size represents the magnitude of expenditures relative to the other programs and services (not done to accurate scale). Amounts for expenditures and benefits are rounded, and are based on last publicly available data by program. For example, programs such as Canada Pension Plan, Employment Insurance and Old Age Security are for fiscal year 2017/18.
Each program or initiative is presented on a grid. The vertical axis shows whether it is a form of 1) income security, 2) training/learning or 3) partnerships & other initiatives. The horizontal axis shows which age demographic(s) it supports: 1) children/youth (0-17), 2) working age (18-64), or 3) seniors (65+). Some programs and services support more than one age demographic and this is shown by a line through the program and/or service bubble that spans the range of age demographics being supported. For programs and services where it is possible/relevant, the number of recipients (whether individuals or families) and average benefits (e.g., per recipient) are also shown (most averages are shown on an annual basis, while others are shown on a weekly basis).
The listed programs and services are either led by ESDC or led by another department and supported by ESDC. Some of these programs and services are fully funded by the federal government, while other programs and services are contributory and funded either fully or partially by individual and employer contributions. In cases where programs and services are partially funded by individuals (Canada Disability Savings Program, Canada Education Savings Grant, Canada Learning Bond, Canada Student Grants, and Canada Student Loans), they are also partially funded by the federal government and the expenditure figures presented are only the federal portion of the funding. For the other contributory programs listed, the full amount of spending is shown.
The programs listed can be categorized as follows:
- Programs led and delivered by Employment and Social Development Canada
- Government Funded Programs: $53.5 Billion
- Contributory Programs – Federal contribution: $6.5 Billion
- Contributory Programs – Individual and Employer contribution: $64.2 Billion
- Programs led by other federal departments, with support from Employment and Social Development Canada
- Government Funded Programs – Payments to Canadians delivered through the tax system by the Canada Revenue Agency: $24.9 Billion
- Government Funded Programs – Payments to various levels of government and others through transfer payments: $18.0 Billion
- Total value for programs presented: $167.1 Billion
The following is a description of the 23 selected key programs and services:
- Income security:
- Canada Pension Plan – Children’s Benefits
- Department lead: Employment and Social Development Canada
- Age demographic: children/youth (0-17)
- Funding structure: contributory, funded by contributions
- Total expenditures: $0.5B
- Recipients: 146,000 recipients
- Average benefits: $2,940 per year
- Canada Pension Plan Disability
- Department lead: Employment and Social Development Canada
- Age demographic: Working Age (18 – 64)
- Funding structure: contributory, funded by contributions
- Total expenses: $4.1B
- Recipients: 338,000 recipients
- Average benefits: $12,130 per year
- Canada Disability Savings Program
- Department lead: Employment and Social Development Canada
- Age demographic: Working Age (18 – 64) and seniors (65+)
- Funding structure: contributory, federal contributions
- Total expenses: $0.5B
- Recipients: 169,000 plans registered
- Average grants: $4,200 per year
- Canada Pension Plan – Payments to Estates
- Department lead: Employment and Social Development Canada
- Age demographic: Working Age (18 – 64) and seniors (65+)
- Funding structure: contributory, funded by contributions
- Total expenses: $0.4B
- Recipients: 166,000 payments
- Average payments: $2,300
- Canada Pension Plan
- Department lead: Employment and Social Development Canada
- Age demographic: seniors (65+)
- Funding structure: contributory, funded by contributions
- Total expenses: $34.6B
- Recipients: 5.1M retirement pension recipients
- Average benefits: $6,650 per year
- Canada Pension Plan – Survivor Benefits
- Department lead: Employment and Social Development Canada
- Age demographic: Working Age (18 – 64) and seniors (65+)
- Funding structure: contributory, funded by contributions
- Total expenses: $4.5B
- Recipients: 1.1M recipients
- Average benefits: $4,000 per year
- Canada Pension Plan – Post-Retirement Benefits
- Department lead: Employment and Social Development Canada
- Age demographic: seniors (65+)
- Funding structure: contributory, funded by contributions
- Total expenses: $0.4B
- Recipients: 1.2M payments
- Average payments: $350 per year
- Employment Insurance Benefits
- Department lead: Employment and Social Development Canada
- Age demographic: Working Age (18 – 64)
- Funding structure: contributory, funded by contributions
- Total expenses: $17.5B
- Recipients: 1.8M claims
- Average benefits: $453 per week
- Old Age Security / Guaranteed Income supplement / Allowance
- Department lead: Employment and Social Development Canada
- Age demographic: seniors (65+)
- Funding structure: government funded
- Total expenses: $50.6B
- Recipients: 6.1M recipients
- Average benefits: $8,300 per year
- Canada Pension Plan – Children’s Benefits
- Training/Learning:
- Canada Education Savings Grant
- Department lead: Employment and Social Development Canada
- Age demographic: children/youth (0-17) and Working Age (18 – 64)
- Funding structure: contributory, federal contributions
- Total expenses: $1.0B
- Recipients: 2.9M recipients
- Average grants: $330 per year
- Canada Learning Bond
- Department lead: Employment and Social Development Canada
- Age demographic: children/youth (0-17) and Working Age (18 – 64)
- Funding structure: contributory, federal contributions
- Total expenses: $0.2B
- Recipients: 691,000 recipients
- Average bonds: $250 per year
- Canada Student Grants
- Department lead: Employment and Social Development Canada
- Age demographic: children/youth (0-17) and Working Age (18 – 64)
- Funding structure: contributory, federal contributions
- Total expenses: $1.4B
- Recipients: 490,000 recipients
- Average grants: $2,900 per year
- Canada Student Loans
- Department lead: Employment and Social Development Canada
- Age demographic: children/youth (0-17) and Working Age (18 – 64)
- Funding structure: contributory, federal contributions
- Total expenses: $3.4B
- Recipients: 592,000 recipients
- Average loans: $5,700 per year
- Indigenous Early Learning and Child Care & First Nations and Inuit Child Care Initiative
- Department lead: Employment and Social Development Canada
- Age demographic: children/youth (0-17)
- Funding structure: government funding
- Total investment: $0.2B
- Early Learning and Child Care
- Department lead: Employment and Social Development Canada
- Age demographic: children/youth (0-17)
- Funding structure: government funding
- Total investment: $0.4B
- Employment Insurance – Employment Supports and Skills Training
- Department lead: Employment and Social Development Canada
- Age demographic: Working Age (18 – 64)
- Funding structure: contributory, funded by contributions
- Total expenses: $2.2B
- Recipients: 716,000 recipients
- Average expenditures per recipient: $3,100 per year
- Workforce Development Agreements – Employment Supports and Skills Training
- Department lead: Employment and Social Development Canada
- Age demographic: children/youth (0-17), Working Age (18 – 64) and seniors (65+)
- Funding structure: government funding
- Total expenditures: $0.9B
- Grants & Contributions – Employment, Workforce Development and Labour
- Department lead: Employment and Social Development Canada
- Age demographic: children/youth (0-17) and Working Age (18 – 64)
- Funding structure: government funding
- Total grants and contributions: $1.0B
- Canada Education Savings Grant
- Partnerships & Other Initiatives:
- Canada Child Benefit
- Department lead: Finance Canada and Canada Revenue Agency
- Age demographic: children/youth (0-17)
- Funding structure: Government Funded Program – Payments to Canadians delivered through the tax system by the Canada Revenue Agency
- Total expenses: $23.7B
- Recipients: 3.7 million families
- Average benefit: $6,800 per year (per family)
- Canada Workers Benefit
- Department lead: Finance Canada and Canada Revenue Agency
- Age demographic: Working Age (19 – 64)
- Funding structure: Government Funded Program – Payments to Canadians delivered through the tax system by the Canada Revenue Agency
- Total expenses: $1.2B
- Recipients: 1.5M recipients
- Average benefit: $810 per year
- National Housing Strategy
- Department lead: Canada Mortgage and Housing Corporation
- Age demographic: children/youth (0-17), Working Age (18 – 64) and seniors (65+)
- Funding structure: Government Funded Program – Payments to various levels of government and others through transfer payments
- Total investment: $3.4B
- Canada Social Transfer to provinces and territories
- Department lead: Department of Finance Canada
- Age demographic: children/youth (0-17), Working Age (18 – 64) and seniors (65+)
- Funding structure: Government Funded Program – Payments to provinces and territories through transfer payments
- Total transfers: $14.6B
- Grants & Contributions – Social Development
- Department lead: Employment and Social Development Canada
- Age demographic: children/youth (0-17), Working Age (18 – 64) and seniors (65+)
- Funding structure: government funding
- Total grants and contributions: $0.4B
- Canada Child Benefit
Provinces have primary responsibility and authority for social programming, including health, education and social services. The provincial governments, along with territorial and local governments, play a significant role in funding and delivering programs and services that contribute to the well-being of Canadians.
Data are current as of September 20, 2019.