
Spending and human resources
From: Employment and Social Development Canada
Official title: Employment and Social development Canada, 2019–20 Departmental Plan
Planned Spending
| 2019–20 Main Estimates* |
2019–20 Planned Spending* |
2020–21 Planned Spending |
2021–22 Planned Spending |
|
|---|---|---|---|---|
| Planned Gross Spending | 66,108,023,430 | 138,293,166,491 | 144,912,940,887 | 152,609,135,216 |
| Less: Planned Spending in Specified Purpose Accounts | 0 | 72,185,143,061 | 76,243,546,104 | 80,269,600,068 |
| Less: Planned Revenues netted against expenditures | 1,671,438,486 | 1,671,438,486 | 1,638,435,560 | 1,634,949,143 |
| Planned Net Spending | 64,436,584,944 | 64,436,584,944 | 67,030,959,223 | 70,704,586,005 |
Note: Please refer to ESDC's Financial Framework for a complete description of the departmental financial profile, including an explanation of gross planned spending.
* Amounts do not reflect 2019 Budget Implementation measures included in ESDC's 2019-20 Main Estimates.
For 2019–20, the Department has gross planned expenditures on programs and services of $138.3 billion. Of that amount, $131.0 billion directly benefit Canadians through statutory transfer payment programs such as Employment Insurance, the Canada Pension Plan, Old Age Security, the Canada Student Loans Program and Canada Apprentice Loans, the Canada Education Savings Program and the Canada Disability Savings Program.
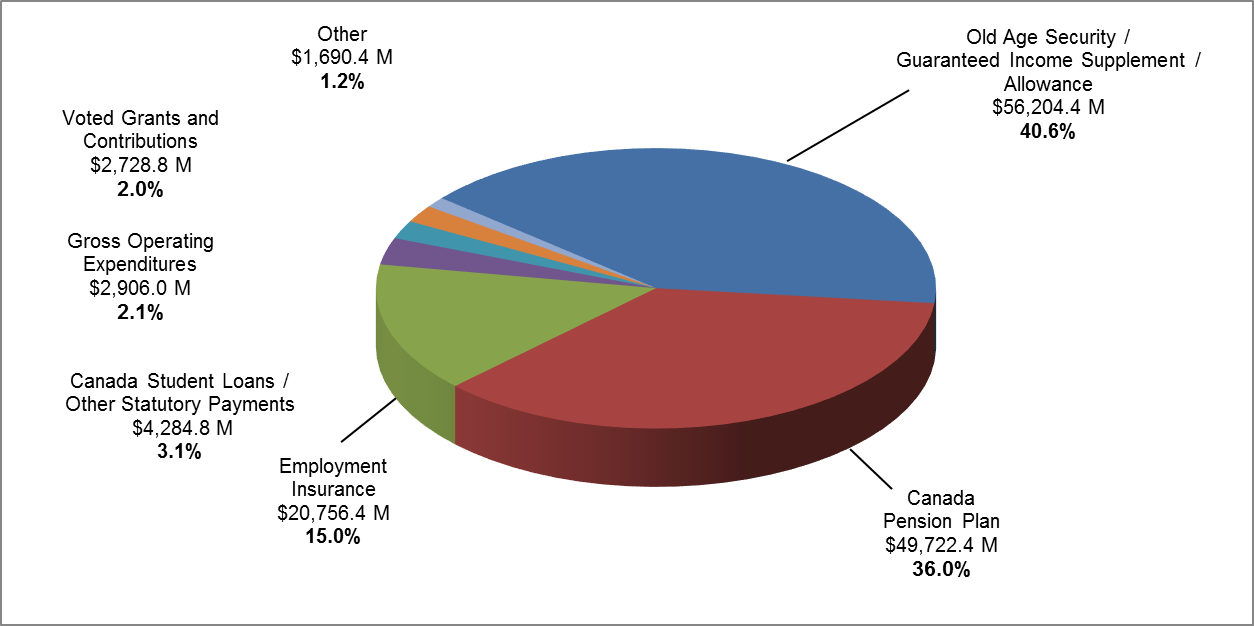
Text description of Figure 1
| Details | 2019–20 Planned spending | |
|---|---|---|
| (in millions of dollars) | Percent | |
| Old Age Security/Guaranteed Income Supplement/Allowance | 56,204.4 | 40.6% |
| Canada Pension Plan | 49,722.4 | 36.0% |
| Employment Insurance | 20,756.4 | 15.0% |
| Canada Student Loans / Other statutory payments | 4,284.8 | 3.1% |
| Gross operating expenditures | 2,906.0 | 2.1% |
| Voted grants & contributions | 2,728.8 | 2.0% |
| Other - Workers' compensation and EI/CPP charges | 1,690.4 | 1.2% |
| Consolidated total | 138,293.2 | 100.0% |
| Budgetary | |||
|---|---|---|---|
| Net Operating Costs | 1,234.6 | ||
| Add Recoveries in relation to: | |||
| Canada Pension Plan | 266.6 | ||
| Employment Insurance Operating Account | 1,279.2 | ||
| Workers' Compensation | 124.7 | ||
| Government Employee Compensation Act | 0.9 | 1,671.4 | |
| Gross Operating Costs | 2,906.0 | ||
| Voted Grants and Contributions | 2,728.8 | ||
| Total Gross Expenditures | 5,634.8 | ||
| Other- Workers' Compensation and | |||
| EI/CPP Charges and Recoveries | 1,690.4 | ||
*This amount includes $702.8 million in net voted operating expenditures, $214.7 million in contributions to employee benefit plans, $194.5 million for delivery service to the public on behalf of partners under the Department of Employment and Social Development Act, $78.2 million in statutory administrative fees related to Canada Student Loans and Apprentice Loans, $44.0 million in net expenditures for Federal Workers' Compensation and $0.4 million for other items. However, it does not include 2019 Budget Implementation measures included in the 2019–20 Main Estimates.
| Grants and Contributions: | ||
|---|---|---|
| Old Age Security | 42,754.3 | |
| Guaranteed Income Supplement | 12,895.0 | |
| Allowance | 555.1 | |
| Other Statutory Payments: | ||
| Canada Student Loans Program | ||
| and Canada Apprentice Loans | 2,311.9 | |
| Canada Education Savings Grant | 955.0 | |
| Canada Disability Savings Program | 767.3 | |
| Canada Learning Bond | 185.0 | |
| Wage Earner Protection Program | 49.3 | |
| Universal Child Care Benefit | 0.3 | 4,268.8 |
| Sub-Total | 60,473.2 | |
| Canada Pension Plan Benefits | 49,722.4 | |
| Employment Insurance Benefits | ||
| Part I | 18,357.0 | |
| Part II | 2,399.4 | 20,756.4 |
| Other Specified Purpose Accounts | 16.0** | |
| Total Statutory Transfer Payments | 130,968.0 |
**This amount includes payments related to the Government Annuities Account and the Civil Service Insurance Fund.
| Core Responsibilities and Internal Services | Planned gross spending* |
Less: Planned gross spending in specified purpose accounts | Less: Planned revenues netted against expenditures | Planned net spending |
|---|---|---|---|---|
| Core Responsibility 1: Social Development |
759,435,703 | 0 | 0 | 759,435,703 |
| Core Responsibility 2: Pensions and Benefits |
107,075,411,089 | 49,722,402,627 | 183,696,846 | 57,169,311,616 |
| Core Responsibility 3: Learning, Skills Development and Employment |
27,402,184,747 | 20,772,367,777 | 805,565,446 | 5,824,251,524 |
| Core Responsibility 4: Working Conditions and Workplace Relations |
298,909,369 | 0 | 125,900,000 | 173,009,369 |
| Core Responsibility 5: Information Delivery and Services for Other Departments | 225,074,106 | 0 | 0 | 225,074,106 |
| Subtotal | 135,761,015,014 | 70,494,770,404 | 1,115,162,292 | 64,151,082,318 |
| Internal Services | 841,778,820 | 0 | 556,276,194 | 285,502,626 |
| Other Costs** | 1,690,372,657 | 1,690,372,657 | 0 | 0 |
| Total | 138,293,166,491 | 72,185,143,061 | 1,671,438,486 | 64,436,584,944 |
Notes: Refer to the Department's Financial Framework for a complete description of the departmental financial profile, including explanation of gross planned spending.
* Amounts do not reflect 2019 Budget Implementation measures included in ESDC's 2019-20 Main Estimates.
** Other costs include administrative costs of other government departments charged to the Employment Insurance Operating Account and the Canada Pension Plan. They also include Employment Insurance doubtful accounts and recoveries from other government departments.
ESDC's Financial Framework
The Department has a complex financial structure, with various funding mechanisms used to deliver its mandate. The Department is financed by four main sources of funds:
- Appropriated funds from the Consolidated Revenue Fund (CRF);
- The Employment Insurance Operating Account;
- The Canada Pension Plan; and
- Crown corporations and other government departments for the administration of the Government Employee Compensation Act.
Planned expenditures related to the Employment Insurance Operating Account and the Canada Pension Plan, and planned expenditures that are recovered from Crown corporations and other government departments for the administration of the Government Employee Compensation Act, are excluded from the Department's Main and Supplementary Estimates and net planned spending because they are not voted by Parliament.
Employment Insurance and Canada Pension Plan benefits and related administrative costs are charged against revenues earmarked in separate specified purpose accounts. The Employment Insurance program provides financial support and other assistance to eligible workers and is entirely financed by contributions from employees and employers. The Canada Pension Plan is an income security plan funded by the contributions of employees, employers, and self-employed persons and by the revenue earned on Plan investments. It provides partial income protection in the case of the retirement, disability or death of a contributor to virtually all employed and self-employed persons in Canada, excluding Quebec which operates its own comprehensive pension plan, the Quebec Pension Plan. Administrative costs incurred by the Department in the delivery of programs related to Employment Insurance and Canada Pension Plan are charged to their respective specified purpose accounts and reported as revenues netted against expenditures under the Department.
The Department of Employment and Social Development Act was amended in June 2018 to broaden the Department's mandate to include service delivery to the public with a view to improving services to Canadians. The Department now has the legislative authority to deliver services to the public for partners on a cost-recovery basis as well as to deliver select services for the Government of Canada. As a result, costs related to the delivery of programs and services for other government departments, such as for passport services and were reported in previous years as revenues netted against the Department's expenditures, will now be reported under a new statutory authority.
In addition, departmental costs related to the delivery of programs and services on behalf of other government departments for the administration of the Government Employee Compensation Act is also reported as revenues netted against the Department's expenditures.
These items are included in the Department's gross planned spending to provide readers with the full cost to the government of the Department's programs and services and present a complete picture of the resources managed by the Department to deliver its mandate, even if these expenditures are ultimately recorded under separate legal entities.
The sources of funds, including specified purpose accounts, for each of the Department's core responsibilities are as follows:
Core Responsibility 1: Social Development
- Consolidated Revenue Fund
Core Responsibility 2: Pensions and Benefits
- Consolidated Revenue Fund; and
- Canada Pension Plan (in gross planned spending only for Canada Pension Plan benefits and related administrative costs).
Core Responsibility 3: Learning, Skills Development and Employment
- Consolidated Revenue Fund; and
- Employment Insurance Operating Account (in gross planned spending only for Employment Insurance benefits and related administrative costs).
Core Responsibility 4: Working Conditions and Workplace Relations
- Consolidated Revenue Fund; and
- Crown corporation and other departments (in gross planned spending only for the administration of the Government Employee Compensation Act).
Core Responsibility 5: Information Delivery and Services for Other Departments
- Consolidated Revenue Fund
Internal Services
- Consolidated Revenue Fund;
- Canada Pension Plan (in gross planned spending only for Canada Pension Plan administrative costs); and
- Employment Insurance Operating Account (in gross planned spending only for Employment Insurance administrative costs).
Financial Highlights
The overall gross increase in spending of $14.3 billion from fiscal year 2019-20 to fiscal year 2021-22 can mainly be explained by increases to Canada Pension Plan benefits, Old Age Security payments and Employment Insurance benefits.
Planned Canada Pension Plan benefits are at $55.6 billion in fiscal year 2021-22, an increase of $5.9 billion from the 2019-20 planned spending of $49.7 billion, mainly attributed to wage and inflation assumptions. Old Age Security benefits, including Guaranteed Income Supplement and Allowances, are expected to reach $63.3 billion in fiscal year 2021-22, which represents an increase of $7.1 billion from the 2019-20 planned spending of $56.2 billion. Annual increases are associated with a higher number of beneficiaries due to the aging population and planned increases in the average monthly benefits.
Employment Insurance benefits fluctuate every year mainly due to changes in the average unemployment rate. Employment Insurance benefits are expected to reach $23.0 billion in fiscal year 2021-22, representing an increase of $2.2 billion from the 2019-20 planned expenditures of $20.8 billion. More specifically, Employment Insurance benefits are expected to increase by $1.1 billion (6.3 percent) from the 2018-19 forecasted spending to the 2019-20 planned spending due to expected increase in both regular and special benefits. The average weekly regular benefit rate and the number of regular benefit beneficiaries will contribute to the increase. In addition, the majority of the increase in special benefits expenditure reflects Budget 2018 changes such as the new five-week EI parental sharing benefit beginning in March 2019.
Those increases are offset by a decrease of $900 million in voted grants and contributions mainly explained by the sunsetting of funding for Early Learning and Child Care, Workforce Development Agreements and the Youth Employment Strategy.
| Core Responsibilities and Internal Services | 2016–17* Expenditures | 2017–18* Expenditures | 2018–19 Forecast spending | 2019–20 Main Estimates** | 2019–20 Planned Spending** | 2020–21 Planned Spending | 2021–22 Planned Spending | ||
|---|---|---|---|---|---|---|---|---|---|
| Core Responsibility 1: Social Development |
2,239,757,375 | 695,357,869 | 862,346,232 | 759,435,703 | 759,435,703 | 476,543,837 | 500,264,555 | ||
| Core Responsibility 2: Pensions and Benefits |
91,631,984,510 | 96,051,202,359 | 101,906,202,872 | 57,353,008,462 | 107,075,411,089 | 113,530,640,317 | 120,171,303,549 | ||
| Core Responsibility 3: Learning, Skills Development and Employment | 26,317,816,518 | 26,086,783,929 | 26,611,889,819 | 6,629,816,970 | 27,402,184,747 | 27,866,496,714 | 28,900,542,309 | ||
| Core Responsibility 4: Working Conditions and Workplace Relations | 253,469,223 | 262,029,434 | 301,585,689 | 298,909,369 | 298,909,369 | 297,274,487 | 296,871,174 | ||
| Core Responsibility 5: Information Delivery and Services for Other Departments | 185,087,756 | 228,253,902 | 263,531,020 | 225,074,106 | 225,074,106 | 224,516,425 | 221,729,838 | ||
| Subtotal | 120,628,115,382 | 123,323,627,493 | 129,945,555,632 | 65,266,244,610 | 135,761,015,014 | 142,395,471,780 | 150,090,711,425 | ||
| Internal Services | 876,667,337 | 925,244,173 | 889,381,271 | 841,778,820 | 841,778,820 | 828,389,600 | 829,478,477 | ||
| Other Costs*** | 1,250,037,361 | 1,380,064,755 | 1,468,241,432 | 0 | 1,690,372,657 | 1,689,079,507 | 1,688,945,314 | ||
| Revenues netted against expenditures | 0 | 0 | 0 | (1,671,438,486) | 0 | 0 | 0 | ||
| Total Gross Planned Spending | 122,754,820,080 | 125,628,936,421 | 132,303,178,335 | 64,436,584,944 | 138,293,166,491 | 144,912,940,887 | 152,609,135,216 | ||
Notes:
Refer to the Department's Financial Framework for a complete description of the departmental financial profile, including explanation of gross planned spending.
* For comparative purposes, 2016-17 and 2017-18 actual expenditures have been restated according to the new Departmental Results Framework approved in 2018-19.
** Amounts do not reflect 2019 Budget Implementation measures included in ESDC's 2019-20 Main Estimates.
*** Other costs include administrative costs of other government departments charged to the Employment Insurance Operating Account and the Canada Pension Plan. They also include Employment Insurance doubtful accounts and recoveries from other government departments.
| Core Responsibilities and Internal Services | 2016–17* Expenditures | 2017–18* Expenditures | 2018–19 Forecast spending | 2019–20 Main Estimates** | 2019–20 Planned Spending** | 2020–21 Planned Spending | 2021–22 Planned Spending |
|---|---|---|---|---|---|---|---|
| Core Responsibility 1: Social Development | 2,239,757,375 | 695,357,869 | 862,346,232 | 759,435,703 | 759,435,703 | 476,543,837 | 500,264,555 |
| Core Responsibility 2: Pensions and Benefits | 48,917,558,758 | 51,362,618,315 | 54,586,997,358 | 57,169,311,616 | 57,169,311,616 | 60,730,874,424 | 64,432,934,599 |
| Core Responsibility 3: Learning, Skills Development and Employment | 4,689,694,911 | 5,416,434,813 | 5,976,446,602 | 5,824,251,524 | 5,824,251,524 | 5,152,876,232 | 5,102,586,976 |
| Core Responsibility 4: Working Conditions and Workplace Relations | 127,697,824 | 126,251,634 | 175,685,689 | 173,009,369 | 173,009,369 | 171,374,487 | 170,971,174 |
| Core Responsibility 5: Information Delivery and Services for Other Departments | 68,508,229 | 78,751,918 | 75,310,073 | 225,074,106 | 225,074,106 | 224,516,425 | 221,729,838 |
| Subtotal | 56,043,217,097 | 57,679,414,549 | 61,676,785,954 | 64,151,082,318 | 64,151,082,318 | 66,756,185,405 | 70,428,487,142 |
| Internal Services | 295,748,607 | 291,833,073 | 273,485,297 | 285,502,626 | 285,502,626 | 274,773,818 | 276,098,863 |
| Total Net Planned Spending | 56,338,965,704 | 57,971,247,622 | 61,950,271,251 | 64,436,584,944 | 64,436,584,944 | 67,030,959,223 | 70,704,586,005 |
Notes: Refer to the Department's Financial Framework for a complete description of the departmental financial profile.
*For comparative purposes, 2016–17 and 2017–18 actual expenditures have been restated according to the new Departmental Results Framework approved in 2018–19.
** Amounts do not reflect 2019 Budget Implementation measures included in ESDC’s 2019–20 Main Estimates.
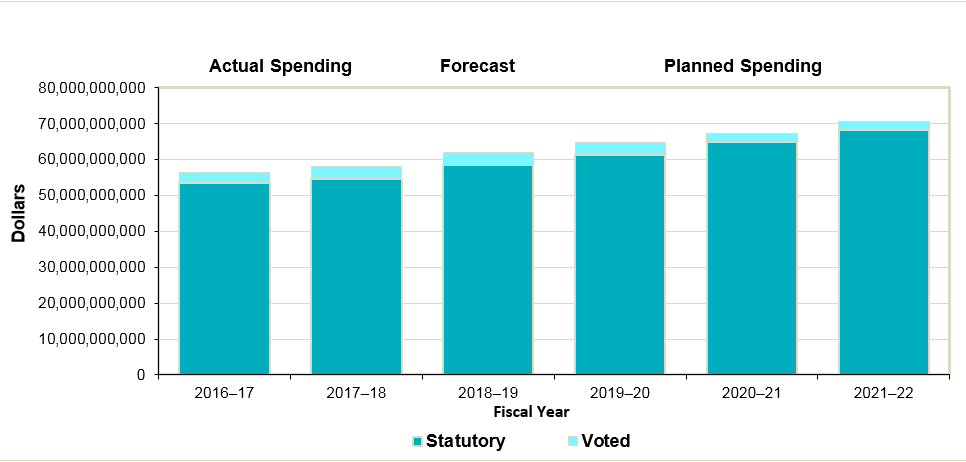
Text description of Graph
| Actual Spending | Forecast | Planned Spending | ||||
|---|---|---|---|---|---|---|
| 2016–17 | 2017–18 | 2018–19 | 2019–20* | 2020–21 | 2021–22 | |
| Statutory | 53,599,988,764 | 54,607,489,480 | 58,372,260,271 | 61,004,972,545 | 64,647,390,537 | 68,304,275,565 |
| Voted** | 2,738,976,940 | 3,363,758,142 | 3,578,010,980 | 3,431,612,399 | 2,383,568,686 | 2,400,310,440 |
| Total | 56,338,965,704 | 57,971,247,622 | 61,950,271,251 | 64,436,584,944 | 67,030,959,223 | 70,704,586,005 |
Notes:
* Amounts do not reflect 2019 Budget Implementation measures included in ESDC's 2019–20 Main Estimates.
**Voted expenditures include debt write-offs in 2016–17, 2017–18 and 2018–19.
Planned Human Resources
| Core responsibilities and Internal Services | 2016–17 Actual Spending | 2017–18 Actual Spending | 2018–19 Forecast | 2019–20 Planned Spending | 2020–21 Planned Spending | 2021–22 Planned Spending | ||
|---|---|---|---|---|---|---|---|---|
| Core Responsibility 1: Social Development | 309 | 349 | 460 | 526 | 520 | 516 | ||
| Core Responsibility 2: Pensions and Benefits | 4,801 | 5,076 | 5,066 | 3,902 | 3,547 | 3,547 | ||
| Core Responsibility 3: Learning, Skills Development and Employment | 10,046 | 10,600 | 10,444 | 9,066 | 8,853 | 8,772 | ||
| Core Responsibility 4: Working Conditions and Workplace Relations | 647 | 651 | 698 | 691 | 683 | 683 | ||
| Core Responsibility 5: Information Delivery and Services for Other Departments | 2,179 | 2,316 | 2,814 | 2,507 | 2,508 | 2,487 | ||
| Subtotal | 17,982 | 18,992 | 19,482 | 16,692 | 16,111 | 16,005 | ||
| Internal Services | 3,843 | 4,114 | 4,503 | 4,462 | 4,404 | 4,397 | ||
| Total | 21,825 | 23,106 | 23,985 | 21,154 | 20,515 | 20,402 | ||
The overall decrease of 752 full-time equivalents from fiscal year 2019–20 to fiscal year 2021–22 is mainly explained by the following items:
- Social Development: the decrease of 10 full-time equivalents is due to the decrease of temporary funding provided for the Early Learning and Child Care Strategy;
- Pensions and Benefits: the decrease of 355 full-time equivalents is a result of a reduction in temporary resources provided to address Old Age Security and Canada Pension Plan workload issues;
- Learning, Skills Development and Employment: the reduction of 294 full-time equivalents is mainly related to the decrease of temporary funding provided for the Youth Employment Strategy, the Temporary Foreign Worker Program, Canada Service Corps and for enhanced Indigenous community outreach activities;
- Working Conditions and Workplace Relations: the decrease of 8 full-time equivalents is a result of the ending of temporary resources to address the administration of the pay transparency measure announced in Budget 2018 to provide online information on the pay practices of federally regulated employers;
- Information Delivery and Services to Other Departments: the decrease of 20 full-time equivalents is due to a decrease in temporary resources provided to enhance Indigenous community outreach activities; and
Internal Services: the decrease of 65 full-time equivalents is mainly a result of the decrease of temporary resources associated with Old Age Security and Canada Pension Plan workload issues, the Old Age Security Service Improvement Strategy and the Youth Employment Strategy.
Estimates by Vote
Information on Employment and Social Development Canada’s organizational appropriations is available in the 2019–20 Main Estimatesi.
Consolidated Future-Oriented Condensed Statement of Operations
The Consolidated Future-Oriented Condensed Statement of Operations provides a general overview of the Department’s operations. The forecast of financial information on expenses and revenues is prepared on an accrual accounting basis to strengthen accountability and to improve transparency and financial management.
Because the Consolidated Future-Oriented Condensed Statement of Operations is prepared on an accrual accounting basis, and the forecast and planned spending amounts presented in other sections of the Departmental Plan are prepared on an expenditure basis, amounts may differ.
The Consolidated Future-Oriented Condensed Statement of Operations includes the transactions of the Employment Insurance Operating Account, a consolidated specified purpose account which includes revenues credited and expenses charged under the Employment Insurance Act. The accounts of the Employment Insurance Operating Account have been consolidated with those of the Department and all inter-organizational balances and transactions have been eliminated. However, the Canada Pension Plan is excluded from the Department's reporting entity because changes to the Canada Pension Plan require the agreement of two-thirds of participating provinces and it is therefore not controlled by the Government.
A more detailed Consolidated Future-Oriented Condensed Statement of Operations and associated notes, including a reconciliation of the net cost of operations to the requested authorities, are available on the Department’s website.
| Financial Information | 2018–19 Forecast Results | 2019–20 Planned Results | Difference (2019–20 Planned Results minus 2018–19 Forecast Results) |
|---|---|---|---|
| Total Expenses | 84,517,487,028 | 87,760,048,887 | 3,242,561,859 |
| Total Revenues | 23,037,454,904 | 23,184,304,891 | 146,849,987 |
| Net cost of operations | 61,480,032,124 | 64,575,743,996 | 3,095,711,872 |
The increase of $3,095.7 million in the 2019–20 planned results of the net cost of operations, when compared to the 2018–19 forecast results is due to the following:
For expenses, the increase of $3,242.6 million is mainly attributable to:
- An increase of $2,509.7 million in Pensions and Benefits expenses, mainly due to the projected increase in the eligible population of the Old Age Security and Guaranteed Income Supplement benefits.
- An increase of $952.4 million in Learning, Skills Development and Employment expenses, mainly due to an expected increase in the average weekly regular benefit rate and the implementation in March 2019 of the new five-week Employment Insurance parental sharing benefit announced in Budget 2018.
For revenues, the increase of $146.8 million is mainly attributable to:
- An increase of $272.5 million in Employment Insurance revenues, mainly due to the projected increase in the total insurable earnings resulting from the expected growth in employment and in the maximum insurable earnings.
Statutory Annual Reports
Employment Insurance Part II
Part II of the Employment Insurance Act requires the federal government to work in concert with provinces and territories to put in place Employment Benefits and Support Measures or similar programs and services to help Canadians integrate into the labour market.
Since provinces and territories are best placed to determine the mix of employment programming best suited to meet their local and regional labour market needs, Employment Benefits and Support Measures are delivered under bilateral transfer agreements between Canada and the provinces and territories called the Labour Market Development Agreements.
Employment Benefits and Support Measures are comprised of five employment benefit programs — Skills Development, Targeted Wage Subsidies, Self-Employment, Job Creation Partnerships, and Targeted Earnings Supplements — and three support measures — Employment Assistance Services, Labour Market Partnerships, which includes Employer Sponsored Training, and Research and Innovation.
More detailed information on Employment Insurance Part II is available on the Department’s website.
Financial Data
For fiscal year 2019–20, the total Employment Insurance Part II expenditure authority of $2.424 billion represents 0.38% of the total estimated insurable earnings figure of $646.1 billion. This represents a lower level of expenditures than the 0.8% ceiling imposed under the Employment Insurance Act, which is estimated at $5.169 billion in 2019–20. The amount of reinvestment reached maturity at $800 million in 2000–01.
| ($) | Base | Re-Investment | Budget 2017* | Total Plan |
|---|---|---|---|---|
| Newfoundland and Labrador | 53,614,954 | 73,086,000 | 9,941,402 | 136,642,356 |
| Nova Scotia | 47,148,878 | 30,348,000 | 10,346,177 | 87,843,055 |
| New Brunswick | 46,749,407 | 42,116,000 | 9,968,437 | 98,833,844 |
| Prince Edward Island | 13,907,680 | 10,022,000 | 2,425,139 | 26,354,819 |
| Quebec | 315,721,746 | 248,071,000 | 65,578,583 | 629,371,329 |
| Ontario | 385,307,735 | 184,097,000 | 81,072,009 | 650,476,744 |
| Manitoba | 32,846,333 | 10,233,000 | 7,725,370 | 50,804,703 |
| Saskatchewan | 26,942,153 | 9,862,000 | 7,202,748 | 44,006,901 |
| Alberta | 99,026,001 | 35,921,000 | 29,685,602 | 164,632,603 |
| Nunavut | 1,755,742 | 954,000 | 302,713 | 3,012,455 |
| Northwest Territories | 1,357,524 | 1,552,000 | 339,815 | 3,249,339 |
| British Columbia | 123,790,390 | 151,732,000 | 25,184,810 | 300,707,200 |
| Yukon | 1,831,457 | 2,006,000 | 227,195 | 4,064,652 |
| 1,150,000,000 | 800,000,000 | 250,000,000 | 2,200,000,000 | |
| Labour Market Development Agreements Targeted Funding – Steel and Aluminum | 25,000,000 | 25,000,000 | ||
| Labour Market Development Agreements Targeted Funding - Seasonal | 20,500,000 | 20,500,000 | ||
| Pan-Canadian Responsibilities** | 153,879,877 | 153,879,877 | ||
| Funds available for Employment Benefits and Support Measures | 1,303,879,877 | 800,000,000 | 295,500,000 | 2,399,379,877 |
Notes:
*Additional Labour Market Development Agreements announced in Budget 2017 of $250 million for 2019-20.
**The amount for Pan-Canadian Responsibilities includes the ongoing envelope of $150,867,575 minus the permanent conversion to operating of $24,317,698. This also includes $27.33 million for the Indigenous Skills and Employment Training program and a temporary conversion (for 2019–20) from the Employment Insurance Part II Pan-Canadian program funds to operating of $5.518 million for the Education and Labour Market Longitudinal Platform.
Page details
- Date modified: