
Departmental Results Report for fiscal year 2020 to 2021
On this page
- From the Ministers
- Results at a glance
- Results: what we achieved
- Analysis of trends in spending and human resources
- Corporate information
- Supporting information on the program inventory
- Supplementary information tables
- Federal tax expenditures
- Organizational contact information
- Appendix: definitions
Alternate formats

Large print, braille, MP3 (audio), e-text and DAISY formats are available on demand by ordering online or calling 1 800 O-Canada (1-800-622-6232). If you use a teletypewriter (TTY), call 1-800-926-9105.
From the Ministers
We are pleased to present the 2020 to 2021 Departmental Results Report for Employment and Social Development Canada (ESDC or the department). This report shines a light on our actions during a landmark year: in March of 2020, the World Health Organization declared COVID-19 to be a global pandemic. The rapid spread of the virus throughout the world caused widespread social and economic shock that is ongoing.
This report demonstrates how ESDC helped individuals, communities and families weather the economic and social hardships caused by the pandemic. It also shows how, at the same time, the department advanced its mandate to build a stronger and more inclusive country.
When the pandemic first shuttered the Canadian economy, the Government of Canada moved quickly to support Canadians. The keystone piece of that support was the Canada Emergency Response Benefit (CERB), which the department developed in collaboration with the Canada Revenue Agency. The CERB was a lifeline for many suddenly out of work. Nearly 8.9 million Canadians received over $71.7 billion in CERB payments. The Canadian financial sector put forward that this support has helped prevent catastrophic household income loss and has helped keep the economy afloat.
As the pandemic wore on, ESDC made temporary changes to the Employment Insurance (EI) program to better support workers. Later, the department also created three new recovery benefits that would provide continued support to those affected.
However, not everyone who lost income in the spring of 2020 was covered by the CERB or EI. That is why ESDC created the Canada Emergency Student Benefit, which included an extra amount for students with disabilities and students with dependents. To help youth find quality summer jobs, the department expanded the Canada Summer Jobs program. It also provided thousands of opportunities through the Youth Employment and Skills Strategy, especially for youth who face barriers to entering the workplace. ESDC also made additional investments to provide valuable paid student work placements and placed a delay on student loan repayments.
The COVID-19 pandemic has disproportionately impacted marginalized and underserved populations. That is why ESDC implemented the Emergency Community Support Fund. Local and diverse community organizations received funding for over 11,500 projects to help Canadians in vulnerable situations cope with effects of the pandemic.
Reducing and preventing homelessness in Canada remained a priority. The department distributed supplementary funding to Reaching Home recipients. This allowed the homeless-serving sector to protect and support those experiencing homelessness during the pandemic.
ESDC also issued a one-time payment for eligible persons with disabilities to help them deal with pandemic-related costs. In addition, the department established the COVID‑19 Disability Advisory Group to help the Government have a disability-inclusive response to the pandemic.
This past year, the Government helped seniors offset their extra pandemic-related costs through a Goods and Services Tax Credit in April 2020 and a one-time Old Age Security/Guaranteed Income Supplement payment in July 2020. We also funded community projects to help reduce social isolation and serve seniors’ needs.
We know it has been a difficult year for many Canadian families – especially those with young children at home. The closures of schools and daycares forced parents – often women – to take on new roles while balancing working from home. Remote learning also created unexpected additional expenses. To help cover some of these costs, families received a one-time Canada Child Benefit payment of $300. Additionally, in July 2020, the maximum yearly Canada Child Benefit amount was increased once again to keep up with the cost of living.
As we transition toward economic recovery, we aim to build back better. We know that as parents start the process of returning to work, finding affordable, high-quality child care is critical. The department has put in place bilateral agreements with provinces and territories, based on the Multilateral Early Learning and Child Care Framework. This means that providers will be able to offer spaces beyond the 40,000 new spots created, as promised. ESDC also supported Indigenous communities to advance the goals and priorities outlined in the Indigenous Early Learning and Child Care Framework.
Building back better also means making sure that Canadians have the skills they need to do the jobs that are available. ESDC made new investments in an effort to support people experiencing barriers to entering the workforce. In this regard, the department put special emphasis on people trying to enter skilled trades.
The department is committed to pay equity. To facilitate the application of the Pay Equity Act, it developed the Pay Equity Regulations. These regulations will ensure that employees of federally regulated workplaces receive equal pay for work of equal value regardless of their gender. ESDC has also implemented initiatives such as federal anti-harassment and violence legislation and the Roadmap to Future Workplaces project.
If we are going to build back better, we need to do so with a vision for the future. This means a labour market that is resilient and inclusive. It means that people have the skills they need to do the jobs of the future. And it means that people can access the services they need without barriers. Here at ESDC, we brought this vision into our pandemic response, and we will bring it into our recovery.
Finally, we would like to extend our sincerest gratitude to all the employees of ESDC and Service Canada for their hard work and dedication during this difficult year. Thanks to them, Canadians continued to receive urgent and new services, without delay, to help them weather the pandemic. And in the meantime, employees faced enormous hurdles to get things done, while living through the pandemic themselves – sometimes at personal sacrifice. To these employees: we send our sincerest gratitude and appreciation for your role in helping Canadians get through this difficult period.
Minister of Employment, Workforce Development and Disability Inclusion, Carla Qualtrough
Minister of Families, Children and Social Development, Karina Gould
Minister of Labour, Seamus O’Regan Jr.
Minister of Seniors, Kamal Khera
Results at a glance
Fiscal year 2020 to 2021 unfolded under the global COVID-19 pandemic, creating unprecedented disruptions to the lives of all Canadians. Throughout the year, Employment and Social Development Canada continued to support Canadians by quickly implementing pandemic response measures. The department developed and implemented many new measures to support Canadians, including:
- the Canada Emergency Response Benefit, which benefited nearly 8.9 million Canadians, from March 2020 to October 2020. Then in the fall, the department implemented 3 new Canada Recovery Benefits. As of March 31st, 2021, approximately 1.9 million Canadians accessed the Canada Recovery Benefit, 370,000 accessed the Canada Recovery Caregiving Benefit, and 470,000 accessed the Canada Recovery Sickness Benefit
- the One-Time Payment for Seniors and One-Time Payment for Persons with Disabilities. Both financially supported eligible clients to help them cover additional costs resulting from the pandemic
- the Emergency Community Support Fund, which provided $350 million to community organizations that funded 11,500 projects
- eServiceCanada, a call-back service put in place in March 2020 to replace in-person services, which were temporarily unavailable
The department also provided support through many existing programs, for example, by:
- providing provinces and territories with an additional $1.5 billion through the Workforce Development Agreements. These funds helped Canadians from underrepresented groups and in sectors hardest hit by the COVID-19 pandemic with training and employment supports, so they could quickly re-enter the workforce
- investing an additional $266.1 million in the Student Work Placement Program. This investment supported the creation of work placements for post-secondary students in vital sectors such as healthcare. These funds helped more students access learning opportunities
- protecting the safety and rights of foreign workers. The department reprioritized applications under the Temporary Foreign Workers Program to focus on key economic sectors and essential occupations. In addition, the department reduced administrative burdens for employers under the program
- to better support workers protection, ESDC inspectors were granted the authority to verify employers’ compliance with new health and safety requirements. The department also increased the number of inspections, improved coordination and information sharing with provinces, and made enhancements to its tip line operations and consulate liaison services
All these measures, and many others included in this report, played an essential role in helping Canadians through the crisis. For example, the department made adjustments to its programs and processes to either simplify access or extend eligibility to benefits. The department also ensured Canadians were kept informed through the 1 800 O-Canada phone line and Canada.ca website.
In addition to supporting Canadians through the pandemic, the department also completed many of its planned activities. Among these are the following, which are detailed in this report:
- modernizing the Canada Labour Code to implement an Administrative Monetary Penalties System
- implementing the Work Place Harassment and Violence Prevention Regulations
- concluding 1-year extension agreements on early learning and child care with all provinces and territories
- expanding the Reaching Home program, aimed at reducing homelessness in Canada to 6 new communities
The Virtual Assistant tool, on Canada.ca, helped Canadians find quick answers to their COVID-19 related questions. Developed in partnership with the Department of Finance and Health Canada, it was used more than 750,000 times by Canadians.
These are just a few of the many activities undertaken by the department, either directly or through partnerships with other organizations. All through this report, you can learn more about the ways in which the department supported seniors, women, youth, homeless people, persons with disabilities, Indigenous people, children and families, Black communities, official language minority communities, workers, employers, newcomers, students, and others.
Operating context
The department operated and undertook all its activities in the particular context of the COVID-19 pandemic in fiscal year 2020 to 2021. The Canadian economy and labour market underwent dramatic changes due to measures put in place to slow the spread of the virus.
Before the pandemic, the Canadian economy and labour market were performing well. The unemployment rate was at, or close to, historical lows for most of 2019 and early 2020. However, the pandemic resulted in a sudden and unprecedented shock that started in March 2020. By April 2020, public health measures to limit the spread of the virus had affected the employment of 5.5 million Canadians. Of these, 3 million lost their jobs. Another 2.5 million were still employed but worked less than half of their regular hours. Groups that faced barriers to labour market participation prior to the pandemic were among those most impacted. These include youth, women, immigrants, Indigenous people, low-wage workers and persons with lower levels of education. Full-time, highly-educated workers experienced far fewer job losses over this period. However, the way this group worked changed almost overnight as the majority switched to teleworking. Accommodation, food services and non-essential retail trade industries with limited ability to telework experienced significant job losses at the beginning of the pandemic. Although the number of workers affected by the pandemic declined throughout 2020 to 2021, to over 500,000 by March 2021, long-term unemployment grew significantly over the course of the 2020 to 2021 fiscal year.
These employment losses and other impacts of the pandemic took a toll on Canada’s economy. Canada’s Gross Domestic Product shrank by 5.4% in 2020, the steepest annual drop in economic output since data were first published in 1961.
Other, longer-term factors present before the pandemic continued to impact Canada’s labour market and economy. These include:
- an aging population that can reduce labour force growth, limit economic growth and increase the likelihood of labour shortages
- the use of new, digital technologies that speed up changes in the labour market. These technologies are making some occupations obsolete, creating new ones and changing the skills needed for many occupations
- efforts to mitigate the impacts of climate change and contribute to the green economy. These efforts continued to play a role in labour market transformation, but uncertainty still remains regarding the precise scope and pace of anticipated change. Employment related to environmental and clean technologies is growing at a faster pace than for the rest of the economy
In addition, the pandemic slowed down the pace of globalization. Travel restrictions, workplace capacity restrictions, and lockdowns reduced the movement of people, goods and services across borders. This contributed to a global supply chain disruption. The pandemic has also created pressures in different parts of the Canadian labour market. For example, it increased the demand for workers in some occupations, such as high-skilled medical workers. At the same time, it reduced inflows of immigrants and temporary foreign workers, which limited their contribution to the Canadian labour market.
Supporting the government’s response to the COVID-19 pandemic defined Employment and Social Development Canada’s service delivery context. The department’s efforts were focused on maintaining timely and safe access to Government of Canada information, services, and benefits. It established eService Canada to allow clients to access services online, without coming into a Service Canada office. The department also worked to ensure the rapid delivery of new benefits and increased the capacity of its online and phone delivery services. This addressed increased demand for services and health and safety concerns associated with in-person services. At the same time, the department ensured safe access to its in-person offices following temporary closures early in the pandemic. These offices are often the most convenient option for marginalized and underserved individuals to access government assistance.
The department continued to work to ensure service excellence for all Canadians. Here is an overview of what the department accomplished in this regard in fiscal year 2020 to 2021.
Key service achievements
The COVID-19 pandemic had a major impact on the department’s service delivery in fiscal year 2020 to 2021. The department focused on a rapid roll-out of support measures and on maintaining uninterrupted delivery of services to Canadians and community organizations.
At the same time, it continued to advance its ambitious service agenda to ensure service excellence for clients in 3 main areas:
- modernizing the departmental information technology systems, which support online service delivery
- improving the quality of the client service experience and outcomes
- ensuring all eligible individuals can access the department’s services
Technology and systems modernization
Technology underpins the department’s service delivery and enables reliable, accurate, and secure online services. In fiscal year 2020 to 2021, the department made progress in updating technology. For example, it:
- advanced execution of the Benefits Delivery Modernization programme. This key initiative will span over 10 years. It will transform service delivery for the department’s 3 major programs, Employment Insurance (EI), Old Age Security (OAS) and Canada Pension Plan (CPP). In fiscal year 2020 to 2021, the department started activities to improve how services for these 3 programs are delivered. This included launching the development of the common benefit delivery platform on which these benefits will be delivered. The launching required building the foundational business processes, operating model, technology and cloud infrastructure. All these elements needed to be flexible enough to design, onboard, manage, and securely administer these benefits in the future.
- implemented the Electronic Social Insurance Number service which now allows clients across Canada to get a Social Insurance Number online, without going to a Service Canada Centre
- developed its Security Policy Suite to better protect Canadian’s personal information
- supported migration of 2 identity business lines, the Social Insurance Number and the Registration and Authentication telephone services, to a new platform in April and June 2020.
- allowed clients to complete their Declaration of Attendance at School or University online and upload proof of enrolment to renew CPP Children’s Benefits
- moved forward on the design and implementation of Robotics Processing Automation (RPA) to automate routine, repetitive and operational tasks for EI, OAS and CPP operations. This automation allows client service agents to focus on tasks that require human intelligence and decision-making capacity. This has resulted in more timely support and personalized services for clients
- Supported EI and Canada Emergency Response Benefit (CERB) processing, by implementing the use of RPA, which allowed reallocation of human resources. For example, every year there are EI tax slips (T4Es) that cannot be issued automatically by the system for various reasons. In fiscal year 2020 to 2021, the volume of manually processed T4Es was over 60 times higher than normal. The RPA initiative supported the department in meeting its obligation of having all T4Es mailed out by the last day in February
- enabled Canadians to submit their documentation electronically for the JobBank, CPP-Disability, Apprenticeship Grants and Employment Insurance programs. In fiscal year 2020 to 2021, 52,886 documents were uploaded electronically compared to 82 in the previous year. Clients can now upload supporting documentation for CPP-Disability applications through their My Service Canada Account. This can be done for both the online and paper versions of the application form. Clients can now also make an online request to have their application reviewed
Improving the client service experience and outcomes
Service modernization and investments in technology improve the client service experience. Making services user friendly and intuitive, easy to access, and supported across channels, improves how clients experience their interactions with government and increases public trust. For a citizen-centred organization, responding to emerging client needs and providing an excellent service experience is the ultimate objective. This year, the department:
- reacted rapidly to the COVID-19 crisis and enhanced its call centre services to support Canadians during the pandemic by:
- creating a new Canada Emergency Response Benefit (CERB) Virtual Call Centre. This call centre responded to general inquiries and provided information related to CERB eligibility and the application process. At its peak, the CERB Virtual Call Centre had more than 1,500 staff. Between April and September 2020, nearly 1.2 million calls were answered
- increasing the number of agents from 1,100 to 3,000 agents in its Employment Insurance (EI) Call Centres to reduce wait times
- launching a call centre, on behalf of the Public Health Agency of Canada, to monitor quarantine requirements of travelers entering Canada. Agents made calls to close to 2 million travelers. In addition, more than 1.1 million automated calls were made to advise travelers of quarantine requirements. There were also over 800,000 automated survey calls made to travelers, to confirm that they were following quarantine requirements. Close to 1.3 million inbound calls were received from travelers to report that they arrived at their place of quarantine and to complete their daily COVID-19 symptom self-assessment
- providing telephone services for the new One-Time Payment to Seniors, by answering 75,000 calls through the Pensions Call Centres
- designed, tested and launched a self-service option for the Pensions Call Centres’ Interactive Voice Response system. This allowed clients to self authenticate using their Social Insurance Number and date of birth to receive information on their most recent payment amount and date, or their application status. Nearly 1.25 million calls were answered in fiscal year 2020 to 2021. Client surveys showed that the client experience was improved by this enhancement to the Interactive Voice Response system
- modernized grants and contributions programs by focusing on 4 key areas: client experience, efficiency, innovation and stewardship. This made it easier for organizations to apply for grants and contributions. This included:
- streamlining application processes by publishing a new call for proposal calendar to inform clients when they can apply for funding
- launching a survey to measure client’s satisfaction and expectations of grants and contributions programs
- updating service standards to reduce the time required to acknowledge receipt of proposals, issue payment, and notify applicants of funding decisions
- introducing flexibilities for grants and contributions programs to support community organizations in maintaining critical services
- completed consultation with partners to ensure the blueprint for the Social Insurance Register modernization would meet expectations
Reaching all Canadians
The COVID-19 pandemic highlighted that government services must be available to everyone. This is especially important for marginalized and underserved clients, who even under normal circumstances, experience barriers in accessing government services. The department made its services more accessible to marginalized and underserved populations by:
- developing the Reaching All Canadians Strategy to improve service delivery outcomes for all clients. This includes informing marginalized and underserved populations about Government of Canada programs, services and benefits, and how to access them
- implementing an Outreach Support Centre to provide services to Indigenous communities and other marginalized and underserved clients. These can be clients with no reliable access to the internet or who experience other barriers to accessing service
- simplifying and updating the language used in grant and contribution program web pages related to program delivery. These pages now use plain language and are fully accessible
- facilitating and ensuring the flow of funding to marginalized and underserved Canadians by simplifying requirements for grant and contribution recipient organizations
- continuing to simplify its web content. The web pages for ESDC’s major benefits programs drive 90% of traffic. They are, on average, at a grade 6 reading level. The rest of ESDC’s information-focused pages average grade 9 reading level
- improving ESDC’s digital client experience, including by working earlier with policy and programs to embed client experience early in content and program design, and by improving client journeys across service channels
- assisting clients with vision or hearing impairments who visit Service Canada Centres through various devices to improve their service experience
- reaching out to more than 350 targeted contacts with Indigenous communities and 425 contacts with senior organizations in the Atlantic region. The region also reached out to 1,000 contacts with disability organizations, 70 contacts with Black community organizations and 1,200 contacts with newcomers and homeless services organizations. These organizations were offered information and access to services. These included programs such as skills and employment training, New Horizons for Seniors and Canada Summer Jobs
Service Canada regional service delivery
Regions played a pivotal role in supporting Canadians through the pandemic. They shifted their activities to make sure marginalized and underserved groups had information on, and access to, government programs, services and benefits. Among the key marginalized and underserved groups are Indigenous people, Canadians living in rural and remote areas, employers and grant and contribution recipient organizations. Regions also carried out programming to help employers and Canadians across the country during the pandemic. This year, regions:
- provided Indigenous Elders and seniors with assistance to fill-out forms and submit documents to receive government supports
- worked with the National Defence Army Rangers to distribute business cards and posters. These cards provided the Service Canada Outreach Support Centre phone number to residents of Hatchet Lake in northern Saskatchewan
- proactively provided information on COVID-19 special measures, available supports, programs and services to organizations. This included 507 Indigenous communities and 1,803 community partners in the Western Canada and Territories (W-T) region
- partnered with the Canada Revenue Agency and the Kativik Regional Government, to provide virtual services, by phone or computer, to 11 of the 14 Inuit communities in Nunavik. In total, 28 clients used this service
- worked with employers to set up 1,887 Work-Sharing agreements that helped avoid layoffs and protected 24,374 jobs in the W-T region. This was an increase from 189 agreements in the previous year
- held over 80 virtual information sessions in Quebec to inform businesses about the Work-Sharing Program and the temporary measures put in place during the pandemic. These measures relaxed eligibility requirements for employers and allowed for the extension of Work-Sharing Agreements. Over 200 businesses were reached through these sessions
Results achieved in specific regions
Western Canada and Territories
- the region provided guidance to Alberta’s Ministry of Children’s Services on the electronic Social Insurance Number application process. The ministry is now using this process to apply directly online to obtain Social Insurance Numbers for children in care
- the region also partnered with the Northern Lights School Division to provide students with information on obtaining a Social Insurance Number
- program officials transcribed applications received orally from New Horizons for Seniors applicants in remote and lower capacity communities. This resulted in reducing barriers to access the program. The program also translated marketing materials into Indigenous languages and into Inuktitut. Both of these efforts resulted in an increase of applications in Nunavut from 8 in fiscal year 2019 to 2020, to 16 in fiscal year 2020 to 2021. During the same period, in the Northwest Territories, it increased from 23 to 34, and in the Yukon, from 14 to 24
Ontario region
- the region piloted tools, chosen in consultation with individuals who have lived experience with disabilities. These will help clients navigate and communicate with Service Canada Centre staff. This included tactile flooring, a textured ground surface to guide clients who are visually impaired. TalkPerfect has also been put in place to amplify speech and minimize background sound for both the client and Service Canada agent
- the region provided community-based virtual services to reduce client wait times and maximize Service Canada Centres' capacity. This service connects clients to a virtual Citizen Service Officer by video chat
Quebec region
- to facilitate the error-free issuance of social insurance numbers (SIN) to temporary foreign workers (TFWs), the region carried out an electronic Social Insurance Numbers (SIN) issuance strategy and organized clinics at key locations, avoiding the trip to Service Canada Centres. In total, the Quebec Region issued 12,000 SIN to TFWs
- the region attended le Salon des aidants et des aînés de la Mauricie and received 124 virtual visits, compared to an average of 74 visits amongst other kiosks
Atlantic region
- the region worked with the Labrador Aboriginal Training Partnership. This allowed approximately 20 Indigenous clients from Labrador to acquire in-person, underground miner training during the pandemic
- the region led the Death Notification Proof of Concept initiative for the Canada Pension Plan Service Improvement Strategy. In total, 193 death notifications were submitted electronically from funeral homes to Service Canada. Funeral homes requested to continue this online service
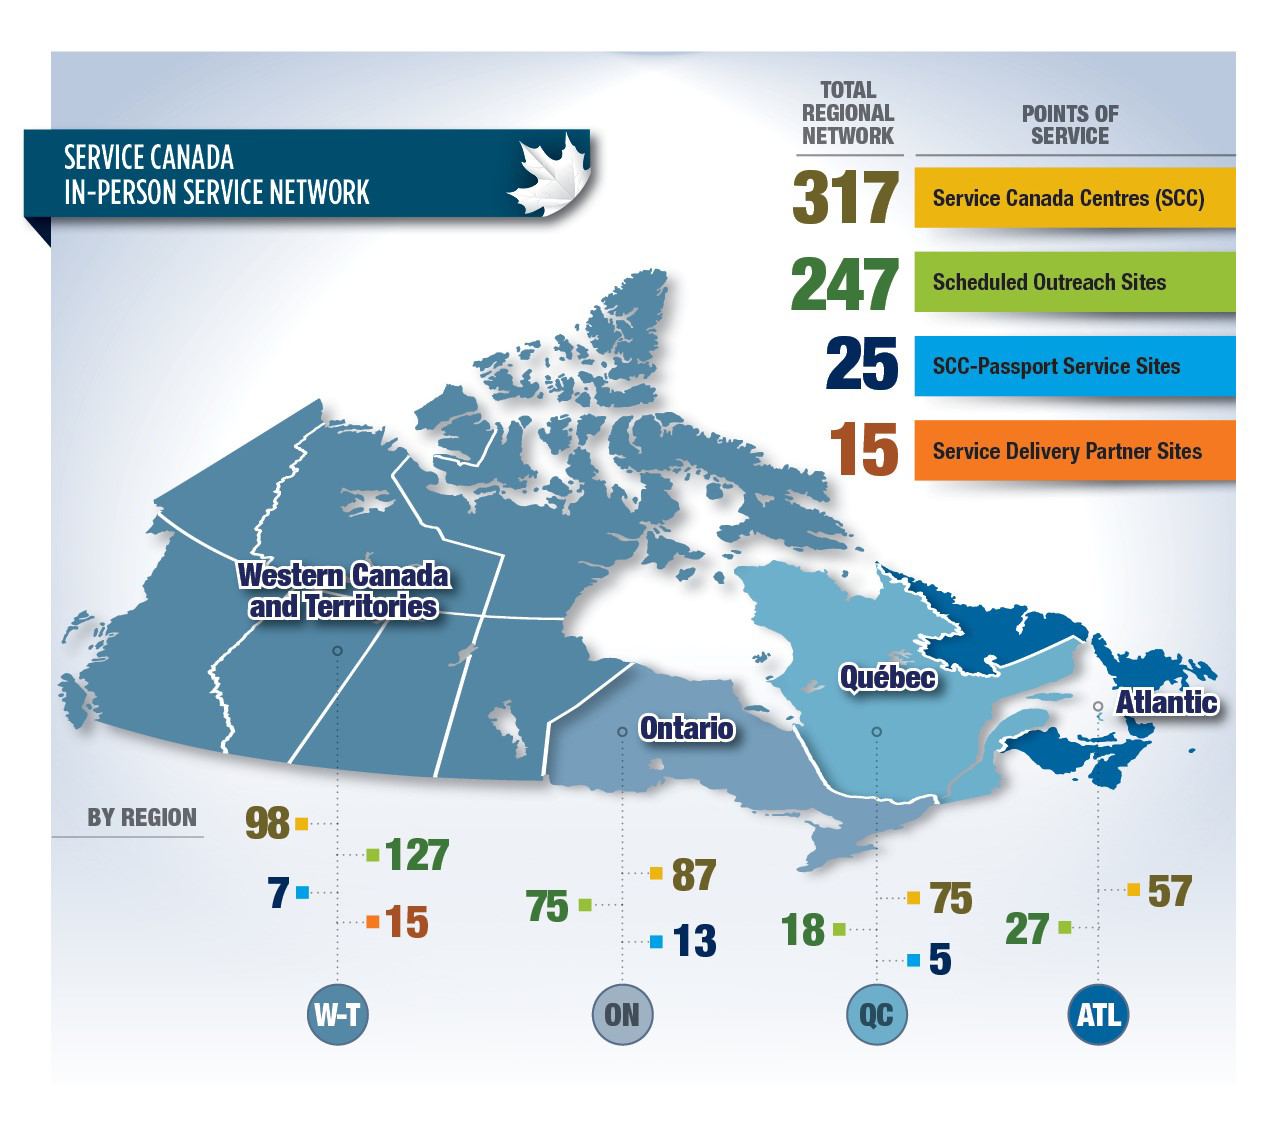
Text description of Figure 1:
Service Canada Centres
- Western Canada and Territories: 98
- Ontario: 87
- Québec: 75
- Atlantic: 57
- Total: 317
Scheduled outreach sites
- Western Canada and Territories: 127
- Ontario: 75
- Québec: 18
- Atlantic: 27
- Total: 247
Service Canada Centres - Passport service sites
- Western Canada and Territories: 7
- Ontario: 13
- Québec: 5
- Atlantic: 0
- Total: 25
Service delivery partner sites
- Western Canada and Territories: 15
- Ontario: 0
- Québec: 0
- Atlantic: 0
- Total: 15
Information in this figure is valid as of March 31, 2021. Note that 310 Service Canada Centres had been reactivated as of March 31, 2021.
For more information on Employment and Social Development Canada’s plans, priorities and results achieved, see the “Results: what we achieved” section of this report.
Results: what we achieved
Social development
Description: to increase inclusion and opportunities for Canadians to participate in their communities.
Results
Access to early learning and child care is increased
Pandemic-related measures
The COVID-19 pandemic has underscored the importance of access to child care to the functioning of Canada’s economy. Therefore, the department added flexibility to its bilateral early learning and child care agreements with provinces and territories. This helped them to respond to the unique demands flowing from the pandemic. The department also provided $625 million in emergency pandemic support to provinces and territories for the child care sector through the Safe Restart Agreements.
The COVID-19 pandemic impacted early learning and child care in Indigenous communities. In response, the department put in place a temporary measure to spend the Indigenous Early Learning and Child Care program funds. This measure enabled Indigenous leaders to provide alternative program and service delivery options to children and families impacted by the pandemic. The department also distributed $120.7 million in additional funding to help Indigenous early learning and child care facilities adapt to public health measures.
Planned commitments and other achievements
Early learning and child care
The department signed one-year extensions of existing bilateral agreements on early learning and child care (ELCC) with all provinces and territories. These agreements provide for a total federal investment of $400 million for fiscal year 2020 to 2021.
To improve data and to do research to help measure progress, the department completed 22 collaborative projects with Statistics Canada to help identify data gaps, inform policy development and decision-making. These include 4 data development and collection projects, such as the 2020 Survey on Early Learning and Child Care Arrangement. They also include research and analysis reports on a number of priority topics related to ELCC and Indigenous ELCC. The department also undertook 2 dissemination projects, including the development of the ELCC Information Hub.
Indigenous early learning and child care
The department supported Indigenous communities through its partnership tables with First Nations, Inuit and the Métis Nation. These partnership tables advanced goals and priorities stated in the Indigenous Early Learning and Child Care Framework. This resulted in:
- funding to First Nations communities for a range of early learning and child care needs
- continued funding to improve existing early learning and child care services in Inuit Nunangat
- the establishment of new Métis-specific early learning and child care programs, services and supports
- increased support to the Aboriginal Head Start in Urban and Northern Communities program to enhance programming in urban and northern communities
As well, a total of 13 Quality Improvement Projects received funding to support Indigenous-led best practices and advance foundational elements of Indigenous ELCC.
Barriers to accessibility for people with disabilities are removed
Accessible Canada Act implementation
The department published the proposed Accessible Canada Regulations for public comment. To encourage participation, the department provided 5 technical briefings to stakeholders and held meetings with key disability organizations. The pandemic made it difficult for the disability community to take part in this process. To accommodate this community, the department provided a longer comment period on the draft regulations. This gave more time for the disability community to participate in the process.
In support of this implementation, the Accessibility Secretariat co-designed a project with the department’s Innovation Lab. This project included workshops with a diversity of people with disabilities and representatives from federally-regulated industries. They came together to create recommendations, prototypes and guidance material related to the act. The department listened to the stories of 127 participants from across Canada. It then developed 10 prototypes to support implementation of the act. These prototypes included proposed models for engagement and consultations, visual design for accessibility, planning and reporting with accessibility considerations, and performance measurement for accessibility.
In addition, the department:
- funded projects aimed at informing and engaging the disability community, Indigenous governments and organizations, and regulated entities on the application and implementation of the act
- supported projects through the Social Development Partnerships Program – Disability component to support disability-related organizations during National AccessAbility Week (NAAW) 2020. These supports contribute to raising awareness of the importance of accessibility and inclusion in different sectors, communities and at the national level. As part of NAAW 2020, the department posted a video to highlight the work of sign language interpreters during the pandemic
- provided support for the establishment of Accessibility Standards Canada. This support included coordinating the appointments of all members of the Board of Directors. It also included providing legislative interpretation and advice. As a result, the organization is now a fully operational, independent corporation, within the department’s portfolio
- collaborated with provinces and territories, through the Open Forum on Accessibility, on an environmental scan of federal, provincial and territorial service animal requirements. The goal was to better understand what is needed to provide a consistent travel experience for persons with disabilities throughout Canada
- funded 3 national Indigenous organizations so they can consult their member communities on how to advance accessibility on reserve. This will ensure that the implementation of the Accessible Canada Act is based on diverse Indigenous voices. It will also ensure that this implementation meets the needs of Indigenous Canadians living on reserve
To measure progress on accessibility, the department worked with Statistics Canada to develop an Accessibility Data Hub. The hub is hosted on the Statistics Canada website. It gathers constantly updated federal data related to accessibility. This data is available to all Canadians including persons with a disability, the organizations that advocate on their behalf, Indigenous persons and academia. The 2 organizations also collaborated to launch the Survey on Accessibility in Federal Sector Organisations.
The department shared the report on Accessibility of Electronic Payment Terminals with provincial and territorial partners. It also engaged them to explore options for collaboration and to encourage action to enhance accessibility in areas under their jurisdictions. The department also shared the report with stakeholders and published a summary to raise awareness and encourage collaboration across the stakeholder community. The report identifies barriers associated with electronic payment terminals and outlines options and considerations for improving their accessibility.
Enabling Accessibility Fund
Under the Enabling Accessibility Fund, the department funded 383 projects (272 under the Small projects stream and 111 under the Youth Innovation stream). A change to the program allowed the department to fund up to 100 per cent of project costs, for a maximum of $100,000 per project. In past years, applicants had to obtain some of their funds from other sources. Because of the removal of the leveraging requirement, the department provided more funding for each project. As a result, it was only able to fund 383 projects, instead of the 430 projects originally targeted for in fiscal year 2020 to 2021.
The Youth Innovation component of the Enabling Accessibility Fund received a record number of 238 applications and was able to fund 111 youth-led projects. These projects fulfill 2 objectives. They provide greater access for persons with disabilities to community spaces and workplaces. They also allow youth to play a leadership role by having a direct impact in the lives of persons with disabilities.
Homelessness in Canada is prevented and reduced
Pandemic-related measures
In response to the COVID-19 pandemic, the department distributed over $400 million in supplementary funding to Reaching Home funding recipients. This allowed the homeless-serving sector to protect and support those experiencing or at risk of homelessness. This included preventing COVID-19 transmission in shelters and other forms of accommodation by:
- reducing overcrowding in shelters and other congregate living settings. This included enabling physical distancing, enhancing cleaning and putting other emergency health and safety measures in place
- establishing isolation spaces
- securing housing and other forms of accommodation
- focusing on homelessness prevention initiatives. This included short-term financial assistance to cover rent arrears grocery cards, landlord-tenant mediation, problem solving with neighbours and helping with budgeting
In November 2020, the government announced an additional $299.4 million for fiscal year 2020 to 2021 through the Fall Economic Statement. The goal of this investment was to further help homeless-serving organizations reduce the impact of COVID-19 for those experiencing homelessness in their communities. It also aimed at preventing at-risk Canadians from becoming homeless by supporting targeted interventions. Such interventions enable people to stay housed and creates more permanent housing solutions.
Planned commitments and other achievements
Reducing homelessness in Canada
The department expanded Reaching Home to 6 new designated communities, 3 in British Columbia and 3 in Ontario. In fiscal year 2020 to 2021, the program provided $581 million, in total, to:
- 64 communities (urban centres)
- various rural and remote areas across Canada
- the 3 territorial capitals: Iqaluit, Yellowknife and Whitehorse
- 30 Indigenous communities (mostly urban areas)
Reaching Home also provided $9 million through the Community Capacity and Innovation stream to 81 communities. This included funding to support the national delivery of training and technical assistance for communities. It also included funding them directly to:
- design and implement local coordinated access systems that streamline access to services for people with housing challenges
- foster innovation in the homelessness sector
Reaching Home continued to work closely with organizations to reduce Indigenous homelessness at the community level. The program provided funding to ensure that the unique needs of First Nations, Inuit and Métis Nation were met.
Poverty in Canada is reduced
The department provided policy, administrative and logistical support to the National Advisory Council on Poverty. This support enabled the council to deliver on its mandate to provide advice on poverty reduction in Canada through their first report. Building Understanding: The First Report of the National Advisory Council on Poverty was tabled in Parliament on February 23, 2021.
The department also supported the council in continuing a dialogue with Canadians on poverty. This support helped the council to undertake 15 national and 8 regional engagement sessions. These sessions gathered together over 600 stakeholders, academics, experts, provinces and territories and persons with lived expertise on poverty and its many dimensions. What was heard during these engagement sessions will help to form the council’s second annual report.
The department worked with Statistics Canada to review Canada’s Official Poverty Line, based on the Market Basket Measure (MBM). Such reviews are mandatory under the Poverty Reduction Act. They ensure that the poverty line reflects an up-to-date basket of goods and services that represent a modest, basic standard of living in Canada. Periodic reviews of the MBM help better track poverty in Canada over time.
The department worked with Statistics Canada and territorial governments to expand the Canadian Income Survey to Canadians in the territories. This expansion will provide valuable statistics on the income of persons living in the 3 territories and will improve the measurement of poverty in Canada’s North. The department has also been co-developing indicators of poverty and well-being, from First Nations, Inuit, and Métis Nation perspectives, with National Indigenous organizations. These indicators will reflect the multiple dimensions of poverty and well-being experienced by Indigenous peoples.
Not for profit organizations, communities and other groups have an enhanced capacity to address a range of social issues such as the social inclusion of people with disabilities, the engagement of seniors and support for children and families
Pandemic-related measures
The department implemented the Emergency Community Support Fund which provided $350 million to local community organizations who support marginalized and underrepresented populations. Over 11,500 projects received funding in diverse communities across the country.
The New Horizons for Seniors Program reduced the impacts of the COVID-19 pandemic on seniors by:
- allowing organizations to use approved funding to address pandemic-related issues instead of for original objectives
- collaborating with United Way/Centraide Canada to deliver $9 million to more than 900 community organizations
- distributing an additional $20 million to more than 1,000 projects. These community-based projects aimed to reduce isolation, improve seniors’ quality of life, and help seniors maintain social support networks
The department provided additional funding to national disability organizations to support communication and engagement activities in response to the pandemic. In total, 27 organizations accessed these additional funds ($927,000 in total).
Planned commitments and other achievements
Supporting seniors
The department funded over 2,600 projects across Canada under the Community-Based stream of the New Horizons for Seniors Program (NHSP). These projects helped seniors benefit from, and contribute to, the quality of life in their communities through active living and social activities. Funded organizations reported an increase in their capacity to:
- provide activities to seniors
- recruit volunteers
- develop partnerships
- improve facilities that support seniors’ initiatives in their communities
Through the pan-Canadian stream of the NHSP, the department funded 24 projects:
- 22 projects brought together different community organizations to meet seniors’ growing social needs
- 1 national project funded a knowledge hub
- 1 project funded other projects aimed at LGBTQ2+ seniors in 3 Canadian cities
In total, an estimated 661,500 seniors benefitted from the NHSP in fiscal year 2020 to 2021.
Enhanced capacity to address social issues
The department funded over 680 social purpose organizations (SPOs) through the Investment Readiness Program. Program funding helps social purpose organizations build the skills they need to seek loans or other forms of financing to grow their social impact. This way, they can help solve social and environmental challenges. Funded organizations are addressing pressing issues such as:
- including marginalized Canadians in the workforce (32% of funded SPOs) for example through supportive employment opportunities
- supporting Indigenous people (27% of funded SPOs), for example by developing an Indigenous culinary arts program and catering business
- including people with disabilities (22% of funded SPOs), for example by creating an organization to train and educate businesses on meeting their obligation under the Accessible Canada Act
- supporting children and youth (18% of funded SPOs), for example by expanding an organization that offers French-language childcare to francophones in official language minority communities
- other pressing social and environmental issues (11% of funded SPOs)
ESDC is moving forward with the implementation of the Social Finance Fund, designed to support the growth of Canada’s social finance market. A Call for Expression of Interest (EOI) to become a social finance wholesaler for the Social Finance Fund was launched this fiscal year, distributing up to $220 million of the fund in the next two fiscal years.
A Social Innovation Advisory Council will also be established. The council will provide strategic advice and expertise to the Government of Canada. This will support the implementation of the Social Innovation and Social Finance Strategy and the growth of social purpose organizations.
Supporting children and families
The Children and Families component of the Social Development Partnerships Program benefitted 421,597 marginalized and underrepresented Canadians, including children, youth and adults. As well, every dollar received from the program allowed community organizations to raise an additional $2.65 from other partners.
Supporting Black communities
Under the “Capital Projects” stream of the Supporting Black Communities Initiative, the department led a $3 million call for proposals. The call was open to Black-led, not-for-profit organizations seeking to improve their workplaces and community spaces. These organizations had an opportunity to obtain up to $100,000 per project to fund capital projects.
The department also established an intermediary network with 3 high-capacity organizations. This intermediary network supports the ‘For Us By Us’ philosophy, as communicated by stakeholders in Black communities. The department is empowering representative organizations to determine funding distribution, based on their grassroots knowledge of community needs.
The intermediaries held a separate call for proposals to distribute funding to grassroots Black-led organizations. This funding will allow these organizations to enhance their capacity in the areas of improved governance, financial management and diversification of funding sources. This greater capacity will support them in delivering services and supports to Black communities.
Supporting persons with disabilities
In fiscal year 2020 to 2021, there were 87 projects underway through the Social Development Partnership Program – Disability component.
This was the second year of 3-year funding agreements with 28 national disability organizations. Under these agreements, the department provided a total of $5.8 million to increase the social inclusion of persons with disabilities.
Additionally, 12 regional affiliate organizations of Inclusion Canada received a combined $1.5 million. This funding allowed them to support the social inclusion of persons with intellectual disabilities.
The department also funded projects that:
- developed tools and resources in priority areas of the Accessible Canada Act. These are areas like accessible service, design and delivery, and communication
- promoted accessibility and inclusion in communities and workplaces across Canada during National AccessAbility Week
- engaged the disability community on how the United Nations Convention on the Rights of Persons with Disabilities is implemented
- supported the production of alternate format materials for persons who are unable to read conventional print
- funded LIFT Philanthropy Partners to increase the capacity of 8 disability organizations that work on social inclusion and improving employment outcomes for persons with disabilities
- helped make disability organizations stronger by giving youth a chance to be leaders
- engaged national Indigenous organizations on key issues about barriers faced by Indigenous persons with disabilities
- found new ways to improve the financial security of persons with disabilities
Supporting sustainable development
The department led the development of Moving Forward Together – Canada’s 2030 Agenda National Strategy. Launched in February 2021, the strategy aims to create an environment enabling all segments of society to participate in advancing the sustainable development goals. The strategy will help build a Canada that is peaceful, prosperous, and sustainable, where no one is left behind.
Through the Sustainable Development Goals Funding Program, the department provided 46 grants and 12 contributions to organizations to support them in advancing the sustainable development goals. These organizations include not-for-profits, provinces and territories, municipalities, academia, the private sector, and organizations that work with Indigenous and racialized communities.
The department also funded 3 national Indigenous organizations: the Assembly of First Nations, Inuit Tapiriit Kanatami, and the Métis National Council. The goal was to raise awareness of the sustainable development goals among First Nations, Métis Nation and Inuit and the integration of indigenous perspectives into Canada’s implementation of the 2030 Agenda.
Clients receive high quality, timely and efficient services that meet their needs
In fiscal year 2020 to 2021, the department brought changes to the Enabling Accessibility Fund and simplified the application process. This, combined with pandemic-related flexibilities, allowed organizations to get funding for projects in an average of 12 weeks. In comparison, the average processing time was 32 weeks in previous years.
Gender-based analysis plus
The department makes great efforts to increase inclusion and opportunities for Canadians to participate in their communities. These efforts align with the pillars of the Gender Results Framework. They align more specifically with the Economic Participation and Prosperity pillar, and the Poverty Reduction, Health and Well-Being one. These pillars aim to promote equal and full participation in the economy. They also support the reduction of poverty and better health outcomes for diverse groups of women, men and non-binary people.
Here are a few examples of how the department supports the Poverty Reduction, Health and Well-Being pillar.
The homeless population includes a variety of at-risk populations and includes a number of at-risk groups. Given this context, Reaching Home provides flexibility to communities to design and deliver systems that reflect local needs and priorities.
Communities are expected to work toward 5 core Reaching Home outcomes. Progress with reaching homelessness reduction targets for each outcome is documented and shared through annual Community Homelessness Reports, which began this year. These data will allow for a fuller understanding of results achieved at the community level.
Many projects under the New Horizons for Seniors Program focus on reaching the most marginalized and underrepresented senior populations. Funding recipients targeted socially isolated seniors. Almost 33% targeted visible minority seniors. Funded recipients also targeted other marginalized and underrepresented seniors including immigrant seniors (26%) and ethno-cultural seniors (26%). Overall, these projects benefited more senior women (56%) than senior men. Senior women represented (63%) of the seniors who volunteered in the implementation of these projects. Some (68%) of seniors who volunteered as mentors to other seniors and youth, were female seniors.
Here are a few examples that support both pillars.
The lack of affordable and accessible early learning and child care services is a major barrier for full economic gender equality. Child care availability and cost strongly impact mothers’ decisions to enter or remain in the labour market or school. This is especially true for racialized women, single mothers, and mothers of pre-school age children. Helping families to access child care will allow them to build a better future. Many parents, particularly women, will be able to enter or return to the labour market. They might also further their education or open a new business. All this will contribute to their well-being and to Canada’s economy.
The Investment Readiness Program supported the inclusion of women and other diversity groups. Through the Social Innovation and Social Finance strategy, the program:
- built awareness of social innovation and social finance amongst social purpose organizations (SPOs) that are led by, or that support, women and other diversity groups
- increased investment readiness of social purpose organizations that are led by, or serve, women and other diversity groups
In total, 24 recipients delivered the Investment Readiness Program (IRP) through grant and contribution agreements. Of those recipients, 8 had projects that supported access to the program for social purpose organizations serving women and other diversity groups. This ensured that these populations had access to, and were able to receive support from, the program.
IRP recipients re-granted funds to 680 social purpose organizations to support them in building their investment readiness. An increased investment readiness allowed women-led and women-focused SPOs to develop new skills from the program. This will help them in obtaining the financing needed to develop and scale innovative solutions. With this financing, they will be able tackle the pressing challenges facing communities across Canada. Of the 680 social purpose organizations that received grants from the program through the IRP:
- 180 (26.5%) supported women and girls
- 338 (49.7%) supported at least one diversity group (Indigenous people, racialized people, people with disabilities, LGBTQ2+)
- 517 (76%) built their capacity to access social finance to serve women and other diversity groups
The Children and Families component of the Social Development Partnerships Program funded projects that benefitted more than 422,597 marginalized and underrepresented Canadians. This included women, persons with disabilities, Indigenous people, new immigrants, ethno-cultural communities, LGBTQ2+ community and official language minority communities. Funded organizations increased their capacity to recruit volunteers, engaged marginalized and underrepresented Canadians in consultations, and provided more services to these groups. They also increased their knowledge and awareness of the needs of marginalized and underrepresented Canadians.
Experimentation
The Accessible Canada Act requires regulated parties to develop accessibility plans to identify, remove and prevent barriers to accessibility. The department worked with Statistics Canada to explore the use of artificial intelligence to rapidly scan accessibility plans that will be developed. The scan spots indicators that measure progress in advancing accessibility through the removal of barriers to accessibility. Limitations around the algorithms were encountered during initial testing and are being addressed to increase its effectiveness at gathering relevant data. Using technology to efficiently mine large data sources for specific information can be applied to a range of research, policy, program and compliance activities.
Feedback from organizations and persons with disabilities applying to the Enabling Accessibility Fund indicated that:
- the process was complex for small organizations (requirement of multiple quotes, budget template)
- decisions were not timely
- the results produced resulted in some projects addressing accessibility issues better than others
In response, the department introduced a flat rate model to calculate costs of commonly funded small projects. This reduced the administrative burden on clients by requiring less information to apply for funding. It also facilitated the department’s assessment of projects. Project officers had less information to review and could make consistent decisions for eligible project activities and project funding amounts. These changes resulted in 58% of organizations submitting a complete application compared to 10% in the past. Lessons learned from this initiative will inform the next phase of the flat rate model under the program.
2030 Agenda for Sustainable Development
In fiscal year 2020 to 2021, Reaching Home contributed to the following United Nations’ Sustainable Development Goals (SDGs):
- No Poverty (SDG 1) - Supports the most marginalized and underrepresented Canadians in maintaining safe, stable and affordable housing. It also aims to reducing chronic homelessness nationally by 50% by 2027 to 2028
- Gender Equality (SDG 5) - It helps communities meet the needs of at-risk populations, including seniors, youth, women, gender diverse individuals, people fleeing violence, families, Indigenous peoples, LGBTQ2+ individuals, veterans, racialized Canadians and newcomers to Canada
- Reduced Inequalities (SDG 10) - Helped 30 communities and 7 regions to respond to the needs of Indigenous people who are at risk of, or are, experiencing homelessness. In addition, it introduced a distinctions-based funding stream to ensure the unique needs of First Nations, Métis Nation, and Inuit are met
- Sustainable Cities and Communities (SDG 11) - Ensured access to adequate, safe and affordable housing, particularly for some of the most at-risk groups. It also aims to reduce chronic homelessness by 31% by March 2024
The Supporting Black Canadian Communities Initiative contributes to the following SDG:
- Reduced Inequalities (SDG 10) – The capital assistance provided is intended to support capacity building in community organizations. This will help them better achieve their mandate to support Black communities
The New Horizons for Seniors Program contributes to the following SDG:
- Good Health and Well-Being (SDG 3) - It increases the social participation and inclusion of seniors in their communities. Increased social inclusion is directly linked to improved mental health. Some 72% of funded recipients reported that the NHSP funding enabled them to increase the social participation and inclusion of seniors in their communities
The Investment Readiness Program supports social purpose organizations that contribute in various ways to the following SDGs:
- No Poverty (SDG 1)
- Good Health and Well-Being (SDG 3)
- Decent Work and Economic Growth (SDG 8)
- Reduced Inequalities (SDG 10)
- Sustainable Cities and Communities (SDG 11)
The Accessible Canada Act requires parties that are subject to the act to identify, remove and prevent barriers to accessibility in 7 priority areas. Priority areas include transportation, the built environment, employment, communication, information and communications technology, procurement, and programs and services. It will be easier for persons with disabilities to secure and retain employment, access government programs and services, receive information, access public buildings and transportation, etc. As such, the act contributes to the following SDGs:
- No Poverty (SDG 1)
- Zero Hunger (SDG 2)
- Good Health and Well-Being (SDG 3)
- Decent Work and Economic Growth (SDG 8)
- Industry, Innovation and Infrastructure (SDG 9)
The Enabling Accessibility Fund (EAF) contributes to the following SDGs:
- Good Health and Well-Being (SDG 3) - Past EAF-funded projects have included multisensory rooms which support people with cognitive and/or mental health disabilities. These rooms have grown in popularity over the past 3 years and support the provision of mental health services in community spaces
- Decent Work and Economic Growth (SDG 8) - By improving accessibility in workplaces and community spaces, the program supports the labour market integration and community involvement of people with disabilities
- Reduced Inequalities (SDG 10) - The EAF program supports the social, economic, and political inclusion of people with disabilities. It does so by removing barriers to community involvement and labour market participation. This allows people with disabilities to participate in social activities within their community, access workplaces, and maintain employment
The Early Learning and Child Care program contributes to the following SDG:
- Quality Education (SDG 4) – More specifically, it contributes to the global target 4.2: “by 2030, ensure that all girls and boys have access to quality early childhood development, care and pre-primary education so that they are ready for primary education”
Results achieved
Departmental result: access to early learning and child care is increased
Performance indicator: number of children in regulated child care spaces and/or early learning programs and number of children receiving subsidies or other financial supports
Target: 40,000
Date to achieve target: March 2020
2018 to 2019 actual results: 40,116 (combined total for both indicators for both fiscal years: 2017 to 2018 and 2018 to 2019)
2019 to 2020 actual results: not available (See note 1 below)
2020 to 2021 actual results: not available (See note 1 below)
Departmental result: barriers to accessibility for people with disabilities are removed
Performance indicator: number of community spaces and workplaces that are more accessible due to Enabling Accessibility Fund funding
Target: 430
Date to achieve target: March 2021
2018 to 2019 actual results: 473
2019 to 2020 actual results: 376
2020 to 2021 actual results: 386 (See note 2 below)
Departmental result: homelessness in Canada is prevented and reduced
Performance indicator: reduction in the estimated number of shelter users who are chronically homeless
Target: 31% reduction from the 2016 baseline estimated at 26,900 shelter users
Date to achieve target: March 2024
2018 to 2019 actual results: not available (See note 3 below)
2019 to 2020 actual results: not available (See note 3 below)
2020 to 2021 actual results: not available (See note 3 below)
Departmental result: not for profit organizations, communities and other groups have an enhanced capacity to address a range of social issues such as the social inclusion of people with disabilities, the engagement of seniors and support for children and families
Performance indicator: for every dollar invested through the Social Development Partnerships Program, amount leveraged/invested by non-federal partners (See note 4 below)
Target: $0.30
Date to achieve target: March 2021
2018 to 2019 actual results: Social Development Partnerships Program - Children and Families: $0.94; Social Development Partnerships Program – Disabilities: $0.32
2019 to 2020 actual results: Social Development Partnerships Program - Children and Families: $0.78; Social Development Partnerships Program – Disabilities: $0.39
2020 to 2021 actual results: Social Development Partnerships Program - Children and Families: $2.65 (See note 5 below); Social Development Partnerships Program – Disabilities: $0.36
Departmental result: clients receive high quality, timely and efficient services that meet their needs
Performance indicator: service standard target for Social Development program priority service, as defined by the Government of Canada’s Policy on Service, was met [Note: service standards can be consulted on Canada.ca.]
Target: 1 out of 1
Date to achieve target: March 2021
2018 to 2019 actual results: 1 out of 1
2019 to 2020 actual results: 100% (See note 6 below)
2020 to 2021 actual results: 1 out of 1
Notes
- results for fiscal years 2019 to 2020 and 2020 to 2021 are not available yet. Compilation of results across the country are based on annual reports provided by provinces and territories in the fall of the following fiscal year. Due to the pandemic, delays have been encountered in the preparation of these reports
- the program funded fewer projects than projected, in part due to the removal of leveraging under the 2020 Small projects component call for proposals (CFP). Prior to the 2020 Small CFP, the leveraging requirement required successful applicants to fund 35% of their project through non-EAF funds. With the removal of funding provided by applicants, the EAF program funded fewer projects. Despite this, the department still achieved 89% of its target
- this indicator is based on the calendar year. There is a 3-year lag in the availability of data
- organizations are encouraged to use the Social Development Partnership Program funding to leverage cash and in-kind investments from other non-federal organizations. This allows the pool of investment brought to bear on any given issue to be increased. Note that for the Disability component, it is no longer mandatory to leverage the Social Development Partnership Program funding. Increased partnerships, through cash and/or in-kind contributions, increases the impact of program funding. It expands the capacity of recipients to build and further their knowledge, understanding and capacity to address complex social issues
- this result is based on partial data.
- this indicator’s target was converted to a percentage for fiscal year 2019 to 2020. The target being expressed as a percentage (instead of as a number) is consistent with applicable service standards. As the target (for fiscal year 2019 to 2020) is expressed as a percentage, the actual result (for the aforementioned fiscal year) is also expressed as a percentage. Result originally indicated in Departmental Results Report for 2019 to 2020 was 94%, but upon further review, the GC Infobase shows a 100% result for the Parents of Young Victims of Crime grant. The result has therefore been modified so that both sources match
| Spending category | 2020 to 2021 Main Estimates | 2020 to 2021 Planned spending* | 2020 to 2021 Total authorities available for use | 2020 to 2021 Actual spending (authorities used) | 2020 to 2021 Difference (Actual spending minus Planned spending) |
|---|---|---|---|---|---|
| Gross Spending | 953,560,319 | 953,560,319 | 2,607,464,463 | 2,572,173,843 | 1,618,613,524 |
| Spending in Specified Purpose Accounts | 0 | 0 | 0 | 0 | 0 |
| Revenues netted against expenditures | 0 | 0 | 0 | 0 | 0 |
| Net Spending** | 953,560,319 | 953,560,319 | 2,607,464,463 | 2,572,173,843 | 1,618,613,524 |
Explanation of variances: the main variance between planned and actual spending is due to additional funding received through the Public Health Events of National Concern Payments Act (PHENCPA). The variance is due to in-year funding, for both new and existing programs that was not included in planned spending. This led to actual spending being higher than initially planned.
Notes
* “Planned spending” may differ from Main Estimates as they include the amounts to be spent for the Specified Purpose Accounts (such as Employment Insurance and Canada Pension Plan accounts). These amounts include benefits paid to clients and amounts associated with the payment of these benefits.
** “Net Spending” excludes amounts spent under Specified purpose accounts.
Refer to the department's Financial Framework section for a complete description of the departmental financial profile, including explanation of gross actual and planned spending.
Human resources (full-time equivalents)
2020 to 2021 planned full-time equivalents: 559
2020 to 2021 actual full-time equivalents: 538
2020 to 2021 difference (actual full-time equivalents minus planned full-time equivalents): (21)
Explanation of variances: no significant variance.
Financial, human resources and performance information for Employment and Social Development Canada’s Program Inventory is available in GC InfoBase.
Pensions and benefits
Description: assist Canadians in maintaining income for retirement, and provide financial benefits to survivors, people with disabilities and their families.
Results
Seniors have income support for retirement
Pandemic-related measures
The department implemented the One-Time Payment to Seniors to help them deal with additional costs resulting from the pandemic. This one-time tax-free payment provided $300 to seniors eligible for the Old Age Security (OAS) pension. Seniors eligible for the Guaranteed Income Supplement (GIS) received an additional tax-free payment of $200. This measure provided a total of $500 to low-income seniors who received both the OAS pension and the GIS. Allowance recipients also received $500. This payment was issued during the week of July 6, 2020.
The department introduced several interim measures to public pensions programs. This made it easier for program recipients to access their benefits. For example the department:
- reduced the number of documents required when applying for benefits
- adjusted the annual reassessment of income-tested benefits in response to the extension of the tax-filing deadline. This allowed low-income seniors to continue to receive their benefits, pending the processing of their tax return
- eliminated the need for an in-person Commissioner for Oaths signature
These changes aimed to ensure that individuals would not experience payment disruptions as a result of missing documentation or information. The department is now assessing which of these adjustments could be adopted on a permanent basis to modernize program delivery.
Planned commitments and other achievements
Old Age Security
In fiscal year 2020 to 2021, the OAS program provided the OAS pension to 6.7 million seniors. It provided the GIS to 2.2 million low-income pensioners, and the Allowances to 80,200 low-income 60 to 64 year-old individuals.
The department has been automatically enrolling individuals in the OAS program since 2013, and in the GIS program since 2017. In fiscal year 2020 to 2021, 3 million individuals had their GIS eligibility reassessed automatically. These individuals continued to receive their benefits without any interruption. The department implemented a temporary measure to maintain GIS benefits for up to an additional 6 months, if income information was unavailable. As of March 2021, around 50% of new pensioners are being enrolled automatically.
Guaranteed Income Supplement earnings exemption
The department enhanced the GIS earnings exemption, which came into effect in July 2020. This enhancement increased the amount of the full exemption from $3,500 to $5,000 of annual earnings. The measure also extended the exemption to self-employment income, and introduced a 50% exemption on the next $10,000 of earnings. As a result, low-income seniors who work are now able to earn more before their GIS benefit is reduced. Therefore, this exemption reduced disincentives to work for low-income seniors.
Proactive enrollment to the Canada Pension Plan
Since April 2020, the department started proactively enrolling eligible individuals aged 70 or older to the Canada Pension Plan (CPP) retirement pension. This decision was made to ensure that individuals do not miss out on the benefits they are entitled to receive. There is no added financial benefit to further deferring the start of their retirement pension after the age of 70. As a result of this measure, nearly 50,000 seniors began receiving the CPP retirement pension to which they are entitled to during fiscal year 2020 to 2021. Approximately $185 million (comprised of retroactive payments as well as ongoing monthly payments) was paid to these individuals. These individuals are now receiving an average of $260 each month from the CPP retirement pension.
People with disabilities and their families have financial support
Pandemic-related measures
COVID-19 had a disproportionate impact on persons with disabilities, who incurred extraordinary expenses during the pandemic. To reduce this impact, the department distributed the government’s One-Time Payment for Persons with Disabilities. This was a one-time, non-taxable payment of up to $600. The majority of eligible Canadians with disabilities received the payment in fiscal year 2020 to 2021. In total, more than 1.74 million Canadians with disabilities have received the emergency support.
Planned commitments and other achievements
Canada Pension Plan Disability
The department continued the Medical Adjudication Quality Assurance Program, which provides analysis and information about the decision process to grant or deny benefits. The results from this program will help inform and enhance policies, procedures and training. It will also provide feedback to individual medical adjudicators on their strengths and areas for improvement.
The department continued to engage with non-profit disability organizations and public programs in other jurisdictions on ways to improve the program. Among the stakeholders consulted were provinces, territories and the International Social Security Association. The department also pursued consultations through the Canada Pension Plan Disability Client and Stakeholder Roundtable.
Canada Disability Savings Program
The Canada Disability Savings Program helps eligible persons with disabilities and their families save for the future. Under this program, the government pays matching grants, as well as bonds, into the Registered Disability Savings Plan (RDSP) of disabled beneficiaries. As of the end of March 2021, a total of 219,524 RDSPs were opened. Over time, the government has paid $3.15 billion in grants and $1.41 billion in bonds in these RDSPs.
RDSP take-up has been steadily increasing since the implementation of the program. However, this increase slowed down in fiscal year 2020 to 2021 (compared to fiscal year 2019 to 2020). This could be attributed, in part, to pandemic restrictions, which limited the program’s ability to conduct in-person outreach activities. The total value of RDSP assets is now $7.41 billion.
Clients receive high quality, timely and efficient services that meet their needs
The department took measures to improve service delivery. This included increasing access to online applications, and developing new letters for contributors to encourage them to apply online.
The department also completed a pilot that looked at ways to reduce the time to finalize an appeal on a decision. This work used various data and analysis to identify more complex appeal files. The findings will help to improve departmental approaches to addressing appeal files, therefore providing better service to Canadians.
The pandemic presented an opportunity for the Canada Disability Savings Program to rethink its mail-out strategy. Originally, this strategy targeted a small number of jurisdictions where program take-up was low. However, program officials anticipated that the One-Time Payment for Persons with Disabilities would encourage more individuals to apply for the Disability Tax Credit (DTC). That meant that more persons with disabilities would potentially be eligible to open a Registered Disability Savings Plan (RDSP). These persons could then be eligible to receive the grant and the bond. That offered a great opportunity to inform a larger population of potential RDSP beneficiaries about the program. As a result, the program shifted its original mail-out strategy. The revised strategy targeted all DTC-approved Canadians aged 0 to 49 in every province and territory. The mail-out resulted in increased awareness of the Canada Disability Savings Program among the entire population that was eligible to benefit from it. In March 2021, following this mail-out, 4,988 new RDSPs were registered. This was the third highest amount of new RDSPs registered in a month since the inception of the program.
Gender-based analysis plus
The department makes great efforts to provide pensions and benefits to eligible Canadians. These efforts align with the Economic Participation and Prosperity pillar of the Gender Results Framework. This pillar supports the reduction of poverty and better health outcomes for diverse groups of women, men and non-binary people.
Here are a few examples of how the department supports the Poverty Reduction, Health and Well-Being pillar.
The enhancement of the Guaranteed Income Supplement (GIS) earnings exemption allowed 13% of GIS and Allowance beneficiaries to increase their benefit. Among these 13% of GIS and Allowance recipients who reported employment or self-employment income in 2019, the average annual earnings was $9,600. Men reported average annual earnings of $10,500 while women reported $8,700. Slightly more men (53%) than women (47%) benefitted directly from the enhancement to the GIS earnings exemption. However, annual benefit increases were slightly higher for women ($1,624) than for men ($1,570).
The proactive enrollment to the Canada Pension Plan (CPP) retirement pension initiative provided an average of $260 per month of CPP income to seniors enrolled. Many of those seniors had poor labour force attachment during their working years and were experiencing low income. As per the projections of the Office of the Chief Actuary, the majority of these seniors were expected to be women.
The Canada Disability Savings Program (CDSP) aligns with the Poverty Reduction, Health and Well-Being pillar of the Gender Results Framework. It supports the goal of having fewer marginalized and underrepresented individuals living in poverty. Combined with other federal supports and benefits programs, the CDSP improves the financial security of eligible persons with disabilities. This contributes to preventing them from experiencing poverty.
More specifically, the program targets Canadians with severe and prolonged disabilities who are eligible for the Disability Tax Credit (DTC). Eligibility to the DTC is a requirement to open a Registered Disability Savings Plan (RDSP) and receive the grant and the bond. As such, the department continued its outreach activities to promote the opening of RDSPs among eligible people.
Here is the breakdown of RDSP beneficiaries, by gender, amongst DTC-eligible individuals aged 0 to 59 as of December 31, 2020:
- 39.8% of women (83,343)
- 59.2% of men (123,950)
- 1.0% of individuals without defined gender (2,002)
Likewise, here is the breakdown of RDSP beneficiaries, by gender, amongst DTC-eligible individuals aged 0 to 49. These Canadians with severe and prolonged disabilities are within the age range to obtain Canada Disability Savings Grant and Canada Disability Savings Bond payments:
- 38.0% of women (67,258)
- 60.9% of men (107,786)
- 1.1% of individuals without defined gender (1,960)
Experimentation
The department undertook a mailing trial with seniors eligible for the Guaranteed Income Supplement (GIS) who had not yet taken up the benefit. The department updated the letters currently used to:
- remove a burdensome documentation requirement
- modify existing wording
- apply changes to reduce concerns reported by seniors
- apply other changes not based on results from behavioural research
The department then tested the new letters with 66,803 people to compare their efficiency with that of those previously used. Findings suggest that removing certain paperwork requirements led to a significant increase (17%) in the take-up of the GIS. This was especially true for a specific group of applicants (seniors married to a non-Old Age Security (OAS) pensioner). However, some of the other changes led to a decrease (11%) in applications for another group (seniors married to an OAS pensioner). The qualitative work and additional data provided insights on how to further improve the letters, and increase take-up of the GIS.
2030 Agenda for Sustainable Development
In fiscal year 2020 to 2021, the department supported the Sustainable Development Goals (SDGs) by implementing an enhancement to the Guaranteed Income Supplement (GIS) earnings exemption. This contributed to the following SDGs:
- No Poverty (SDG 1) - It allows GIS and Allowance recipients who work to earn more before their benefits are reduced. These people experienced an average annual increase of $1,595 in their benefit due to the enhancement of the GIS earnings exemption
- Gender Equality (SDG 5) - Annual benefit increases were slightly higher for women ($1,624) than for men ($1,570)
- Decent Work and Economic Growth (SDG 8) – Given the enhancement provided an average annual increase of $1,595 in benefits for working GIS and Allowance recipients
The One-Time Payment to Seniors was provided to reduce the impacts of the pandemic on seniors’ finances. This measure contributed to the following SDGs:
- No Poverty (SDG 1) – It financially supported 6.7 million seniors and near-seniors, among whom 2.3 million had a low-income
- Gender Equality (SDG 5) – Since more women than men benefitted from the one-time payment. Among OAS pensioners receiving the one-time payment, 54% (3.6 million) were women and 46% (3.1 million) were men
- Decent Work and Economic Growth (SDG 8) – Given that all OAS pensioners benefitted from this measure, and over half (57%) had incomes of $30,000 or less. The payment amount was even higher for low-income OAS pensioners who are GIS recipients as well as for low-income near-seniors receiving the Allowances
By supporting the long-term financial security of persons with disabilities, the Canada Disability Savings Program (CDSP) supports the well-being of its beneficiaries and facilitates their full participation in the community. The CDSP supports the following SDGs:
- No Poverty (SDG 1) – The provision of a contribution-based matching grant, and a bond targeted towards low- and modest- income beneficiaries (which does not require a personal contribution), ensures long term savings for persons with disabilities, particularly in this income range
- Good Health and Well-Being (SDG 3) - The CDSP encourages long-term savings to enhance the financial security of Canadians with severe and prolonged disabilities. This becomes especially important throughout later life when parents and family may no longer be able to provide support. This financial security can support the beneficiary’s health and well-being, especially past age 59 when monetary withdrawals typically begin
Results achieved
Departmental result: seniors have income support for retirement
Performance indicator 1 of 4: percentage of seniors receiving the Old Age Security Pension in relation to the estimated total number of eligible seniors (See notes 1 and 2 below)
Target: 97%
Date to achieve target: March 2021
2018 to 2019 actual results: 97% (2016)
2019 to 2020 actual results: 97.2% (2017)
2020 to 2021 actual results: 97.1% (2018)
Performance indicator 2 of 4: percentage of seniors receiving the Guaranteed Income Supplement in relation to the estimated total number of eligible seniors (See note 3 below)
Target: 90%
Date to achieve target: March 2021
2018 to 2019 actual results: 91% (2016)
2019 to 2020 actual results: 91.1% (2017)
2020 to 2021 actual results: 91.2% (2018)
Performance indicator 3 of 4: percentage of Canada Pension Plan contributors aged 70+ receiving retirement benefits (See note 4 below)
Target: 99%
Date to achieve target: March 2021
2018 to 2019 actual results: 99% (2016)
2019 to 2020 actual results: 99% (2017)
2020 to 2021 actual results: 99% (2018)
Performance indicator 4 of 4: percentage of seniors living in poverty
Target: not applicable (See note 5 below)
Date to achieve target: not applicable
2018 to 2019 actual results: 6.0% (2017) (See note 6 below)
2019 to 2020 actual results: 5.6% (2018) (See note 6 below)
2020 to 2021 actual results: 5.4% (2019) (See note 6 below)
Departmental result: people with disabilities and their families have financial support
Performance indicator 1 of 3: percentage of Canada Pension Plan contributors who have contributory eligibility for Canada Pension Plan Disability benefits and therefore have access to financial support in the event of a severe and prolonged disability
Target: 66%
Date to achieve target: March 2021
2018 to 2019 actual results: 63% (2017)
2019 to 2020 actual results: 65% (2018)
2020 to 2021 actual results: 65% (2019)
Performance indicator 2 of 3: percentage of Canadians eligible for the Disability Tax Credit who have a Registered Disability Savings Plan to encourage private savings
Target: 37%
Date to achieve target: December 2020
2018 to 2019 actual results: 34% (2018)
2019 to 2020 actual results: 35% (2019)
2020 to 2021 actual results: not available (See note 7 below)
Performance indicator 3 of 3: percentage of Registered Disability Savings Plan beneficiaries that have received a grant and/or a bond to assist them and their families to save for their long-term financial security
Target: 83%
Date to achieve target: December 2020
2018 to 2019 actual results: 83% (2018)
2019 to 2020 actual results: 84% (2019)
2020 to 2021 actual results: 80% (2020)
Departmental result: clients receive high quality, timely and efficient services that meet their needs (See note 8 below)
Performance indicator 1 of 4: number of service standard targets for Pensions and Benefits program priority services, as defined by the Government of Canada’s Policy on Service, that are being met
Target: 10 out of 10
Date to achieve target: March 2023
2018 to 2019 actual results: 5 out of 10 (See note 9 below)
2019 to 2020 actual results: 5 out of 10 (See note 9 below)
2020 to 2021 actual results: 5 out of 10 (See note 9 below)
Performance indicator 2 of 4: percentage of Canada Pension Plan Retirement Benefits paid within the first month of entitlement
Target: 90%
Date to achieve target: March 2021
2018 to 2019 actual results: 96%
2019 to 2020 actual results: 97%
2020 to 2021 actual results: 98%
Performance indicator 3 of 4: percentage of decisions on applications for a Canada Pension Plan disability benefit made within 120 calendar days
Target: 80%
Date to achieve target: March 2021
2018 to 2019 actual results: 63%
2019 to 2020 actual results: 54%
2020 to 2021 actual results: 61% (See note 10 below)
Performance indicator 4 of 4: percentage of Old Age Security basic benefits paid within the first month of entitlement
Target: 90%
Date to achieve target: March 2021
2018 to 2019 actual results: 92%
2019 to 2020 actual results: 91%
2020 to 2021 actual results: 91%
Notes
- there is a 3-year lag in the availability of data
- the target for OAS pension take-up recognizes that not all persons aged 65 years and older apply for OAS benefits when they first become eligible. In 2018, more seniors took advantage of the pension deferral provision, which explains the decrease in the take-up rate from the previous year
- the estimated eligible senior population consists of those persons aged 65 years and older currently in receipt of GIS and those estimated to be entitled to but not currently receiving it. There is a 3-year time lag in the availability of data
- anyone who has made at least one valid contribution to the CPP is eligible to receive a monthly retirement pension. Eligible CPP contributors aged 70+ consists of those currently in receipt of the retirement pension and those entitled to but not currently receiving the retirement benefit (including individuals who may have opted out of benefit receipt). There is a 3-year time lag in data availability
- this indicator is contextual and is used by the department to monitor overall social trends and inform policy development. Specific outcomes are not actively targeted in the areas measured by this indicator. This contextual indicator is based on Canada’s Official Poverty Line, which is established using the Market Basket Measure thresholds. Data is collected by Statistics Canada through the survey data from the annual Canadian Income Survey
- values for previous years were updated to reflect Statistics Canada’s rebasing of the Market Basket Measure to 2018
- this indicator is based on a calendar year. There is a 1-year lag in the availability of data. Data for 2020 will be available by the end of 2021 and will be published in the next report
- service standards are published on Canada.ca
- the department must make strategic choices in the services it delivers to use its available resources optimally. The goal remains to provide the best services possible, and meet services standards. However, the department prioritizes starting payment of benefits to clients as quickly as possible
- in the case of the Canada Pension Plan Disability (CPP-D) benefit, a decision can only be made once all the necessary information has been submitted by clients. Applications are prioritized for processing according to the nature of the application (i.e., those suffering from a terminal illness, those presenting a grave condition) and regular CPP-D benefit applications. Complex cases often require additional time to review and follow-up communication with applicants or their medical practitioner, which influence the application processing time
| Spending category | 2020 to 2021 Main Estimates | 2020 to 2021 Planned spending* | 2020 to 2021 Total authorities available for use | 2020 to 2021 Actual spending (authorities used) | 2020 to 2021 Difference (Actual spending minus Planned spending) |
|---|---|---|---|---|---|
| Gross Spending | 60,951,895,699 | 113,898,809,509 | 113,721,009,863 | 113,654,967,403 | (243,842,106) |
| Spending in Specified Purpose Accounts | 0 | 52,946,913,810 | 51,313,650,426 | 51,313,650,426 | (1,633,263,384) |
| Revenues netted against expenditures | 271,422,277 | 271,422,277 | 373,233,372 | 328,698,504 | 57,276,227 |
| Net Spending** | 60,680,473,422 | 60,680,473,422 | 62,034,126,065 | 62,012,618,473 | 1,332,145,051 |
Explanation of variances: no significant variance.
Notes
* “Planned spending” may differ from Main Estimates as they include the amounts to be spent for the Specified Purpose Accounts (such as Employment Insurance and Canada Pension Plan accounts). These amounts include benefits paid to clients and amounts associated with the payment of these benefits.
** “Net Spending” excludes amounts spent under Specified purpose accounts.
Refer to the department's Financial Framework section for a complete description of the departmental financial profile, including explanation of gross actual and planned spending.
Human resources (full-time equivalents)
2020 to 2021 planned full-time equivalents: 5,530
2020 to 2021 actual full-time equivalents: 6,159
2020 to 2021 difference (actual full-time equivalents minus planned full-time equivalents: 629
Explanation of variances: the increase in full-time equivalents mainly reflects additional staff hired to assess and process Old Age Security Benefits.
Financial, human resources and performance information for Employment and Social Development Canada’s Program Inventory is available in GC InfoBase.
Learning, skills development and employment
Description: help Canadians access post-secondary education and get the skills and training they need to participate in a changing labour market, as well as provide support to those who are temporarily unemployed.
Results
Canadians access education, training, and life-long learning supports to gain the skills and work experience they need
Pandemic-related measures
The department supported the distribution of an additional $1.5 billion to provinces and territories via the bilateral Workforce Development Agreements. This supplementary funding was provided in response to the pandemic to help individuals and employers obtain training and employment supports. This additional investment supported Canadians in underrepresented groups, such as people with disabilities, Indigenous people, women, and members of racialized communities. It also supported those in sectors that have been hardest hit by the pandemic. These sectors included construction, transportation, and hospitality.
The department made temporary changes to Part II of the Employment Insurance Act. These changes allowed more Canadians to access the skills training and development programs they needed during the pandemic.
Moreover, the department provided more flexibility to provinces and territories under the agreements. It allowed them to carry forward unspent funds from 2020 to 2021. Additional flexibilities allowed the provision of wrap-around services such as mental health and mobility supports to eligible individuals participating in more intensive programming. These new flexibilities also covered various costs related to information technology needs to respond to the new challenges brought by the pandemic.
The Future Skills Centre launched initiatives to support workforce recovery including:
- connecting workers and employers with employment training in the tourism and hospitality sector
- funding 36 research projects to examine how sectors need to adapt in response to the challenges and opportunities presented by digital technologies
- launching the “Shock-Proofing the Future of Work” call for proposals. This included selecting projects that provided practical solutions:
- for workers and employers impacted by the pandemic
- to prepare the workforce for the opportunities and jobs of the future
Planned commitments and other achievements
Equipping Canadians with the tools they need to succeed in the changing labour market
The department continued to support individuals and employers by working with provinces and territories to implement the Labour Market Development Agreements (LMDA) and Workforce Development Agreements (WDA). These agreements help Canadians, including those from underrepresented groups, get training, develop their skills and gain work experience. The department transferred approximately $2.5 billion in LMDA funding and $922 million in WDA funding to support individuals and employers across Canada. Each year, over a million Canadians benefit from programming and supports under these agreements.
The Future Skills Council, a component of the Future Skills Program, released Canada – A Learning Nation. This report included recommendations that informed Budget 2021 training announcements. It also informed ongoing efforts across federal departments to advance workforce development to support whole of government priorities.
The Future Skills Centre, another component of the program, is an independent applied research and innovation center. It exceeded its plan to produce findings from 12 research projects. In fiscal year 2020 to 2021, the centre published over 30 research papers and a series of 6 podcasts. These were shared and downloaded approximately 6,000 times to date by job seekers, workers, employers, service providers, and institutional representatives from all levels of government. These products allowed them to adapt and keep up with the pace of change and to meet evolving skills and workforce needs. They also help Canadians to prepare for jobs of the future.
The Office of Literacy and Essential Skills provided funding to 30 organizations who supported the skills development of Canadians. This included Indigenous people, newcomers, persons with disabilities and people from official language minority communities. Project recipients were able to connect work-ready Canadians with potential employers. This allowed employers to fulfill the urgent demand for skilled workers in sectors such as health care, food processing and logistics.
To meet the current and future needs of the labour market, the Office of Literacy and Essential Skills also renewed its approach to skills development. Rebranded as Skills for Success, the new approach replaces the influential Essential Skills Framework, which was created more than 25 years ago. This new skills approach will help Canadians become more resilient and adaptable. It will also help them to meet the changing needs of employers as Canada begins to emerge from the pandemic.
Support apprenticeship training, innovation and access to skilled trades
The closure of most post-secondary institutions and periodic closures of many worksites negatively affected the number of apprenticeship grants issued. These closures impacted apprentice progression in their apprenticeship, which serves as a benchmark for issuing grants. Therefore, the department issued fewer Apprenticeship Incentive Grants and Apprenticeship Completion Grants than forecasted. However, it issued 2,318 Apprenticeship Incentive Grants for Women, exceeding the target set for fiscal year 2020 to 2021.
Through the Skilled Trades and Apprenticeship (Red Seal) Program, the department developed 5 new standards and 15 new examinations with its partners. Many examination centres across Canada were closed for many months and opened with limited services due to the pandemic. This negatively impacted the target to issue 25,000 Red Seal endorsed certifications. There is a one-year lag in the availability of data. Results for fiscal year 2020 to 2021 will be available in April 2022 and reported in the 2021 to 2022 Departmental Results Report.
The Skilled Trades Awareness and Readiness Program had 13 projects in progress, versus a target of 9. These projects continue to encourage Canadians to explore, and prepare for careers in the skilled trades. Results from fiscal year 2019 to 2020 indicate 3,056 project participants. Actual results for fiscal year 2020 to 2021 were not available at the time of publication. The survey used to collect these results was delayed due to the pandemic. As such, these actual results will be reported in the 2021 to 2022 Departmental Results Report.
The Union Training and Innovation Program continued to support union-based apprenticeship training, innovation and enhanced partnerships in the Red Seal trades. The department invested a total of about $63 million for new approved projects. This supported the funding of 54 equipment cost-sharing projects to provide new training equipment and materials. Such equipment leads to higher quality training and a more skilled and productive trades workforce. In addition, the department funded 16 innovation projects starting in fiscal year 2020 to 2021. Results from fiscal year 2019 to 2020 indicate 17,146 project participants. Actual results for fiscal year 2020 to 2021 were not available at the time of publication. The survey used to collect these results was delayed due to the pandemic. As such, these actual results will be reported in the 2021 to 2022 Departmental Results Report.
More students from low- and middle-income families access and participate in post-secondary education
Pandemic-related measures
The pandemic has intensified the need for different kinds of support as more marginalized and underrepresented young people are at-risk of disengaging from school during these unprecedented times. In response, the department provided $15 million to enable organizations to shift to online supports and increase connectivity for students. This included improving access to laptops, tablets and internet services during the pandemic. This funding was disbursed to 7 organizations.
The department also implemented other measures to support students through the pandemic:
- a 6-month pause on interest accrual and payments on all Canada Student Loans and Canada Apprentice Loans. This applied from March 30, 2020 to September 30, 2020
- the Canada Emergency Student Benefit, which provided almost $3 billion in financial support to over 709,000 students and recent graduates. Between May and August 2020, eligible students received $1,250 per month, with an additional $750 if they had dependants or a disability
Planned commitments and other achievements
Canada Education Savings Program
The Canada Education Savings Program (CESP) worked with government and community partners to improve access to the Canada Learning Bond (CLB) by promoting awareness and sharing best practices. This included, partners attending regular CLB Champions’ Network meetings to discuss the pandemic’s impact on outreach activities.
The 2020 Survey of Approaches to Educational Planning collected detailed information on how Canadians prepare for their children’s post-secondary education. Preliminary results were released in fall 2020. They show that 69% of children have savings set aside for their postsecondary studies. RESPs are the most common saving method, with 85% of children with education savings having an RESP. The findings will support research to implement policies and programs that help families plan and save for their children's post-secondary education. It will also help determine Canadians' awareness of existing government programs.
Supports for Student Learning Program
The department provided approximately $11.8 million to Indspire to help support access to post-secondary education for Indigenous students. The organization’s Building Brighter Futures scholarship and bursaries program received most of the funding. Part of the funding also went to supporting research projects and mentorship activities.
The department adapted its approach to implementing the Outbound Student Mobility Pilot (OSMP) due to COVID-19. Using a portion of the OSMP’s Innovation Fund, the department worked with its delivery partners, Colleges and Institutes Canada and Universities Canada. These partners, in turn, supported 107 Canadian post-secondary institutions in undertaking 130 projects. These projects helped post-secondary institutions to test new tools and supports for students. These included virtual mobility experiences, and programs adapted to a COVID-19 environment. Partners also prepared for the full launch of the pilot project when it is safe for students to travel abroad.
Canada Student Financial Assistance Program
The program took various measures to make post-secondary education more accessible and affordable, through the Canada Student Financial Assistance Program (formerly known as the Canada Student Loans Program):
- it removed restrictions for borrowers with permanent disabilities who have used the Repayment Assistance Plan for Borrowers with a Permanent Disability in the past. Previously, borrowers who had been out of study for 5 years were not eligible to receive further loans and grants until outstanding loans were repaid
- this measure made it easier for students with permanent disabilities to access further funding
- it implemented interest- and payment-free leave for a maximum of 18 months for borrowers taking temporary leave from their studies for medical or parental reasons
- it maintained a 3-year pilot project (Skills Boost) providing:
- a top-up grant for students who have been out of high school for at least 10 years
- the flexibility to use current year’s income (instead of the previous year’s) in the needs assessment. This applied when the student experienced a drop in income during the current year
The department supported the Government of Canada announcements of various financial supports for the 2020 to 2021 school year. This included:
- the doubling of Canada Student Grants to up to $6,000 for full-time students and up to $3,600 for part-time students
- the doubling of Canada Student Grants for Students with Permanent Disabilities and Students with Dependants
- the increase of the weekly cap on Canada Student Loans from $210 to $350
- the removal of the expected contribution from students and their spouses in determining the amount of financial aid a student can receive
Canadians participate in an inclusive and efficient labour market
Pandemic-related measures
The Temporary Foreign Worker Program took a number of measures to support temporary foreign workers in response to COVID-19, such as:
- introducing regulations, in April 2020, that compel employers to meet new health and safety requirements
- adapting the Migrant Worker Support Network, piloted in British Columbia, and expanding funding to 3 additional migrant worker support organizations elsewhere in Canada. This allowed the organizations to provide direct assistance to workers affected by the pandemic during the arrival process and throughout their time in Canada
- increasing employer inspections, and improving how tips and allegations of employer non-compliance are addressed
- improving coordination and information sharing with provincial and territorial partners. This ensured responsible authorities were able to respond quickly to emerging issues, including outbreaks affecting temporary foreign workers
As well, the department implemented a series of changes to maintain the program’s efficiency through the pandemic restrictions. This included:
- reprioritizing applications from employers for temporary foreign workers to focus on key economic sectors and essential occupations for fighting the COVID-19 pandemic
- reducing administrative burden on employers by eliminating the need to submit minor amendments and accepting Labour Market Impact Assessments digitally
- strengthening criteria for applications to reflect the evolving labour market situation and ensure Canadians continue to be considered first for jobs. The department also implemented fee refunds for eligible employers who no longer needed temporary foreign workers
- permitting low wage temporary foreign workers to work in Canada for longer periods of time to reduce the amount of international travel. This included a one-month increase to accommodate a quarantine period
On April 19, 2020, Job Bank created and launched the COVID-19 job search page. This dedicated resource supported job seekers who were looking for work and employment supports. The page has had over 2.2 million views. Job Bank also sent targeted emails to Employment Insurance - Canada Emergency Response Benefit applicants. These emails promoted jobs available in specific industries and provincial and territorial resources. The program sent over 1.3 million emails to applicants, with an overall click rate of 16%. Such a response rate exceeds by far the average rate of 2 to 3% response to government emails.
To help youth find quality summer jobs, the department quickly introduced temporary flexibilities under the Canada Summer Jobs program. These changes increased the wage subsidy, offered part-time work-placements, and extended the period of the work placement beyond the summer months. This helped to address the widespread reduction and loss of jobs. In addition, the department and 8 partners of the Youth Skills and Employment Strategy obtained increased funding. This funding supported Canadian youth in high demand and critical sectors such as health, community services and information technology.
The department invested an additional $266 million to provide valuable paid student work placements, increasing its original target from 15,000 to 40,000 placements. This resulted in 44,511 student work placements in fiscal year 2020 to 2021.
The department provided an additional $13.3 million, under the Opportunities Fund for Persons with Disabilities Program. This funding supported safe training and employment for persons with disabilities and helped employers make workplaces accessible and inclusive. The additional funding allowed community organizations to deliver 9 new projects and enhance up to 6 existing projects serving over 2,000 persons with disabilities and 5,500 employers.
The department also provided $23 million to Colleges and Institutes Canada through the Sectoral Initiatives Program. The goal of this investment was to rapidly train Supportive Care Assistants for long-term and home care facilities. The initiative was launched in December 2020 as a pilot project to test a new recruitment and training model for Supportive Care Assistants. This model includes online training, work-integrated learning and a micro-credential. The initiative also aimed to develop a pathway to assist new workers in upgrading their micro-credential to a full certificate. It also explored how to improve consistency across the sector with respect to training programs, work requirements, and core competencies. The goal of this exploration was to create common standards.
Planned commitments and other achievements
Supporting labour market efficiency
The Sectoral Initiatives Program funded 31 projects, which generated 78 up-to-date labour market information reports. These helped key sectors of the Canadian economy identify, forecast and address their human resources and skills issues. As a next step, the department will continue to build on the successes of the Sectoral Initiatives Program and expand its impact. The goal is to support a broader range of sector-focused activities, including training and upskilling for workers and developing solutions to employers’ workforce challenges.
Connecting workers with jobs
Job Bank displayed over 88,000 job vacancies funded by the Canada Summer Jobs program on its website and mobile app. These Canada Summer Jobs postings attracted 1.3 million views. In addition, the department updated the National Occupational Classification to reflect new and emerging job requirements. It will be published in fiscal year 2021 to 2022.
Supporting renewed relationships with Indigenous people
The department pursued its commitment to advancing reconciliation with Indigenous people and supporting efforts to reduce skills and employment gaps between Indigenous and non-Indigenous Canadians. It provided funding to over 110 Indigenous service delivery organizations through the Indigenous Skills and Employment Training Program. These organizations provided flexible skills development and employment training, culturally adapted by distinction for First Nations, Inuit, Métis Nation and urban/unaffiliated Indigenous people. They helped 41,084 Indigenous clients develop the skills needed to fully participate in the economy, including 35,504 new clients. They also helped 14,535 Indigenous people find employment and 5,392 others to return to school.
The department provided funding to 8 national Indigenous organizations through Engagement Protocol Agreements to support engagement, research and policy development. The funding helped to support Indigenous organizations’ engagement on a number of departmental initiatives. This included outreach sessions with Indigenous organizations on the roll-out of new skills and training investments. These investments will support post-pandemic recovery, the closing of gaps between Indigenous and non-Indigenous Canadians, and reconciliation.
The department provided funding to 50 Skills and Partnership Fund projects. These projects support partnerships between Indigenous organizations and industry employers to provide skills training for Indigenous people linked to labour market demand. These projects helped 3,475 new Indigenous clients access training, 1,360 Indigenous people find employment and 281 return to school.
The initial target was to support the employment of at least 8,000 Indigenous people by March 31, 2021. This target was to be met upon completion of multi-year projects, which started in fiscal year 2017 to 2018. However, many agreements were extended to March 31, 2022 due to the challenges many projects faced, including impacts related to the pandemic. It is expected thatemployment results upon completion of all projects in fiscal year 2021 to 2022 will therefore be lower than initially anticipated.
Increasing employment opportunities for youth
The department and its 10 federal partners continued implementing key objectives of the Youth Employment and Skills Strategy. The strategy helps youth, particularly those facing barriers, acquire skills, learning experiences and opportunities to find and maintain employment or return to school. The Youth Employment and Skills Strategy Program, a component of the strategy delivered by Employment and Social Development Canada, served 14,236 youth. This includes final results from the Canada-Québec contribution agreement program “Jeunes en mouvement vers l’emploi”, as well as partial results from funding provided in response to COVID-19.
Under the strategy, the department is solely responsible to deliver the Canada Summer Jobs and the Goal Getters programs. Canada Summer Jobs program provided quality job placements to over 67,700 youth through wage subsidies to employers. Through Goal Getters, the department helped over 5,100 youth complete high school and/or transition to post-secondary education or the labour market. This result includes the number of youth who received support through projects led by the Tamarack Institute, Boys and Girls Club, and Ulnooweg Development Group.
Through the Student Work Placement Program, the department launched an initiative to develop innovative work-integrated learning experiences. In fiscal year 2020 to 2021, the department funded 5 organizations under this initiative. These organizations improved access for all post-secondary students by including new and emerging types of work-integrated learning opportunities. These include:
- shorter duration and/or higher intensity placements
- placements not requiring on-site learning
- facilitating access for students who may otherwise not participate in traditional work integrated learning
Actual results of the innovative work-integrated learning initiative for fiscal year 2020 to 2021 were not available at the time of publication. As such, these results will be reported in the 2021 to 2022 Departmental Results Report.
The Canada Service Corps program built new relationships with organizations through quarterly calls with stakeholders. It also conducted research and analysis to support future innovation and new program design elements. These will help reduce barriers for Indigenous and under-served youth. In fiscal year 2020 to 2021, the Canada Service Corps funded 7,060 service placements and provided 2,205 micro-contributions.
Increasing employment opportunities for persons with disabilities
To increase employment opportunities for persons with disabilities, the Opportunities Fund for Persons with Disabilities Program funded safe training and employment supports to help Canadians with disabilities get and maintain good jobs. This $40 million per year program also provided supports to employers to help create more inclusive and accessible workplaces. The program served a total of 3,670 persons with disabilities, of which 1,350 found a job or returned to school. These results do not include data for the province of Quebec, as it was not available at the time of publishing. The program targets were not achieved due to a number of COVID-19 related factors. These include interruption of services, widespread reduction of jobs, withdrawing of job placement offers, and closure of education institutions.
Helping skilled newcomers find jobs that match their skills
The Foreign Credential Recognition Program continued to help newcomers find jobs that match their skills. Currently, the program is funding 52 projects. These projects aim to simplify foreign credential recognition processes. They also help skilled newcomers get their first Canadian work experience in their profession or field of study. This is done, for example, through mentoring, training, work placements and wage subsidies. Despite disruptions from the pandemic, the program provided support services to 4,700 skilled newcomers. It also supported 504 participants by granting them loans to help cover expenses related to credential recognition.
Supporting official languages minority communities
The Enabling Fund for Official Language Minority Communities provided $14.5 million to a network of 14 community organizations across Canada. These organizations help strengthen the economy of French-speaking communities outside of Quebec and English-speaking communities in Quebec. They supported job seekers to find employment, and entrepreneurs to create or expand their businesses, including in the child care sector. They provided project beneficiaries with knowledge, tools and supports to fully participate in the economy of their community. In fiscal year 2020 to 2021, over 99,000 individuals, businesses and organizations in 170 municipalities across Canada benefitted from the program.
Canadians receive financial support during employment transitions such as job loss, illness, or maternity/ parental leave
Pandemic-related measures
From the onset of the COVID-19 pandemic, the government set out to quickly get the Canada Emergency Response Benefit (CERB) to eligible workers. The CERB was available to wage earners, contract workers, and self-employed individuals who would not otherwise be eligible for Employment Insurance (EI). At the same time, the Employment Insurance Emergency Response Benefit (EI-ERB) was introduced for workers with insurable income. To simplify the process for individuals in urgent need of income support, the two programs (CERB and EI-ERB) were publicly communicated as one under the name CERB. The benefit supported affected workers financially, allowing them to stay home to avoid overwhelming the country’s health care system. Nearly 8.9 million workers received income support and over $71.7 billion in CERB benefits were paid. The CERB was available from March 15, 2020 to October 3, 2020.
In Fall 2020, the Government of Canada transitioned affected workers to a simplified and more accessible EI program. It also introduced 3 temporary recovery benefits for those who are not eligible for EI:
- the Canada Recovery Benefit, accessed by nearly 1.9 million workers for $14.8 billion in benefits paid in fiscal year 2020 to 2021
- the Canada Recovery Sickness Benefit, accessed by approximately 470,000 workers for a total of $414 million in benefits paid in fiscal year 2020 to 2021
- the Canada Recovery Caregiving Benefits, accessed by about 370,000 workers for $2.0 billion in benefits paid in fiscal year 2020 to 2021
The department also introduced temporary measures under the Work-Sharing Program to help employers and workers avoid layoffs. These special measures extended work-sharing agreements duration, expanded eligibility, and streamlined the application process. Almost 4,300 Work-Sharing Agreements were initiated in fiscal year 2020 to 2021, supporting approximately 131,000 workers.
Over 300,000 individuals received training and employment supports funded by the Workforce Development Agreements and Labour Market Development Agreements while they were on the Canada Emergency Response Benefit or the Canada Recovery Benefits.
Due to the pandemic, the department extended the EI pilot project for seasonal workers. Originally set to expire in 2020, the pilot continued until October 30, 2021. The extension will enable the department to collect and analyze more data on the impacts of the measure. This will also give time to the government to consider its approach to a permanent measure
Clients receive high quality, timely and efficient services that meet their needs
Numerous Canadian businesses had to close due to the COVID-19 pandemic. As a result, employers issued an unprecedented number of Records of Employment (ROE). Many of those had free text comments inscribed that required review by an agent. The department automated the review of the comments using artificial intelligence. This increased the speed of EI claims processing by reducing the need for human intervention. Since its implementation in June 2020, the model has addressed over 1.25 million comments, and allowed the automation of 47.9% more ROEs.
As well, the department continued to support employers through a number of client service measures under the Temporary Foreign Worker Program, including:
- addressing Labour Market Impact Assessment backlogs, by implementing an inventory reduction strategy
- improving processing times through increased program funding
- implementing a 2-year Labour Market Impact Assessment pilot to help employers transition agri-food workers to permanent residence
- implementing a forecast model in the Global Talent Stream. This will allow to streamline the application process and improve response time for returning employers. This measure should reduce processing times by 25%
At the same time, the department improved its support to workers through a number of measures, including:
- introducing a live agent support to its pre-existing tip line to assist temporary foreign workers in reporting mistreatment or abuse to the department, offering services in multiple languages
- funding 3 additional migrant support organizations to provide direct assistance to workers affected by the pandemic throughout their time in Canada
- creating a new consulate liaison service to improve how workers related concerns are addressed. This service includes a centralized contact to assist with any additional referrals for resources and coordination of partners to ensure timely response for larger scale and more contentious issues
To support the transition from EI to the Canada Emergency Response Benefit (CERB) and back to EI, the department needed to adapt its communication strategy. This allowed it to convey rapidly changing, and sometimes complicated, information to Canadians. The department used behavioural science, focusing on the user, to help identify the gaps in existing communication plans and materials. This allowed the department to design communications, whose content and formats were tailored to overcome these difficulties. These measures helped Canadians to understand benefit payment schedules, and correctly self-identify which benefit they were eligible for.
Gender-based analysis plus
The department makes great efforts to increase opportunities for Canadians to upgrade their skills, access post-secondary education and prepare for the labour market. These efforts align with the pillars of the Gender Results Framework. They align more specifically with the Education and Skills Development pillar, and the Economic Participation and Prosperity one. These pillars aim to create equal opportunities and diversified paths in education and skills development. They also promote equal and full participation in the economy for diverse groups of women, men and non-binary people.
Here are a few examples of how the department support these 2 pillars.
The department is implementing a 4-year initiative to support skills programs in their capacity to measure, monitor and address gender disparity. The initiative will also help these programs to promote greater access to Canadians underrepresented in the labour market. Among these underrepresented Canadians are women, Indigenous people, persons with disabilities, newcomers, members of visible minorities, and others. The activities undertaken in fiscal year 2020 to 2021 laid the foundational work to inform priorities for subsequent years. It included:
- developing an inventory of existing Gender-Based Analysis plus (GBA plus) data being collected by skills programs to identify and address data and knowledge gaps
- funding environmental scans to synthesize existing research on challenges experienced by underrepresented groups in the labour market
- establishing a GBA plus Community of Practice to build the capacity of employees to apply GBA plus in skills programming. This includes monthly learning activities and access to tools and resources
As a needs-based program, the Canada Student Financial Assistance Program targets low- and middle-income students. To support those students through the pandemic, the department doubled the Canada Student Grants for Students with Permanent Disabilities and Students with Dependants. Doubling grants had positive outcomes, notably for women, youth and low- and middle-income Canadians, persons with disabilities, and students with dependants. Without Canada Student Grant support, all of these groups face significant obstacles to affording post-secondary education. The latest data, for fiscal year 2019 to 2020, indicate that women represented 60% of Canada Student Grant recipients. They also show that 70% of recipients were under 25 years old.
The Supports for Student Learning Program (SSLP) contributes to the inclusion of multiple underserved students who face barriers to participation in post-secondary education. These include Indigenous students, students from low-income households, and students with disabilities. The SSLP relies on 2 initiatives to support these students: Indspire and the Outbound Student Mobility Pilot.
Through Indspire, Indigenous students receive financial and non-financial supports to access post-secondary education and transition to the labour market. The Outbound Student Mobility Pilot reduces barriers to studying and working abroad for marginalized and underrepresented post-secondary students. These are more particularly students with disabilities, students from low-income families, and Indigenous students. These experiences help them develop the skills, intercultural competencies and international networks needed to succeed in the labour market.
Experimentation
Through the Sectoral Initiatives Program, the department completed a small-scale pilot project with Palette, a not for profit training provider. The pilot aimed to test and validate an upskilling model to transition workers in declining sectors to high demand sectors. The project specifically targeted mid-career workers from retail industries. It blended tailored classroom training and work-integrated learning to help them transition into sales and marketing roles in the Information and Communication Technologies sector. The project also developed and implemented ways for both job seekers and employers to recognize and overcome systemic recruitment biases. The project has proven to be successful, with 96% of the participants, primarily retail workers, receiving job offers in technology sales.
With funding from Goal Getters, the Tamarack Institute supported 12 communities across Canada. The institute established 1,510 partnerships and networks at the national level, and 317 working groups, partnerships and networks at the local level. Through these partnerships and networks, a number of innovative approaches have been developed. For example, a collaborative network of youth-serving organizations was created at the national level.
2030 Agenda for Sustainable Development
The Youth Employment and Skills Strategy components delivered by Employment and Social Development Canada contributed to various Sustainable Development Goals (SDGs), such as:
- Gender Equality (SDG 5): by increasing women’s resiliency in the labour market and persistence in post-secondary education. In fiscal year 2020 to 2021, women made up to 62% of youth served in the Canada Summer Jobs program
- Decent Work and Economic Growth (SDG 8): by providing quality work placement, employment training and support to 87,054 youth
- Reduced Inequalities (SDG 10): by contributing to the development and vitality of Official Language Minority Communities. This was achieved through supporting employers and youth to find work in their communities, and by supporting students to pursue and access post-secondary education. In fiscal year 2020 to 2021, 26,661 youth served were members of Official Language Minority Communities or youth from rural areas. Note: This result is for the YESS Canada Summer Jobs program only. No data is available for the ESDC YESS Program
The Canada Service Corps program contributes to:
- Decent Work and Economic Growth (SDG 8): by creating, facilitating and funding opportunities for youth to gain skills that will benefit them in both life and work. For example, the program funds the delivery of micro-grants to youth and community groups. This funding supports them in carrying out short-term projects and making meaningful contributions to their communities. Through such projects, youth can take ownership of an issue, propose a solution and implement it at the local level. Doing so, youth gain valuable skills that are transferable to the labour market
Results achieved
Departmental result: Canadians access education, training, and life-long learning supports to gain the skills and work experience they need
Performance indicator 1 of 6: number of Canadians receiving training and/or employment supports through federally administered programs
Target: not available (See note 1 below)
Date to achieve target: March 2021
2018 to 2019 actual results: federally delivered programs: 148,228
2019 to 2020 actual results: federally delivered programs: 157,591
2020 to 2021 actual results: federally delivered programs: 151,130 (See note 2 below)
Performance indicator 2 of 6: number of Canadians receiving provincially or territorially delivered skills training and/or employment services supported by Government of Canada funding transfers (See note 3 below)
Target: not applicable (See note 4 below)
Date to achieve target: March 2021
2018 to 2019 actual results: provincially and territorially delivered programs: 695,911 (2017 to 2018) (See note 3 below)
2019 to 2020 actual results: provincially and territorially delivered programs: 670,431 (2018 to 2019) (See note 3 below)
2020 to 2021 actual results: provincially and territorially delivered programs: 630,425 (2019 to 2020) (See note 3 below)
Performance indicator 3 of 6: employment or returns to school following training/supports through federally administered programs
Target: not available (See note 1 below)
Date to achieve target: March 2021
2018 to 2019 actual results: federally delivered programs: 117,698
2019 to 2020 actual results: federally delivered programs: 106,980
2020 to 2021 actual results: federally delivered programs: 95,617 (See note 5 below)
Performance indicator 4 of 6: employment or returns to school following provincially or territorially delivered skills training and/or employment services supported by Government of Canada funding transfers (See note 3 below)
Target: not applicable (See note 4 below)
Date to achieve target: March 2021
2018 to 2019 actual results: provincially and territorially delivered programs: 171,335 (2017 to 2018) (See note 3 below)
2019 to 2020 actual results: provincially and territorially delivered programs: 190,717 (2018 to 2019) (See note 3 and 6 below)
2020 to 2021 actual results: provincially and territorially delivered programs: 194,120 (2019 to 2020) (See note 3 below)
Performance indicator 5 of 6: percentage of Canadians aged 18 to 24 that are enrolled in university or college
Target: not applicable (See note 7 below)
Date to achieve target: not applicable
2018 to 2019 actual results: 43.8% (2018)
2019 to 2020 actual results: 43.9% (2019)
2020 to 2021 actual results: 44.6% (2020)
Performance indicator 6 of 6: percentage change in Canadians aged 25 to 64 enrolled in university or college
Target: not applicable (See note 8 below)
Date to achieve target: not applicable
2018 to 2019 actual results: 3% increase (2018)
2019 to 2020 actual results: 5% increase (2019)
2020 to 2021 actual results: 1% decrease (2020)
Departmental result: more students from low- and middle-income families access and participate in post-secondary education
Performance indicator 1 of 3: proportion of low- and middle-income Canadian young adults participating in post-secondary education
Target: 53% (2017) (See note 9 below)
Date to achieve target: March 2021
2018 to 2019 actual results: 52.1% (2015)
2019 to 2020 actual results: 52% (2016)
2020 to 2021 actual results: 50.1% (2017) (See note 10 below)
Performance indicator 2 of 3: percentage of beneficiaries with a Registered Education Savings Plan (RESP) withdrawal that have ever received an additional amount of Canada Education Savings Grant (CESG) and/or Canada Learning Bond, which are available only to children from low- and middle- income families, as compared to the total population of beneficiaries with an RESP withdrawal
Target: 28%
Date to achieve target: December 31, 2020
2018 to 2019 actual results: 25% (2018)
2019 to 2020 actual results: 27% (2019)
2020 to 2021 actual results: 29% (2020)
Performance indicator 3 of 3: percentage of full-time students (all ages) who used federal student financial assistance to help finance their participation in post-secondary education
Target: not applicable (See note 11 below)
Date to achieve target: not applicable
2018 to 2019 actual results: 60%
2019 to 2020 actual results: 59% (all ages)
2020 to 2021 actual results: not available at the time of publishing
Departmental result: Canadians participate in an inclusive and efficient labour market
Performance indicator 1 of 10: employment rate for Canadians among those 15 to 64 years of age
Target: not applicable (See note 12 below)
Date to achieve target: not applicable (See note 12 below)
2018 to 2019 actual results: 74.0%
2019 to 2020 actual results: 74.1%
2020 to 2021 actual results: 69.7%
Performance indicator 2 of 10: employment rate for Indigenous peoples off reserve among those 15 to 64 years of age
Target: not applicable (See note 12 below)
Date to achieve target: not applicable (See note 12 below)
2018 to 2019 actual results: 62.7%
2019 to 2020 actual results: 63.4%
2020 to 2021 actual results: 58.1%
Performance indicator 3 of 10: employment rate for Indigenous people on reserve among those 15 to 64 years of age.
Target: not applicable (See note 12 below)
Date to achieve target: not applicable (See note 12 below)
2018 to 2019 actual results: 38.6% (2016) (See note 13 below)
2019 to 2020 actual results: 38.6% (2016) (See note 13 below)
2020 to 2021 actual results: 38.6% (2016) (See note 13 below)
Performance indicator 4 of 10: employment rate for recent immigrants among those 15 years of age and over
Target: not applicable (See note 12 below)
Date to achieve target: not applicable (See note 12 below)
2018 to 2019 actual results: 60.3%
2019 to 2020 actual results: 70.9%
2020 to 2021 actual results: 64.4% (See note 14 below)
Performance indicator 5 of 10: employment rate for persons with disabilities among those 25 to 64 years of age
Target: not applicable (See note 12 below)
Date to achieve target: not applicable (See note 12 below)
2018 to 2019 actual results: 59.3% (2017) (See note 15 below)
2019 to 2020 actual results: 59.3% (2017) (See note 15 below)
2020 to 2021 actual results: 59.3% (2017) (See note 15 below)
Performance indicator 6 of 10: employment rate for youth among those 15 to 24 years of age
Target: not applicable (See note 12 below)
Date to achieve target: not applicable (See note 12 below)
2018 to 2019 actual results: 56.4%
2019 to 2020 actual results: 56.9%
2020 to 2021 actual results: 48.9%
Performance indicator 7 of 10: employment rate for women
Target: not applicable (See note 12 below)
Date to achieve target: not applicable (See note 12 below)
2018 to 2019 actual results: 71.1%
2019 to 2020 actual results: 72.2%
2020 to 2021 actual results: 66.5%
Performance indicator 8 of 10: employment rate for older Canadians among those 55 years and over
Target: not applicable (See note 12 below)
Date to achieve target: not applicable (See note 12 below)
2018 to 2019 actual results: 35.9%
2019 to 2020 actual results: 36.0%
2020 to 2021 actual results: 33.7%
Performance indicator 9 of 10: employment rate for lone parents among those 15 years of age and over
Target: not applicable (See note 12 below)
Date to achieve target: not applicable (See note 12 below)
2018 to 2019 actual results: 73.3%
2019 to 2020 actual results: 75.3%
2020 to 2021 actual results: 72.7%
Performance indicator 10 of 10: unemployment- to-job vacancies
Target: not applicable (See note 12 below)
Date to achieve target: not applicable (See note 12 below)
2018 to 2019 actual results: 2.1
2019 to 2020 actual results: 1.98
2020 to 2021 actual results: not available (See note 16 below)
Departmental result: Canadians receive financial support during employment transitions such as job loss, illness, or maternity/ parental leave
Performance indicator 1 of 2: percentage of workers losing their job in the previous year that were eligible for Employment Insurance (See note 17 below)
Target: 85.7%
Date to achieve target: March 2021
2018 to 2019 actual results: 84.3% (2017 to 2018) (See note 17 below)
2019 to 2020 actual results: 87.4% (2018 to 2019) (See note 17 below)
2020 to 2021 actual results: 82.4% (2019 to 2020) (See note 17 below)
Performance indicator 2 of 2: percentage of Employment Insurance claimants finding employment before the end of their benefit entitlement (See note 17 below)
Target: 66.7%
Date to achieve target: March 2021
2018 to 2019 actual results: 65.9% (2017 to 2018) (See note 17 below)
2019 to 2020 actual results: 67.7% (2018 to 2019) (See note 17 below)
2020 to 2021 actual results: 67.2% (2019 to 2020) (See note 17 below)
Departmental result: clients receive high quality, timely and efficient services that meet their needs (See note 18 below)
Performance indicator 1 of 4: number of service standard targets for Learning, Skills Development and Employment program priority services, as defined by the Government of Canada’s Policy on Service, that are being met
Target: 21 out of 23
Date to achieve target: March 2021
2018 to 2019 actual results: 16 (See note 19 below)
2019 to 2020 actual results: 13 out of 23 (See note 19 below)
2020 to 2021 actual results: 17 out of 23 (See note 19 below)
Performance indicator 2 of 4: percentage of Employment Insurance benefit payments or non-benefit notifications issued within 28 days of filing
Target: 80%
Date to achieve target: March 2021
2018 to 2019 actual results: 80%
2019 to 2020 actual results: 80%
2020 to 2021 actual results: 88.8%
Performance indicator 3 of 4: percentage of Employment Insurance requests for reconsideration reviewed within 30 days of filing
Target: 80% (See note 20 below)
Date to achieve target: March 2021
2018 to 2019 actual results: 71%
2019 to 2020 actual results: 76%
2020 to 2021 actual results: 88.7%
Performance indicator 4 of 4: percentage of Social Insurance Numbers applied for through the Newborn Registration Service issued within 10 business days
Target: 95%
Date to achieve target: March 2021
2018 to 2019 actual results: 100%
2019 to 2020 actual results: 100%
2020 to 2021 actual results: 99%
Notes:
- the consolidated target was not available at the time of publishing the 2020 to 2021 Departmental Plan. For programs where targets were available, these may be consulted in the 2020 to 2021 Departmental Plan
- the results include participants under the following federally delivered programs: Opportunities Fund for Persons with Disabilities (OF-PwD): 3,670; Youth Employment and Skills Strategy (YESS): total 87,054 (which includes the Youth Employment Skills Strategy Program (YESSP): 14,236, Canada Summer Jobs (CSJ): 67,718, and Goal Getters (GG): 5,100); Indigenous Skills and Employment Training (ISET): 14,535; Skills and Partnership Fund (SPF): 1,360; and Student Work Placement (SWP): 44,511
- results are only for Labour Market Development Agreements and do not include Workforce Development Agreements. As there is a 1-year lag in data availability the results shown reflect the previous years’ result. The actual result for fiscal year 2020 to 2021 will be available in April 2022 and reported in the 2021 to 2022 Departmental Results Report
- provincially and territorially delivered programs set their own annual targets
- results include the number of participants returning to work or to school under the following federally delivered programs: OF-PwD: 1,350; YESS: total 44,083 (which includes YESSP: 5,579, CSJ: 33,404, and GG: 5,100); ISET: 5,392; SPF: 281; and Student Work Placement (SWP): 44,511
- results for fiscal year 2018 to 2019 has been corrected from 177, 335, which mistakenly appeared in the Departmental Plan for fiscal year 2020 to 2021
- this contextual indicator is meant to measure aspects of demand for post-secondary education. It is based on ESDC internal calculations using annualized data from Statistics Canada’s Labour Force Survey (LFS)
- this contextual indicator is meant to capture interest in life-long learning. It is based on ESDC internal calculations to annualize data from Statistics Canada’s Labour Force Survey (LFS)
- there is a 3-year lag in data availability
- the 3% variance between the actual result for 2020 to 2021, which looks at data from 2017, and the associated target, is a result of a change in data source and methodology for this indicator to ensure consistent, ongoing data accessibility
- this contextual indicator measures aspects of the demand for federal student financial assistance. It is based on internal calculations from the Canada Student Loans Program’s Administrative Database and the Canada Student Loans Program’s Actuarial Report
- targets and dates to achieve targets are not set for these contextual indicators as ESDC has limited influence on these results
- this indicator relies on data from the Census to report results. As such, the most recent Census data available is from 2016; results will be updated when the next Census data becomes available
- due to the impact of COVID-19, employment rates for recent immigrants must be interpreted with caution, especially for the most recent year. Similar to previous years, monthly data are not adjusted for seasonality and represent 3-month moving averages. COVID-19 travel restrictions resulted in a record low number of newcomers to Canada. With the population of very recent immigrants (i.e. people who have been in Canada for 5 years or less) initially falling faster than their employment, the employment rate for this group recovered quickly from losses early in the pandemic
- this indicator relies on data from the Canadian Survey on Disability. As such, the most recent Survey available is from 2017; results will be updated when the next Survey data becomes available
- due to COVID-19, Statistics Canada suspended the Job Vacancy and Wages Survey (JVWS) for 3 of the 4 quarters. As such, the actual result cannot be calculated for fiscal year 2020 to 2021 results
- this indicator relies on data from the annual EI Coverage Survey. As such, as there is a 1 year lag in data availability, the results shown reflects the previous years’ result. The actual result for fiscal year 2020 to 2021 will be available in April 2022 and reported in the 202 to 2022 Departmental Results Report
- service standards are published on Canada.ca
- ESDC/Service Canada must make strategic choices in the services it delivers to use its resources to provide the best services possible, and meet its services standards, with particular priority given to starting payment of benefits to clients as quickly as possible.
- this target was 70% in previous years and was increased to 80% for fiscal year 2020 to 2021.
| Spending category | 2020 to 2021 Main Estimates | 2020 to 2021 Planned spending* | 2020 to 2021 Total authorities available for use | 2020 to 2021 Actual spending (authorities used) | 2020 to 2021 Difference (Actual spending minus Planned spending) |
|---|---|---|---|---|---|
| Gross Spending | 7,134,644,947 | 28,487,016,224 | 132,726,868,717 | 132,401,445,738 | 103,914,429,514 |
| Spending in Specified Purpose Accounts | 0 | 21,352,371,277 | 33,734,727,167 | 33,734,727,167 | 12,382,355,890 |
| Revenues netted against expenditures | 871,516,398 | 871,516,398 | 1,466,183,987 | 1,364,106,418 | 492,590,020 |
| Net Spending** | 6,263,128,549 | 6,263,128,549 | 97,525,957,563 | 97,302,612,153 | 91,039,483,604 |
Explanation of variances: the difference between net planned and actual spending is attributable to the Canada Emergency Response Benefits (CERB) and Canada Recovery Benefit. This is largely explained by the temporary measures put in place as response to the COVID-19 pandemic to help insurable workers' transition to Employment Insurance benefits when the CERB ended, along with a high unemployment rate in 2020 (9.5% in 2020 versus 5.8% in 2019).
Notes
* “Planned spending” may differ from Main Estimates as they include the amounts to be spent for the Specified Purpose Accounts (such as Employment Insurance and Canada Pension Plan accounts). These amounts include benefits paid to clients and amounts associated with the payment of these benefits.
** “Net Spending” excludes amounts spent under Specified purpose accounts.
Refer to the department's Financial Framework section for a complete description of the departmental financial profile, including explanation of gross actual and planned spending.
Human resources (full-time equivalents)
2020 to 2021 planned full-time equivalents: 10,263
2020 to 2021 actual full-time equivalents: 13,895
2020 to 2021 difference (actual full-time equivalents minus planned full-time equivalents: 3,632
Explanation of variances: the increase in full-time equivalents mainly reflects additional staff hired to process Employment Insurance claims as well as to improve call centre accessibility.
Financial, human resources and performance information for Employment and Social Development Canada’s Program Inventory is available in GC InfoBase.
Working conditions and workplace relations
Description: promotes safe, healthy, fair and inclusive work conditions and cooperative workplace relations.
Results
Workplaces are safe and healthy
Pandemic-related measures
The department supported the development and implementation of amendments to the Canada Labour Code to assist the COVID-19 response efforts. This included the following:
- a new leave related to COVID-19 of up to 16 weeks as of March 25, 2020. The leave was later extended to 24 weeks on July 10, 2020 and to 28 weeks on September 16, 2020. The leave was aimed at federally regulated employees who were unable or unavailable to work for reasons related to the pandemic. This measure complemented the Canada Emergency Response Benefit (CERB)
- the temporary waiver of the requirement for an employee to provide a medical certificate to access medical leave, compassionate care leave, and leave related to critical illness
- a new 16-week quarantine leave as of October 1, 2020
- a revamped leave related to COVID-19, starting on October 2, 2020. This leave was aligned with the new Canada Recovery Sickness Benefit (CRSB) and Canada Recovery Caregiving Benefit (CRCB). It allowed employees to take 2 weeks of leave because of personal illness or a requirement to isolate. Employees could also take up to 26 weeks of leave to provide care to a family member affected by the pandemic. The duration of these leaves was extended to 4 weeks and 38 weeks, respectively, on March 15, 2021
Moreover, the Minister of Labour temporarily extended the period of validity of first aid certifications and courses until December 31, 2020. The department implemented this extension, which applied to certifications that expired between March 13 and August 31, 2020. This measure was required since recertification was unavailable during the pandemic.
Planned commitments and other achievements
Canada Labour Code modernization
Other legislative amendments have come into force, through fiscal year 2020 to 2021, to modernize the Canada Labour Code. These amendments improved protections for employees in federally regulated workplaces.
The new Part IV of the code came into force on January 1, 2021 and established an Administrative Monetary Penalties System. This system creates stronger incentives for employers to comply with the code's occupational health and safety and labour standards requirements. Failure to comply can now lead to a notice of violation, with an associated monetary penalty. However, employers need time to adjust to these changes. Therefore, the department will not impose any monetary penalty for administrative violations until January 1, 2022. In the meantime, the department will continue to provide ongoing education to stakeholders about the implementation of the Administrative Monetary Penalties system. It will also continue to build internal infrastructure to support the system effectively.
Additional amendments to the code also came into force on January 1, 2021. This included:
- bringing into force the power to issue compliance orders. These require employers to cease a contravention of a labour standards requirement. Employers must then take specific steps, within a stated period, to ensure that the contravention does not continue or reoccur
- implementing provisions for publishing the name of violators. This provides a stronger incentive for employers to comply with their obligations prior to being issued a monetary penalty. It also helps ensure employees are better protected
- helping to prevent employers from treating an employee as if they were not their employee (for example, hiring them as a contractor instead of an employee)
- establishing a new Head of Compliance and Enforcement of the Canada Labour Code. This official is responsible for the day-to-day administration and enforcement of :
- Part II (Occupational Health and Safety)
- Part III (Labour Standards)
- Part IV (Administrative Monetary Penalties)
Workplace harassment and violence prevention
The department implemented the Work Place Harassment and Violence Prevention Regulations, along with the legislation, on January 1, 2021. They define the procedures that employers must have in place to respond to incidents of harassment and violence in federally regulated workplaces.
Through the Workplace Harassment and Violence Prevention Fund, the department funded 7 projects across Canada. This funding aims to support the implementation of Bill C-65 (Act to amend the Canada Labour Code (harassment and violence)) and associated regulations. The fund made $3.5 million available annually through grants and contributions. It seeks to:
- promote workplaces free of harassment and violence and an overall positive culture change
- assist employers and employee groups in co-developing supporting tools and resources
Mental health in the workplace
The department completed 2 phases of consultations to gather input on mental health (psychological health and safety) in the workplace. The first phase asked for input from workers, unions, employers, academics, other experts and all interested Canadians. It informed proposals for potential policy solutions that reflect the diverse needs of federally regulated workplaces. The second phase brought together employers, unions and advocacy groups, and focused on proposed policy solutions. The department will use this information to include mental health as a key component of occupational health and safety. This will contribute to the protection of workers and the obligation for federally regulated employers to take preventative steps to address workplace stress and injury.
Work Conditions are fair and inclusive
Pandemic-related measures
The department extended the temporary layoff periods specified in the Canada Labour Standards Regulations. This gave employers more time to recall laid-off employees before their employment was deemed to be terminated. The regulations were amended twice:
- first on June 22, 2020, to extend the maximum duration of certain temporary layoff periods by up to 6 months, until December 30, 2020
- second on November 9, 2020, to extend the maximum duration of these temporary layoff periods by an additional 3 months, until March 31, 2021
These temporary extensions were repealed on March 31, 2021.
On September 11, 2020, the Minister of Labour issued an order under the authority of the Time Limits and Other Periods Act (COVID-19). The department implemented this order, which extended the Wage Earner Protection Program (WEPP) wage eligibility period by up to 6 months. This aimed to accommodate receivership and bankruptcy delays due to COVID-19, so that Canadians remained eligible to apply to the program. The extended period applied to bankruptcies and receiverships initiated between March, 13, 2020 and December 30, 2020. After December 30, 2020, the eligible wages period for the WEPP reverted to 6 months before the date of the bankruptcy or receivership.
Planned commitments and other achievements
Employment equity
The department amended the Employment Equity Regulations in support of new pay transparency measures that took effect on January 1, 2021. This initiative will help close the wage gap between women and men in federally regulated workplaces.
The Pay Equity Act will also contribute to reducing this gap. It will help ensure that women and men in federally regulated workplaces receive equal pay for work of equal value. The Pay Equity Regulations will complement the act and bring the regime into force. They were pre-published in Part I of the Canada Gazette on November 13, 2020. Once the Pay Equity Act is in effect, employers will have 3 years to develop and implement their proactive pay equity plans.
Amendments to Part III of the Canada Labour Code came into force on September 1, 2020. These amendments improve support and protection for paid and unpaid interns. Students undertaking an internship as a requirement for an educational program may sometimes be unpaid. However, they are covered by certain labour standards protections under Part III of the code. Other interns are entitled to all the same protections as employees. That includes the right to be paid at least the minimum wage. All interns benefit from the same occupational health and safety protections as employees, as provided under Part II of the code.
The department prepared amendments to the Wage Earner Protection Program Regulations. These amendments aim to expand access to the program and provide greater support to workers during difficult transitions. They will benefit Canadian workers by allowing more workers to receive payments for eligible wages owed to them. They will also accelerate the payment of eligible wages in certain situations. The Wage Earner Protection Program Regulations were pre-published in Part I of the Canada Gazette on November 28, 2020.
The department drafted a regulation creating modifications to and exemptions from certain new hours of work provisions. These provisions apply to employees in the road, postal, courier, maritime and grain transport sectors. This draft regulation was published in the Canada Gazette Part I on December 19, 2020
The pandemic prevented stakeholders from the aviation, telecommunications, broadcasting, banking and rail transportation industries from making submissions following consultations. Proposed regulations relevant to these sectors will be targeted for pre-publication in the Canada Gazette, Part I in fiscal year 2021 to 2022.
Labour relations are cooperative
Through the Federal Mediation and Conciliation Service (FMCS), the department supports unions and employers under federal jurisdiction during the collective bargaining process. During fiscal year 2020 to 2021, the department made 73 conciliation appointments. The FMCS also offers the parties day-to-day support during the life of the agreement. This helps them foster collaborative labour relations as well as prevent and better manage workplace conflict. To achieve this, the department provides joint training in conflict resolution, facilitation of joint initiatives and grievance mediation. During fiscal year 2020 to 2021, the department made 53 mediator appointments and undertook a total of 146 dispute prevention initiatives.
National and international cooperation
The department played a strong leadership role in the negotiation and adoption of International Labour Organization Convention 190. A Labour Program official served as Committee Chair to steer and facilitate the negotiation process. In addition, Labour Program experts shared Canadian experiences while bridging differences and building consensus. The department’s involvement greatly contributed to the successful adoption of the convention. This is the first-ever global treaty on ending violence and harassment in the world of work. The department will continue to work with its provincial and territorial partners to move forward the ratification of this important convention.
Clients receive high quality, timely and efficient services that meet their needs
The department improved services for federally regulated employers and employees by continuing the development of the Integrated Labour System (ILS). As a result, the department onboarded the Federal Mediation and Conciliation Services to the ILS. The department also continued to develop new online portals. For example, it launched the Labour Electronic Access Form portal solution. A new portal for online complaints is in development allowing federally regulated employees to submit complaints electronically. These new portals will allow federally regulated employers and employees to file reports and complaints in a secure and protected manner.
Gender-based analysis plus
The Labour Program contributed to the Gender-Based Violence and Access to Justice pillar of Canada’s Gender Results Framework. More specifically, it supported the objectives of achieving harassment-free workplaces and eliminating domestic violence or intimate partner violence, as follows:
Workplaces are harassment-free
Harassment and violence disproportionately affects women and members of the LGBTQ2+ community. However, evidence shows harassment is under-reported, with as many as 80% of incidents going unreported. Bill C-65 and the Work Place Harassment and Violence Prevention (WPHVP) Regulations strengthened previously existing provisions. They form one comprehensive approach that takes all forms of harassment and violence in the workplace into consideration. Federally regulated employers are now required to take steps to prevent, protect against and respond to occurrences of workplace harassment and violence. The WPHVP Regulations also provide increased confidentiality and privacy protections for victims and survivors of workplace harassment and violence. The goal of such protections is to eliminate barriers to reporting and to increase confidence in the system.
Eliminating Domestic Violence or Intimate Partner Violence
In a Privy Council Office survey, 32% of Canadians believe domestic violence has increased since the start of the pandemic. Canadian domestic violence agencies also reported an increase in the number of domestic violence abuse reports since the onset of the pandemic. This has been linked to the shift to remote work and Canadians working from home as a result of COVID-19 measures. This shift to teleworking has increased the risk of women being subject to domestic violence. Through the Workplace Harassment and Violence Prevention Fund, the department has sponsored a project titled “Addressing Domestic Violence at Work through Collaboration”. The project supports implementation of Bill C-65 (Act to amend the Canada Labour Code (harassment and violence)) and the WPHVP Regulations. It also ensures that stakeholders can respond effectively to harassment and violence associated with domestic violence that enters the workplace.
Experimentation
The Labour Program experimented with user-centered approaches and analytics to improve efficiency and program delivery:
- users took part in designing a risk-assessment tool to help employers and workplace committees meet the regulatory requirements under Bill C-65. The tool consists of a list of questions to help employers screen the risks of workplace harassment and violence. This user-centered approach helped identify the needs of workplaces and ensure the format of the tool was easy to use. The tool was well received by stakeholders and published online in November 2020
- for 3 years, the department experimented using a statistical model to set occupational health and safety proactive inspections in high-risk workplaces. The model measured how effective these inspections were in preventing workplace injuries. The experiment found a small impact on injury reduction directly associated with these proactive inspections. The department also noticed an increase in complaints and requests from the workplaces’ health and safety committee following proactive inspections. An independent study has found that these types of requests and complaints potentially reduce injuries. The Labour Program will therefore consider these lessons when designing future experiments in cooperation with stakeholders across the department
2030 Agenda for Sustainable Development
In fiscal year 2020 to 2021, the department supported the UN 2030 Agenda for Sustainable Development by implementing various initiatives. This included the implementation of Bill C-65 and the Work Place Harassment and Violence Prevention Regulations. It also included the modernization of the Canada Labour Code by passing the Pay Equity Act and related legislation towards a proactive pay equity regime. These initiatives support decent work and economic growth for all, including women, youth, older workers, persons with disabilities, racialized workers, newcomers and Indigenous people.
Specifically, these initiatives supported the following UN Sustainable Development Goals (SDGs):
- Gender Equality (SDG 5)
- Decent Work and Economic Growth (SDG 8)
- Reduced Inequalities (SDG 10)
To support the principle of “leaving no one behind”, the department implemented Bill C‑65 and the Work Place Harassment and Violence Prevention Regulations. Together, these changes support a healthy, respectful and inclusive workplace for all workers. The objective is to achieve harassment and violence-free federally regulated workplaces, where civility and respect is the standard.
Results achieved
Departmental result: workplaces are safe and healthy
Performance indicator: number of health and safety violations identified under the Canada Labour Code (Part II) per 1,000 federally regulated employees
Target: 9 or less (See note 1 below)
Date to achieve target: March 2021
2018 to 2019 actual results: 11.1
2019 to 2020 actual results: 12.6
2020 to 2021 actual results: 2.0 (See note 2 below)
Departmental result: work conditions are fair and inclusive
Performance indicator 1 of 2: percentage of Legislated Employment Equity Program employers whose representation equals or surpasses Canadian labour market availability for 2+ designated groups or who demonstrated progress towards representation since the previous reporting period
Target: 65% (See note 3 below)
Date to achieve target: September 2020
2018 to 2019 actual results: 68%
2019 to 2020 actual results: 73%
2020 to 2021 actual results: 74%
Performance indicator 2 of 2: 3-year average number of founded violations identified under Part III of the Canada Labour Code per 1,000 federally regulated employees
Target: 3 or less (See note 1 below)
Date to achieve target: March 2021
2018 to 2019 actual results: 2.9 (2016 to 2019)
2019 to 2020 actual results: 2.9 (2017 to 2020)
2020 to 2021 actual results: 2.6 (2018 to 2021)
Departmental result: labour relations are cooperative
Performance indicator: percentage of labour disputes settled under the Canada Labour Code (Part 1) without work stoppages, where parties were assisted by Labour Program officers
Target: 95%
Date to achieve target: March 2021
2018 to 2019 actual results: 97%
2019 to 2020 actual results: 93%
2020 to 2021 actual results: 96%
Departmental result: clients receive high quality, timely and efficient services that meet their needs (See note 4 below)
Performance indicator 1 of 5: number of service standard targets for Working Conditions and Workplace Relations program priority services, as defined by the Government of Canada’s Policy on Service, that are being met
Target: 4 out of 4
Date to achieve target: March 2021
2018 to 2019 actual results: 2 out of 4
2019 to 2020 actual results: 4 out of 4
2020 to 2021 actual results: 3 out of 4 (See note 5 below)
Performance indicator 2 of 5: percentage of occupational health and safety cases each fiscal year that are finalized within 120 days (excluding prosecutions, appeals, and technical surveys)
Target: 70%
Date to achieve target: March 2021
2018 to 2019 actual results: 79%
2019 to 2020 actual results: 83%
2020 to 2021 actual results: 73%
Performance indicator 3 of 5: percentage of unjust dismissal complaints that are finalized within 180 days
Target: 75%
Date to achieve target: March 2021
2018 to 2019 actual results: 73%
2019 to 2020 actual results: 80%
2020 to 2021 actual results: 69% (See note 5 below)
Performance indicator 4 of 5: percentage of conciliators assigned under the Canada Labour Code within 15 calendar days of receiving requests that are compliant with Canada Industrial Relations Regulations
Target: 96%
Date to achieve target: March 2021
2018 to 2019 actual results: 100%
2019 to 2020 actual results: 100%
2020 to 2021 actual results: 100%
Performance indicator 5 of 5: percentage of initial Wage Earner Protection Program payments and non-payment notifications issued within 35 calendar days
Target: 80%
Date to achieve target: March 2021
2018 to 2019 actual results: 73%
2019 to 2020 actual results: 98%
2020 to 2021 actual results: 89%
Notes:
- as a result of changes to legislation, particularly due to Compliance & Enforcement, this indicator will fluctuate and most likely increase over the short term as the program improves its service delivery and is able to reach a larger number of employers
- violations are typically identified during the course of proactive inspections in workplaces, which have been greatly reduced in fiscal year 2020 to 2021 due to the pandemic
- the Labour Program contributes to this target by supporting the efforts of federally regulated private-sector employers in achieving progress towards creating equitable workplaces
- service standards are published on Canada.ca
- delays in mail delivery due to the pandemic affected the sending, reception and treatment of complaints. Furthermore, employers’ offices were closed and employers were inaccessible, which negatively affected the handling of the complaints
| Spending category | 2020 to 2021 Main Estimates | 2020 to 2021 Planned spending* | 2020 to 2021 Total authorities available for use | 2020 to 2021 Actual spending (authorities used) | 2020 to 2021 Difference (Actual spending minus Planned spending) |
|---|---|---|---|---|---|
| Gross Spending | 306,797,291 | 306,797,291 | 178,472,603 | 175,405,872 | (131,391,419) |
| Spending in Specified Purpose Accounts | 0 | 0 | 0 | 0 | 0 |
| Revenues netted against expenditures | 125,900,000 | 125,900,000 | 900,000 | 707,595 | (125,192,405) |
| Net Spending** | 180,897,291 | 180,897,291 | 177,572,603 | 174,698,277 | (6,199,014) |
Explanation of variances: no significant variance
Notes
* “Planned spending” may differ from Main Estimates as they include the amounts to be spent for the Specified Purpose Accounts (such as Employment Insurance and Canada Pension Plan accounts). These amounts include benefits paid to clients and amounts associated with the payment of these benefits.
** “Net Spending” excludes amounts spent under Specified purpose accounts.
Refer to the department's Financial Framework section for a complete description of the departmental financial profile, including explanation of gross actual and planned spending.
Human resources (full-time equivalents)
2020 to 2021 planned full-time equivalents: 782
2020 to 2021 actual full-time equivalents: 763
2020 to 2021 difference (actual full-time equivalents minus planned full-time equivalents: (19)
Explanation of variances: no significant variance
Financial, human resources and performance information for Employment and Social Development Canada’s Program Inventory is available in GC InfoBase.
Information delivery and services for other government departments
Description: provides information to the public on the programs of the Government of Canada, and provides services on behalf of government departments and other partners
Results
Clients receive high quality, timely and accurate government information and services that meet their needs
Pandemic-related measures
All through the pandemic, the department worked hard to provide good information and ensure dependable services to the public. This often required finding new ways to deliver services to Canadians.
For example, following the temporary suspension of in-person service delivery, the department put in place eServiceCanada. This online service was put in place to mirror the in-person services available at Service Canada Centres. It allowed clients to request assistance online and then be contacted by a Citizen Service Officer within 2 business days. This initiative allowed 2.2 million clients to keep accessing services that they would normally receive at in-person Service Canada Centres.
In addition, the department implemented an Outreach Support Centre to provide services to Indigenous communities and other marginalized and underrepresented clients. These can be clients with no reliable access to the internet or who experience other barriers to accessing service. When the pandemic forced the suspension of in-person outreach, the department implemented a toll-free Outreach Support Centre. Clients could call the toll-free number and be immediately connected with a Service Canada representative to receive assistance. The Outreach Support Centre completed 41,126 calls that resulted in 49,274 service offerings provided in fiscal year 2020 to 2021.
Persons with disabilities faced particular challenges because of the pandemic. To support accessibility to its programs and services, the department:
- provided guidance to front line staff on how to assist clients with disabilities affected by the COVID-19 protective measures
- held an outreach session with sign language interpreters. This provided a better understanding of the new measures to support the Canada Emergency Response Benefit (CERB) applications.
All through the pandemic, the department kept the 1 800 O-Canada phone line and all essential customized information services open. It delivered reasonable wait times. It even extended regular hours of service to late nights and weekends, as required, for some customized information services. 1 800 O-Canada officers provided information on all COVID-19 special measures and their impact on Government of Canada programs and services. The information was continuously updated. As of March 31, 2021, 1 800 O-Canada agents had answered 2.51 million calls.
The department also contributed to preventing misinformation and disinformation over major social media platforms. It used the blue badge account verification processes to validate the status of official Government of Canada social media accounts. The department helped verify 52 social media accounts across different platforms such as Twitter, Facebook and Instagram.
The department also helped prevent the impersonation of official Government of Canada social media accounts. This was done through collaboration with social media platforms. It supported the resolution of 7 cases of impersonation.
In addition, the department also delivered the Fish Harvester Benefit and Grant program, on behalf of the Department of Fisheries and Oceans Canada. Across Canada, more than 18,000 fish harvesters affected by the pandemic received the grant.
Planned commitments and other achievements
Providing better service to all Canadians
Indigenous people
Under the Indigenous Outreach Initiative, the department reached out to northern and remote communities and provided access to services and federal social benefits. It promoted alternative service delivery methods best suited to their needs. The department also contacted 4,844 service delivery partners working with Indigenous communities to promote the availability of new service options. This ensured that Indigenous communities maintained access to services when Service Canada Centres were closed and in-person outreach visits were suspended. The department secured funding to establish the initiative permanently in the coming years. Therefore, more Indigenous people will have access to available programs and benefits when eligible.
As a result of these engagement efforts, 687 Indigenous communities received virtual services. This is the highest number of communities served since Service Canada began conducting Indigenous outreach in 2016.
Persons with disabilities
The department undertook a number of actions to make its programs and services more accessible for persons with disabilities. This included the following:
in its in-person service locations:
- supporting clients who use sign language and video remote interpretation in 145 Service Canada Centres. Those offices were also equipped with counter loop devices, which project sound directly to a client’s hearing aid, supporting those with hearing loss
- assisting clients with vision loss in navigating independently, using wayfinding beacons (technology enabling indoor navigation). In total, 7 sites are now equipped with the beacons
- reducing communication barriers by acquiring “talk through” microphones for Plexiglas barriers in all offices
on its web pages:
- reviewing all new content for plain language to meet a grade 6-8 literacy level. ESDC’s top 150 web pages (which generate over 90% of all visits to departmental pages) are now meeting this standard
- improving the major program pages to make them easier to use. This includes the following pages:
- Canada Pension Plan
- Canada Pension Plan Disability benefits
- Old Age Security
- Guaranteed Income Supplement
- Employment Insurance Sickness benefits
- Employment Insurance for self-employed
Veterans
The department continued to support veterans and their families through the delivery of information services. The department processed over 671 requests for information, including referrals to Veterans Affairs Canada (VAC). The department processed a smaller number of requests than usual given the closure of offices because of the pandemic. It also assisted with approximately 27 applications for VAC programs and services.
General public
The department kept improving service through 1 800 O-Canada. Wait times for the service are now displayed in real time on Canada.ca. This allows clients to know exactly what to expect before they contact an officer. It improves the client experience and helps them make informed decisions about the best use of their time.
The department expanded partnerships with other federal government departments and jurisdictions including provinces and territories through the Service Delivery Partnerships program. As a result, benefits and services are being delivered to more beneficiaries directly. In fiscal year 2020 to 2021, 39 partnership agreements were signed, and a total of 68 partnerships are in place. For more information on these partnerships, consult the Service Delivery Partnership Disclosure List.
Improvement of the client experience continues to be a priority for the department and drives how it does business. To help identify client needs, the department conducts an annual Client Experience Survey. This survey provides data on client satisfaction with their service experience. Previous results provided a strong understanding of the department’s pre-pandemic performance. This allowed the department to assess changes in client experience within the context of significant transformation. The department was therefore in a better position to address new and rapidly changing client needs brought about by the pandemic. For more information, consult the full results of the 2019 to 2020 survey.
Other government departments
The department continued managing more than 3,500 social media accounts for 77 federal government departments. These departments posted a total of 1.65 million social media posts in fiscal year 2020 to 2021.
The department, via Service Canada, collects biometric data from foreign nationals in Canada on behalf of Immigration, Refugees and Citizenship Canada (IRCC). This collection supports IRCC’s temporary and permanent resident programs. In fiscal year 2020 to 2021, Service Canada Centres booked nearly 88,000 biometric collection appointments and completed over 70,000 biometric collections.
Service Canada paused this service from April to September 2020 to protect the health and safety of clients and employees. In September, the department reactivated it for permanent residents, according to IRCC’s policy.
Canadians can obtain a passport within Canada in a timely manner
Pandemic-related measures
In March 2020, regular passport service delivery was suspended. From March 19, 2020 to June 2021, the department only provided critical services. Measures implemented ensured the service was available to those who required it. Applicants could obtain an in-person appointment for compelling reasons, accompanied with proof of travel or need. Services offered were extended during the summer of 2020. Due to the impact of the pandemic, passport applications volumes were significantly reduced in fiscal year 2020 to 2021.
Planned commitments and other achievements
Passport program modernization
At the beginning of fiscal year 2020 to 2021, the Passport Program Modernization Initiative was paused. However, it resumed in summer 2020, and the project reached an important milestone by launching the pre-pilot phase in August 2020. Due to the pandemic, the pre-pilot phase was extended. By August 2021, over 2,250 passports had been issued using the new intake tool and the Global Case Management System. The next step will be to implement the formal pilot phase.
Gender-based analysis plus
Indigenous populations face inequalities in income and multiple barriers to accessing federal benefits. So do other marginalized and underrepresented clients living in remote communities or having limited access to the internet. Service Canada's outreach program provides help in overcoming these barriers and closing socio-economic gaps. These marginalized and underrepresented clients can then access important services and benefits to improve their well-being. For example, the department launched the Service Canada Outreach Support Centre for clients facing barriers to accessing programs and services. These programs and services include Canada Child Benefit, Canada Pension Plan, Old Age Security, Guaranteed Income Supplement, and Social Insurance Numbers. By doing so, the department contributes to the Poverty Reduction, Health and Well-Being pillar of the Gender Results Framework.
Experimentation
The department conducted a vast qualitative study on the lived experience of 150 Service Canada frontline staff. The study focused on their situation during the height of the COVID-19 crisis. During this period, the staff could not engage with clients in person. They also had to deal with high levels of uncertainty with respect to the crisis response. The study provided rich information on challenges and barriers experienced by both frontline staff and the clients they served. Using this information, the department designed potential solutions to these challenges and barriers. The usefulness of these solutions was then further validated via a survey with 86 staff. This mixed approach provided high quality data. The department will use it to improve its service delivery, putting the client at the centre of the solutions.
2030 Agenda for Sustainable Development
In fiscal year 2020 to 2021, the department ensured citizens could access quality, accurate information on programs and services through various services and communication channels. This contributed to the 2030 Agenda Sustainable Development Goals (SDGs). For example:
- No Poverty (SDG 1) – Since marginalized and underrepresented clients were able to access financial resources and benefits
- Good Health and Well-Being (SDG 3) – By providing accurate information related to COVID-19, among other topics
Results achieved
Departmental result: clients receive high quality, timely and accurate government information and services that meet their needs
Performance indicator 1 of 3: 1 800 O-Canada information completeness, relevancy and accuracy assessment
Target: 85%
Date to achieve target: March 2021
2018 to 2019 actual results: 93%
2019 to 2020 actual results: 91%
2020 to 2021 actual results: 89%
Performance indicator 2 of 3: percentage of clients served in person who received assistance within 25 minutes
Target: 80%
Date to achieve target: March 2021
2018 to 2019 actual results: 85%
2019 to 2020 actual results: 84%
2020 to 2021 actual results: 95%
Performance indicator 3 of 3: number of program services that meet their service standard targets
Target: 5 (See note 1 below)
Date to achieve target: March 2021
2018 to 2019 actual results: 4 out of 5
2019 to 2020 actual results: 4 out of 5
2020 to 2021 actual results: 1 out of 5 (See note 2 below)
Departmental result: Canadians can obtain a passport within Canada in a timely manner
Performance indicator: percentage of travel documents and other passport services processed within standards
Target: 90% (See note 3 below)
Date to achieve target: March 2021
2018 to 2019 actual results: 100% (See note 4 below)
2019 to 2020 actual results: 100% (See note 4 below)
2020 to 2021 actual results: not available (See note 5 below)
Notes:
- target is to meet 5 of a possible 5 priority service standards for Information Delivery and Services for other Departments' programs
- 3 of the 5 service standards considered are related to Passport service delivery. However, due to the pandemic, Passport services were significantly reduced during fiscal year 2020 to 2021. Consequently, these targets were not met
- this target is part of a Memorandum of Understanding between the department and IRCC
- the data has been rounded to the nearest full number, in this case 100%
- due to the pandemic, Passport services were significantly reduced during fiscal year 2020 to 2021. Consequently, these services were only provided to those who required it. Therefore, results have not been fully compiled
| Spending category | 2020 to 2021 Main Estimates | 2020 to 2021 Planned spending* | 2020 to 2021 Total authorities available for use | 2020 to 2021 Actual spending (authorities used) | 2020 to 2021 Difference (Actual spending minus Planned spending) |
|---|---|---|---|---|---|
| Gross Spending | 260,513,398 | 260,513,398 | 238,619,834 | 238,479,502 | (22,033,896) |
| Spending in Specified Purpose Accounts | 0 | 0 | 0 | 0 | 0 |
| Revenues netted against expenditures | 0 | 0 | 0 | 0 | 0 |
| Net Spending** | 260,513,398 | 260,513,398 | 238,619,834 | 238,479,502 | (22,033,896) |
Explanation of variances: no significant variance.
Notes
* “Planned spending” may differ from Main Estimates as they include the amounts to be spent for the Specified Purpose Accounts (such as Employment Insurance and Canada Pension Plan accounts). These amounts include benefits paid to clients and amounts associated with the payment of these benefits.
** “Net Spending” excludes amounts spent under Specified purpose accounts.
Refer to the department's Financial Framework section for a complete description of the departmental financial profile, including explanation of gross actual and planned spending.
Human resources (full-time equivalents)
2020 to 2021 planned full-time equivalents: 2,513
2020 to 2021 actual full-time equivalents: 1,708
2020 to 2021 difference (actual full-time equivalents minus planned full-time equivalents: (805)
Explanation of variances: the variance is mainly due to the decrease in passport volumes and the postponement of several activities due to the COVID-19 pandemic.
Financial, human resources and performance information for Employment and Social Development Canada’s Program Inventory is available in GC InfoBase.
Internal services
Description: Internal Services are those groups of related activities and resources that the federal government considers to be services in support of programs and/or required to meet corporate obligations of an organization. Internal Services refer to the activities and resources of the 10 distinct service categories that support program delivery in the organization, regardless of the internal services delivery model in a department. The 10 service categories are:
- Acquisition Management Services
- Communication Services
- Financial Management Services
- Human Resources Management Services
- Information Management Services
- Information Technology Services
- Legal Services
- Material Management Services
- Management and Oversight Services
- Real Property Management Services
Results
Financial management services
In fiscal year 2020 to 2021, the department introduced new tools and mechanisms to improve and strengthen investments and project management. This included establishing a Risk Review Board to manage key risks, implementing a Benefit Management Practice to manage the achievement of outcomes and completing work on the Project Management Competency Development program.
The department also strengthened its ability to deliver large-scale transformational change through the adoption of Programme Management Practice. This included leadership development sessions on programme management and full implementation of the Programme Management Framework. The framework includes policy tools, guidance documents, and other key supporting materials for strong programme management.
In response to the pandemic, the department ensured that Service Canada Centres respected new COVID-19 protocols. This included procurement of Personal Protective Equipment, and other health and safety products. These measures were implemented quickly to ensure the safety of Canadians.
The department’s Workplace modernization projects progressed during the pandemic, including work toward the adoption of unassigned seating environments in general office spaces and the development of a department-wide space reservation system. The progress reflects the recent shift towards increased telework and flexible workplaces. It aims to offer employees workspaces that support a variety of activities (activity-based working) and the ability to be more mobile. The department’s goal is to create a workplace culture built on trust where employees are empowered and can do their best work.
Human resources management services
In fiscal year 2020 to 2021, the department did the following to create a healthy, respectful and inclusive workplace:
- provided support and services to meet the needs of departmental employees and addressed challenges posed by the pandemic, increased workload and uncertainty
- worked with partners across government to provide the latest information and resources to managers and employees. This information helped managers and employees understand their roles and responsibilities and ensured that employees were safe and well equipped to do their jobs during the pandemic
- developed a Workplace Mental Health Action Plan, focused on dealing with change and emotional wellbeing. This provided employees with access to all available mental health-related tools and resources
- engaged employees on values and ethics topics in a creative way. This included using podcasts about keeping workplaces safe and cyber civility
Building diversity and inclusion remain important priorities at ESDC. The department developed a new 3-year Diversity and Inclusion Action Plan based on employee input. The department also created a Black Engagement and Advancement Team. This team sparks discussions on issues experienced by Black employees.
The department continued its work to become a more accessible workplace by supporting the Public Service Accessibility Strategy. The department has focused on the recruitment, retention and promotion of persons with disabilities to foster a barrier-free environment. This included:
- improvements to the department’s Learning Management System and course offerings to increase accessibility of online training
- enhanced accessibility awareness through events, employee guides and learning opportunities
- consulted employees with disabilities, who shared their experiences and provided input on how to improve the experience of new employees with disabilities
- created an Unconscious Bias Working Group to reduce hidden biases in hiring processes
- led virtual recruitment events for persons with disabilities and recent graduates, accessing a diverse talent pool representative of Canada’s diversity
Top 100 Employer Award
In 2020 to 2021, ESDC was named one of:
- Canada’s Top 100 Employers
- Canada’s Top Employers for Young People
- Canada’s Best Diversity Employers
- Canada’s Top Family-Friendly Employers
- the National Capital Region’s Top Employers
These awards are a reflection of our talented and skilled workforce.
In order to attract and develop talent to support Canadians impacted by the pandemic and prepare for future needs, the department implemented a number of measures:
- hired and trained more employees on the front lines and in other critical functions. This included:
- setting up a new 1,500 person virtual call centre to support the delivery of benefits and services to Canadians during the pandemic
- increasing student hiring through the Federal Student Work Experience Program (including the Employment Opportunity for Students with Disabilities and the Indigenous Student Employment Opportunity programs)
- developing virtual training and other development opportunities on topics, including the Canada Emergency Response Benefit. A network of virtual facilitators and training sessions were organized to train employees before they started working. In addition, the department also developed and launched crisis intervention training for over 4,000 call centre employees, and training updates supported the reopening of the Service Canada Centres
- developed and updated staffing-related tools to hire top talent. This includes virtual interviews and online assessments to hire candidates during the COVID-19 pandemic
- continued to collaborate with Indigenous partners on Indigenous outreach, recruitment and retention
- introduced new processes to make staffing more efficient, including streamlined documentation requirements and electronic signatures, to reduce time to staff
- redesigned and launched a new learning delivery model offering over 1,000 courses through virtual classes and self-paced learning. This provided employees with courses, events and resources to serve Canadians with excellence
Information technology services
In fiscal year 2020 to 2021, Employment and Social Development Canada’s information technology (IT) services played a critical role in ensuring that the department continue to serve Canadians throughout the COVID-19 pandemic. This included supporting remote work by:
- coordinating with Shared Services Canada to expand service capacity
- deploying home office kits to all ESDC staff that serve Canadians directly
- improving the network to ensure a better experience for those working from home
- providing additional information management support and guidance to ensure that employees were properly managing information from home
It also included supporting IT systems for many of our most important programs. This included:
- Employment Insurance (EI) systems, which saw historic numbers during the height of the COVID-19 pandemic. The department modified EI systems to support EI simplification measures
- the Common System for Grants & Contributions. The department increased its capabilities and delivered a total disbursement of $2.44 billion to more than 6.69 million seniors
- the Guaranteed Income Supplement. The department implemented temporary rules to support the payment renewal process
- the Temporary Foreign Worker system, to fit in with the rapid deployment of a number of pandemic-related measures to assist Canadians
- COVID-19 Benefits Finder application to enable the delivery of critical benefits to Canadians
The department continued to implement a modern and secure IT infrastructure. The department completed upgrades to hardware and software components to the Old Age Security (OAS) and Canada Pension Plan (CPP) systems. This ensured the delivery of monthly benefits to Canadians.
The department also took steps to reduce the risk of losing key information in the event of an IT disruption. This was done by establishing data replication solutions in data centres. As a result, the overall time for recovery in the event of a disruption was reduced significantly. This ensured the continuity of benefits delivery for Canadians receiving critical services from the department.
In addition, IT systems were modernized to support greater use of email with EI recipients. More than 18 million emails were sent to Canadians that would have previously required printing and mailing.
The department also ensured its IT platforms could support service enhancements including those that made it easier for Canadians to use the JobBank, Canada Pension Plan-Disability, Apprenticeship Grants and Employment Insurance programs.
Information management services
In fiscal year 2020 to 2021, the department established a new Information Management (IM) Governance Model to advance the IM strategy and roadmap. In addition, an integrated IM policy framework was developed to assist department employees in properly managing information.
The department also stabilized the remote access environment. This ensured that employees could reliably access the departmental network to support the increase in remote working.
In addition, the department implemented modern, cloud-based technology to support EI applications. This created a more efficient operating environment for employees to support the applications and services that allow Canadians to access benefits.
To guide future IM and IT investment, the department launched a multi-year initiative to review and evolve its existing Application Portfolio Management function.
Finally, the Accessibility Centre of Excellence continued to support employees with disabilities by loaning adaptive technology hardware, and providing guidance and coaching on accessibility standards. In total 797 requests were addressed this fiscal year. The centre also addressed 554 requests for adaptive technology support by analyzing client adaptive technology needs to recommend solutions, and providing support and coaching for these solutions.
Privacy
In fiscal year 2020 to 2021, the department promoted openness and transparency. This was done by continuing to increase knowledge of access to information and privacy requirements. For example, a training tool was designed to increase knowledge of both the Access to Information and Privacy Acts, which resulted in the department’s employees being better prepared to process complex requests.
In addition, technology, systems and tools continued to improve the time it takes to process access to information requests. While these measures improved processing timelines, in many instances, due to the addition of new critical functions in response to the pandemic, the overall processing rates actually decreased.
In fiscal year 2020 to 2021, the department actively tracked, supported and strengthened privacy by:
- providing privacy support for the department’s numerous COVID-19 measures. This included adapting existing approaches and tools to ensure that the new measures were compliant with privacy requirements
- integrating privacy considerations into project and design phases for the department’s transformation initiatives
- simplifying processes to provide timely approvals for privacy assessments on low-risk initiatives
Security
In fiscal year 2020 to 2021, the department focused its emergency management activities on responding to the COVID-19 pandemic. The department activated the National Emergency Operations Centre to coordinate planning and management of the pandemic. The centre also supported the Departmental Crisis Management Team which included the most senior levels of management. The centre coordinated meetings and briefings, and facilitated quick decision-making.
In addition, business continuity considerations for critical services were addressed through COVID-19 related planning and activities. The department initiated a Business Impact Analysis process to assess potential vulnerabilities and to identify mitigation strategies.
The department also deployed an Emergency Response Management System (ERMS). The ERMS is a cloud-based mass notification system used to deliver emergency messages to employees in a timely manner. Finally, the department launched a national awareness communication strategy to educate employees on the expectations and importance of safeguarding personal information and the risks associated with breach of trust offences.
Data
In fiscal year 2020 to 2021, the department developed a reporting platform. That is a major milestone in creating an official data source for departmental COVID-19 program response and benefit questions.
This central platform has ensured that pandemic benefit data is available to decision makers, in support of timely policy and program analysis. The department has published statistics on pandemic benefit programs on a weekly basis since April 2020, in line with the Directive on Open Government.
| Spending category | 2020 to 2021 Main Estimates | 2020 to 2021 Planned spending* | 2020 to 2021 Total authorities available for use | 2020 to 2021 Actual spending (authorities used) | 2020 to 2021 Difference (Actual spending minus Planned spending) |
|---|---|---|---|---|---|
| Gross Spending | 908,717,800 | 908,717,800 | 1,127,313,326 | 1,098,016,943 | 189,299,143 |
| Spending in Specified Purpose Accounts | 0 | 0 | 0 | 0 | 0 |
| Revenues netted against expenditures | 605,545,391 | 605,545,391 | 776,185,489 | 761,292,575 | 155,747,184 |
| Net Spending** | 303,172,409 | 303,172,409 | 351,127,837 | 366,724,368 | 33,551,959 |
Explanation of variances: the variance in spending is mainly related to the increases to spending in Innovation, Information and Technology to support program operations.
Notes
* “Planned spending” may differ from Main Estimates as they include the amounts to be spent for the Specified Purpose Accounts (such as Employment Insurance and Canada Pension Plan accounts). These amounts include benefits paid to clients and amounts associated with the payment of these benefits.
** “Net Spending” excludes amounts spent under Specified purpose accounts.
Refer to the department's Financial Framework section for a complete description of the departmental financial profile, including explanation of gross actual and planned spending.
Human resources (full-time equivalents)
2020 to 2021 planned full-time equivalents: 4,745
2020 to 2021 actual full-time equivalents: 5,233
2020 to 2021 difference (actual full-time equivalents minus planned full-time equivalents: 488
Explanation of variances: the variance is mainly related to the increases to spending in Innovation, Information and Technology to support program operations.
Financial, human resources and performance information for Employment and Social Development Canada’s Program Inventory is available in GC InfoBase.
Overall risks and mitigation strategies
Taking risks
At the beginning of the year, the department identified that failing to take risks to improve service delivery was also a risk. This year, the department took smart risks to redesign and modernize its policies, programs and services as described in the following sections.
Information technology modernization
Many of the key services the department delivers use old software that needs to be renewed. The department continued to update and maintain its information technology (IT) systems to reduce the risk of them failing. The department improved its call centre technology by providing Canadians self-service access to their applications and payment status for 3 programs. These programs are: Employment Insurance, Canada Pension Plan and Old Age Security.
Privacy
The department holds a lot of personal information about Canadians given the nature of the programs and services it delivers. There is a risk that sensitive or confidential information could be used in the wrong way. Privacy was a priority when designing new supports for Canadians during the pandemic. To meet the department’s obligations to protect Canadian’s personal information, it increased communications to employees about privacy and cyber-security to promote a culture of privacy and security, and to reduce the risk of privacy breaches.
Fraud
The department continually faces risks of fraud, wrongdoing and error against and within its programs, services, and operations. The department reviewed and strengthened controls to help prevent and detect fraud. The department continued its review of information sharing agreements with its delivery partners.
Human resources
To deliver new emergency benefits, the department reassigned almost 3,000 staff to critical services and set up a new virtual call centre. Hiring practices were modified to conduct interviews and testing virtually. This ensured the department had enough staff, with the right skills, in place to deliver its programs and services. The department developed a guide for employees returning to the workplace and it is revised in real time as the situation evolves. The guide allows employees to ensure that they are following public health guidelines while safely delivering services to Canadians.
The department implemented solutions to reduce the delays in resolving pay issues. These solutions support the prevention, management and resolution of ESDC employees pay issues. In addition, the department designed new tools and guidance for employees and managers. It also increased the number of resources dedicated to addressing compensation and benefits-related needs. Moreover, the department is setting up a compensation development program to strengthen training and capacity.
Investment planning and investment portfolio management
The department’s investment portfolio includes projects to modernize and improve the systems and processes that deliver benefits to Canadians. There is always a risk that major projects may be late, cost more, or not deliver the expected improvements. The department strengthened how it selects and prioritizes its major projects by providing additional advice, oversight and assurance. This strengthened project oversight helps to ensure that the departmental projects can deliver expected outcomes. Additionally, governance and accountabilities for the Benefits Delivery Modernization programme and the related projects were updated.
Service delivery
During the pandemic, the department remained focused on serving Canadians and organizations that receive grant and contribution funding. At the same time, the department worked to reduce the risk of additional delays and inaccuracies brought up by the increase in volume. To deliver the new emergency benefits and services successfully, it made sure there was enough staff to answer phones and process claims. As well, in-person staff received additional training to support clients as they transitioned from emergency benefits to Employment Insurance (EI). These changes also made sure that existing services were delivered consistently. To increase speed and accuracy of service delivery, 4 more programs now accept electronic copies of documents from applicants. In addition, the EI program leveraged email as a means of broadly engaging clients to support the timely dissemination of information. This approach was designed to enhance the existing paper correspondence that continue to be used.
New risks for fiscal year 2020 to 2021
The department responded to risks created by 2 unanticipated events: the severity of the COVID-19 pandemic and public concerns in Canada about systemic racism.
Maintain service to Canadians
Most of the department’s employees switched from working in an office to working from home to reduce the risk of spreading the COVID-19 virus. The department provided employees with home office kits and secure access to the department’s computer systems. This allowed the department to maintain service to Canadians. New tools allowed employees to stay connected while working from home. The department was also able to adjust administrative requirements with grant and contribution recipient organizations and introduce new flexibilities. This ensured that Canadians could continue to have timely access to programs and services.
Prevent the spread of the virus
The pandemic required that ESDC make decisions that provide employees across Canada with a safe work environment. Employees could not do all of the department’s work from home. This included network maintenance, technical support, and providing essential in-person services to Canadians.
The department implemented health and safety measures recommended by public health officials to keep employees and clients safe in the department’s workspaces. Hand sanitizer and personal protective equipment were available to employees and clients. Service Canada Centres were fitted with Plexiglas barriers. Tap-and-pay terminals were installed to reduce the spread of the virus.
Mental health
The pandemic also increased the risks of social isolation and mental health issues for employees and clients. The department created guidance for employees and made resources available for mental health and wellness. The department provided employees with frequent messages to help identify and access the programs and services that meet their needs. In addition, all front line and call centre employees were trained to help them better understand and serve Canadians whose mental health is affected by the pandemic.
Diversity and inclusion
The department continued to adopt innovative diversity and inclusion initiatives to address racism and systemic barriers. This helped the department become a more inclusive workplace. It worked with Indigenous partners to advance reconciliation, and recruit and support its Indigenous workforce. A team was created to spark discussions on issues experienced by Black employees. The department also consulted employees with disabilities to improve accessibility and to foster a culture of diversity and inclusion.
Rapid implementation of emergency benefit programs
The department had to launch the Canada Emergency Response Benefit quickly, it could not take the time normally required to develop a new program. Simpler eligibility rules allowed the department to deliver the benefits quickly to Canadians who needed financial support. The department created a rapid response team during the design phase that found new ways to confirm applicants’ eligibility, which reduces the risk of fraud and errors.
Emergency management
Public health measures in response to the pandemic activated the department’s business continuity plans. The departmental Crisis Management Team managed these plans and dealt with unforeseen issues. The department then re-examined its business lines for potential vulnerabilities. It also examined how to reduce risks related to these vulnerabilities. This new information was included in the department’s emergency management plans.
Analysis of trends in spending and human resources
This section presents an overview of the department’s financial and human resource expenditures for the fiscal year 2020 to 2021 compared with previous years.
This section contains the following subsections:
- Actual expenditures
- Actual human resources
- Expenditures by vote
- Financial statements and financial statements highlights
Actual expenditures
Departmental spending trend
ESDC expenditures on programs and services totalled $252.3 billion in fiscal year 2020 to 2021. Of this $252.3 billion, more than 95% directly benefitted Canadians through Employment Insurance (EI), the Canada Pension Plan (CPP), Old Age Security (OAS), Canada Emergency Response Benefits and other statutory transfer payment programs. Departmental expenditures were $3.0 billion in voted grants and contributions and $4.4 billion in gross operating expenditures.
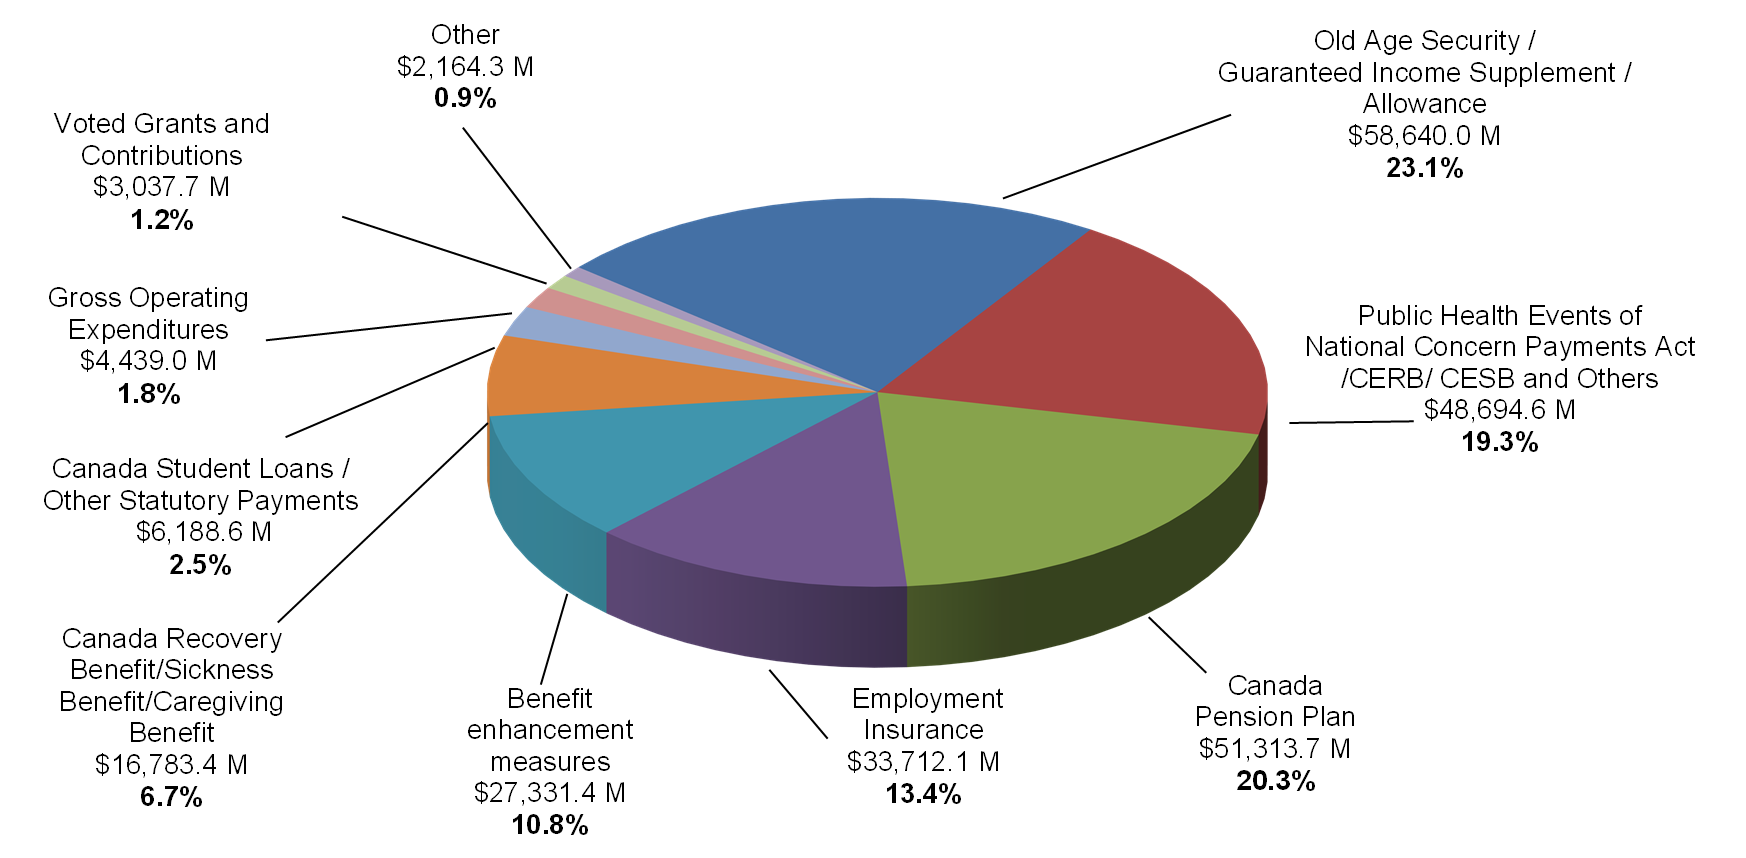
Text description of Figure 2:
Old Age Security; Guaranteed Income Supplement; Allowances: $58,640.0 million (23.1%)
Public Health Events of National Concern Payments Act; Canada Emergency Response Benefit; Canada Emergency Student Benefit, and others: $48,694.6 million (19.3%)
Canada Pension Plan: $51, 313.7 million (20.3%)
Employment Insurance: $33,712.1 million (13.4%)
Benefit enhancement measures: $27,331.4 million (10.8%)
Canada Recovery Benefit; Canada Recovery Sickness Benefit; Canada Recovery Caregiving Benefit: $16,783.4 million (6.7%)
Canada Student Loans; other statutory payments: $6,188.6 million (2.5%)
Gross Operating Expenditures: $4,439.0 million (1.8%)
Voted Grants and Contributions: $3,037.7 million (1.2%)
Other: $2,164.3 million (0.9%)
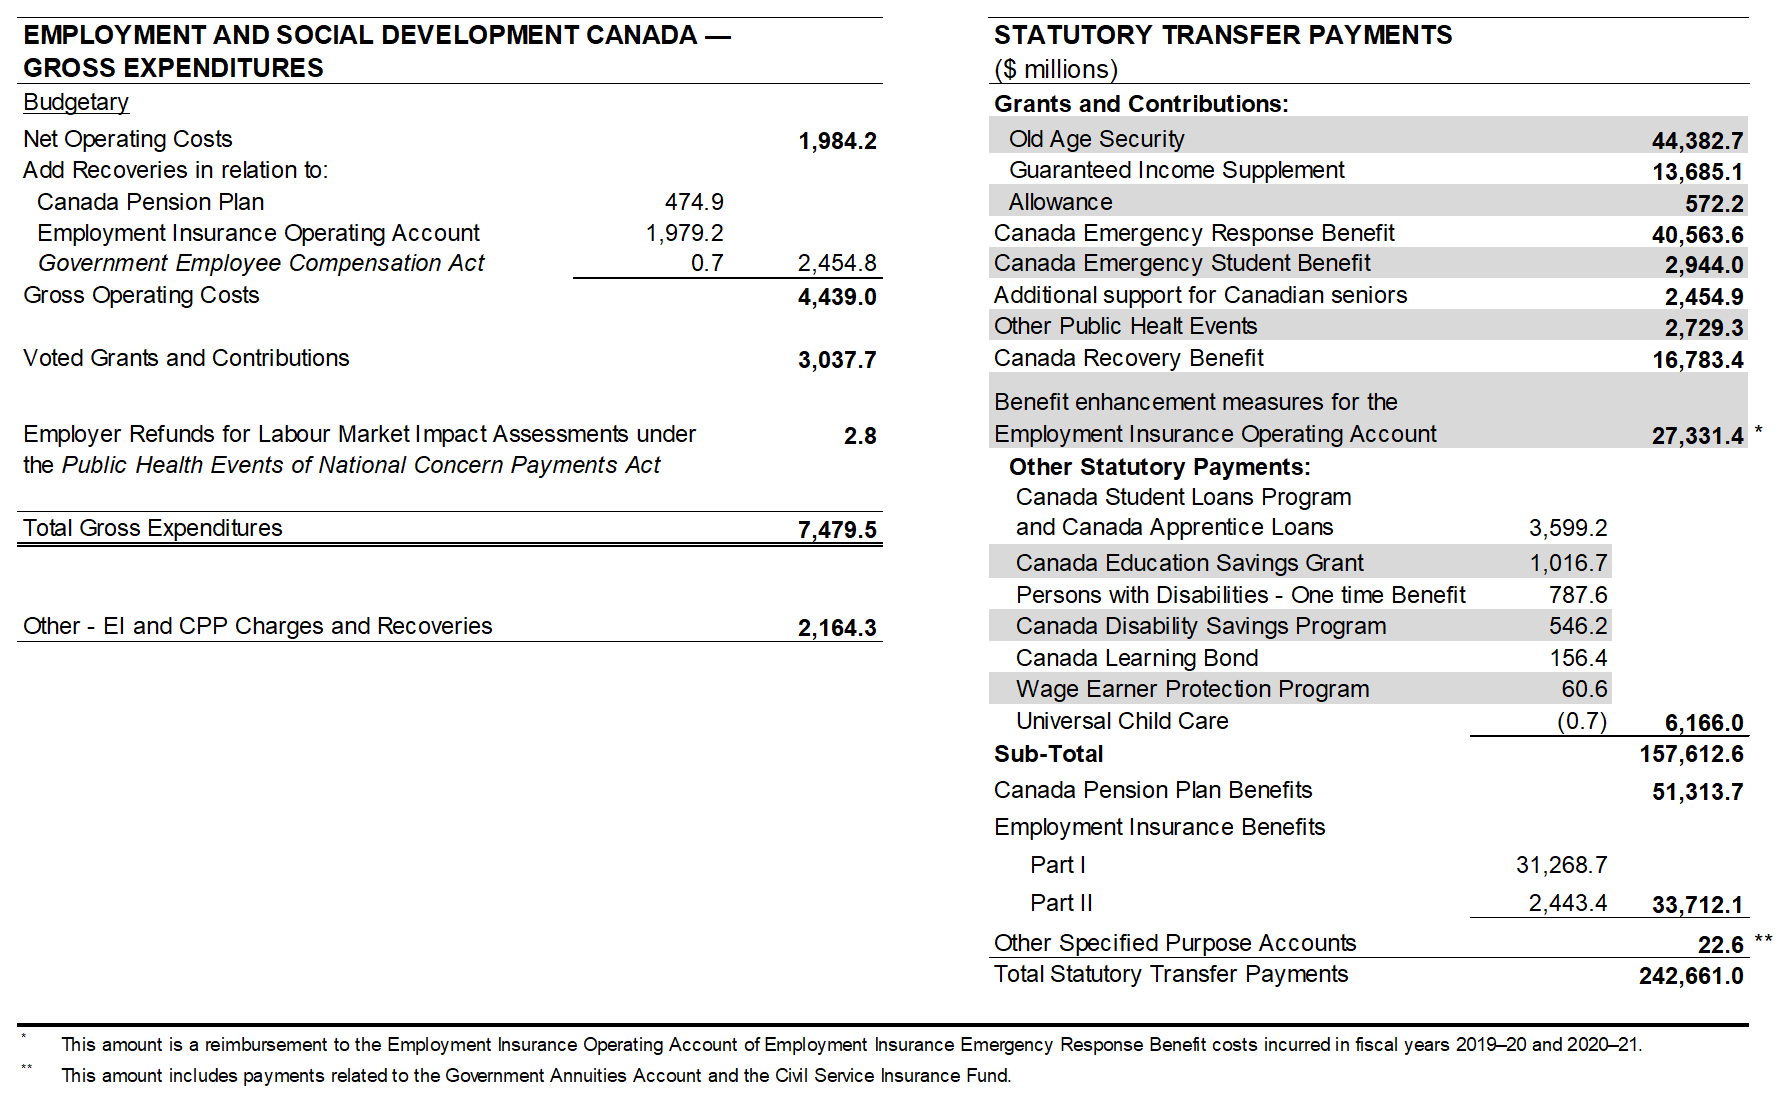
Text description of figure 3:
Gross expenditures ($ millions)
Budgetary
Net operating costs: 1,984.2
Add recoveries in relation to:
- Canada Pension Plan: 474.9
- Employment Insurance Operating Account: 1,979.2
- Government Employee Compensation Act: 0.7
- Total - recoveries: 2,454.8
Gross operating costs: 4,439.0
Voted Grants and Contributions: 3,037.7
Employer refunds for Labour Market Impact Assessments under the Public Health Events of National Concern Payments Act: 2.8
Total gross expenditures: 7,479.5
Other – EI and CPP charges and recoveries: 2,164.3
Statutory transfer payments ($ millions)
Grants and Contributions:
- Old Age Security: 44,382.7
- Guaranteed Income Supplement: 13,685.1
- Allowance: 572.2
- Canada Emergency Response Benefit: 40,563.6
- Canada Emergency Student Benefit: 2,944.0
- Additional support for Canadian seniors: 2,454.9
- Other public health events: 2,729.3
- Canada Recovery Benefit: 16,783.4
- Benefit enhancement measures for the Employment Insurance Operating Account: 27,331.4 [Note: This amount is a reimbursement to the Employment Insurance Operating Account of Employment Insurance Emergency Response Benefit costs incurred in fiscal years 2019 to 2020 and 2020 to 2021.
- Other statutory payments:
- Canada Student Loans Program and Canada Apprentice Loans: 3,599.2
- Canada Education Savings Grant: 1,016.7
- Persons with disabilities – One time benefit: 787.6
- Canada Disability Savings Program: 546.2
- Canada Learning Bond: 156.4
- Wage Earner protection Program: 60.6
- Universal Child Care Benefit: (0.7)
- Total – Other Statutory payments: 6,166.0
- Sub-total – Grants and Contributions: 157,612.6
Canada Pension Plan Benefits: 51,313.7
Employment Insurance Benefits:
- Part I: 31,268.7
- Part II: 2,443.4
- Total – EI Benefits: 33,712.1
Other Specified Purpose Accounts: 22.6 [Note: This amount includes payments related to the Government Annuities Account and the Civil Service Insurance Fund
Total – Statutory transfer payments: 242,661.0
ESDC’s financial framework
The department has a complex financial structure, with various funding mechanisms used to deliver its mandate. The department is financed by 4 main sources of funds:
- Appropriated funds from the Consolidated Revenue Fund (CRF)
- The Employment Insurance Operating Account
- The Canada Pension Plan
- Other government departments and Crown corporations
Some expenditures are excluded from the department’s Main and Supplementary Estimates and from net actual and planned spending because they are not voted by Parliament. These are:
- actual expenditures related to the Employment Insurance Operating Account and the Canada Pension Plan
- planned expenditures that are recovered from other government departments and Crown corporations for the delivery of programs and services on their behalf.
EI and CPP benefits and related administrative costs are charged against revenues set aside in separate specified purpose accounts as revenues netted against expenditures under the department.
These items are included in the department’s gross actual and planned spending. This provides readers with the full cost to government of the department’s programs and services. It also presents a complete picture of the resources the department manages to deliver its mandate. However, these expenditures are ultimately recorded under separate legal entities.
Departmental costs related to the delivery of programs and services on behalf of other government departments are also reported as revenues netted against the department’s expenditures. These costs are mainly for passport services and the administration of the Government Employee Compensation Act.
The government amended the Department of Employment and Social Development Act in June 2018. The goal was to broaden the department’s mandate to include the ability to deliver services to the public on behalf of partners, such as other government organizations. As a result, departmental costs related to the delivery of programs and services on behalf of other government departments are now reported under a statutory authority. An example of this would be passport services, reported as revenues netted against the department’s expenditures.
The sources of funds, including specified purpose accounts, for each of the department’s core responsibilities are as follows:
Core responsibility 1: Social development
- Consolidated Revenue Fund
Core responsibility 2: Pensions and benefits
- Consolidated Revenue Fund
- Canada Pension Plan (in gross actual spending only for Canada Pension Plan benefits and related administrative costs)
Core responsibility 3: Learning, skills development and employment
- Consolidated Revenue Fund
- Employment Insurance Operating Account (in gross actual spending only for Employment Insurance benefits and related administrative costs)
Core responsibility 4: Working conditions and workplace relations
- Consolidated Revenue Fund
- crown corporations and other departments (in gross actual spending only for the administration of the Government Employee Compensation Act)
Core responsibility 5: Information delivery and services for other departments
- Consolidated Revenue Fund
- other departments (in gross actual spending mainly for passport services)
Internal services
- Consolidated Revenue Fund
- Canada Pension Plan (in gross actual spending only for Canada Pension Plan administrative costs)
- Employment Insurance Operating Account (in gross actual spending only for Employment Insurance administrative costs)
- other departments (in gross actual spending mainly for passport services)
Financial highlights
The department is responsible for the direct delivery of programs such as the Old Age Security (OAS), the Canada Pension Plan (CPP), Employment Insurance (EI) and other statutory transfer payments. These programs can be affected by variances in the average number of beneficiaries and variances in the average benefit rates. This is the case for the OAS and Guaranteed Income Supplement (GIS) and for the CPP. For EI, spending can be influenced by many factors such as the number of eligible individuals claiming EI benefits. This number varies with the economy, the benefit rates and the implementation of any new initiatives. The combined effect of those programs explains the main increase in statutory spending in addition to the Canada Emergency Response Benefits and the EI Emergency Response Benefit.
In fiscal year 2020 to 2021, at $252.3 billion, the overall actual gross expenditures were $107.9 billion higher than fiscal year 2019 to 2020. This is mainly the result of an increase in statutory payments and the COVID-19 measures. The most significant measures being the Canada Emergency Response Benefit (CERB), which increased spending by $67.9 billion and the Canada Recovery Benefit added $16.8 billion spending. Other measures include: the Canada Emergency Student Benefit (CESB); additional support for Canadian seniors; support for provincial and territorial job training efforts; support for students and youth impacted by COVID-19; the Emergency Community Support Fund; Safe Restart for Indigenous Communities; Reaching Home; New Horizons for Seniors; Temporary Foreign Workers on farms; support for persons with disabilities (National Workforce Accessibility); personal support worker training; and measures to address labour shortages in long-term and home care.
Statutory payment increases include EI benefits which increased by $13.8 billion from fiscal year 2019 to 2020 to fiscal year 2020 to 2021. This increase is mainly due to a high unemployment rate in 2020 (9.5% in 2020 versus 5.8% in 2019).
OAS/GIS and CPP statutory payments followed their usual trend in 2020 to 2021. There were increases to OAS/GIS payments ($2.4 billion) and to CPP benefits ($2.3 billion) resulting from the aging population and the changes in average monthly benefits.
The figure below illustrates the department’s spending trend from fiscal year 2018 to 2019 to fiscal year 2021 to 2022. In fiscal year 2020 to 2021, the department spent a net amount of $162.3 billion in achieving its expected results.
| Core responsibilities and internal services | 2020 to 2021 Main Estimates | 2020 to 2021 planned spending | 2021 to 2022 planned spending See note 1 | 2022 to 2023 planned spending See note 1 | 2020 to 2021 total authorities available for use | 2020 to 2021 actual spending (authorities used) | 2019 to 2020 actual spending (authorities used) | 2018 to 2019 actual spending (authorities used) |
|---|---|---|---|---|---|---|---|---|
| Core responsibility 1: Social Development | 953,560,319 | 935,560,319 | 575,455,174 | 660,667,247 | 2,607,464,463 | 2,572,173,843 | 921,816,281 | 716,719,128 |
| Core responsibility 2: Pensions and benefits | 60,951,895,699 | 113,898,809,509 | 117,935,559,921 | 124,330,652,209 | 113,721,009,863 | 113,654,967,403 | 106,337,930,426 | 100,963,229,259 |
| Core responsibility 3: Learning, skills development and employment | 7,134,644,947 | 28,487,016,224 | 48,891,943,794 | 31,665,708,921 | 132,726,868,717 | 132,401,445,738 | 33,778,359,238 | 25,597,959,995 |
| Core responsibility 4: Working conditions and workplace relations | 306,797,291 | 306,797,291 | 182,334,289 | 178,895,665 | 178,472,061 | 175,405,872 | 169,857,914 | 320,589,879 |
| Core responsibility 5: Information delivery and services for other departments | 260,513,398 | 260,513,398 | 247,731,770 | 240,597,330 | 238,619,834 | 238,479,502 | 228,440,412 | 203,136,512 |
| Sub-total | 69,607,411,654 | 143,906,696,741 | 167,831,024,948 | 157,076,521,372 | 249,472,434,938 | 249,042,472,358 | 141,436,404,271 | 127,801,634,773 |
| Internal services | 908,717,800 | 908,717,800 | 994,208,569 | 899,079,534 | 1,127,313,326 | 1,098,016,943 | 1,019,312,762 | 897,483,438 |
| Other costs See note 2 | 0 | 1,873,588,211 | 1,958,381,868 | 1,970,407,384 | 2,164,112,153 | 1,164,304,558 | 1,953,487,716 | 1,564,951,081 |
| Vote netted revenues | (1,874,384,066) | 0 | 0 | 0 | 0 | 0 | 0 | 0 |
| Sub-total | (1,874,384,066) | 1,873,588,211 | 1,958,381,868 | 1,970,407,384 | 2,164,112,153 | 1,164,304,558 | 1,953,487,716 | 1,564,951,081 |
| Total | 68,641,745,388 | 146,689,002,752 | 170,783,615,385 | 159,946,008,290 | 252,763,860,417 | 252,304,793,859 | 144,409,204,749 | 130,264,069,292 |
Notes:
- planned spending for 2021 to 2022 and 2022 to 2023 is presented as per ESDC’s 2021 to 2022 Departmental Plan
- other costs include administrative costs of other government departments charged to the Employment Insurance operating Account and the Canada Pension Plan, it also includes Employment Insurance doubtful accounts and recoveries from other government departments, mainly related to Federal Worker’s Compensation costs and passport services delivery
- refer to the Department’s Financial Framework for a complete description of the departmental financial profile, including explanation of gross actual and planned spending
The overall increase of $122.0 billion from fiscal year 2018 to 2019, to fiscal year 2020 to 2021, actual gross spending are mainly due to the result of an increase in statutory payments related to the COVID-19 measures and to the CPP and the OAS benefits caused by the aging population and changes in the average monthly benefits. It also includes increases for EI benefits.
Under core responsibility 1, Social development, the increase of $1.8 billion from fiscal year 2018 to 2019 to fiscal year 2020 to 2021 actual spending is mainly due to the statutory payments related to the COVID-19 measures. In particular, Persons with Disabilities - One-Time Benefit Support ($795.3 million), Reaching Home ($394.0 million), Enhancement Emergency Community Services Stream ($349.7 million),Safe Restart for Indigenous Communities ($63.6 million) and the New Horizons for Seniors ($20.0 million), and the introduction of the new Indigenous Early Learning and Child Care Transformation Initiative implemented in fiscal year 2018 to 2019 ($120.0 million).
Under core responsibility 2, Pension and benefits, the overall gross increase of $12.7 billion from fiscal year 2018 to 2019 to fiscal year 2020 to 2021 actual spending can mainly be explained by increases in the number of beneficiaries and the average monthly benefits payments to OAS ($4.0 billion), the GIS ($1.3 billion), the CPP ($4.8 billion), and the additional support for Canadian seniors ($2.5 billion) related to the COVID-19 measures.
Under core responsibility 3, Learning, skills development and employment, the increase of $106.8 billion from fiscal year 2018 to 2019 to fiscal year 2020 to 2021 actual spending is mainly due to an increase in statutory payments related to the COVID-19 measures. In particular, the CERB program ($35.8 billion), EI Emergency Response Benefits ($27.3 billion), Canada Recovery Benefit ($16.8 billion), CESB ($2.9 billion), Workforce Development Agreements ($1.5 billion) and an increase on Canada Student Grants ($1.4 billion). There was also an increase in EI benefit payments ($13.8 billion).
Under core responsibility 4, Working conditions and workplace relations, there was a decrease of $145 million at gross from fiscal year 2018 to 2019 to fiscal year 2020 to 2021 actual spending. This is mostly attributable to a change in how the financial information is presented. The revenues related to Government Employees’ Compensation Act are now included in this core responsibility and are deducted from the expenses for the delivery of this program.
Under internal services, the increase of $200.5 million from fiscal year 2018 to 2019 to fiscal year 2020 to 2021 actual spending can mainly be explained by increases to spending in information technology to support program operations, and hiring additional resources to support during the COVID-19 pandemic.
Under other costs, there is a net variance of $599 million in actual spending from fiscal year 2018 to 2019 to fiscal year 2020 to 2021. This is mainly due to the revenues related to Government Employees’ Compensation Act that were included in other costs but are now included under core responsibility 4, Working conditions and workplace relations. The variance is also impacted by increased charges from other government departments to the CPP Account, notably the CPP Investment Board and Canada Revenue Agency. Finally, due to the amendment of the Department of Employment and Social Development Act in June 2018, departmental revenues related to the delivery of programs and services on behalf of other government departments are no longer included in other costs, but reported under a statutory authority.
| Core responsibilities and internal services | 2020 to 2021 Main Estimates | 2020 to 2021 planned spending | 2021 to 2022 planned spending See note 1 | 2022 to 2023 planned spending See note 1 | 2020 to 2021 total authorities available for use | 2020 to 2021 actual spending (authorities used) | 2019 to 2020 actual spending (authorities used) | 2018 to 2019 actual spending (authorities used) |
|---|---|---|---|---|---|---|---|---|
| Core responsibility 1: Social Development | 953,560,319 | 953,560,319 | 573,455,174 | 660,667,247 | 2,607,464,463 | 2,572,173,843 | 921,816,281 | 716,719,128 |
| Core responsibility 2: Pensions and benefits | 60,680,473,422 | 60,680,473,422 | 63,367,431,366 | 66,793,649,169 | 62,034,126,064 | 62,012,618,473 | 57,084,637,513 | 54,181,915,121 |
| Core responsibility 3: Learning, skills development and employment | 6,263,128,549 | 6,263,128,549 | 17,745,759,725 | 6,304,749,590 | 97,525,957,563 | 97,302,612,153 | 11,048,356,538 | 5,773,734,933 |
| Core responsibility 4: Working conditions and workplace relations | 180,897,291 | 180,897,291 | 181,434,289 | 177,995,665 | 177,572,063 | 174,698,277 | 169,172,902 | 175,398,724 |
| Core responsibility 5: Information delivery and services for other departments | 260,513,398 | 260,513,398 | 247,731,770 | 240,597,330 | 238,619,834 | 238,479,502 | 228,440,412 | 74,870,918 |
| Sub-total | 68,338,572,979 | 68,338,572,979 | 82,115,812,324 | 74,177,659,001 | 162,583,739,987 | 162,300,582,248 | 69,452,423,646 | 60,922,638,824 |
| Internal services | 303,172,409 | 303,172,409 | 323,908,566 | 291,287,603 | 351,127,837 | 336,724,368 | 376,339,480 | 279,511,995 |
| Total | 68,641,745,388 | 68,641,745,388 | 82,439,720,890 | 74,468,946,604 | 162,934,867,824 | 162,637,306,616 | 69,828,763,126 | 61,202,150,819 |
Notes:
- planned spending for 2021 to 2022 and 2022 to 2023 is presented as per ESDC’s 2021 to 2022 Departmental Plan
- refer to the Department’s Financial Framework for a complete description of the departmental financial profile, including explanation of gross actual and planned spending
Departmental spending trend: Total net consolidated expenditures (dollars)
The figure below illustrates the department’s spending trend from fiscal year 2018 to 2019, to fiscal year 2023 to 2024. In fiscal year 2020 to 2021, the department spent a net amount of $162.6 billion in achieving its expected results. Planned spending presented from fiscal year 2021 to 2022 to fiscal year 2023 to 2024 corresponds to planned spending presented in the 2021 to 2022 Departmental Plan.
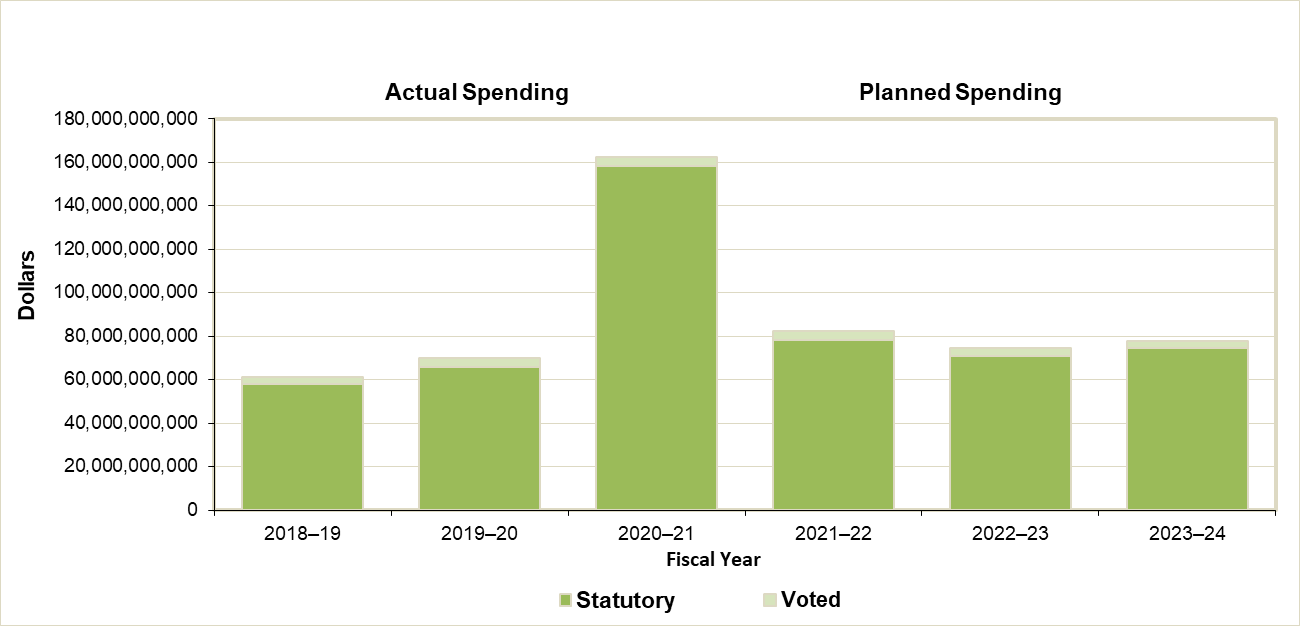
Text description of figure 4:
Actual spending
- 2018 to 2019
- Statutory: 57,839,469,633
- Voted (see note): 3,362,681,186
- Total: 61,202,150,819
- 2019 to 2020
- Statutory : 65,760,590,856
- Voted: 4,068,172,270
- Total: 69,828,763,126
- 2020 to 2021
- Statutory: 158,494,988,839
- Voted: 4,142,317,777
- Total: 162,637,306,616
Planned spending
- 2021 to 2022
- Statutory: 78,255,245,276
- Voted: 4,184,475,614
- Total: 82,439,720,890
- 2022 to 2023
- Statutory: 70,788,992,965
- Voted: 3,679,953,639
- Total: 74,468,946,604
- 2023 to 2024
- Statutory: 74,511,964,424
- Voted: 3,273,641,062
- Total: 77,785,605,486
Note: voted expenditures include debt write-offs in 2018 to 2019, 2019 to 2020 and 2020 to 2021.
| Core responsibilities and Internal Services | 2020 to 2021 actual gross spending | Minus: 2020 to 2021 actual gross spending in specified purpose accounts | Minus: 2020 to 2021 actual revenues netted against expenditures | 2020 to 2021 actual net spending |
|---|---|---|---|---|
| Core responsibility 1: Social Development | 2,572,173,843 | 0 | 0 | 2,572,173,843 |
| Core responsibility 2: Pensions and Benefits | 113,654,967,403 | 51,313,650,426 | 328,698,504 | 62,012,618,473 |
| Core responsibility 3: Learning, Skills Development and Employment | 132,401,445,738 | 33,734,727,167 | 1,364,106,418 | 97,302,612,153 |
| Core responsibility 4: Working Conditions and Workplace Relations | 175,405,872 | 0 | 707,595 | 174,698,277 |
| Core responsibility 5: Information Delivery and Services for Other Departments | 238,479,502 | 0 | 0 | 238,479,502 |
| Sub-total | 249,042,472,358 | 85,048,377,593 | 1,693,512,517 | 162,300,582,248 |
| Internal Services | 1,098,016,943 | 0 | 761,292,575 | 336,724,368 |
| Other costs (see note 1) | 2,164,304,558 | 2,164,304,558 | 0 | 0 |
| Total | 252,304,793,859 | 87,212,682,151 | 2,454,805,092 | 162,637,306,616 |
Notes:
- other costs include administrative costs of other government departments charged to the Employment Insurance Operating Account and the Canada Pension Plan. They also include Employment Insurance doubtful accounts and recoveries from other government departments
- refer to the Department’s Financial Framework for a complete description of the departmental financial profile, including explanation of gross planned spending
Actual human resources
| Core responsibilities and internal services | 2018 to 2019 actual (see note) | 2019 to 2020 actual | 2020 to 2021 planned | 2020 to 2021 actual | 2021 to 2022 planned (see note) | 2022 to 2023 planned (see note) |
|---|---|---|---|---|---|---|
| Core responsibility 1: Social Development | 382 | 457 | 559 | 538 | 566 | 560 |
| Core responsibility 2: Pensions and benefits | 5,333 | 5,665 | 5,530 | 6,159 | 6,221 | 6,068 |
| Core responsibility 3: Learning, skills development and employment | 10,779 | 10,954 | 10,263 | 13,895 | 12,193 | 9,848 |
| Core responsibility 4: Working conditions and workplace relations | 668 | 690 | 782 | 763 | 801 | 784 |
| Core responsibility 5: Information delivery and services for other departments | 2,036 | 2,086 | 2,513 | 1,708 | 2,411 | 2,369 |
| Sub-total | 19,198 | 19,852 | 19,647 | 23,063 | 22,192 | 19,629 |
| Internal services | 4,598 | 4,855 | 4,745 | 5,233 | 4,879 | 4,648 |
| Total | 23,796 | 24,707 | 24,392 | 28,296 | 27,071 | 24,277 |
Note: planned full-time equivalents for 2021 to 2022 and 2022 to 2023 are presented as per the 2021 to 2022 Departmental Plan.
The overall increase of 4,500 in actual full-time equivalents from fiscal year 2018 to 2019, to fiscal year 2020 to 2021 is mainly explained by the following:
- under Pensions and Benefits, the overall increase of 826 FTEs is mainly due to the spending of additional funds and FTEs to address CPP and OAS workload. As for the variance between the fiscal year 2020 to 2021 planned and actual FTEs, the increase is mainly due to additional funding for investments in processing-related activities to ensure that seniors have timely access to OAS benefits. This was approved during the fiscal year and therefore had not been factored in the fiscal year 2020 to 2021 planned FTEs
- under Learning, Skills Development and Employment, the overall increase in actual FTEs of 3,116 from fiscal year 2018 to 2019, to fiscal year 2020 to 2021 is mainly due to Employment Insurance (EI) measures to address increased EI workload and other EI-related needs. As for the variance between fiscal year 2020 to 2021 planned and actual FTEs, it is due to additional funding approved during the fiscal year, and therefore was not factored in the fiscal year 2020 to 2021 planned FTEs. It covers activities such as additional staff hired to process EI claims, as well as to improve call centre accessibility
- under Information Delivery and Services for Other Departments, the decrease of 328 FTEs from fiscal year 2018 to 2019, to fiscal year 2020 to 2021 is mainly due to the decrease in passport volumes and the postponement of several activities due to the COVID-19 pandemic in fiscal year 2020 to 2021
- under Internal Services, there is an increase of 635 FTEs from fiscal year 2018 to 2019 to fiscal year 2020 to 2021 actual FTEs. This increase is mainly due to the increased responsibilities of the Strategic and Service Policy Branch to provide advice on strategic and horizontal policy in support of the department’s mandate and also for Innovation, Information and Technology Branch to support program operations
Expenditures by vote
For information on Employment and Social Development Canada’s organizational voted and statutory expenditures, consult the Public Accounts of Canada 2020 to 2021.
Government of Canada spending and activities
Information on the alignment of Employment and Social Development Canada’s spending with the Government of Canada’s spending and activities is available in GC InfoBase.
Financial statements and financial statements highlights
The financial highlights are intended to serve as a general overview of Employment and Social Development Canada’s (ESDC’s) financial position and operations.
The following condensed consolidated financial statements are prepared in accordance with the Government’s accounting policies, which are based on Canadian public sector accounting standards and are therefore different from reporting on the use of authorities, reflected in the rest of this report. Reconciliation between authorities used and the net cost of operations is set out in Note 3 of the department’s consolidated financial statements.
These consolidated financial statements include the transactions of the Employment Insurance Operating Account, a sub-entity under the control of ESDC. The accounts of this sub-entity have been consolidated with those of ESDC and all inter-organizational balances and transactions have been eliminated. The Canada Pension Plan (CPP) is excluded from ESDC’s reporting entity because it is managed by both the Government of Canada and the provinces. Changes to the CPP require the agreement of at least two-thirds of the provinces, representing at least two-thirds of the population of all the provinces.
Financial statements
ESDC’s consolidated financial statements (unaudited) for the year ended March 31, 2021, are available on the departmental website.
Financial statements highlights
| Financial information | 2020 to 2021 planned results (see note) | 2020 to 2021 actual results | 2019 to 2020 actual results | Difference (2020 to 2021 actual results minus 2020 to 2021 planned results) | Difference (2020 to 2021 actual results minus 2019 to 2020 actual results) |
|---|---|---|---|---|---|
| Total expenses | 92,857,176,050 | 196,322,952,490 | 94,183,295,515 | 103,465,776,440 | 102,139,656,975 |
| Total revenues | 23,932,414,426 | 23,372,690,160 | 23,105,015,386 | (559,724,266) | 267,674,774 |
| Net cost of operations before government funding and transfers | 68,924,761,624 | 172,950,262,330 | 71,078,280,129 | 104,025,500,706 | 101,871,982,201 |
Note: the unaudited departmental future-oriented statement of operations can be found on ESDC’s website.
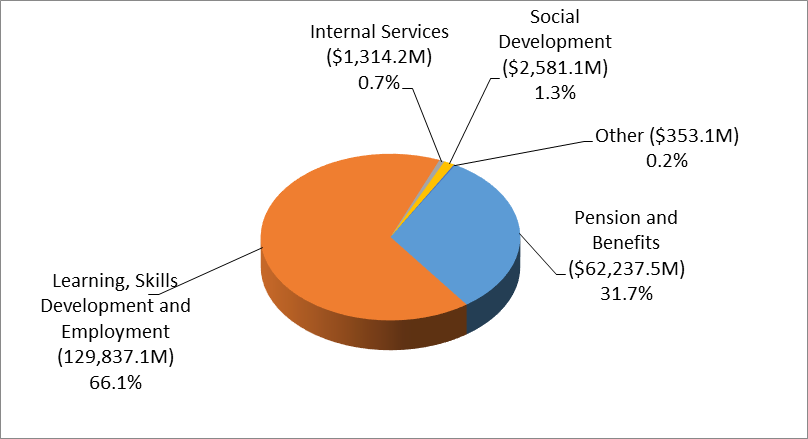
Text description of figure 5:
- Learning, Skills Development and Employment: $129,837.1 million (66.1%)
- Pensions and Benefits: $62,237.5 million (31.7%)
- Social Development: $2,581.1 million (1.3%)
- Internal Services: $1,314.2 million (0.7%)
- Other: $353.1 million (0.2%)
Actual over planned
The fiscal year 2020 to 2021 expenses were $103,465.8 million higher than planned. The variance is mainly attributable to the COVID-19 emergency care and support benefits.
Actual year over year
Total expenses for fiscal year 2020 to 2021, amounted to $196,323.0 million, an increase of $102,139.7 million over the previous year’s total expenses of $94,183.3 million. The increase in expenses is mainly explained by:
- an increase of $95,283.8 million in Learning, Skills Development and Employment expenses mainly due to the emergency care and support benefits as well as increased EI benefits due to the COVID-19 pandemic
- an increase of $4,891.1 million in Pension and Benefits expenses mainly due to the one-time COVID-19 benefit payment for seniors, as well as an increase in the eligible population for OAS and GIS caused by the growing aging population and the increase in the maximum monthly benefit payable
- an increase of $1,649.1 million in Social Development expenses mainly due to additional support for programs to address the impacts of the COVID-19 pandemic such as the one-time benefit support payment to persons with disabilities
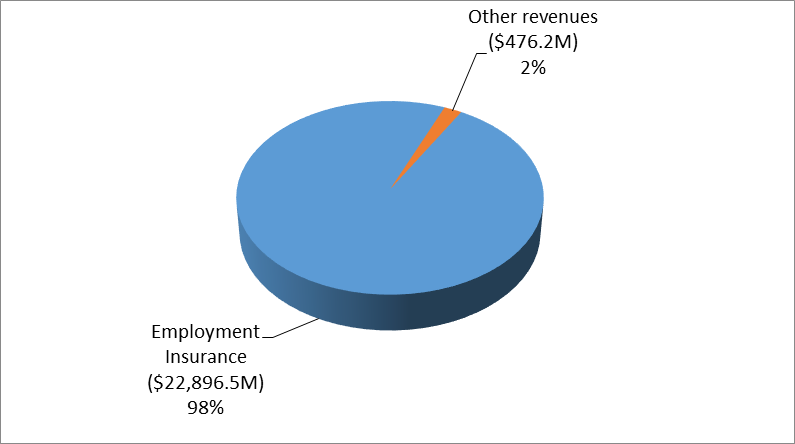
Text description of figure 6:
- Employment Insurance: $22,896.5 million (98%)
- Other revenues: $476.2 million (2%)
Actual over planned
The fiscal year 2020 to 2021 revenues were $559.7 million lower than planned. The variance is mainly attributable to a reduction in interest revenues. To support borrowers during the COVID-19 pandemic the Government of Canada suspended repayments of Canada Student Loans and Canada Apprentice Loans for the period of March 30, 2020 to September 30, 2020. During this time, no interest accrued on these loans.
Actual year over year
Total revenues for the fiscal year 2020 to 2021 year amounted to $23,372.7 million, an increase of $267.7 million over the previous year's total revenues of $23,105.0 million. The majority of this increase can be explained by:
- an increase of $182.9 million in Employment Insurance premiums mainly due to annual increases in maximum insurance earnings and an increase in average wages
- an increase of $100.2 million in recovery of CPP administrative costs mainly due to increased CPP workload caused by the aging population and for compensation adjustments related to new collective agreements
| Financial information | Fiscal year 2020 to 2021 | Fiscal year 2019 to 2020 | Difference (fiscal year 2020 to 2021 minus fiscal year 2019 to 2020) |
|---|---|---|---|
| Total net financial assets | 31,771,814,726 | 26,618,268,081 | 5,153,546,645 |
| Total net liabilities | 7,963,172,974 | 9,333,970,307 | (1,370,797,333) |
| Department net financial asset | 23,808,641,752 | 17,284,297,774 | 6,524,343,978 |
| Total non-financial assets | 401,958,044 | 301,056,088 | 100,901,956 |
| Department net financial position | 24,210,599,796 | 17,585,353,862 | 6,625,245,934 |
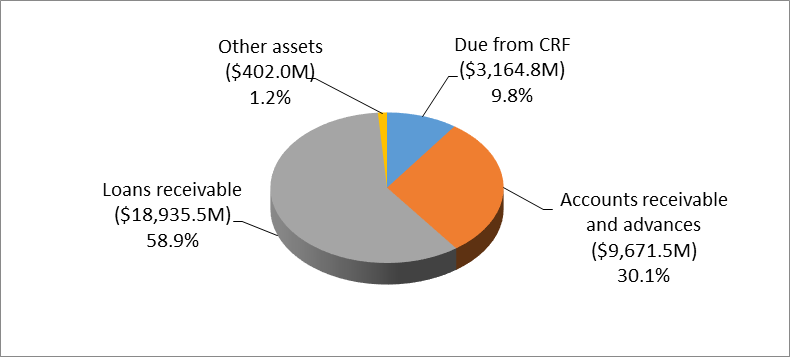
Text description of figure 7:
- Loans receivable: $18,935.5 million (58.9%)
- Accounts receivable and advances: $9,671.5 million (30.1%)
- Due from Consolidated Revenue Fund: $3,164.8 million (9.8%)
- Other assets: $402.0 million (1.2%)
Total assets (including financial and non-financial assets) amounted to $32,173.8 million as at March 31, 2021. This was an increase of $5,254.5 million over the previous year's total assets of $26,919.3 million. The increase in assets is mainly due to an increase in accounts receivable and advances caused by emergency care and support benefit overpayments to be recovered.
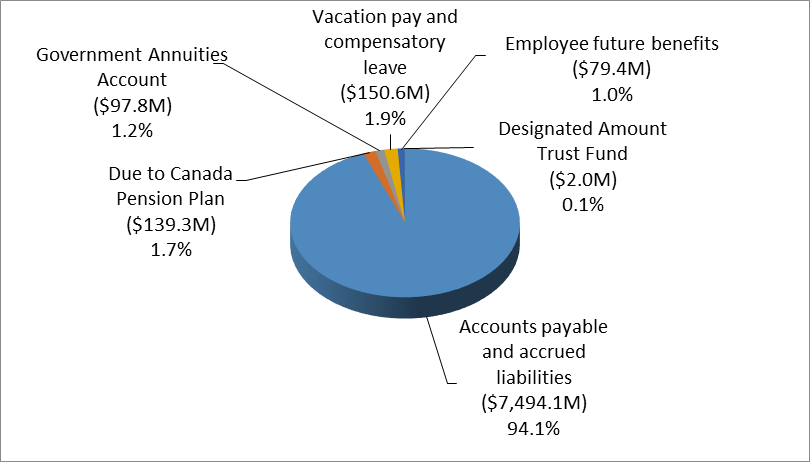
Text description of figure 8:
- Accounts payable and accrued liabilities: $7,494.1 million (94.1%)
- Vacation pay and compensatory leave: $150.6 million (1.9%)
- Due to Canada Pension Plan: $139.3 million (1.7%)
- Government Annuities Account: $97.8 million (1.2%)
- Employee future benefits: $79.4 million (1.0%)
- Designated amount trust fund: $2.0 million (0.1%)
Total liabilities amounted to $7,963.2 million as at March 31, 2021, a decrease of $1,370.8 million over the previous year's total liabilities of $9,334.0 million. The decrease is mainly due to a decrease in accounts payable to individuals for the emergency care and support benefits payable to individuals.
Corporate information
Organizational profile
Appropriate ministers:
The Honourable Carla Qualtrough
The Honourable Ahmed Hussen
The Honourable Filomena Tassi
The Honourable Deb Schulte
Institutional head:
Graham Flack, Deputy Minister, Employment and Social Development
Ministerial portfolio:
Minister of Employment, Workforce Development and Disability Inclusion
Minister of Families, Children and Social Development
Minister of Labour
Minister of Seniors
Enabling instrument:
Department of Employment and Social Development Act (S.C. 2005, c. 34); additional information on acts and regulations can be found on the Employment and Social Development Canada website.
Year of incorporation / commencement:
2005
Other: For more information on the department’s role, please visit the Employment and Social Development Canada website.
Raison d’être, mandate and role: who we are and what we do
“Raison d’être, mandate and role: who we are and what we do” is available on the Employment and Social Development Canada’s website.
For more information on the department’s organizational mandate letter commitments, see the Ministers' mandate letters.
Reporting framework
Employment and Social Development Canada’s Departmental Results Framework and Program Inventory of record for 2020 to 2021 are shown below.
Core responsibility 1: Social development
Description: increase inclusion and opportunities for participation of Canadians in their communities.
Departmental result 1: homelessness is prevented and reduced.
Indicator: reduction in the estimated number of shelter users who are chronically homeless
Departmental result 2: not-for-profit organizations, communities, and other groups have an enhanced capacity to address a range of social issues such as the social inclusion of people with disabilities, the engagement of seniors and support for children and families.
Indicator: for every dollar invested through the Social Development Partnerships Program, amount leveraged/invested by non-federal partners
Departmental result 3: barriers to accessibility for people with disabilities are removed.
Indicator: number of community spaces and workplaces that are more accessible due to Enabling Accessibility Fund funding
Departmental result 4: access to early learning and child care is increased.
Indicator 1: number of children in regulated child care spaces and/or early learning programs and number of children receiving subsidies or other financial supports.
Departmental result 5: clients receive high quality, timely and efficient services that meet their needs.
Indicator: service standard target for Social Development program priority service, as defined by the Government of Canada’s Policy on Service, was met
Program inventory
- Reaching Home
- Social Development Partnerships Program
- New Horizons for Seniors Program
- Enabling Accessibility Fund
- Early Learning and Child Care
- Indigenous Early Learning and Child Care Transformation Initiative
- Canadian Benefit for Parents of Young Victims of Crime
- Accessible Canada Initiative
- Sustainable Development Goals Funding Program
- Social Innovation and Social Finance Strategy
Core responsibility 2: Pensions and benefits
Description: assist Canadians in maintaining income for retirement, and provide financial benefits to survivors, people with disabilities and their families.
Departmental result 1: seniors have income support for retirement
Indicator 1: percentage of seniors receiving the Old Age Security pension in relation to the estimated total number of eligible seniors
Indicator 2: percentage of seniors receiving the Guaranteed Income Supplement in relation to the estimated total number of eligible seniors
Indicator 3: percentage of Canada Pension Plan contributors aged 70+ receiving retirement benefits
Indicator 4: percentage of seniors living in poverty
Departmental result 2: people with disabilities and their families have financial support
Indicator 1: percentage of Canada Pension Plan contributors who have contributory eligibility for Canada Pension Plan disability benefits and therefore have access to financial support in the event of a severe and prolonged disability
Indicator 2: percentage of Canadians eligible for the Disability Tax Credit who have a Registered Disability Savings Plan to encourage private savings
Indicator 3: percentage of Registered Disability Savings Plan beneficiaries that have received a grant and/or a bond to assist them and their families to save for their long-term financial security
Departmental result 3: clients receive high-quality, timely and efficient services that meet their needs
Indicator : number of service standard targets for Pensions and Benefits program priority services, as defined by the Government of Canada’s Policy on Service, that are being met
Key measure 1: percentage of Canada Pension Plan retirement benefits paid within the first month of entitlement
Key measure 2: percentage of decisions on applications for a Canada Pension Plan disability benefit made within 120 calendar days
Key measure 3: percentage of Old Age Security basic benefits paid within the first month of entitlement
Program inventory
- Old Age Security
- Canada Pension Plan
- Canada Disability Savings Program
Core responsibility 3: Learning, skills development and employment
Description: help Canadians access post-secondary education, obtain the skills and training needed to participate in a changing labour market and provide supports to those who are temporarily unemployed.
Departmental result 1: Canadians access education, training and lifelong learning supports to gain the skills and work experience they need
Indicator 1: number of Canadians receiving training and/or employment supports through federally administered programs
Indicator 2: number of Canadians receiving provincially and territorially delivered skills training and employment services supported by Government of Canada funding transfers
Indicator 3: employment or returns to school following training/supports through federally administered programs
Indicator 4: employment or returns to school following provincially and territorially delivered skills training and employment services supported by Government of Canada funding transfers
Indicator 5: percentage of Canadians aged 18 to 24 that are enrolled in university or college
Indicator 6: percentage change in Canadians aged 25 to 64 enrolled in university or college
Departmental result 2: Canadians participate in an inclusive and efficient labour market
Indicator 1: employment rate for Canadians
Indicator 2: employment rate for Indigenous people off reserve
Indicator 3: employment rate for Indigenous people on reserve
Indicator 4: employment rate for recent immigrants
Indicator 5: employment rate for persons with disabilities
Indicator 6: employment rate for youth
Indicator 7: employment rate for women
Indicator 8: employment rate for older Canadians
Indicator 9: employment rate for lone parents
Indicator 10: unemployment-to-job vacancies (ratio)
Departmental result 3: Canadians receive financial support during employment transitions such as job loss, illness, or maternity/parental leave
Indicator 1: percentage of workers losing their job in the previous year that were eligible for Employment Insurance, as measured by the percentage of insured unemployed workers that qualify for Employment Insurance
Indicator 2: percentage of Employment Insurance claimants finding employment before the end of their benefit entitlement, as measured by the proportion of Employment Insurance regular benefits claimants who do not use all their benefit entitlement
Departmental result 4: more students from low- and middle-income families access and participate in post-secondary education
Indicator 1: proportion of low- and middle-income Canadian young adults participating in post-secondary education
Indicator 2: percentage of beneficiaries with a Registered Education Savings Plan (RESP) withdrawal that have ever received an additional amount of Canada Education Savings Grant (CESG) and/or Canada Learning Bond (CLB), which are available only to children from low- and middle-income families, as compared to the total population of beneficiaries
Indicator 3: percentage of full-time students (all ages) who used federal student financial assistance to help finance their participation in post-secondary education
Departmental result 5: clients receive high-quality, timely and efficient services that meet their needs
Indicator: number of service standard targets for Learning, Skills Development and Employment program priority services, as defined by the Government of Canada’s Policy on Service, that are being met
Key measure 1: percentage of Employment Insurance benefit payments or non-benefit notifications issued within 28 days of filing
Key measure 2: percentage of Employment Insurance requests for reconsideration reviewed within 30 days of filing
Key measure 3: percentage of Social Insurance Numbers applied for through the Newborn Registration Service issued within 10 business days
Program inventory
- Employment Insurance
- Labour Market Development Agreements
- Workforce Development Agreements
- Opportunities Fund for Persons with Disabilities
- Job Bank
- Youth Employment and Skills Strategy
- Skills and Partnership Fund
- Literacy and Essential Skills
- Indigenous Skills and Employment Training Program
- Student Work Placement Program
- Union Training and Innovation Program
- Sectoral Initiatives Program
- Foreign Credential Recognition Program
- Temporary Foreign Workers Program
- Enabling Fund for Official Language Minority Communities
- Canada Student Loans Program and Canada Apprentice Loans
- Canada Education Savings Program
- Apprenticeship Grants
- Skilled Trades and Apprenticeship (Red Seal) Program
- Canada Service Corps
- Skilled Trades Awareness and Readiness Program
- Future Skills
- Support for Student Learning
Core responsibility 4: Working conditions and workplace relations
Description: promotes safe, healthy, fair and inclusive work conditions and cooperative workplace relations.
Departmental result 1: workplaces are safe and healthy
Indicator: number of health and safety violations identified under the Canada Labour Code (Part II) per 1,000 federally regulated employees
Departmental result 2: work conditions are fair and inclusive
Indicator 1: percentage of Legislated Employment Equity Program employers whose representation equals or surpasses Canadian labour market availability for 2+ designated groups or who demonstrated progress towards representation since the previous reporting period
Indicator 2: 3-year average number of founded violations identified under Part III of the Canada Labour Code per 1,000 federally regulated employees
Departmental result 3: labour relations are cooperative
Indicator: percentage of labour disputes settled under the Canada Labour Code (Part I) without work stoppages, where parties were assisted by Labour Program officers
Departmental result 4: clients receive high quality, timely and efficient services that meet their needs
Indicator: number of service standard targets for Working Conditions and Workplace Relations program priority services, as defined by the Government of Canada’s Policy on Service, that are being met
Key measure 1: percentage of occupational health and safety cases each fiscal year that are finalized within 120 days (excluding prosecutions, appeals, and technical surveys)
Key measure 2: percentage of unjust dismissal complaints that are finalized within 180 days
Key measure 3: percentage of conciliators assigned under the Canada Labour Code within 15 calendar days of receiving requests that are compliant with Canada Industrial Relations Regulations
Key measure 4: percentage of initial Wage Earner Protection Program payments and non-payment notifications issued within 35 calendar days
Program inventory
- Labour Relations
- Federal Workers’ Compensation
- Occupational Health and Safety
- Workplace Equity
- Labour Standards
- Wage Earner Protection Program
- International Labour Affairs
Core responsibility 5: Information delivery and services for other departments
Description: provide information to the public on the programs of the Government of Canada and the department, and provide services on behalf of other government departments.
Departmental result 1: clients receive high quality, timely and accurate government information and services that meet their needs
Indicator 1: 1 800 O-Canada information completeness, relevancy and accuracy assessment
Indicator 2: percentage of clients served in person who received assistance within 25 minutes
Indicator 3: number of program services that meet their service standard targets
Departmental result 2: Canadians can obtain a passport within Canada in a timely manner
Indicator: percentage of travel documents and other passport services processed within standards
Program inventory
- Government of Canada Telephone General Enquiries Services
- Government of Canada Internet Presence
- In-Person Points of Service
- Passport
- Other Government Department Programs
Supporting information on the program inventory
Financial, human resources and performance information for Employment and Social Development Canada’s Program Inventory is available in GC InfoBase.
Supplementary information tables
The following supplementary information tables are available on Employment and Social Development Canada’s website:
Federal tax expenditures
The tax system can be used to achieve public policy objectives through the application of special measures such as low tax rates, exemptions, deductions, deferrals and credits. The Department of Finance Canada publishes cost estimates and projections for these measures each year in the Report on Federal Tax Expenditures. This report also provides detailed background information on tax expenditures, including descriptions, objectives, historical information and references to related federal spending programs as well as evaluations and GBA plus of tax expenditures.
Organizational contact information
Portage IV
140 Promenade du Portage
Gatineau QC K1A 0J9
Telephone: 1-800-622-6232
Toll-free: 1-800-622-6232
Website: www.canada.ca/en/employment-social-development.html
Email: NC-SPR-PSR-CPMD-DPMG-GD@hrsdc-rhdcc.gc.ca
Appendix: definitions
appropriation (crédit)
Any authority of Parliament to pay money out of the Consolidated Revenue Fund.
budgetary expenditures (dépenses budgétaires)
Operating and capital expenditures; transfer payments to other levels of government, organizations or individuals; and payments to Crown corporations.
core responsibility (responsabilité essentielle)
An enduring function or role performed by a department. The intentions of the department with respect to a core responsibility are reflected in one or more related departmental results that the department seeks to contribute to or influence.
Departmental Plan (plan ministériel)
A report on the plans and expected performance of an appropriated department over a 3‑year period. Departmental Plans are usually tabled in Parliament each spring.
departmental priority (priorité)
A plan or project that a department has chosen to focus and report on during the planning period. Priorities represent the things that are most important or what must be done first to support the achievement of the desired departmental results.
departmental result (résultat ministériel)
A consequence or outcome that a department seeks to achieve. A departmental result is often outside departments’ immediate control, but it should be influenced by program-level outcomes.
departmental result indicator (indicateur de résultat ministériel)
A quantitative measure of progress on a departmental result.
departmental results framework (cadre ministériel des résultats)
A framework that connects the department’s core responsibilities to its departmental results and departmental result indicators.
Departmental Results Report (rapport sur les résultats ministériels)
A report on a department’s actual accomplishments against the plans, priorities and expected results set out in the corresponding Departmental Plan.
experimentation (expérimentation)
The conducting of activities that seek to first explore, then test and compare the effects and impacts of policies and interventions in order to inform evidence-based decision-making, and improve outcomes for Canadians, by learning what works, for whom and in what circumstances. Experimentation is related to, but distinct from innovation (the trying of new things), because it involves a rigorous comparison of results. For example, using a new website to communicate with Canadians can be an innovation; systematically testing the new website against existing outreach tools or an old website to see which one leads to more engagement, is experimentation.
full‑time equivalent (équivalent temps plein)
A measure of the extent to which an employee represents a full person‑year charge against a departmental budget. For a particular position, the full‑time equivalent figure is the ratio of number of hours the person actually works divided by the standard number of hours set out in the person’s collective agreement.
gender-based analysis plus (GBA plus) (analyse comparative entre les sexes plus [ACS+])
An analytical process used to assess how diverse groups of women, men and gender-diverse people experience policies, programs and services based on multiple factors including race ethnicity, religion, age, and mental or physical disability.
government-wide priorities (priorités pangouvernementales)
For the purpose of the 2020 to 2021 Departmental Results Report, those high-level themes outlining the government’s agenda in the 2019 Speech from the Throne, namely: Fighting climate change; Strengthening the Middle Class; Walking the road of reconciliation; Keeping Canadians safe and healthy; and Positioning Canada for success in an uncertain world.
horizontal initiative (initiative horizontale)
An initiative where 2 or more federal organizations are given funding to pursue a shared outcome, often linked to a government priority.
non‑budgetary expenditures (dépenses non budgétaires)
Net outlays and receipts related to loans, investments and advances, which change the composition of the financial assets of the Government of Canada.
performance (rendement)
What an organization did with its resources to achieve its results, how well those results compare to what the organization intended to achieve, and how well lessons learned have been identified.
performance indicator (indicateur de rendement)
A qualitative or quantitative means of measuring an output or outcome, with the intention of gauging the performance of an organization, program, policy or initiative respecting expected results.
performance reporting (production de rapports sur le rendement)
The process of communicating evidence‑based performance information. Performance reporting supports decision making, accountability and transparency.
plan (plan)
The articulation of strategic choices, which provides information on how an organization intends to achieve its priorities and associated results. Generally, a plan will explain the logic behind the strategies chosen and tend to focus on actions that lead to the expected result.
planned spending (dépenses prévues)
For Departmental Plans and Departmental Results Reports, planned spending refers to those amounts presented in Main Estimates.
A department is expected to be aware of the authorities that it has sought and received. The determination of planned spending is a departmental responsibility, and departments must be able to defend the expenditure and accrual numbers presented in their Departmental Plans and Departmental Results Reports.
program (programme)
Individual or groups of services, activities or combinations thereof that are managed together within the department and focus on a specific set of outputs, outcomes or service levels.
program inventory (répertoire des programmes)
Identifies all the department’s programs and describes how resources are organized to contribute to the department’s core responsibilities and results.
result (résultat)
A consequence attributed, in part, to an organization, policy, program or initiative. Results are not within the control of a single organization, policy, program or initiative; instead they are within the area of the organization’s influence.
statutory expenditures (dépenses législatives)
Expenditures that Parliament has approved through legislation other than appropriation acts. The legislation sets out the purpose of the expenditures and the terms and conditions under which they may be made.
target (cible)
A measurable performance or success level that an organization, program or initiative plans to achieve within a specified time period. Targets can be either quantitative or qualitative.
voted expenditures (dépenses votées)
Expenditures that Parliament approves annually through an appropriation act. The vote wording becomes the governing conditions under which these expenditures may be made.