
Briefing materials for the Minister of Seniors, December 2024
Information supplied to the Minister of Seniors as of December 2024.
On this page
- Letter from DM to Minister Thompson
- Infographics
- ESDC 101
- Programs and services
- Economic and Social Inclusion
- Meeting Canada's Labour Market Needs
- Changing Nature of Work and Skills
- Disability Inclusion and Accessibility
- Youth Employment, Skills and Learning
- Seniors
- Service Canada is the face of Government for millions of Canadians
- Transforming Service Delivery While Renewing Technology
1. Letter from DM Thompson to Minister Thompson
Dear Minister Thompson:
Congratulations on your appointment as the Minister of Seniors and welcome to Employment and Social Development Canada (ESDC). We look forward to working with you to advance the Government's priorities.
In additional to the core policy and program responsibilities of ESDC, the portfolio includes Service Canada and the Labour Program and touches the lives of Canadians at every stage of life, across the entire country.
My ESDC Deputy Minister colleagues and I will be your primary source of non-partisan advice and professional expertise on issues that will fall under your responsibility. We are your principal point of contact, providing a gateway into the department and supporting you on policy development, program administration, and delivery of benefits and services.
In the coming days, I will be providing you with comprehensive briefings on your responsibilities and pressing matters that require your immediate attention, including early decision points. I would also like to offer you briefings on your specific interests and priorities, the implementation of the Government's commitments, ongoing priorities, regular departmental operations, and key stakeholders and partners that you may wish to meet with.
2. Infographics
ESDC 101
Alternate formats

ESDC 101 [PDF - 3.1 MB]
Large print, braille, MP3 (audio), e-text and DAISY formats are available on demand by ordering online or calling 1 800 O-Canada (1-800-622-6232). If you use a teletypewriter (TTY), call 1-800-926-9105.
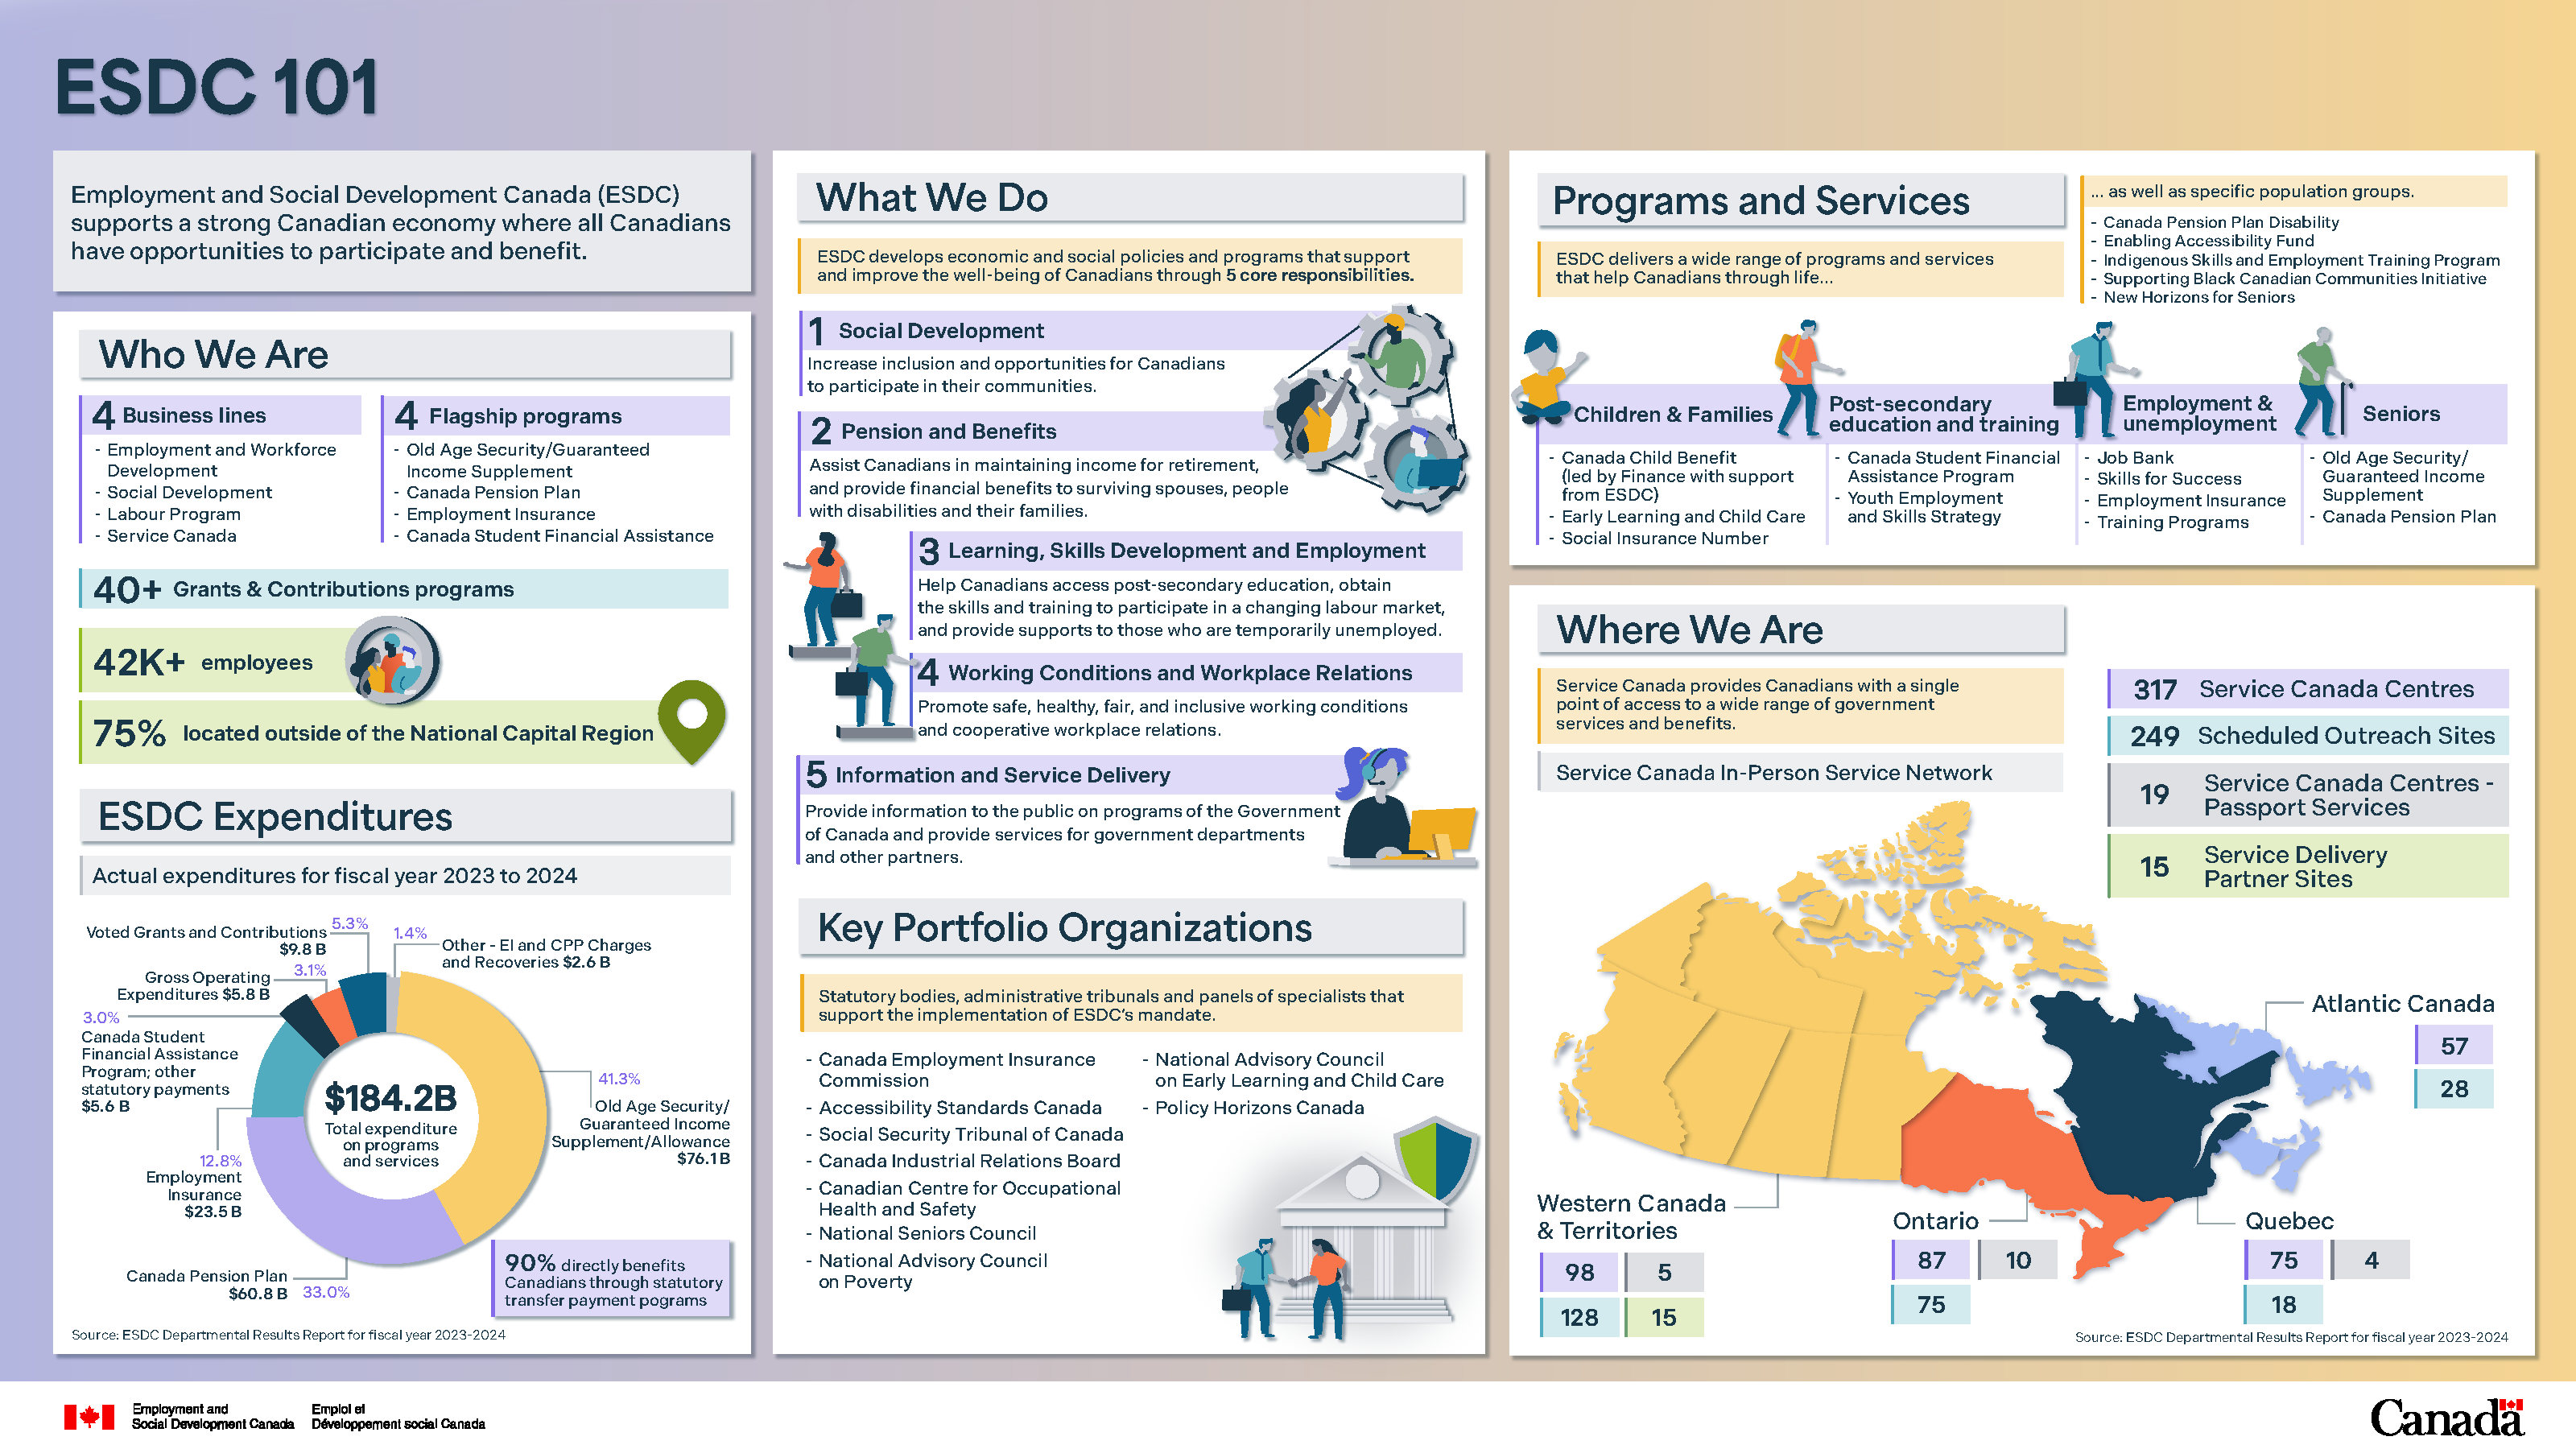
Figure 1. Text description
Employment and Social Development Canada - ESDC 101
ESDC supports a strong Canadian economy where all Canadians have opportunities to participate and benefit.
Who we are
- ESDC has 4 business lines: Employment and Workforce Development, Social Development, Labour Program, Service Canada.
- ESDC has 4 flagship programs: Old Age Security/Guaranteed Income Supplement, Canada Pension Plan, Employment Insurance, and Canada Student Financial Assistance.
- ESDC administers over 40 grants and contributions programs.
- ESDC has over 42 000 employees with 75% located outside of the National Capital Region.
ESDC Expenditures
- In the fiscal year 2023 to 2024, ESDC spent $184.2 billion on its programs and services. Of that amount, 90% were to provide direct benefits to Canadians through statutory transfer payment programs.
- ESDC's gross operating budget represented 3.1% ($5.8 billion) of the Department's overall spending. 3.0% ($5.6 billion) was dedicated to Canada Student Financial Assistance Program and other statutory payments, 12.8 % ($23.5 billion) for Employment Insurance, 33% ($60.8 billion) for Canada Pension Plan and 41.3% ($76.1 billion) for Old Age Security and the Guaranteed Income Supplement Allowance. In addition, 1.4% ($2.6 billion) was provided to Employment insurance and CPP Charges and Recoveries and 5.3% ($9.8 billion) to Voted Grants and Contributions.
What we do
Employment and Social Development Canada develops economic and social policies and programs that support and improve the well-being of Canadians through 5 core responsibilities:
- social development: increase inclusion and opportunities for Canadians to participate in their communities
- pension and benefits: assist Canadians in maintaining income for retirement, and provide financial benefits to surviving spouses, people with disabilities and their families
- learning, skills development, and employment: help Canadians access post-secondary education, obtain the skills and training to participate in a changing labour market, and provide supports to those who are temporarily unemployed
- working conditions and workplace relations: promote safe, healthy, fair, and inclusive working conditions and cooperative workplace relations
- information and service delivery: provide information to the public on programs of the Government of Canada and provide services for government departments and other partners
Key portfolio organizations
Statutory bodies, administrative tribunals and panels of specialists that supports the implementation of ESDC's mandate:
- Canada Employment Insurance Commission
- Accessibility Standards Canada
- Social Security Tribunal of Canada
- Canada Industrial Relations Board
- Canadian Centre for Occupational Health and Safety
- National Seniors Council
- National Advisory Council on Poverty
- National Advisory Council on Early Learning and Child Care
- Policy Horizons Canada
Programs and services
ESDC delivers a wide range of programs and services that help Canadians move through life…
For children and families:
- Canada Child Benefit (led by Finance with support from ESDC)
- Early Learning and Child Care
- Social Insurance Number
For post-secondary education and training:
- Canada Student Financial Assistance Program
- Youth Employment and Skills Strategy
For employment and unemployment:
- Job bank
- Skills for success
- Employment insurance
- Training programs
For seniors:
- Old Age Security / Guaranteed Income Supplement
- Canada Pension Plan
as well as specific population groups:
- Canadian Pension Plan / Disability
- Enabling Accessibility Fund
- Indigenous Skills and Employment Training Program
- Supporting Black Canadian Communities Initiative
- New Horizons for Seniors
Where we are
Service Canada provides Canadians with a single point of access to a wide range of government services and benefits.
Canadians can access Service Canada In-Person Service Network across the country at 317 Service Canada Centres, 249 scheduled outreach sites, 19 passport service sites, and 15 service delivery partner sites.
- Western Canada and Territories have 98 Service Canada Centres, 128 scheduled outreach sites, 5 passport service sites, and 15 service delivery partner sites.
- Ontario has 87 Service Canada Centres, 75 scheduled outreach sites, and 10 passport service sites.
- Quebec has 75 Service Canada Centres, 78 scheduled outreach sites, and 4 passport service sites.
- Atlantic has 57 Service Canada Centres and 28 scheduled outreach sites.
Programs and services
Alternate formats
Programs and services [PDF - 187 KB]
Large print, braille, MP3 (audio), e-text and DAISY formats are available on demand by ordering online or calling 1 800 O-Canada (1-800-622-6232). If you use a teletypewriter (TTY), call 1-800-926-9105.
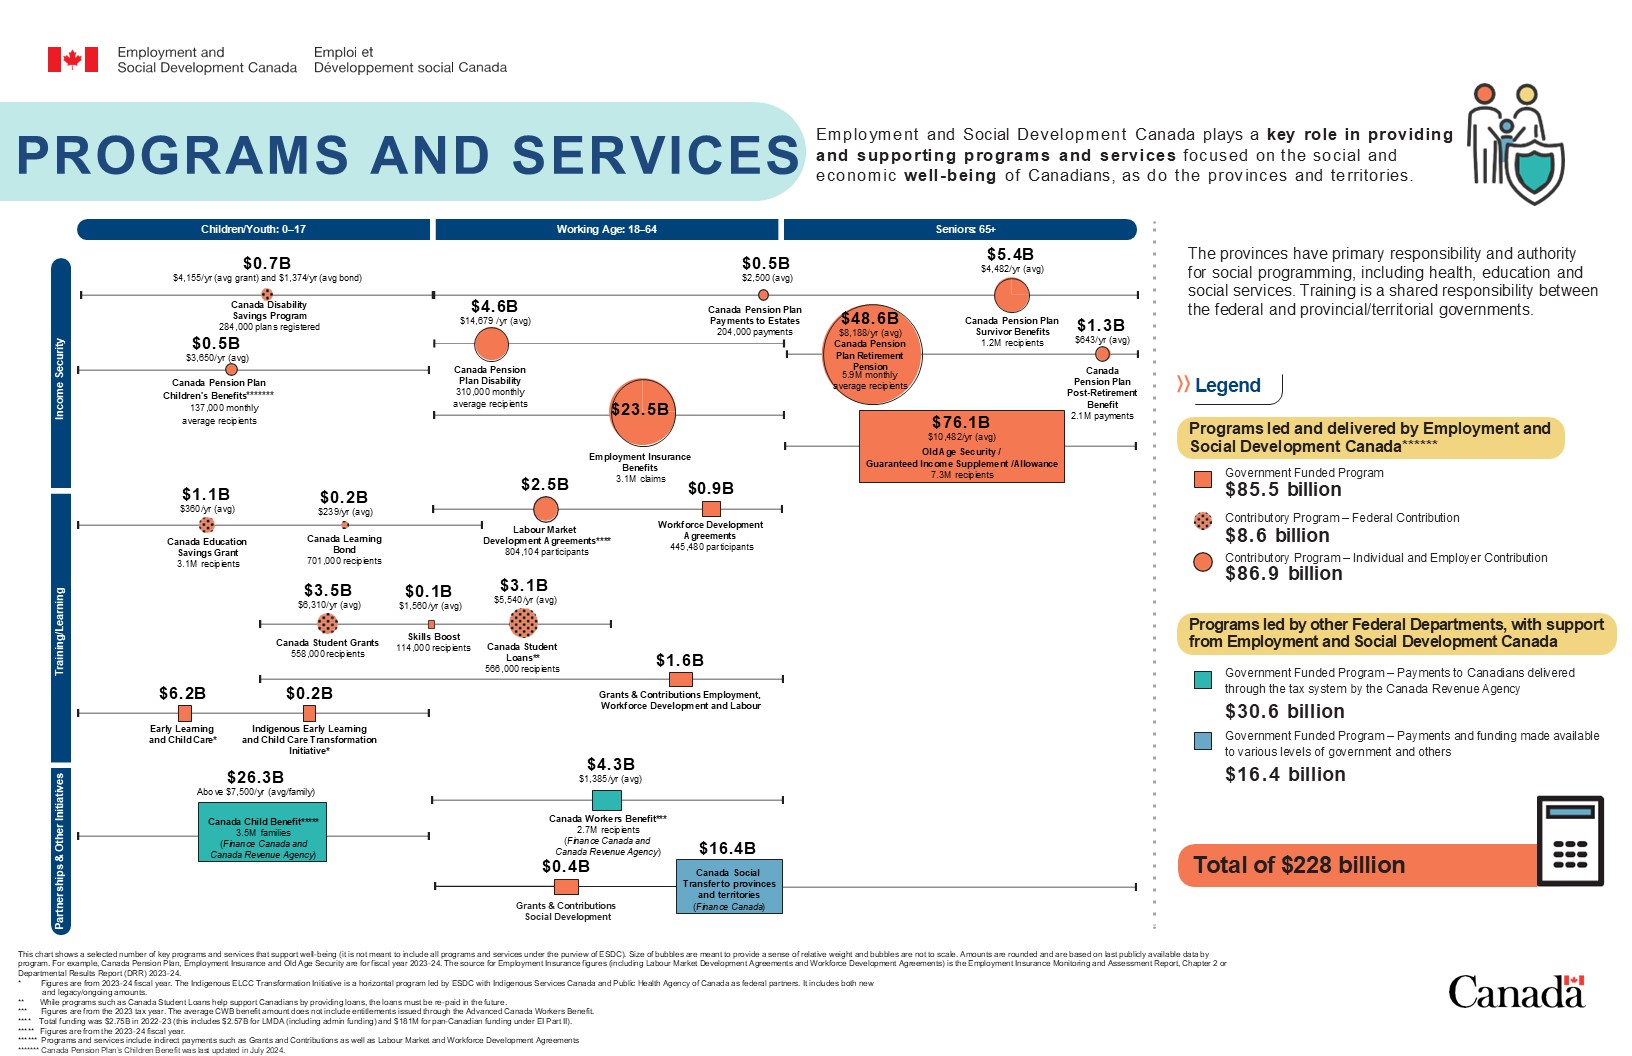
Figure 2. Text description
Programs and Services Infographic
Employment and Social Development Canada plays a key role in providing and supporting programs and services focused on the social and economic well-being of Canadians, as do the provinces and territories.
The provinces have primary responsibility and authority for social programming, including health, education, and social services. Training is a shared responsibility between the federal and provincial/territorial governments.
Each program or initiative is presented on a grid. The vertical axis shows whether it is a form of:
- income security
- training/learning, or
- partnerships and other initiatives
The horizontal axis shows which age demographic(s) it supports:
- children/youth (0 to 17)
- working age (18 to 64), or
- seniors (65+)
Some programs and services support more than one age demographic and this is shown by a line through the program and/or service bubble that spans the range of age demographics being supported. For programs and services where it is possible/relevant, the number of recipients (whether individuals or families) and average benefits (for example, per recipient) are also shown.
The listed programs and services are either led by ESDC or led by another department and supported by ESDC. Some of these programs and services are fully funded by the federal government, while other programs and services are contributory and funded either fully or partially by individual and employer contributions. In cases where programs and services are partially funded by individuals (Canada Disability Savings Program, Canada Education Savings Grant, Canada Learning Bond, Canada Student Grants, and Canada Student Loans), they are also partially funded by the federal government and the expenditure figures presented are only the federal portion of the funding. For the other contributory programs listed, the full amount of spending is shown.
The programs listed can be categorized as follows:
Programs led and delivered by Employment and Social Development Canada
- Government Funded Programs: $85.5 billion
- Contributory Programs - Federal contribution: $8.6 billion
- Contributory Programs - Individual and Employer contribution: $86.9 billion
Note: Programs and services include indirect payments such as Grants and Contributions as well as Labour Market and Workforce Development Agreements.
Programs led by other federal departments, with support from Employment and Social Development Canada.
- Government Funded Programs - Payments to Canadians delivered through the tax system by the Canada Revenue Agency: $30.6 billion.
- Government Funded Programs - Payments and funding made available to various levels of government and others: $16.4 billion.
Total value for programs presented: $228 billion.
The following is a description of selected key programs and services appearing in the graphic:
- Income security:
- Canada Pension Plan - Children's Benefits
- Department lead: Employment and Social Development Canada
- Age demographic: Children/Youth (0 to 17)
- Funding structure: contributory, funded by contributions
- Total expenditures: $0.5B
- Recipients: 137, 000 monthly average recipients
- Average benefits: $3, 650 per year
Note: Canada Pension Plan's Children Benefit was last updated in July 2024.
- Canada Pension Plan Disability
- Department lead: Employment and Social Development Canada
- Age demographic: Working Age (18 to 64)
- Funding structure: contributory, funded by contributions
- Total expenses: $4.6B
- Recipients: 310,000monthly average recipients
- Average benefits: $14,679 per year
- Canada Disability Savings Program
- Department lead: Employment and Social Development Canada
- Age demographic: Working Age (18 to 64) and Seniors (65+)
- Funding structure: contributory, federal contributions
- Total expenses: $0.7B
- Recipients: 284,000 plans registered
- Average grants: $4,155 per year (average grant) and $1, 374 per year (average bond)
- Canada Pension Plan - Payments to Estates
- Department lead: Employment and Social Development Canada
- Age demographic: Working Age (18 to 64) and Seniors (65+)
- Funding structure: contributory, funded by contributions
- Total expenses: $0.5B
- Recipients: 204,000 payments
- Average payments: $2,500
- Canada Pension Plan
- Department lead: Employment and Social Development Canada
- Age demographic: Seniors (65+)
- Funding structure: contributory, funded by contributions
- Total expenses: $48.6B
- Recipients: 5.9M monthly average recipients
- Average benefits: $8,188 per year
- Canada Pension Plan - Survivor Benefits
- Department lead: Employment and Social Development Canada
- Age demographic: Working Age (18 to 64) and Seniors (65+)
- Funding structure: contributory, funded by contributions
- Total expenses: $5.4B
- Recipients: 1.2M recipients
- Average benefits: $4,482 per year
- Canada Pension Plan - Post-Retirement Benefit
- Department lead: Employment and Social Development Canada
- Age demographic: Seniors (65+)
- Funding structure: contributory, funded by contributions
- Total expenses: $1.3B
- Recipients: 2.1M payments
- Average payments: $643 per year
- Employment Insurance Benefits
- Department lead: Employment and Social Development Canada
- Age demographic: Working Age (18 to 64)
- Funding structure: contributory, funded by contributions
- Total expenses: $23.5B
- Recipients: 3.1M claims
- Old Age Security / Guaranteed Income supplement / Allowance
- Department lead: Employment and Social Development Canada
- Age demographic: Seniors (65+)
- Funding structure: government funded
- Total expenses: $76.1B
- Recipients: 7.3M recipients
- Average benefits: $10,482 per year
- Canada Pension Plan - Children's Benefits
- Training/Learning:
- Labour Market Development Agreements
- Department lead: Employment and Social Development Canada
- Age demographic: Working Age (18 to 64)
- Funding structure: contributory, funded by contributions
- Total expenses: $2.5B
- Recipients: 804,104 participants
Note: Total funding was $2.75B in 2022 to 2023 (this includes $2.57B for LMDA (including admin funding) and $181M for pan-Canadian funding under EI Part II).
- Workforce Development Agreements
- Department lead: Employment and Social Development Canada
- Age demographic: Working Age (18 to 64)
- Funding structure: government funding
- Total expenditures: $2.5B
- 445,480 clients served
- Canada Education Savings Grant
- Department lead: Employment and Social Development Canada
- Age demographic: Children/Youth (0 to 17) and Working Age (18 to 64)
- Funding structure: contributory, federal contributions
- Total expenses: $1.1B
- Recipients: 3.1M recipients
- Average grants: $360 per year
- Canada Learning Bond
- Department lead: Employment and Social Development Canada
- Age demographic: Children/Youth (0 to 17) and Working Age (18 to 64)
- Funding structure: contributory, federal contributions
- Total expenses: $0.2B
- Recipients: 701,000 recipients
- Average bonds: $239 per year
- Canada Student Grants
- Department lead: Employment and Social Development Canada
- Age demographic: Children/Youth (0 to 17) and Working Age (18 to 64)
- Funding structure: contributory, federal contributions
- Total expenses: $3.5B
- Recipients: 558,000 recipients
- Average grants: $6,310 per year
- Skills Boost
- Department lead: Employment and Social Development Canada
- Age demographic: Children/Youth (0 to 17) and Working Age (18 to 64)
- Funding structure: government funding
- Total expenses: $0.1B
- Recipients: 114,000 recipients
- Average boost: $1560 per year
- Canada Student Loans
- Department lead: Employment and Social Development Canada
- Age demographic: Children/Youth (0 to 17) and Working Age (18 to 64)
- Funding structure: contributory, federal contributions
- Total expenses: $3.1B
- Recipients: 566,000 recipients
- Average loans: $5,540 per year
Note: While programs such as Canada Student Loans help support Canadians by providing loans, the loans must be re-paid in the future.
- Grants and Contributions - Employment, Workforce Development and Labour
- Department lead: Employment and Social Development Canada
- Age demographic: Children/Youth (0 to 17) and Working Age (18 to 64)
- Funding structure: government funding
- Total grants and contributions: $1.6B
- Early Learning and Child Care
- Department lead: Employment and Social Development Canada
- Age demographic: Children/Youth (0 to 17)
- Funding structure: government funding
- Total investment: $6.2B
Note: Figures are from 2023 to 2024 fiscal year. The Indigenous ELCC Transformation Initiative is a horizontal program led by ESDC with Indigenous Services Canada and Public Health Agency of Canada as federal partners. It includes both new and legacy/ongoing amounts.
- Indigenous Early Learning and Child Care Transformation Initiative
- Department lead: Employment and Social Development Canada
- Age demographic: children/youth (0 to 17)
- Funding structure: government funding
- Total investment: $0.2B
Note: Figures are from 2023 to 2024 fiscal year. The Indigenous ELCC Transformation Initiative is a horizontal program led by ESDC with Indigenous Services Canada and Public Health Agency of Canada as federal partners. It includes both new and legacy/ongoing amounts.
- Canada Child Benefit
- Department lead: Finance Canada and Canada Revenue Agency
- Age demographic: Children/Youth (0 to 17)
- Funding structure: Government Funded Program - Payments to Canadians delivered through the tax system by the Canada Revenue Agency.
- Total expenses: $26.3B
- Recipients: 3.5 million families
- Average benefit: Above $7,500 per year (per family)
Note: Figures are from the 2023 to 2024 fiscal year.
- Canada Workers Benefit
- Department lead: Finance Canada and Canada Revenue Agency
- Age demographic: Working Age (19 to 64)
- Funding structure: Government Funded Program - Payments to Canadians delivered through the tax system by the Canada Revenue Agency
- Total expenses: $4.3B
- Recipients: 2.7M recipients
- Average benefit: $1,385 per year
Note: Figures are from the 2023 tax year. The average CWB benefit amount does not include entitlements issued through the Advanced Canada Workers Benefit.
- Canada Social Transfer to provinces and territories
- Department lead: Department of Finance Canada
- Age demographic: Children/Youth (0 to 17), Working Age (18 to 64) and Seniors (65+)
- Funding structure: Government Funded Program - Payments to provinces and territories through transfer payments
- Total transfers: $16.4B
- Grants and Contributions - Social Development
- Department lead: Employment and Social Development Canada
- Age demographic: children/youth (0 to 17), Working Age (18 to 64) and seniors (65+)
- Funding structure: government funding
- Total grants and contributions: $0.4B
- Labour Market Development Agreements
Economic and Social Inclusion
Alternate formats
Economic and Social Inclusion [PDF - 205 KB]
Large print, braille, MP3 (audio), e-text and DAISY formats are available on demand by ordering online or calling 1 800 O-Canada (1-800-622-6232). If you use a teletypewriter (TTY), call 1-800-926-9105.
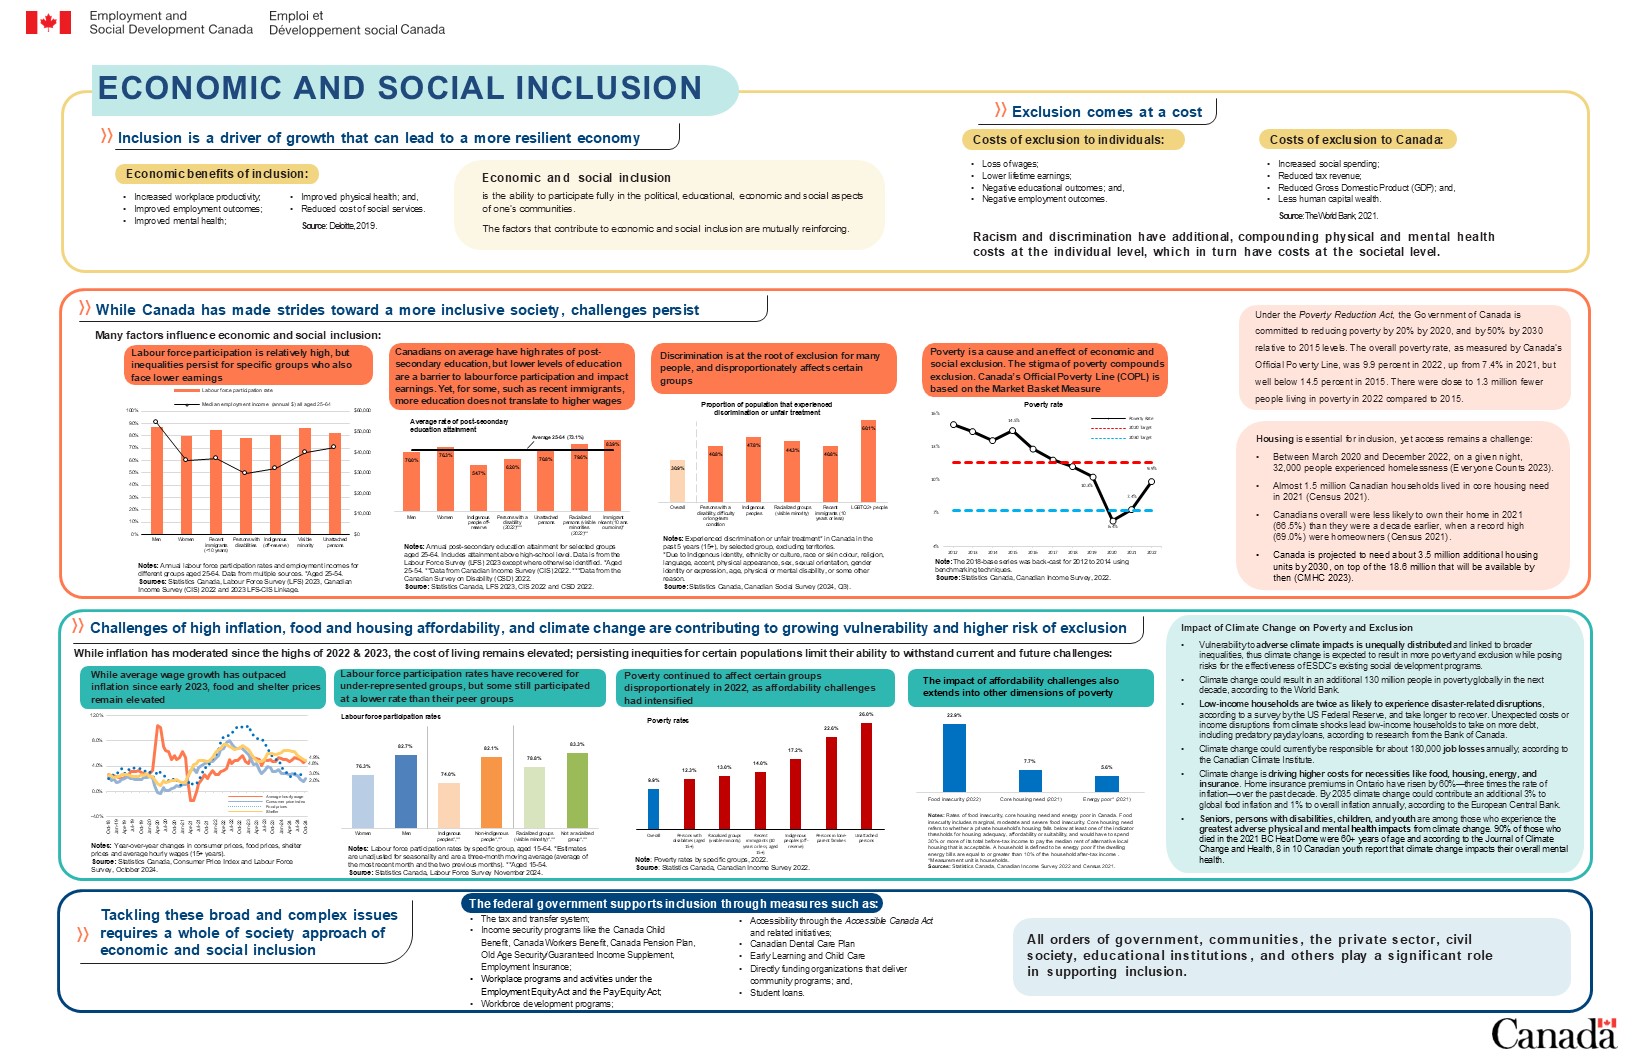
Figure 3. Text description
Economic and Social Inclusion Infographic
Inclusion is a driver of growth that can lead to a more resilient economy
Economic benefits of inclusion include:
- increased workplace productivity
- improved employment outcomes
- improved mental health
- improved physical health, and
- reduced cost of social services
Source: Deloitte, 2019.
Economic and social inclusion
It is the ability to participate fully in the political, educational, economic, and social aspects of one's communities. The factors that contribute to economic and social inclusion are mutually reinforcing.
Exclusion comes at a cost
Costs of exclusion to individuals include:
- loss of wages
- lower lifetime earnings
- negative educational outcomes, and
- negative employment outcomes
Costs of exclusion to Canada include:
- increased social spending
- reduced tax revenue
- reduced Gross Domestic Product (GDP), and
- less human capital wealth
Source: The World Bank, 2021.
Racism and discrimination have additional, compounding physical and mental health costs at the individual level, which in turn have costs at the societal level.
While Canada has made strides toward a more inclusive society, challenges persist
Many factors influence economic and social inclusion, including:
Labour force participation is relatively high, but inequalities persist for specific groups who also face lower earnings
| Groups (Ages 25 to 64) | Labour force participation rate | Median employment income (annual $) |
|---|---|---|
| Men | 87.5% | $54,300 |
| Women | 79.8% | $36,000 |
| Recent immigrants (less than 10 years) | 84.4% | $37,100 |
| Persons with disabilities | 78.5% | $29,500 |
| Indigenous (off-reserve) | 80.5% | $32,300 |
| Visible minority | 86.6% | $39,900 |
| Unattached persons | 82.4% | $42,400 |
- Source: Statistics Canada's Labour Force Survey (LFS) 2023, Canadian Income Survey (CIS) 2022 and 2023 LFS-CIS Linkage.
- Notes: Annual employment incomes and labour force participation rates for different groups aged 25 to 64. Data from multiple sources. *Aged 25 to 54.
Canadians on average have high rates of post- secondary education, but lower levels of education are a barrier to labour force participation and impact earnings. Yet, for some, such as recent immigrants, more education does not translate to higher wages
| Group (ages 25 to 64) | Post-secondary education attainment (%) |
|---|---|
| Men | 70.0% |
| Women | 76.3% |
| Indigenous people off-reserve | 54.7% |
| Persons with disability (2022)*** | 62.0% |
| Unattached persons | 70.8% |
| Racialized persons visible minorities (2022)** | 79.6% |
| Recent immigrants (less than 10 years)* | 83.9% |
| Average | 73.1% |
- Notes: Annual post-secondary education attainment for selected groups aged 25 to 64. Includes attainment above high-school level. Data is from the Labour Force Survey (LFS) 2023 except where otherwise identified. *Aged 25 to 54. **Data from Canadian Income Survey (CIS) 2022. ***Data from the Canadian Survey on Disability (CSD) 2022.
- Source: Statistics Canada, LFS 2023, CIS 2022 and CSD 2022.
Discrimination is at the root of exclusion for many people, and disproportionately affects certain groups
| Group (age 15 and above) | Experienced discrimination or unfair treatment* in the past 5 years |
|---|---|
| Persons with a disability, difficulty or long-term condition | 40.8% |
| Indigenous peoples | 47.8% |
| Racialized groups (visible minority) | 44.3% |
| Recent immigrants (10 years or less) | 40.8% |
| LGBTQ2+ people | 60.1% |
| Overall | 30.9% |
- Notes: Experienced discrimination or unfair treatment* in Canada in the past 5 years (15+), by selected group, excluding territories. *Due to Indigenous identity, ethnicity or culture, race or skin colour, religion, language, accent, physical appearance, sex, sexual orientation, gender identity or expression, age, physical or mental disability, or some other reason.
- Source: Statistics Canada, Canadian Social Survey (2024, Q3).
Poverty is a cause and an effect of economic and social exclusion. The stigma of poverty compounds exclusion. Canada's Official Poverty Line (COPL) is based on the Market Basket Measure
| Year | Poverty rate | 2020 target | 2030 target |
|---|---|---|---|
| 2012 | 15.0% | 11.6% | 7.25% |
| 2013 | 14.4% | 11.6% | 7.25% |
| 2014 | 13.6% | 11.6% | 7.25% |
| 2015 | 14.5% | 11.6% | 7.25% |
| 2016 | 12.9% | 11.6% | 7.25% |
| 2017 | 11.9% | 11.6% | 7.25% |
| 2018 | 11.2% | 11.6% | 7.25% |
| 2019 | 10.3% | 11.6% | 7.25% |
| 2020 | 6.4% | 11.6% | 7.25% |
| 2021 | 7.4% | 11.6% | 7.25% |
| 2022 | 9.9% | 11.6% | 7.25% |
- Notes: The 2018-base series was back-cast for 2012 to 2014 using benchmarking techniques.
- Source: Statistics Canada, Canadian Income Survey, 2022.
Under the Poverty Reduction Act, the Government of Canada is committed to reducing poverty by 20% by 2020, and by 50% by 2030 relative to 2015 levels. The overall poverty rate, as measured by Canada's Official Poverty Line, was 9.9 percent in 2022, up from 7.4% in 2021, but well below 14.5 percent in 2015. There were close to 1.3 million fewer people living in poverty in 2022 compared to 2015.
Housing is essential for inclusion, yet access remains a challenge:
- between March 2020 and December 2022, on a given night, 32,000 people experienced homelessness (Everyone Counts 2023)
- almost 1.5 million Canadian households lived in core housing need in 2021 (Census 2021)
- Canadians overall were less likely to own their home in 2021 (66.5%) than they were a decade earlier, when a record high (69.0%) were homeowners (Census 2021)
- Canada is projected to need about 3.5 million additional housing units by 2030, on top of the 18.6 million that will be available by then (CMHC 2023)
Challenges of high inflation, food and housing affordability, and climate change are contributing to growing vulnerability and higher risk of exclusion.
While inflation has moderated since the highs of 2022 and 2023, the cost of living remains elevated; persisting inequities for certain populations limit their ability to withstand current and future challenges:
While average wage growth has outpaced inflation since early 2023, food and shelter prices remain elevated
| Month | Consumer price index | Average hourly wage | Food prices | Shelter |
|---|---|---|---|---|
| October 2018 | 2.4% | 2.7% | 2.0% | 2.5% |
| November 2018 | 1.7% | 2.5% | 2.2% | 2.4% |
| December 2018 | 2.0% | 2.5% | 2.9% | 2.2% |
| January 2019 | 1.4% | 2.3% | 2.8% | 2.4% |
| February 2019 | 1.5% | 2.2% | 3.2% | 2.4% |
| March 2019 | 1.9% | 2.1% | 3.6% | 2.7% |
| April 2019 | 2.0% | 2.2% | 2.9% | 2.7% |
| May 2019 | 2.4% | 2.3% | 3.5% | 2.7% |
| June 2019 | 2.0% | 3.1% | 3.5% | 2.5% |
| July 2019 | 2.0% | 3.2% | 3.8% | 2.3% |
| August 2019 | 1.9% | 3.1% | 3.6% | 2.4% |
| September 2019 | 1.9% | 3.3% | 3.7% | 2.3% |
| October 2019 | 1.9% | 3.1% | 3.7% | 2.6% |
| November 2019 | 2.2% | 2.9% | 3.4% | 2.5% |
| December 2019 | 2.2% | 2.6% | 3.0% | 2.8% |
| January 2020 | 2.4% | 2.8% | 3.2% | 2.4% |
| February 2020 | 2.2% | 3.3% | 2.4% | 2.3% |
| March 2020 | 0.9% | 6.2% | 2.3% | 1.9% |
| April 2020 | -0.2% | 10.5% | 3.4% | 1.3% |
| May 2020 | -0.4% | 10.1% | 3.1% | 1.0% |
| June 2020 | 0.7% | 7.2% | 2.7% | 1.7% |
| July 2020 | 0.1% | 6.5% | 2.2% | 1.5% |
| August 2020 | 0.1% | 6.3% | 1.8% | 1.5% |
| September 2020 | 0.5% | 5.0% | 1.6% | 1.7% |
| October 2020 | 0.7% | 5.6% | 2.3% | 1.8% |
| November 2020 | 1.0% | 5.1% | 1.9% | 1.9% |
| December 2020 | 0.7% | 5.4% | 1.1% | 1.6% |
| January 2021 | 1.0% | 6.3% | 1.0% | 1.4% |
| February 2021 | 1.1% | 5.3% | 1.8% | 1.4% |
| March 2021 | 2.2% | 1.9% | 1.8% | 2.4% |
| April 2021 | 3.4% | -1.3% | 0.9% | 3.2% |
| May 2021 | 3.6% | -1.5% | 1.5% | 4.2% |
| June 2021 | 3.1% | 0.0% | 1.3% | 4.4% |
| July 2021 | 3.7% | 1.2% | 1.7% | 4.8% |
| August 2021 | 4.1% | 1.9% | 2.7% | 4.8% |
| September 2021 | 4.4% | 2.7% | 3.9% | 4.8% |
| October 2021 | 4.7% | 2.0% | 3.8% | 4.8% |
| November 2021 | 4.7% | 2.7% | 4.4% | 4.8% |
| December 2021 | 4.8% | 3.3% | 5.2% | 5.4% |
| January 2022 | 5.1% | 2.7% | 5.7% | 6.2% |
| February 2022 | 5.7% | 2.7% | 6.7% | 6.6% |
| March 2022 | 6.7% | 3.2% | 7.7% | 6.8% |
| April 2022 | 6.8% | 3.3% | 8.8% | 7.4% |
| May 2022 | 7.7% | 3.7% | 8.8% | 7.4% |
| June 2022 | 8.1% | 5.0% | 8.8% | 7.1% |
| July 2022 | 7.6% | 4.4% | 9.2% | 7.0% |
| August 2022 | 7.0% | 4.9% | 9.8% | 6.6% |
| September 2022 | 6.9% | 4.9% | 10.3% | 6.8% |
| October 2022 | 6.9% | 5.3% | 10.1% | 6.9% |
| November 2022 | 6.8% | 5.8% | 10.3% | 7.2% |
| December 2022 | 6.3% | 4.8% | 10.1% | 7.0% |
| January 2023 | 5.9% | 4.5% | 10.4% | 6.6% |
| February 2023 | 5.2% | 5.4% | 9.7% | 6.1% |
| March 2023 | 4.3% | 5.3% | 8.9% | 5.4% |
| April 2023 | 4.4% | 5.2% | 8.3% | 4.9% |
| May 2023 | 3.4% | 5.1% | 8.3% | 4.7% |
| June 2023 | 2.8% | 4.2% | 8.3% | 4.8% |
| July 2023 | 3.3% | 5.0% | 7.8% | 5.1% |
| August 2023 | 4.0% | 4.9% | 6.8% | 6.0% |
| September 2023 | 3.8% | 5.0% | 5.9% | 6.0% |
| October 2023 | 3.1% | 4.8% | 5.6% | 6.1% |
| November 2023 | 3.1% | 4.8% | 5.0% | 5.9% |
| December 2023 | 3.4% | 5.4% | 5.0% | 6.0% |
| January 2024 | 2.9% | 5.3% | 3.9% | 6.2% |
| February 2024 | 2.8% | 5.0% | 3.3% | 6.5% |
| March 2024 | 2.9% | 5.1% | 3.0% | 6.5% |
| April 2024 | 2.7% | 4.7% | 2.3% | 6.4% |
| May 2024 | 2.9% | 5.1% | 2.4% | 6.4% |
| June 2024 | 2.7% | 5.4% | 2.8% | 6.2% |
| July 2024 | 2.5% | 5.2% | 2.7% | 5.7% |
| August 2024 | 2.0% | 5.0% | 2.7% | 5.3% |
| September 2024 | 1.6% | 4.6% | 2.8% | 5.0% |
| October 2024 | 2.0% | 4.9% | 3.0% | 4.8% |
- Notes: Year-over-year changes in consumer prices, food prices, shelter prices and average hourly wages (15+ years).
- Source: Statistics Canada, Consumer Price Index and Labour Force Survey, October 2024.
Labour force participation rates have recovered for under-represented groups, but some still participated at a lower rate than their peer groups
| Groups (aged 15 to 64) | Labour force participation rates |
|---|---|
| Women | 76.3% |
| Men | 82.7% |
| Indigenous peoples*,** | 74.0% |
| Non-Indigenous people*,** | 82.1% |
| Racialized groups (visible minority)*,** | 78.8% |
| Non-racialized group*,** | 83.3% |
- Notes: Labour force participation rates by specific group, aged 15 to 64. *Estimates are unadjusted for seasonality and are a three-month moving average (average of the most recent month and the two previous months). **Aged 15 to 54.
- Source: Statistics Canada, Labour Force Survey November 2024.
Poverty continued to affect certain groups disproportionately in 2022, as affordability challenges had intensified
| Demographic | Poverty rates |
|---|---|
| Overall (Canada) | 9.9% |
| Persons with disabilities (aged 15+) | 12.3% |
| Racialized groups (visible minority) | 13.0% |
| Recent immigrants (10 years or less, aged 15+) | 14.0% |
| Indigenous peoples (off-reserve) | 17.2% |
| Persons in lone-parent families | 22.6% |
| Unattached persons | 26.0% |
- Notes: Poverty rates by specific groups, 2022.
- Source: Statistics Canada, Canadian Income Survey 2022.
The impact of affordability challenges also extends into other dimensions of poverty
| Dimension of poverty | Percentage |
|---|---|
| Food insecurity (2022) | 22.9% |
| Core housing need (2021) | 7.7% |
| Energy poor* (2021) | 5.6% |
- Notes: Rates of food insecurity, core housing need and energy poor in Canada. Food insecurity includes marginal, moderate and severe food insecurity. Core housing need refers to whether a private household's housing falls below at least one of the indicator thresholds for housing adequacy, affordability, or suitability, and would have to spend 30% or more of its total before-tax income to pay the median rent of alternative local housing that is acceptable. A household is defined to be energy poor if the dwelling energy bills are equal to or greater than 10% of the household after-tax income. *Measurement unit is households.
- Sources: Statistics Canada, Canadian Income Survey 2022, and Census 2021.
Impact of Climate Change on Poverty and Exclusion
- Vulnerability to adverse climate impacts is unequally distributed and linked to broader inequalities, thus climate change is expected to result in more poverty and exclusion while posing risks for the effectiveness of ESDC's existing social development programs.
- Climate change could result in an additional 130 million people in poverty globally in the next decade, according to the World Bank.
- Low-income households are twice as likely to experience disaster-related disruptions, according to a survey by the US Federal Reserve, and take longer to recover. Unexpected costs or income disruptions from climate shocks lead low-income households to take on more debt, including predatory payday loans, according to research from the Bank of Canada.
- Climate change could currently be responsible for about 180,000 job losses annually, according to the Canadian Climate Institute.
- Climate change is driving higher costs for necessities like food, housing, energy, and insurance. Home insurance premiums in Ontario have risen by 60%-three times the rate of inflation-over the past decade. By 2035 climate change could contribute an additional 3% to global food inflation and 1% to overall inflation annually, according to the European Central Bank.
- Seniors, persons with disabilities, children, and youth are among those who experience the greatest adverse physical and mental health impacts from climate change. 90% of those who died in the 2021 BC Heat Dome were 60+ years of age and according to the Journal of Climate Change and Health, 8 in 10 Canadian youth report that climate change impacts their overall mental health.
Tackling the broad and complex issue requires a whole of society approach of economic and social inclusion
The federal government supports inclusion through measures such as:
- the tax and transfer system
- income security programs like the Canada Child Benefit, Canada Workers Benefit, Canada Pension Plan, Old Age Security/Guaranteed Income Supplement, Employment Insurance
- workplace programs and activities under the Employment Equity Act and the Pay Equity Act
- workforce development programs
- accessibility through the Accessible Canada Act and related initiatives
- Canadian Dental Care Plan
- Early Learning and Child Care
- directly funding organizations that deliver community programs
- student loans
All orders of government, communities, the private sector, civil society, educational institutions, and others play a significant role in supporting inclusion.
Meeting Canada's Labour Market Needs
Alternate formats
Meeting Canada's Labour Market Needs [PDF - 250 KB]
Large print, braille, MP3 (audio), e-text and DAISY formats are available on demand by ordering online or calling 1 800 O-Canada (1-800-622-6232). If you use a teletypewriter (TTY), call 1-800-926-9105.
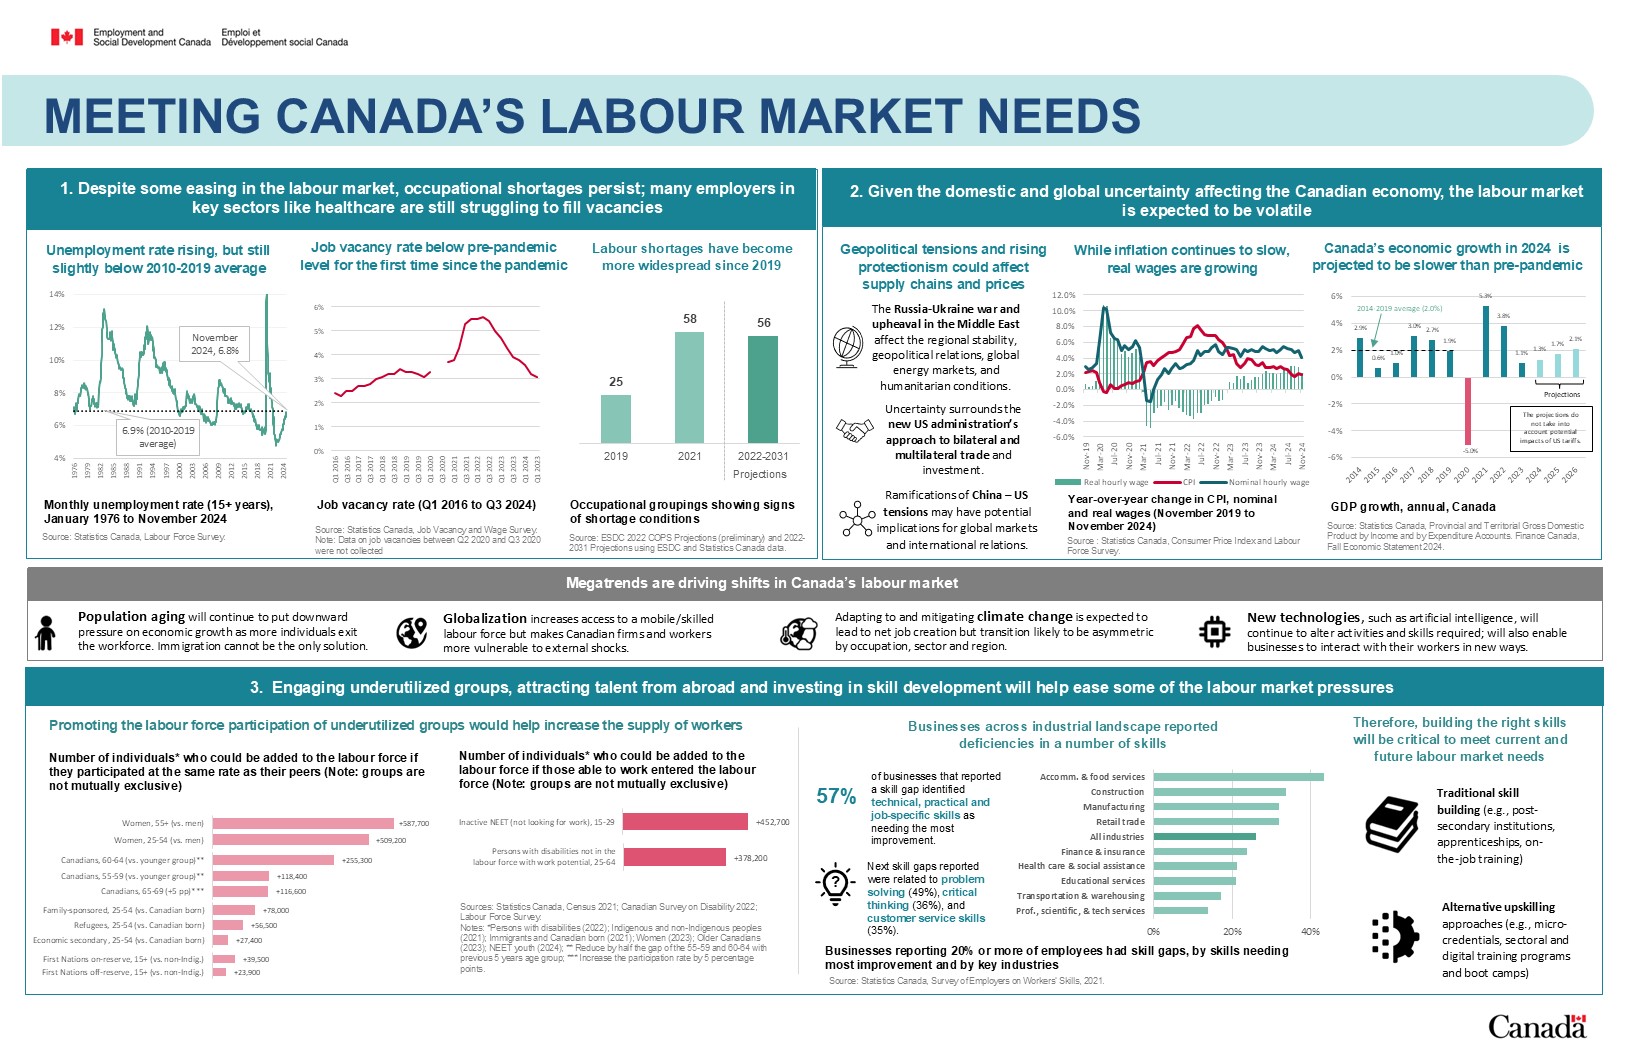
Figure 4: Text description
Meeting Canada's Labour Market Needs
1. Despite some easing in the labour market, occupational shortages persist; many employers in key sectors like healthcare are still struggling to fill vacancies
| Month | Unemployment rate |
|---|---|
| January 1976 | 7.1 |
| February 1976 | 7.0 |
| March 1976 | 6.7 |
| April 1976 | 6.8 |
| May 1976 | 6.9 |
| June 1976 | 6.9 |
| July 1976 | 7.4 |
| August 1976 | 7.1 |
| September 1976 | 7.0 |
| October 1976 | 7.4 |
| November 1976 | 7.4 |
| December 1976 | 7.5 |
| January 1977 | 7.6 |
| February 1977 | 7.9 |
| March 1977 | 7.8 |
| April 1977 | 7.9 |
| May 1977 | 7.8 |
| June 1977 | 7.8 |
| July 1977 | 8.1 |
| August 1977 | 8.2 |
| September 1977 | 8.3 |
| October 1977 | 8.4 |
| November 1977 | 8.5 |
| December 1977 | 8.5 |
| January 1978 | 8.3 |
| February 1978 | 8.3 |
| March 1978 | 8.5 |
| April 1978 | 8.4 |
| May 1978 | 8.6 |
| June 1978 | 8.4 |
| July 1978 | 8.3 |
| August 1978 | 8.4 |
| September 1978 | 8.4 |
| October 1978 | 8.2 |
| November 1978 | 8.3 |
| December 1978 | 8.3 |
| January 1979 | 8.2 |
| February 1979 | 8.0 |
| March 1979 | 7.9 |
| April 1979 | 8.0 |
| May 1979 | 7.6 |
| June 1979 | 7.4 |
| July 1979 | 7.2 |
| August 1979 | 7.1 |
| September 1979 | 7.0 |
| October 1979 | 7.2 |
| November 1979 | 7.2 |
| December 1979 | 7.2 |
| January 1980 | 7.5 |
| February 1980 | 7.6 |
| March 1980 | 7.6 |
| April 1980 | 7.7 |
| May 1980 | 7.8 |
| June 1980 | 7.7 |
| July 1980 | 7.6 |
| August 1980 | 7.6 |
| September 1980 | 7.3 |
| October 1980 | 7.3 |
| November 1980 | 7.2 |
| December 1980 | 7.3 |
| January 1981 | 7.4 |
| February 1981 | 7.4 |
| March 1981 | 7.4 |
| April 1981 | 7.1 |
| May 1981 | 7.2 |
| June 1981 | 7.2 |
| July 1981 | 7.2 |
| August 1981 | 7.1 |
| September 1981 | 8.1 |
| October 1981 | 8.3 |
| November 1981 | 8.3 |
| December 1981 | 8.7 |
| January 1982 | 8.6 |
| February 1982 | 8.9 |
| March 1982 | 9.3 |
| April 1982 | 9.8 |
| May 1982 | 10.3 |
| June 1982 | 11.1 |
| July 1982 | 11.9 |
| August 1982 | 12.0 |
| September 1982 | 12.4 |
| October 1982 | 12.9 |
| November 1982 | 12.9 |
| December 1982 | 13.1 |
| January 1983 | 12.7 |
| February 1983 | 12.7 |
| March 1983 | 12.5 |
| April 1983 | 12.4 |
| May 1983 | 12.4 |
| June 1983 | 12.4 |
| July 1983 | 11.9 |
| August 1983 | 11.7 |
| September 1983 | 11.4 |
| October 1983 | 11.3 |
| November 1983 | 11.3 |
| December 1983 | 11.3 |
| January 1984 | 11.3 |
| February 1984 | 11.3 |
| March 1984 | 11.3 |
| April 1984 | 11.5 |
| May 1984 | 11.7 |
| June 1984 | 11.3 |
| July 1984 | 11.2 |
| August 1984 | 11.3 |
| September 1984 | 11.8 |
| October 1984 | 11.3 |
| November 1984 | 11.4 |
| December 1984 | 11.1 |
| January 1985 | 10.6 |
| February 1985 | 10.8 |
| March 1985 | 11.0 |
| April 1985 | 10.8 |
| May 1985 | 10.6 |
| June 1985 | 10.7 |
| July 1985 | 10.4 |
| August 1985 | 10.3 |
| September 1985 | 10.2 |
| October 1985 | 10.3 |
| November 1985 | 10.3 |
| December 1985 | 10.1 |
| January 1986 | 9.8 |
| February 1986 | 9.9 |
| March 1986 | 9.8 |
| April 1986 | 9.7 |
| May 1986 | 9.5 |
| June 1986 | 9.6 |
| July 1986 | 9.6 |
| August 1986 | 9.6 |
| September 1986 | 9.5 |
| October 1986 | 9.4 |
| November 1986 | 9.4 |
| December 1986 | 9.5 |
| January 1987 | 9.5 |
| February 1987 | 9.5 |
| March 1987 | 9.4 |
| April 1987 | 9.2 |
| May 1987 | 8.9 |
| June 1987 | 8.9 |
| July 1987 | 8.7 |
| August 1987 | 8.6 |
| September 1987 | 8.4 |
| October 1987 | 8.3 |
| November 1987 | 8.2 |
| December 1987 | 8.0 |
| January 1988 | 8.1 |
| February 1988 | 7.8 |
| March 1988 | 7.8 |
| April 1988 | 7.7 |
| May 1988 | 7.8 |
| June 1988 | 7.6 |
| July 1988 | 7.8 |
| August 1988 | 7.8 |
| September 1988 | 7.8 |
| October 1988 | 7.8 |
| November 1988 | 7.8 |
| December 1988 | 7.5 |
| January 1989 | 7.5 |
| February 1989 | 7.6 |
| March 1989 | 7.5 |
| April 1989 | 7.8 |
| May 1989 | 7.7 |
| June 1989 | 7.5 |
| July 1989 | 7.5 |
| August 1989 | 7.3 |
| September 1989 | 7.3 |
| October 1989 | 7.2 |
| November 1989 | 7.5 |
| December 1989 | 7.7 |
| January 1990 | 7.9 |
| February 1990 | 7.7 |
| March 1990 | 7.3 |
| April 1990 | 7.6 |
| May 1990 | 7.8 |
| June 1990 | 7.6 |
| July 1990 | 7.9 |
| August 1990 | 8.1 |
| September 1990 | 8.5 |
| October 1990 | 8.8 |
| November 1990 | 9.1 |
| December 1990 | 9.5 |
| January 1991 | 9.8 |
| February 1991 | 10.2 |
| March 1991 | 10.5 |
| April 1991 | 10.3 |
| May 1991 | 10.2 |
| June 1991 | 10.5 |
| July 1991 | 10.5 |
| August 1991 | 10.5 |
| September 1991 | 10.3 |
| October 1991 | 10.3 |
| November 1991 | 10.4 |
| December 1991 | 10.3 |
| January 1992 | 10.4 |
| February 1992 | 10.5 |
| March 1992 | 10.9 |
| April 1992 | 10.7 |
| May 1992 | 10.9 |
| June 1992 | 11.4 |
| July 1992 | 11.3 |
| August 1992 | 11.7 |
| September 1992 | 11.6 |
| October 1992 | 11.4 |
| November 1992 | 12.1 |
| December 1992 | 11.7 |
| January 1993 | 11.2 |
| February 1993 | 11.0 |
| March 1993 | 11.2 |
| April 1993 | 11.6 |
| May 1993 | 11.6 |
| June 1993 | 11.7 |
| July 1993 | 11.6 |
| August 1993 | 11.2 |
| September 1993 | 11.5 |
| October 1993 | 11.3 |
| November 1993 | 11.2 |
| December 1993 | 11.4 |
| January 1994 | 11.4 |
| February 1994 | 11.1 |
| March 1994 | 10.6 |
| April 1994 | 10.9 |
| May 1994 | 10.7 |
| June 1994 | 10.3 |
| July 1994 | 10.1 |
| August 1994 | 10.2 |
| September 1994 | 10.1 |
| October 1994 | 10.0 |
| November 1994 | 9.7 |
| December 1994 | 9.6 |
| January 1995 | 9.6 |
| February 1995 | 9.6 |
| March 1995 | 9.7 |
| April 1995 | 9.5 |
| May 1995 | 9.5 |
| June 1995 | 9.5 |
| July 1995 | 9.6 |
| August 1995 | 9.5 |
| September 1995 | 9.2 |
| October 1995 | 9.3 |
| November 1995 | 9.2 |
| December 1995 | 9.4 |
| January 1996 | 9.4 |
| February 1996 | 9.5 |
| March 1996 | 9.6 |
| April 1996 | 9.3 |
| May 1996 | 9.2 |
| June 1996 | 9.8 |
| July 1996 | 9.7 |
| August 1996 | 9.4 |
| September 1996 | 9.9 |
| October 1996 | 9.9 |
| November 1996 | 9.9 |
| December 1996 | 9.7 |
| January 1997 | 9.5 |
| February 1997 | 9.5 |
| March 1997 | 9.3 |
| April 1997 | 9.4 |
| May 1997 | 9.4 |
| June 1997 | 9.1 |
| July 1997 | 8.9 |
| August 1997 | 8.9 |
| September 1997 | 8.8 |
| October 1997 | 8.9 |
| November 1997 | 8.9 |
| December 1997 | 8.5 |
| January 1998 | 8.8 |
| February 1998 | 8.6 |
| March 1998 | 8.4 |
| April 1998 | 8.3 |
| May 1998 | 8.3 |
| June 1998 | 8.4 |
| July 1998 | 8.3 |
| August 1998 | 8.1 |
| September 1998 | 8.2 |
| October 1998 | 8.0 |
| November 1998 | 8.0 |
| December 1998 | 8.1 |
| January 1999 | 7.9 |
| February 1999 | 7.9 |
| March 1999 | 7.9 |
| April 1999 | 8.2 |
| May 1999 | 7.9 |
| June 1999 | 7.6 |
| July 1999 | 7.6 |
| August 1999 | 7.4 |
| September 1999 | 7.5 |
| October 1999 | 7.2 |
| November 1999 | 6.9 |
| December 1999 | 6.8 |
| January 2000 | 6.8 |
| February 2000 | 6.9 |
| March 2000 | 6.9 |
| April 2000 | 6.7 |
| May 2000 | 6.6 |
| June 2000 | 6.7 |
| July 2000 | 6.8 |
| August 2000 | 7.0 |
| September 2000 | 6.9 |
| October 2000 | 7.0 |
| November 2000 | 6.9 |
| December 2000 | 6.8 |
| January 2001 | 6.9 |
| February 2001 | 7.0 |
| March 2001 | 7.1 |
| April 2001 | 7.1 |
| May 2001 | 7.0 |
| June 2001 | 7.2 |
| July 2001 | 7.1 |
| August 2001 | 7.2 |
| September 2001 | 7.2 |
| October 2001 | 7.3 |
| November 2001 | 7.5 |
| December 2001 | 8.1 |
| January 2002 | 8.0 |
| February 2002 | 7.9 |
| March 2002 | 7.9 |
| April 2002 | 7.7 |
| May 2002 | 7.8 |
| June 2002 | 7.6 |
| July 2002 | 7.6 |
| August 2002 | 7.4 |
| September 2002 | 7.6 |
| October 2002 | 7.6 |
| November 2002 | 7.5 |
| December 2002 | 7.6 |
| January 2003 | 7.5 |
| February 2003 | 7.5 |
| March 2003 | 7.4 |
| April 2003 | 7.6 |
| May 2003 | 7.8 |
| June 2003 | 7.6 |
| July 2003 | 7.7 |
| August 2003 | 7.8 |
| September 2003 | 7.9 |
| October 2003 | 7.6 |
| November 2003 | 7.4 |
| December 2003 | 7.3 |
| January 2004 | 7.3 |
| February 2004 | 7.3 |
| March 2004 | 7.3 |
| April 2004 | 7.2 |
| May 2004 | 7.1 |
| June 2004 | 7.2 |
| July 2004 | 7.1 |
| August 2004 | 7.0 |
| September 2004 | 6.9 |
| October 2004 | 7.1 |
| November 2004 | 7.2 |
| December 2004 | 7.1 |
| January 2005 | 6.9 |
| February 2005 | 7.0 |
| March 2005 | 6.9 |
| April 2005 | 6.7 |
| May 2005 | 7.0 |
| June 2005 | 6.8 |
| July 2005 | 6.7 |
| August 2005 | 6.7 |
| September 2005 | 6.7 |
| October 2005 | 6.7 |
| November 2005 | 6.3 |
| December 2005 | 6.6 |
| January 2006 | 6.7 |
| February 2006 | 6.6 |
| March 2006 | 6.5 |
| April 2006 | 6.5 |
| May 2006 | 6.2 |
| June 2006 | 6.3 |
| July 2006 | 6.5 |
| August 2006 | 6.5 |
| September 2006 | 6.5 |
| October 2006 | 6.3 |
| November 2006 | 6.5 |
| December 2006 | 6.3 |
| January 2007 | 6.4 |
| February 2007 | 6.3 |
| March 2007 | 6.3 |
| April 2007 | 6.3 |
| May 2007 | 6.2 |
| June 2007 | 6.1 |
| July 2007 | 6.0 |
| August 2007 | 6.0 |
| September 2007 | 6.0 |
| October 2007 | 6.0 |
| November 2007 | 6.1 |
| December 2007 | 6.2 |
| January 2008 | 6.1 |
| February 2008 | 6.1 |
| March 2008 | 6.2 |
| April 2008 | 6.2 |
| May 2008 | 6.2 |
| June 2008 | 6.1 |
| July 2008 | 6.2 |
| August 2008 | 6.2 |
| September 2008 | 6.3 |
| October 2008 | 6.4 |
| November 2008 | 6.7 |
| December 2008 | 7.0 |
| January 2009 | 7.5 |
| February 2009 | 8.1 |
| March 2009 | 8.4 |
| April 2009 | 8.4 |
| May 2009 | 8.7 |
| June 2009 | 8.8 |
| July 2009 | 8.8 |
| August 2009 | 8.7 |
| September 2009 | 8.5 |
| October 2009 | 8.6 |
| November 2009 | 8.6 |
| December 2009 | 8.6 |
| January 2010 | 8.4 |
| February 2010 | 8.4 |
| March 2010 | 8.3 |
| April 2010 | 8.2 |
| May 2010 | 8.2 |
| June 2010 | 8.0 |
| July 2010 | 8.2 |
| August 2010 | 8.2 |
| September 2010 | 8.2 |
| October 2010 | 8.1 |
| November 2010 | 7.9 |
| December 2010 | 7.8 |
| January 2011 | 7.8 |
| February 2011 | 7.8 |
| March 2011 | 7.8 |
| April 2011 | 7.8 |
| May 2011 | 7.7 |
| June 2011 | 7.7 |
| July 2011 | 7.4 |
| August 2011 | 7.4 |
| September 2011 | 7.5 |
| October 2011 | 7.5 |
| November 2011 | 7.6 |
| December 2011 | 7.5 |
| January 2012 | 7.7 |
| February 2012 | 7.6 |
| March 2012 | 7.4 |
| April 2012 | 7.4 |
| May 2012 | 7.6 |
| June 2012 | 7.4 |
| July 2012 | 7.3 |
| August 2012 | 7.4 |
| September 2012 | 7.4 |
| October 2012 | 7.4 |
| November 2012 | 7.4 |
| December 2012 | 7.3 |
| January 2013 | 7.1 |
| February 2013 | 7.1 |
| March 2013 | 7.3 |
| April 2013 | 7.2 |
| May 2013 | 7.1 |
| June 2013 | 7.2 |
| July 2013 | 7.3 |
| August 2013 | 7.3 |
| September 2013 | 7.1 |
| October 2013 | 7.3 |
| November 2013 | 7.1 |
| December 2013 | 7.4 |
| January 2014 | 7.3 |
| February 2014 | 7.3 |
| March 2014 | 7.1 |
| April 2014 | 7.1 |
| May 2014 | 7.3 |
| June 2014 | 7.2 |
| July 2014 | 7.1 |
| August 2014 | 7.0 |
| September 2014 | 7.0 |
| October 2014 | 6.8 |
| November 2014 | 6.8 |
| December 2014 | 6.7 |
| January 2015 | 6.8 |
| February 2015 | 6.9 |
| March 2015 | 6.9 |
| April 2015 | 7.0 |
| May 2015 | 6.9 |
| June 2015 | 6.9 |
| July 2015 | 7.0 |
| August 2015 | 7.1 |
| September 2015 | 7.1 |
| October 2015 | 7.0 |
| November 2015 | 7.1 |
| December 2015 | 7.3 |
| January 2016 | 7.2 |
| February 2016 | 7.3 |
| March 2016 | 7.2 |
| April 2016 | 7.3 |
| May 2016 | 7.1 |
| June 2016 | 7.0 |
| July 2016 | 7.0 |
| August 2016 | 6.9 |
| September 2016 | 7.0 |
| October 2016 | 6.9 |
| November 2016 | 6.8 |
| December 2016 | 6.9 |
| January 2017 | 6.9 |
| February 2017 | 6.6 |
| March 2017 | 6.7 |
| April 2017 | 6.5 |
| May 2017 | 6.6 |
| June 2017 | 6.5 |
| July 2017 | 6.3 |
| August 2017 | 6.2 |
| September 2017 | 6.2 |
| October 2017 | 6.3 |
| November 2017 | 6.2 |
| December 2017 | 6.0 |
| January 2018 | 5.9 |
| February 2018 | 6.0 |
| March 2018 | 5.8 |
| April 2018 | 5.8 |
| May 2018 | 5.9 |
| June 2018 | 6.0 |
| July 2018 | 5.9 |
| August 2018 | 6.0 |
| September 2018 | 5.8 |
| October 2018 | 5.6 |
| November 2018 | 5.7 |
| December 2018 | 5.6 |
| January 2019 | 5.7 |
| February 2019 | 5.8 |
| March 2019 | 5.8 |
| April 2019 | 5.7 |
| May 2019 | 5.5 |
| June 2019 | 5.6 |
| July 2019 | 5.7 |
| August 2019 | 5.7 |
| September 2019 | 5.6 |
| October 2019 | 5.6 |
| November 2019 | 5.9 |
| December 2019 | 5.6 |
| January 2020 | 5.5 |
| February 2020 | 5.8 |
| March 2020 | 8.5 |
| April 2020 | 13.7 |
| May 2020 | 14.2 |
| June 2020 | 12.6 |
| July 2020 | 10.9 |
| August 2020 | 10.1 |
| September 2020 | 9.1 |
| October 2020 | 9.0 |
| November 2020 | 8.6 |
| December 2020 | 8.9 |
| January 2021 | 9.2 |
| February 2021 | 8.5 |
| March 2021 | 7.7 |
| April 2021 | 8.2 |
| May 2021 | 8.3 |
| June 2021 | 7.9 |
| July 2021 | 7.4 |
| August 2021 | 7.1 |
| September 2021 | 7.0 |
| October 2021 | 6.5 |
| November 2021 | 6.1 |
| December 2021 | 5.9 |
| January 2022 | 6.4 |
| February 2022 | 5.5 |
| March 2022 | 5.4 |
| April 2022 | 5.4 |
| May 2022 | 5.2 |
| June 2022 | 4.9 |
| July 2022 | 4.8 |
| August 2022 | 5.2 |
| September 2022 | 5.1 |
| October 2022 | 5.1 |
| November 2022 | 5.0 |
| December 2022 | 5.0 |
| January 2023 | 5.1 |
| February 2023 | 5.1 |
| March 2023 | 5.0 |
| April 2023 | 5.1 |
| May 2023 | 5.2 |
| June 2023 | 5.4 |
| July 2023 | 5.5 |
| August 2023 | 5.5 |
| September 2023 | 5.5 |
| October 2023 | 5.7 |
| November 2023 | 5.7 |
| December 2023 | 5.8 |
| January 2024 | 5.7 |
| February 2024 | 5.9 |
| March 2024 | 6.1 |
| April 2024 | 6.2 |
| May 2024 | 6.3 |
| June 2024 | 6.4 |
| July 2024 | 6.4 |
| August 2024 | 6.7 |
| September 2024 | 6.6 |
| October 2024 | 6.6 |
| November 2024 | 6.8 |
- Chart description: Monthly unemployment rate (15+ years), January 1976 to November 2024
- Source: Statistics Canada, Labour Force Survey
| Quarter | Job vacancy rate |
|---|---|
| Q1 2015 | 2.9 |
| Q2 2015 | 2.7 |
| Q3 2015 | 2.5 |
| Q4 2015 | 2.4 |
| Q1 2016 | 2.4 |
| Q2 2016 | 2.3 |
| Q3 2016 | 2.5 |
| Q4 2016 | 2.5 |
| Q1 2017 | 2.7 |
| Q2 2017 | 2.7 |
| Q3 2017 | 2.8 |
| Q4 2017 | 3.0 |
| Q1 2018 | 3.1 |
| Q2 2018 | 3.2 |
| Q3 2018 | 3.2 |
| Q4 2018 | 3.4 |
| Q1 2019 | 3.3 |
| Q2 2019 | 3.3 |
| Q3 2019 | 3.2 |
| Q4 2019 | 3.1 |
| Q1 2020 | 3.3 |
| Q2 2020 | No data |
| Q3 2020 | No data |
| Q4 2020 | 3.7 |
| Q1 2021 | 3.8 |
| Q2 2021 | 4.3 |
| Q3 2021 | 5.3 |
| Q4 2021 | 5.5 |
| Q1 2022 | 5.5 |
| Q2 2022 | 5.6 |
| Q3 2022 | 5.4 |
| Q4 2022 | 5.0 |
| Q1 2023 | 4.7 |
| Q2 2023 | 4.3 |
| Q3 2023 | 4.0 |
| Q4 2023 | 3.8 |
| Q1 2024 | 3.6 |
| Q2 2024 | 3.2 |
| Q3 2024 | 3.1 |
- Chart description: Job vacancy rate (Q1 2016 to Q3 2024)
- Source: Statistics Canada, Job Vacancy and Wage Survey. Note: Data on job vacancies between Q2 2020 and Q3 2020 were not collected
| Year | Occupational groupings showing signs of shortage conditions |
|---|---|
| 2019 | 25 |
| 2021 | 58 |
| 2022 to 2031 projections | 56 |
- Chart description: Occupational groupings showing signs of shortage conditions
- Source: ESDC 2022 COPS projections (preliminary) and 2022 to 2031 projections using ESDC and Statistics Canada data.
2. Given the domestic and global uncertainty affecting the Canadian economy, the labour market is expected to be volatile
Geopolitical tensions and rising protectionism could affect supply chains and prices
- The Russia-Ukraine war and upheaval in the Middle East affect the regional stability, geopolitical relations, global energy markets, and humanitarian conditions.
- Uncertainty surrounds the new US administration's approach to bilateral and multilateral trade and investment.
- Ramifications of China-US tensions may have potential implications for global markets and international relations.
| Month | Real average hourly wage year-over-year percent change | Nominal average hourly wage year-over-year percent change | CPI year-over-year percent change |
|---|---|---|---|
| October 2019 | 1.2% | 3.1% | 1.9% |
| November 2019 | 0.7% | 2.9% | 2.2% |
| December 2019 | 0.3% | 2.6% | 2.2% |
| January 2020 | 0.4% | 2.8% | 2.4% |
| February 2020 | 1.1% | 3.3% | 2.2% |
| March 2020 | 5.3% | 6.2% | 0.9% |
| April 2020 | 10.7% | 10.5% | -0.2% |
| May 2020 | 10.5% | 10.1% | -0.4% |
| June 2020 | 6.5% | 7.2% | 0.7% |
| July 2020 | 6.4% | 6.5% | 0.1% |
| August 2020 | 6.2% | 6.3% | 0.1% |
| September 2020 | 4.5% | 5.0% | 0.5% |
| October 2020 | 4.9% | 5.6% | 0.7% |
| November 2020 | 4.1% | 5.1% | 1.0% |
| December 2020 | 4.6% | 5.4% | 0.7% |
| January 2021 | 5.2% | 6.3% | 1.0% |
| February 2021 | 4.2% | 5.3% | 1.1% |
| March 2021 | -0.2% | 1.9% | 2.2% |
| April 2021 | -4.6% | -1.3% | 3.4% |
| May 2021 | -4.9% | -1.5% | 3.6% |
| June 2021 | -3.0% | 0.0% | 3.1% |
| July 2021 | -2.4% | 1.2% | 3.7% |
| August 2021 | -2.1% | 1.9% | 4.1% |
| September 2021 | -1.6% | 2.7% | 4.4% |
| October 2021 | -2.5% | 2.0% | 4.7% |
| November 2021 | -1.9% | 2.7% | 4.7% |
| December 2021 | -1.4% | 3.3% | 4.8% |
| January 2022 | -2.3% | 2.7% | 5.1% |
| February 2022 | -2.8% | 2.7% | 5.7% |
| March 2022 | -3.2% | 3.2% | 6.7% |
| April 2022 | -3.3% | 3.3% | 6.8% |
| May 2022 | -3.8% | 3.7% | 7.7% |
| June 2022 | -2.9% | 5.0% | 8.1% |
| July 2022 | -3.0% | 4.4% | 7.6% |
| August 2022 | -2.0% | 4.9% | 7.0% |
| September 2022 | -1.8% | 4.9% | 6.9% |
| October 2022 | -1.4% | 5.3% | 6.9% |
| November 2022 | -1.0% | 5.8% | 6.8% |
| December 22 | -1.4% | 4.8% | 6.3% |
| January 2023 | -1.3% | 4.5% | 5.9% |
| February 2023 | 0.1% | 5.4% | 5.2% |
| March 2023 | 1.0% | 5.3% | 4.3% |
| April 2023 | 0.8% | 5.2% | 4.4% |
| May 2023 | 1.7% | 5.1% | 3.4% |
| June 2023 | 1.3% | 4.2% | 2.8% |
| July 2023 | 1.7% | 5.0% | 3.3% |
| August 2023 | 0.9% | 4.9% | 4.0% |
| September 2023 | 1.2% | 5.0% | 3.8% |
| October 2023 | 1.6% | 4.8% | 3.1% |
| November 2023 | 1.6% | 4.8% | 3.1% |
| December 2023 | 2.0% | 5.4% | 3.4% |
| January 2024 | 2.3% | 5.3% | 2.9% |
| February 2024 | 2.2% | 5.0% | 2.8% |
| March 2024 | 2.1% | 5.1% | 2.9% |
| April 2024 | 2.0% | 4.7% | 2.7% |
| May 2024 | 2.2% | 5.1% | 2.9% |
| June 2024 | 2.7% | 5.4% | 2.7% |
| July 2024 | 2.6% | 5.2% | 2.5% |
| August 2024 | 3.0% | 5.0% | 2.0% |
| September 2024 | 3.0% | 4.6% | 1.6% |
| October 2024 | 2.9% | 4.9% | 2.0% |
| November 2024 | 2.2% | 4.1% | 1.9% |
- Chart description: Year-over-year change in CPI, nominal and real wages (November 2019 to November 2024)
- Source : Statistics Canada, Consumer Price Index and Labour Force Survey.
| Year | GDP growth |
|---|---|
| 2014 | 2.9% |
| 2015 | 0.6% |
| 2016 | 1.0% |
| 2017 | 3.0% |
| 2018 | 2.7% |
| 2019 | 1.9% |
| 2020 | -5.0% |
| 2021 | 5.3% |
| 2022 | 3.8% |
| 2023 | 1.1% |
| 2024 | 1.2% (projection) |
| 2025 | 2.1% (projection) |
| 2026 | 2.3% (projection) |
- Chart description: GDP growth, annual, Canada
- Source: Statistics Canada, Provincial and Territorial Gross Domestic Product by Income and by Expenditure Accounts. Finance Canada, Fall Economic Statement 2024
Megatrends are driving shifts in Canada's labour market
- Population aging will continue to put downward pressure on economic growth as more individuals exit the workforce. Immigration cannot be the only solution.
- Globalization increases access to a mobile/skilled labour force but makes Canadian firms and workers more vulnerable to external shocks.
- Adapting to and mitigating climate change is expected to lead to net job creation but transition likely to be asymmetric by occupation, sector and region.
- New technologies, such as artificial intelligence, will continue to alter activities and skills required; will also enable businesses to interact with their workers in new ways.
3. Engaging underutilized groups, attracting talent from abroad and investing in skill development will help ease some of the labour market pressures
Promoting the labour force participation of underutilized groups would help increase the supply of workers
| Group | Additional participants |
|---|---|
| Women, 55+ (vs. men) | 587,700 |
| Women, 25 to 54 (vs. men) | 509,200 |
| Canadians, 60 to 64 (vs. younger group)** | 255,300 |
| Canadians, 55 to 59 (vs. younger group)** | 118,400 |
| Canadians, 65 to 69 (+5 pp)** | 116,600 |
| Family-sponsored, 25 to 54 (vs. Canadian born) | 78,000 |
| Refugees, 25 to 54 (vs. Canadian born) | 56,500 |
| Economic secondary, 25 to 54 (vs. Canadian born) | 27,400 |
| First Nations on-reserve, 15+ (vs. non-Indig.) | 39,500 |
| First Nations off-reserve, 15+ (vs. non-Indig.) | 23,900 |
| Group | Additional participants |
|---|---|
| Inactive NEETs (not looking for work), 15 to 29 | 452,700 |
| Persons with disabilities not in the labour force with work potential, 25 to 64 | 378,200 |
- Sources: Statistics Canada, Census 2021; Canadian Survey on Disability 2022; Labour Force Survey.
- Notes: *Persons with disabilities (2022); Indigenous and non-Indigenous peoples (2021); Immigrants and Canadian born (2021); Women (2023); Older Canadians (2023); NEET youth (2024); ** Reduce by half the gap of the 55 to 59 and 60 to 64 with previous 5 years age group; *** Increase the participation rate by 5 percentage points.
Businesses across industrial landscape reported deficiencies in a number of skills
- 57% of businesses that reported a skill gap identified technical, practical and job-specific skills as needing the most improvement
- Next skill gaps reported were related to problem solving (49%), critical thinking (36%), and customer service skills (35%)
| Industry | Percentage of employees with skill gaps |
|---|---|
| Accommodation and food services | 43.5% |
| Construction | 33.6% |
| Manufacturing | 32.0% |
| Retail trade | 31.9% |
| All industries | 26.0% |
| Finance & insurance | 23.7% |
| Health care & social assistance | 21.3% |
| Educational services | 21.0% |
| Transportation & warehousing | 17.0% |
| Prof., scientific, & tech services | 13.8% |
Source: Statistics Canada, Survey of Employers on Workers' Skills, 2021
Therefore, building the right skills will be critical to meet current and future labour market needs
- Traditional skill building (for example, postsecondary institutions, apprenticeships, on-the-job training)
- Alternative upskilling approaches (for example, microcredentials, sectoral and digital training programs and boot camps)
Changing Nature of Work and Skills
Alternate formats
Changing Nature of Work and Skills [PDF - 276 KB]
Large print, braille, MP3 (audio), e-text and DAISY formats are available on demand by ordering online or calling 1 800 O-Canada (1-800-622-6232). If you use a teletypewriter (TTY), call 1-800-926-9105.
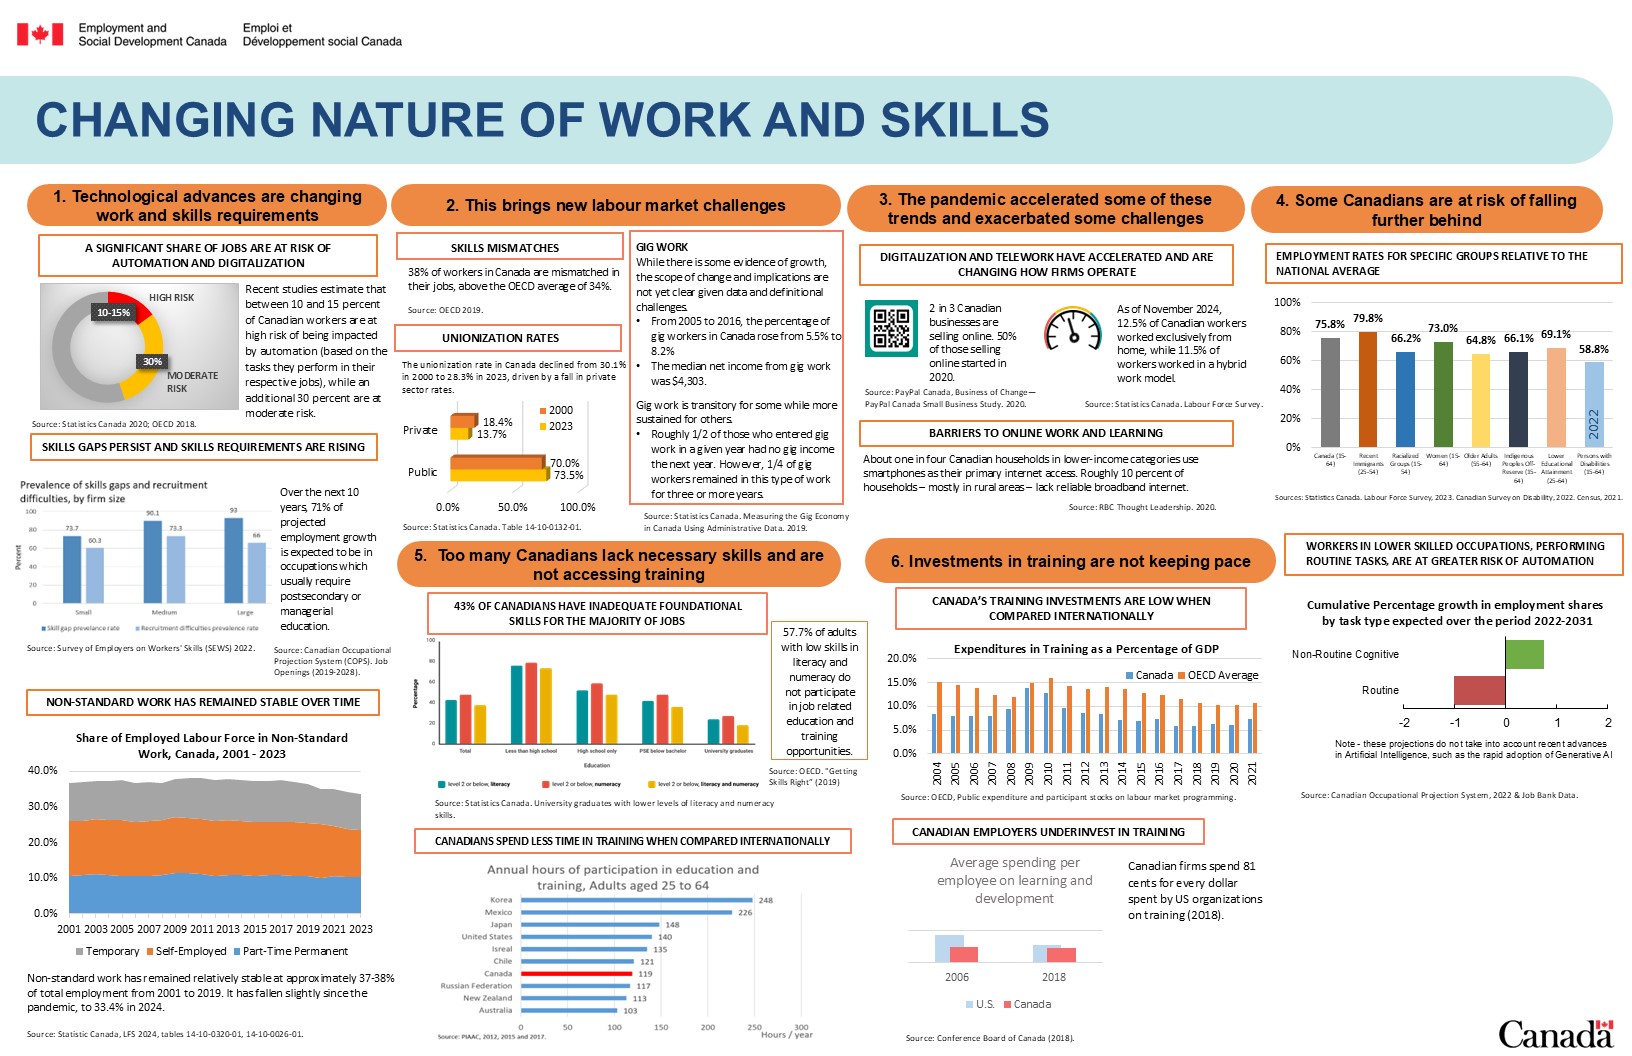
Figure 5. Text description
Changing Nature of Work and Skills
1. Technological advances are changing work and skills requirements
A significant share of jobs are at risk of automation and digitalization
Recent studies estimate that between 10 and 15 percent of Canadian workers are at high risk of being impacted by automation (based on the tasks they perform in their respective jobs), while an additional 30 percent are at moderate risk.
Diagram 1 text: Percentage of jobs at significant or high risk of automation
- 10 to 15% of jobs are at high risk
- 30% of jobs are at moderate risk
Source: Statistics Canada 2020; OECD 2018.
Skills gaps persist and skills requirements are rising
| Firm size | Skill gap prevalence rate | Recruitment difficulties prevalence rate |
|---|---|---|
| Small | 73.7% | 60.3% |
| Medium | 90.1% | 73.3% |
| Large | 93% | 66% |
Source: SEWS 2022
Over the next 10 years, 71% of projected employment growth is expected to be in occupations which usually require postsecondary or managerial education.
Source: Canadian Occupational Projection System (COPS). Job Openings (2019 to 2028).
Non-standard work has remained stable over time
| Reference period | % Permanent part-time | % Temporary | % Self-employed | Total non-standard work |
|---|---|---|---|---|
| 2001 | 10.6% | 10.8% | 15.3% | 36.7% |
| 2002 | 10.9% | 11.0% | 15.2% | 37.1% |
| 2003 | 11.3% | 10.5% | 15.4% | 37.2% |
| 2004 | 11.0% | 10.8% | 15.4% | 37.2% |
| 2005 | 10.7% | 11.1% | 15.6% | 37.4% |
| 2006 | 10.6% | 11.1% | 15.1% | 36.9% |
| 2007 | 10.7% | 11.0% | 15.4% | 37.1% |
| 2008 | 11.0% | 10.4% | 15.4% | 36.9% |
| 2009 | 11.4% | 10.6% | 16.0% | 38.0% |
| 2010 | 11.4% | 11.3% | 15.7% | 38.4% |
| 2011 | 11.2% | 11.7% | 15.3% | 38.1% |
| 2012 | 10.8% | 11.6% | 15.2% | 37.6% |
| 2013 | 11.0% | 11.4% | 15.3% | 37.8% |
| 2014 | 11.0% | 11.4% | 15.2% | 37.6% |
| 2015 | 10.8% | 11.4% | 15.2% | 37.4% |
| 2016 | 10.9% | 11.3% | 15.3% | 37.5% |
| 2017 | 10.9% | 11.7% | 15.1% | 37.7% |
| 2018 | 10.5% | 11.4% | 15.2% | 37.1% |
| 2019 | 10.6% | 10.9% | 15.1% | 36.7% |
| 2020 | 10.0% | 9.8% | 15.4% | 35.2% |
| 2021 | 10.5% | 10.4% | 14.1% | 35.1% |
| 2022 | 10.4% | 10.4% | 13.6% | 34.4% |
| 2023 | 10.4% | 10.4% | 13.6% | 34.4% |
Non-standard work has remained relatively stable at approximately 37 to 38% of total employment from 2001 to 2019. It has fallen slightly since the pandemic, to 33.4% in 2024.
Source: Statistics Canada. LFS 2024, tables 14-10-0320-1, 14-10-0026-01
2. This brings new labour market challenges
Skills mismatches
38% of workers in Canada are mismatched in their jobs, above the OECD average of 34%.
Source: OECD 2019
Unionization rates
The unionization rate in Canada declined from 30.1% in 2000 to 28.3% in 2023, driven by a fall in private sector rates.
Diagram 4 text: Union coverage rate by sector, Canada 2000 to 2023
- In the private sector, 18.4% of workers were unionized in 2000 as compared to 13.7% in 2023
- In the public sector, 70.0% of workers were unionized in 2000 as compared to 73.5% in 2023
Source: Statistics Canada. Table 14-10-0132-01.
Gig work
While there is some evidence of growth, the scope of change and implications are not yet clear given data and definitional challenges.
- From 2005 to 2016, the percentage of gig workers in Canada rose from 5.5% to 8.2%
- The median net income from gig work was $4,303
Gig work is transitory for some while more sustained for others
- Roughly 1/2 of those who entered gig work in a given year had no gig income the next year. However, 1/4 of gig workers remained in this type of work for 3 or more years
Source: Statistics Canada. Measuring the gig economy in Canada using administrative data. 2019.
3. The pandemic accelerated some of these trends and exacerbated some challenges
Digitalization and telework have accelerated and are changing how firms operate
2 in 3 Canadian businesses are selling online. 50% of those selling online started in 2020.
Source: PayPal Canada, Business of Change-PayPal Canada Small Business Study. 2020.
As of November 2024, 12.5% of Canadian workers worked exclusively from home, while 11.5% of workers worked in a hybrid work model.
Source: Statistics Canada. Labour Force Survey.
Barriers to online work and learning
About one in four Canadian households in lower-income categories use smartphones as their primary internet access. Roughly 10 percent of households, mostly in rural areas, lack reliable broadband internet.
Source: RBC Thought Leadership. 2020
4. Some Canadians are at risk of falling further behind
Employment rates for specific groups relative to the national average
| Group | Rate |
|---|---|
| Canada (15 to 64) | 75.8% |
| Recent immigrants (15 to 54) | 79.8% |
| Racialized groups (15 to 54) | 66.2% |
| Women (15 to 64) | 73% |
| Older adults (55 to 64) | 64.8% |
| Indigenous people off reserve (15 to 64) | 66.1% |
| Lower educational attainment (25 to 64) | 69.1% |
| Persons with Disabilities (25 to 64), (2017) | 58.8% |
Source: Statistics Canada, Labour Force Survey, 2022. Canadian Survey on Disability, 2017. Census, 2021.
5. Too many Canadians lack necessary skills and are not accessing training
| Group | Level 2 or below, literacy | Level 2 or below, numeracy | Level 2 or below, literacy and numeracy |
|---|---|---|---|
| Total | 49.0 | 55.0 | 43.4 |
| Less than high school | 87.8 | 90.9 | 85.3 |
| High school only | 60.0 | 68.0 | 54.8 |
| PSE below bachelor | 48.3 | 55.1 | 41.7 |
| University graduates | 27.2 | 31.8 | 21.6 |
Source: Statistics Canada. University graduates with lower levels of literacy and numeracy skills
57.7% of adults with low skills in literacy and numeracy do not participate in job related education and training opportunities.
Source: OECD. "Getting Skills Right" (2019)
6. Too many Canadians lack necessary skills and are not accessing training
Canadians spend less time in training when compared internationally
| Country | Hours per year |
|---|---|
| Korea | 248 |
| Mexico | 226 |
| Japan | 148 |
| United States | 140 |
| Israel | 135 |
| Chile | 121 |
| Canada | 119 |
| Russian Federation | 117 |
| New Zealand | 113 |
| Australia | 103 |
Source: OECD, Programme for the International Assessment of Adult Competencies (PIAAC), 2012, 2015 and 2017
7. Investments in training are not keeping pace
Canada's training investments are low when compared internationally
| Year | Canada | OECD average |
|---|---|---|
| 2004 | 0.08 | 0.15 |
| 2005 | 0.08 | 0.15 |
| 2006 | 0.08 | 0.14 |
| 2007 | 0.08 | 0.12 |
| 2008 | 0.09 | 0.12 |
| 2009 | 0.14 | 0.15 |
| 2010 | 0.13 | 0.16 |
| 2011 | 0.10 | 0.14 |
| 2012 | 0.08 | 0.14 |
| 2013 | 0.08 | 0.14 |
| 2014 | 0.07 | 0.14 |
| 2015 | 0.07 | 0.13 |
| 2016 | 0.07 | 0.12 |
| 2017 | 0.06 | 0.13 |
| 2018 | 0.06 | 0.11 |
| 2019 | 0.06 | 0.1 |
| 2020 | 0.06 | 0.11 |
| 2021 | 0.07 | 0.11 |
Source: OECD, Public expenditure and participant stocks on labour market programming.
Diagram 9 text: Average spending per employee on learning and development
- Data from 2006 and 2018 shows that Canadian organizations were (and remain) behind their U.S. counterparts in workplace training investments
- Canadian firms spend 81 cents for every dollar spent by US organizations on average per employee on learning and development (2018)
Source: Conference Board of Canada. 2018.
Diagram 10 text: Cumulative Percentage growth in employment shares by task type expected over the period 2022 to 2031
- Non-routine cognitive: 0.8
- Routine: -1.05
Note: these projections do not take into account recent advance in Artificial Intelligence, such as the rapid adoption of Generative AI
Source: Source: Canadian Occupational Projection System, 2022 & Job Bank Data.
Disability inclusion and accessibility
Alternate formats
Disability inclusion and accessibility [PDF - 155 KB]
Large print, braille, MP3 (audio), e-text and DAISY formats are available on demand by ordering online or calling 1 800 O-Canada (1-800-622-6232). If you use a teletypewriter (TTY), call 1-800-926-9105.
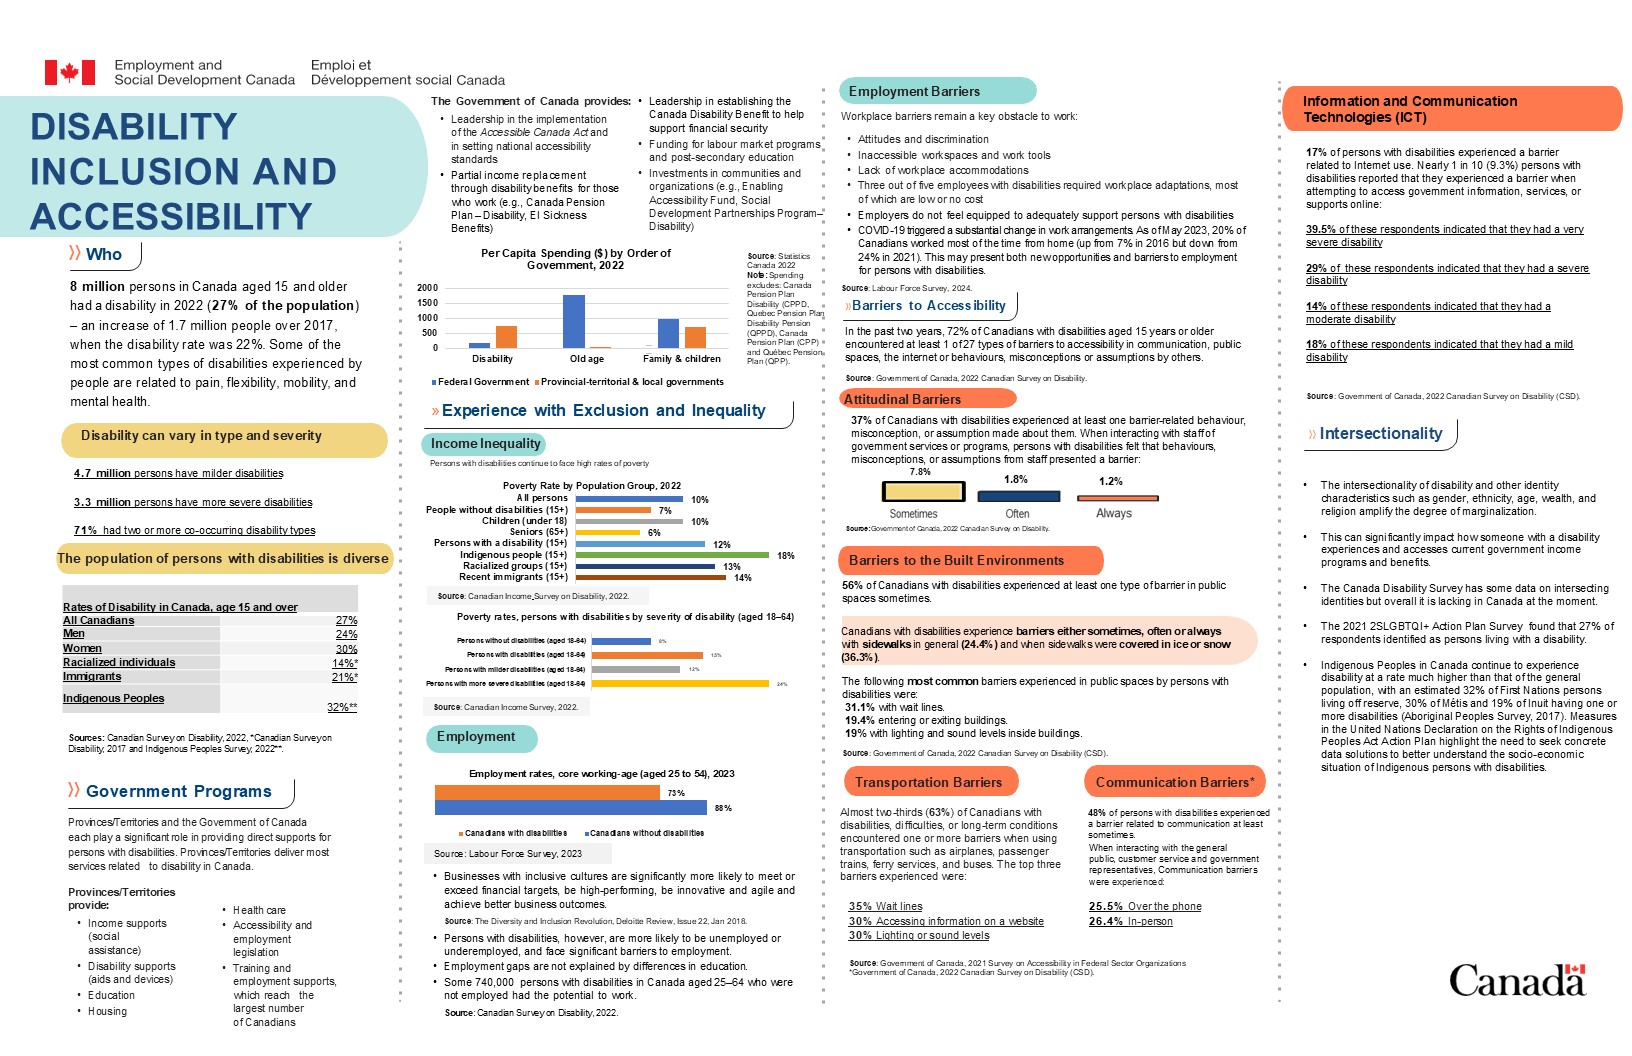
Figure 6. Text description
Disability inclusion and accessibility
Who
8 million persons in Canada aged 15 and older had a disability in 2017 (27% of the population) - an increase of 1.7 million people over 2017, when the disability rate was 22%.
Some of the most common types of disabilities experienced by people are related to pain, flexibility, mobility, and mental health.
Disability can vary in type and severity
- 4.7 million persons have milder disabilities
- 3.3 million persons have more severe disabilities
- 71% had 2 or more co-occurring disability types
The population of persons with disabilities is diverse
Rates of Disability in Canada, age 15 and over.
- 27% All Canadians
- 24% Men
- 30% Women
- 14% Racialized individuals*
- 21% Immigrants*
- 32% Indigenous Peoples**
Sources: Canadian Survey on Disability, 2022; *Canadian Survey on Disability 2017; and, **Indigenous Peoples Survey, 2022.
Government programs
Provinces/Territories and the Government of Canada each play a significant role in providing direct supports for persons with disabilities. Provinces/Territories deliver most services related to disability in Canada.
Provinces/Territories provide:
- income supports (social assistance)
- disability supports (aids and devices)
- education
- housing
- health care
- accessibility and employment legislation
- training and employment supports, which reach the largest number of Canadians
The Government of Canada provides:
- leadership in the implementation of the Accessible Canada Act and in setting national accessibility standards
- partial income replacement through disability benefits for those who work (for example, Canada Pension Plan - Disability, EI Sickness Benefits)
- leadership in establishing the Canada Disability Benefit to help support financial security
- funding for labour market programs ad post-secondary education
- investments in communities and organizations (for example, Enabling Accessibility Fund, Social Development Partnerships Program - Disability)
Bar graph is included that displays Per Capita Spending ($) in 2022, by Order of Government. The numbers on the graph are:
| 2022 | Federal Government | P/T governments |
|---|---|---|
| Disability | 202 | 760 |
| Old Age | 1,806 | 76 |
| Family and Children | 989 | 735 |
- Source: Statistics Canada, 2022
- Note: Spending excludes: Canada Pension Plan Disability (CPPD), Quebec Pension Plan Disability Pension (QPPD), Canada Pension Plan (CPP), and Quebec Pension Plan (QPP).
Experience with exclusion and inequality
Income inequality
Persons with disabilities continue to face high rates of poverty.
Bar graph is included that displays data for the poverty rate by population group in 2022. The numbers on the graph are:
- 10% All persons
- 7% People without disabilities (15+)
- 10% Children (under 18)
- 6% Seniors (over 65)
- 12% Persons with a disability (15+)
- 18% Indigenous Peoples (15+)
- 13% Racialized groups (15+)
- 14% Recent immigrants (15+)
Source: Canadian Income Survey, 2022.
Bar graph is included that provides the poverty rates of persons with disabilities age 18 to 64, in 2022. The numbers on the graph are:
- 8% Persons without disabilities (age 18 to 64)
- 15% Persons with disabilities (age 18 to 64)
- 12% Persons with milder disabilities (age 18 to 64)
- 24% Persons with more severe disabilities (age 18 to 64)
Source: Canadian Income Survey, 2022.
Employment
Bar graph is included that displays employment rates of core working-age Canadians, aged 25 to 54, 2023. The numbers on the graph are:
- 73% Canadians with disabilities
- 88% Canadians without disabilities
Source: Labour Force Survey, 2023.
Businesses with inclusive cultures are significantly more likely to meet or exceed financial targets, be high-performing, be innovative and agile and achieve better business outcomes.
Source: The Diversity and Inclusion Revolution, Deloitte Review, Issue 22, Jan 2018.
Persons with disabilities, however, are more likely to be unemployed or underemployed, and face significant barriers to employment.
Employment gaps are not explained by differences in education.
Some 740,000 persons with disabilities in Canada aged 25 to 64 who were not employed had the potential to work.
Source: Canadian Survey on Disability, 2022.
Employment barriers
Workplace barriers remain a key obstacle to work:
- attitudes and discrimination
- inaccessible workspaces and work tools
- lack of workplace accommodations
- 3 out of 5 employees with disabilities required workplace adaptations, most of which are low or no cost
- employers do not feel equipped to adequately support persons with disabilities
- COVID-19 triggered a substantial change in work arrangements. As of May 2023, 20% of Canadians worked most of the time from home (up from 7% in 2016 but down from 24% in 2021). This may present both new opportunities and barriers to employment for persons with disabilities
Source: Labour Force Survey, 2024.
Barriers to accessibility
In the past 2 years, 72% of Canadians with disabilities aged 15 years or older encountered at least 1 of 27 types of barriers to accessibility in communication, public spaces, the internet or behaviours, misconceptions or assumptions by others.
Source: Canadian Survey on Disability 2022.
Attitudinal barriers
37% of Canadians with disabilities experienced at least one barrier-related behaviour, misconception, or assumption made about them. When interacting with staff of government services or programs, persons with disabilities felt that behaviours, misconceptions, or assumptions from staff presented a barrier.
A bar graph is included that displays the rates of persons with disabilities who experience attitudinal barriers. The numbers on the graph are:
- 7.8% sometimes
- 1.8% often
- 1.2% always
Source: Canadian Survey on Disability, 2022.
Barriers to the built environment
56% of Canadians with disabilities experienced at least one type of barrier in public spaces sometimes.
Canadians with disabilities experience barriers either sometimes, often or always with sidewalks in general (24.4%) and when sidewalks were covered in ice or snow (36.3%).
The following most common barriers experienced in public spaces by persons with disabilities were:
- 31.1% with wait lines
- 19.4% entering or exiting buildings
- 19% with lighting and sound levels inside buildings
Source: Canadian Survey on Disability, 2022.
Transportation barriers
Almost two-thirds (63%) of Canadians with disabilities, difficulties, or long-term conditions encountered one or more barriers when using transportation such as airplanes, passenger trains, ferry services, and buses. The top 3 barriers experienced were:
- 35% wait lines
- 30% accessing information on a website
- 30% lighting or sound levels
Sources: Survey on Accessibility in Federal Sector Organizations, 2021.
Communication barriers
48% of persons with disabilities experienced a barrier related to communication at least sometimes.
When interacting with the general public, customer service and government representatives, communication barriers were experienced:
- 25.5% over the phone
- 26.4% in-person
Source: Canadian Survey on Disability 2022.
Information and communication technologies (ICT)
17% of persons with disabilities experienced a barrier related to Internet use. Nearly 1 in 10 (9.3%) persons with disabilities reported that they experienced a barrier when attempting to access government information, services or supports online:
- 39.5% of these respondents indicated that they had a very severe disability
- 29% of these respondents indicated that they had a severe disability
- 14% of these respondents indicated that they had a moderate disability
- 18% of these respondents indicated that they had a mild disability
Source: Canadian Survey on Disability, 2022.
Intersectionality
The intersectionality of disability and other identity characteristics such as gender, ethnicity, age, wealth, and religion amplify the degree of marginalization.
This can significantly impact how someone with a disability experiences and accesses current government income programs and benefits.
The Canadian Survey on Disability has some data on intersecting identities but overall it is lacking in Canada at the moment.
The 2021 2SLGBTQI+ Action Plan Survey found that 27% of respondents identified as persons living with a disability.
Indigenous Peoples in Canada continue to experience disability at a rate much higher than that of the general population, with an estimated 32% of First Nations persons living off reserve, 30% of Metis and 19% of Inuit having one or more disabilities (Aboriginal Peoples Survey, 2017). Measures in the United Nations Declaration on the Rights of Indigenous Peoples Act Action Plan highlight the need to seek concrete data solutions to better understand the socio-economic situation of Indigenous persons with disabilities.
Youth Employment, skills and learning
Alternate formats
Youth Employment, skills & learning [PDF - 250 KB]
Large print, braille, MP3 (audio), e-text and DAISY formats are available on demand by ordering online or calling 1 800 O-Canada (1-800-622-6232). If you use a teletypewriter (TTY), call 1-800-926-9105.
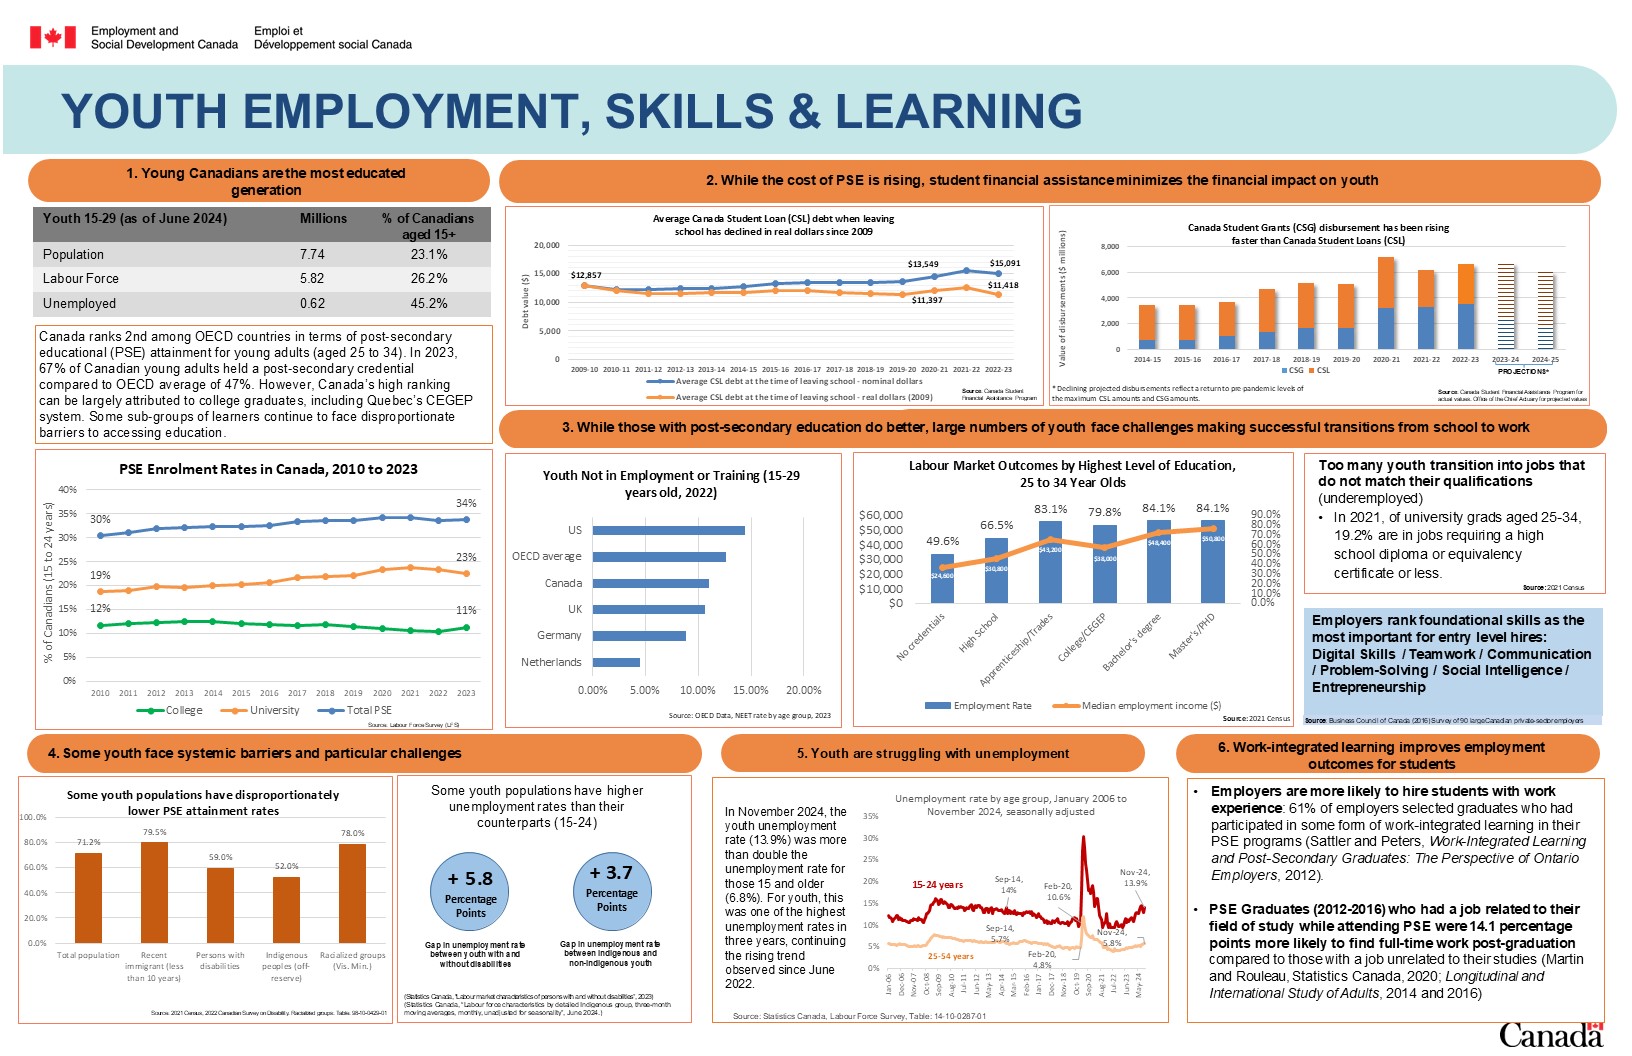
Figure 7: Text description
Youth Employment, skills and learning Infographic
1. Young Canadians are the most educated generation
| Youth 15 to 29 (as of June 2024) | Millions | % of Canadians aged 15+ |
|---|---|---|
| Population | 7.74 | 23.1% |
| Labour force | 5.82 | 26.2% |
| Unemployed | 0.62 | 45.2% |
Canada ranks 2nd among Organisation for Economic Co-operation and Development (OECD) countries in terms of post-secondary educational (PSE) attainment for young adults (aged 25 to 34). In 2023, 67% of Canadian young adults held a post-secondary credential compared to the OECD average of 47%. However, Canada's high ranking can be largely attributed to college graduates, including Quebec's CEGEP system. Some sub-groups of learners continue to face disproportionate barriers to accessing education.
Diagram 1 text: PSE Enrolment rates in Canada, 2010 to 2023
| Year | College | University | Total PSE |
|---|---|---|---|
| 2010 | 12 | 19 | 30 |
| 2011 | 12 | 19 | 31 |
| 2012 | 12 | 20 | 32 |
| 2013 | 12 | 20 | 32 |
| 2014 | 12 | 20 | 32 |
| 2015 | 12 | 20 | 32 |
| 2016 | 12 | 21 | 33 |
| 2017 | 12 | 22 | 33 |
| 2018 | 12 | 22 | 34 |
| 2019 | 11 | 22 | 34 |
| 2020 | 11 | 23 | 34 |
| 2021 | 11 | 24 | 34 |
| 2022 | 10 | 23 | 34 |
| 2023 | 11 | 23 | 34 |
Bolded figures in chart:
- in 2010, 12% of Canadians (15 to 24 years) were enrolled in a college in Canada. This has decreased to 11% in 2023.
- in 2010, 19% of Canadians (15 to 24 years) were enrolled in a university in Canada. This has increased to 23% in 2023.
- in 2010, 30% of Canadians (15 to 24 years) were enrolled in post-secondary education in total. This has increased to 34% in 2023.
Source: Statistics Canada, Labour Force Survey
2. While the cost of PSE is rising, student financial assistance minimizes the financial impact on youth
Diagram 2 text: Average Canada Student Loan (CSL) debt when leaving school has declined in real dollars since 2009.
| Year | Average Canada Student Loan debt at time of leaving school - nominal dollars | Average Canada Student Loan debt at time of leaving school - real dollars (2009) |
|---|---|---|
| 2009 to 2010 | $12,857 | $12,857 |
| 2010 to 2011 | $12,281 | $12,060 |
| 2011 to 2012 | $12,155 | $11,597 |
| 2012 to 2013 | $12,314 | $11,575 |
| 2013 to 2014 | $12,480 | $11,626 |
| 2014 to 2015 | $12,783 | $11,680 |
| 2015 to 2016 | $13 306 | $12,024 |
| 2016 to 2017 | $13 456 | $11,989 |
| 2017 to 2018 | $13 416 | $11,770 |
| 2018 to 2019 | $13 367 | $11,463 |
| 2019 to 2020 | $13 549 | $11,397 |
| 2020 to 2021 | $14 418 | $12,040 |
| 2021 to 2022 | $15 578 | $12,586 |
| 2022 to 2023 | $15 091 | $11,418 |
Bolded figures in chart:
- in 2009 to 2010, the average CSL debt load at the time of leaving school in nominal dollars was $12,857
- in 2009 to 2010, the average CSL debt load at the time of leaving school in real dollars (2009) was $12,857
- in 2022 to 2023, the average CSL debt load at the time of leaving school in nominal dollars was $15,091
- in 2022 to 2023, the average CSL debt load at the time of leaving school in real dollars (2009) was $11,418
Source: Canada Student Financial Assistance Program.
Diagram 3 text: Canada Student Grants (CSG) disbursement has been rising faster than Canada Student Loans (CSL)
| Year | Canada Student Grant disbursement (million) | Canada Student Loan disbursement (million) |
|---|---|---|
| 2014 to 2015 | $717.7 | $2,723.1 |
| 2015 to 2016 | $719.5 | $2,722.3 |
| 2016 to 2017 | $1,014.6 | $2,627.2 |
| 2017 to 2018 | $1,364.9 | $3,352.1 |
| 2018 to 2019 | $1,614.1 | $3,575.4 |
| 2019 to 2020 | $1,634.8 | $3,449.1 |
| 2020 to 2021 | $3,187.5 | $3,968.8 |
| 2021 to 2022 | $3,256.2 | $2,940.0 |
| 2022 to 2023 (projected)* | $3,408.0 | $3,015.0 |
| 2023 to 2024 (projected)* | $2,373.0 | $4,334.0 |
| 2024 to 2025 (projected)* | $1,754.0 | $4,308.0 |
- * (Asterisk): Declining projected disbursements reflect a return to pre-pandemic levels of the maximum CSL amounts (in 2021 to 2022) and CSG amounts (in 2023 to 2024).
- Source: Canada Student Financial Assistance Program.
3. While those with post-secondary education do better, large numbers of youth face challenges making successful transitions from school to work
Diagram 4 text: Youth Not in Employment, Education or Training (15 to 29 years old, 2022)
Canada ranks just below the OECD average in terms of youth not in employment, education or training in 2022
- United States of America: 14.5%
- OECD Average: 12.7%
- Canada: 11.0%
- United Kingdom: 10.6%
- Germany: 8.9%
- Netherlands: 4.5%
Source: OECD Data: NEET rate by age group, 2022.
Diagram 5 text: Labour Market Outcomes by Highest Level of Education, 25 to 34 Year Olds.
| Level of education | Employment rate - percentage | Median employment income - dollars |
|---|---|---|
| No credentials | 49.6 | $24,600 |
| High School | 66.5 | $30,800 |
| Apprenticeship/Trades | 83.1 | $43,200 |
| College/CEGEP | 79.8 | $38,000 |
| Bachelor's degree | 84.1 | $48,400 |
| Master's/PHD | 84.1 | $50,800 |
Source: 2021 Census
Too many youth transition into jobs that do not match their qualifications (underemployed):
In 2021, of university grads aged 25 to 34, 19.2% are in jobs requiring a high school diploma or equivalency certificate or less.
Source: 2021 Census.
Employers rank foundational skills as most important for entry level hires: Digital Skills / Teamwork / Communication / Problem-Solving / Social Intelligence / Entrepreneurship
Source: Business Council of Canada (2016) Survey of 90 large Canadian private-sector employers
4. Some youth face systemic barriers and particular challenges
Diagram 6 text: Some youth populations have disproportionately lower PSE attainment rates
The PSE attainment rate for the total youth population in Canada is 71.2%. In comparison, the PSE attainment rate for younger recent immigrants is 79.5%. The PSE attainment rate for persons with disabilities is 59.0%, 52.0% for Indigenous peoples living off-reserve, and 78.0% for racialized groups.
Sources: Census of Population, 2021; Canadian Survey on Disability, 2022. Racialized groups: Table: 98-10-0429-01
Some youth populations have higher unemployment rates than their counterparts (15 to 24)
Diagram 7 text: Unemployment rates for youth facing barriers
Unemployment rates for youth facing barriers
- Gap in unemployment rate between youth with and without disabilities - plus 5.8 percentage points
- Gap in unemployment rate between Indigenous and non-Indigenous youth - plus 3.7percentage points
Sources: Statistics Canada, "Labour market characteristics of persons with and without disabilities", 2023; Statistics Canada, "Labour force characteristics by detailed Indigenous group, 3-month moving averages, monthly, unadjusted for seasonality", June 2024.
5. Youth are struggling with unemployment
In November 2024, the youth unemployment rate (13.9%) was more than double the unemployment rate for those 15 and older (6.8%). For youth, this was one of the highest unemployment rates in 3 years, continuing the rising trend observed since June 2022.
| Date | 15 to 24 years | 25 to 54 years |
|---|---|---|
| January 2006 | 12.1 | 5.8 |
| December 2006 | 11.2 | 5.4 |
| November 2007 | 11.4 | 5.1 |
| October 2008 | 12.0 | 5.2 |
| September 2009 | 14.7 | 7.5 |
| August 2010 | 14.7 | 7.0 |
| July 2011 | 14.0 | 6.2 |
| June 2012 | 14.2 | 6.1 |
| May 2013 | 13.0 | 6.0 |
| April 2014 | 13.2 | 6.0 |
| March 2015 | 12.6 | 5.9 |
| February 2016 | 12.9 | 6.3 |
| January 2017 | 12.6 | 5.8 |
| December 2017 | 10.4 | 5.2 |
| November 2018 | 10.4 | 4.6 |
| October 2019 | 11.3 | 4.6 |
| September 2020 | 18.1 | 7.4 |
| August 2021 | 11.6 | 6.0 |
| July 2022 | 9.0 | 4.0 |
| June 2023 | 11.1 | 4.5 |
| May 2024 | 12.8 | 5.3 |
| November 2024 | 13.9 | 5.8 |
Source: Statistics Canada, Labour Force Survey, Table: 14-10-0287-01
6. Work-integrated learning improves employment outcomes for students
Employers are more likely to hire students with work experience: 61% of employers selected graduates who had participated in some form of work-integrated learning in their PSE programs (Sattler and Peters, Work-Integrated Learning and Post-Secondary Graduates: The Perspective of Ontario Employers, 2012). PSE Graduates (2012 to 2016) who had a job related to their field of study while attending PSE were 14.1 percentage points more likely to find full-time work post-graduation compared to those with a job unrelated to their studies. (Source: Martin and Rouleau, Statistics Canada 2020, Longitudinal and International Study of Adults 2014, 2016).
Seniors
Alternate formats
Seniors [PDF - 303 KB]
Large print, braille, MP3 (audio), e-text and DAISY formats are available on demand by ordering online or calling 1 800 O-Canada (1-800-622-6232). If you use a teletypewriter (TTY), call 1-800-926-9105.
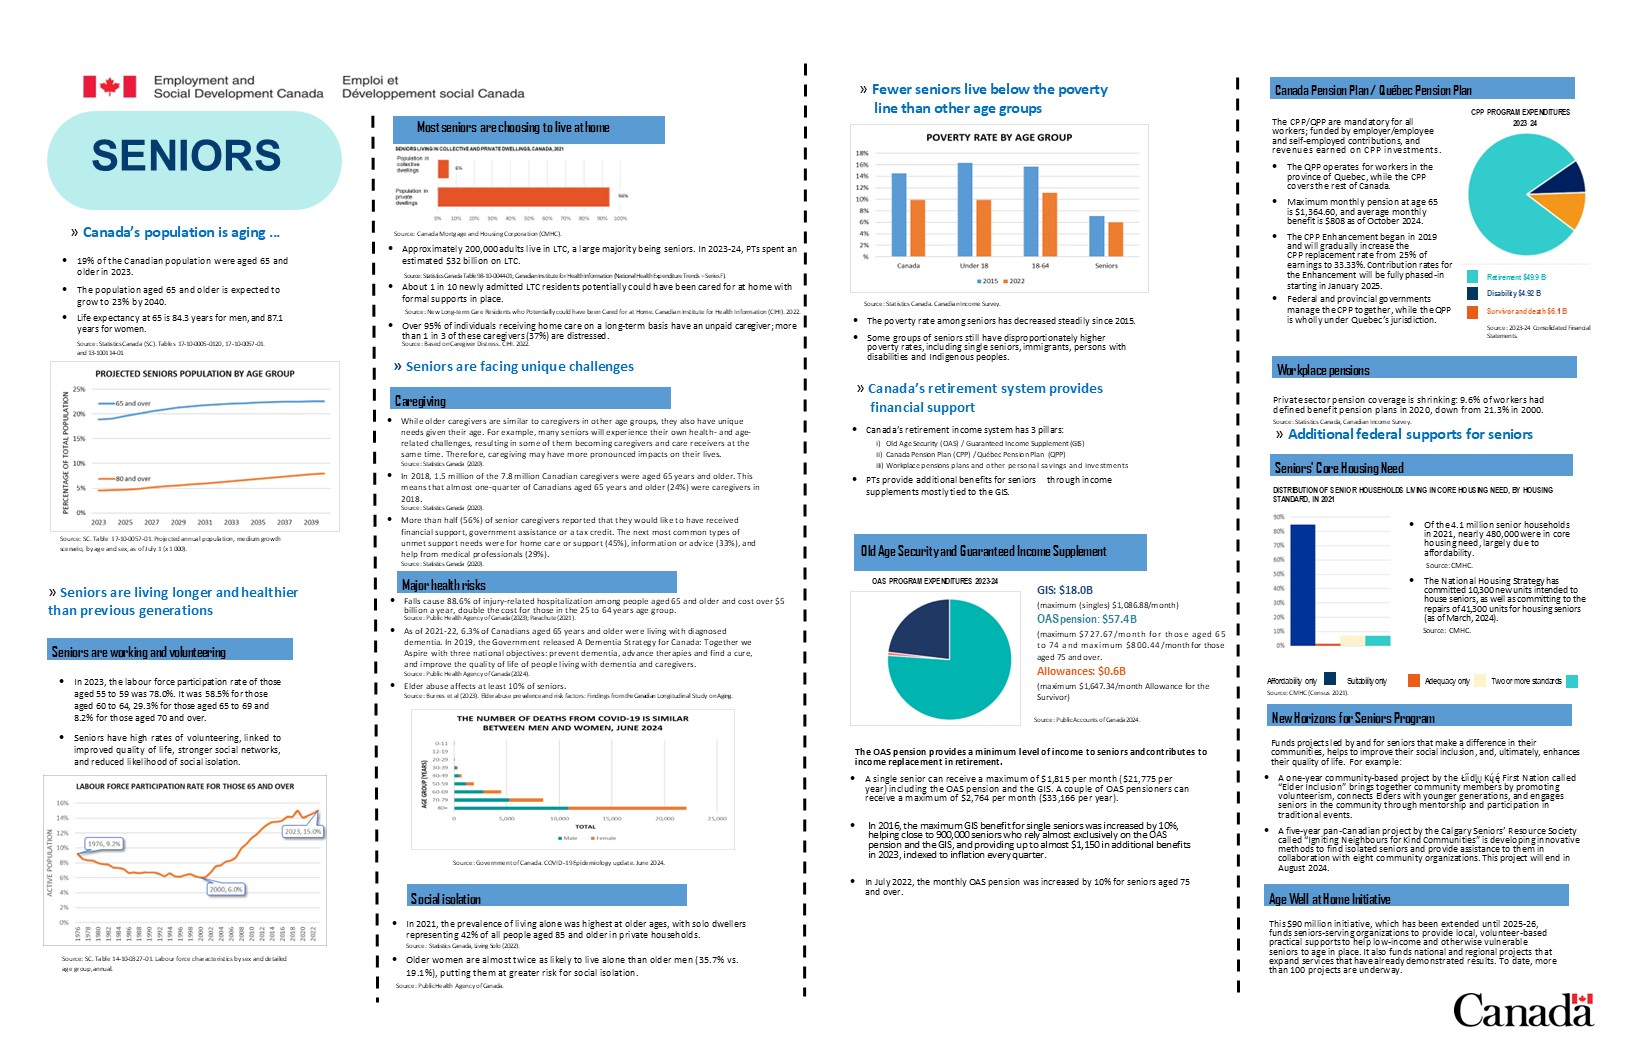
Figure 8. Text description
Seniors Infographic
Canada's population is aging
- 19% of the Canadian population were aged 65 and older in 2023.
- the population aged 65 and older is expected to grow to 23% by 2040.
- life expectancy at 65 is 84.3 years for men, and 87.1 years for women.
Source: Statistics Canada (SC). Tables 17-10-0005-0120, 17-10-0057-01, and 13-100114-01
[Chart: Based on a medium-growth projection, Canada's population proportion aged 65 and older is expected to grow from 18.9% in 2024 to 21.9% in 2030 and 23.3% in 2040. Based on the same projection, Canada's population proportion aged 80 and older is expected to grow from 4.5% in 2024 to 5.9% in 2030 and 8.3% in 2040]
Source: Statistics Canada (SC) Table 17-10-0057-01. Projected annual population, medium growth scenario, by age and sex, as of July 1 (x 1 000)
Seniors are living longer and healthier than previous generations
Seniors are working and volunteering
- In 2023, the labour force participation rate of those aged 55 to 59 was 78.0%. It was 58.5% for those aged 60 to 64, 29.3% for those aged 65 to 69 and 8.2% for those aged 70 and over.
- Seniors have high rates of volunteering, linked to improved quality of life, stronger social networks, and reduced likelihood of social isolation.
[Chart: The labour force participation rate of seniors aged 65 and older has more than doubled from 6.0% in 2000 to 15.0% in 2023. It was 9.2% in 1976]
Source: Statistics Canada (SC). Table 14-10-0327-01. Labour force characteristics by sex and detailed age group, annual
Most seniors are choosing to live at home
[Chart: In 2021, 94% of seniors in Canada were living in private households, while 6% were living in collective dwellings.]
Source: Canada Mortgage and Housing Corporation
- Approximately 200,000 adults live in LTC, a large majority being seniors. In 2023-24, PTs spent an estimated $32 billion on LTC.
Source: Statistics Canada Table 98-10-0044-01; Canadian Institute for Health Information (National Health Expenditure Trends - Series F)
- About 1 in 10 newly admitted LTC residents potentially could have been cared for at home with formal supports in place.
Source: New Long-term Care Residents who Potentially could have been Cared for at Home. Canadian Institute for Health Information (CIHI). 2022
- Over 95% of individuals receiving home care on a long-term basis have an unpaid caregiver; more than 1 in 3 of these caregivers (37%) are distressed.
Source: Based on Caregiver Distress. CIHI. 2022
Seniors are facing unique challenges
Caregiving
- While older caregivers are similar to caregivers in other age groups, they also have unique needs given their age. For example, many seniors will experience their own health- and age-related challenges, resulting in some of them becoming caregivers and care receivers at the same time. Therefore, caregiving may have more pronounced impacts on their lives.
Source: Statistics Canada (2020)
- In 2018, 1.5 million of the 7.8 million Canadian caregivers were aged 65 years and older. This means that almost one-quarter of Canadians aged 65 years and older (24%) were caregivers in 2018.
Source: Statistics Canada (2020)
- More than half (56%) of senior caregivers reported that they would like to have received financial support, government assistance or a tax credit. The next most common types of unmet support needs were for home care or support (45%), information or advice (33%), and help from medical professionals (29%).
Source: Statistics Canada (2020)
Major health risks
- Falls cause 88.6% of injury-related hospitalization among people aged 65 and older and cost over $5 billion a year, double the cost for those in the 25 to 64 years age group.
Source: Public Health Agency of Canada (2023); Parachute (2021)
- As of 2021-22, 6.3% of Canadians aged 65 years and older were living with diagnosed dementia. In 2019, the Government released A Dementia Strategy for Canada: Together we Aspire with three national objectives: prevent dementia, advance therapies and find a cure, and improve the quality of life of people living with dementia and caregivers.
Source: Public Health Agency of Canada (2024)
- Elder abuse affects at least 10% of seniors
Source: Burnes et al (2023). Elder abuse prevalence and risk factors: Findings from the Canadian Longitudinal Study on Aging
[Chart: The number of deaths from COVID-19 is similar between men and women, June 2024. Across all ages, death between men and women from COVID-19 is similar, with around 10 000 deaths for both gender over 80 years old.]
Source: Government of Canada. COVID-19 Epidemiology update. June 2024
Social isolation
- In 2021, the prevalence of living alone was highest at older ages, with solo dwellers representing 42% of all people aged 85 and older in private households.
Source: Statistics Canada, Living Solo (2022)
- Older women are almost twice as likely to live alone than older men (35.7% vs. 19.1%), putting them at greater risk for social isolation.
Source: Public Health Agency of Canada
Fewer seniors live below the poverty line than other age groups
[Chart: Poverty Rate by Age Group
Canada's poverty rate saw a decline from 14.5% of the population in 2015 to 9.9% of the population in 2022. This included:
- a decline from 16.3% in 2015 to 9.9% in 2022 for Canadians aged 18 and under
- a decline from 15.7% in 2015 to 11.1% in 2022 for Canadians aged 18 to 64
- a decline from 7.1% in 2015 to 6% in 2022 for Canadians aged 65 and older]
Source: Statistics Canada. Canadian Income Survey.
- the poverty rate among seniors has decreased steadily since 2015
- some groups of seniors still have disproportionately higher poverty rates, including single seniors, immigrants, persons with disabilities and Indigenous peoples
Canada's retirement system provides financial support
- Canada's retirement income system has 3 pillars:
- Old Age Security (OAS) / Guaranteed Income Supplement (GIS)
- Canada Pension Plan (CPP) / Québec Pension Plan (QPP)
- Workplace pensions plans and other personal savings and investments
- PTs provide additional benefits for seniors though income supplements mostly tied to the GIS.
Old Age Security and Guaranteed Income Supplement
Old Age Security Program Expenditures for 2023 to 2024
[Chart: GIS: $18.0B (maximum (singles) $1,086.88/month)
OAS pension: $57.4B (maximum $727.67/month for those aged 65 to 74 and maximum $800.44/month for those aged 75 and over).
Allowances: $0.6B (maximum $1,647.34/month Allowance for the Survivor)]
Source: Public Accounts of Canada 2024
The OAS pension provides a minimum level of income to seniors and contributes to income replacement in retirement
- A single senior can receive a maximum of $1,815 per month ($21,775 per year) including the OAS pension and the GIS. A couple of OAS pensioners can receive a maximum of $2,764 per month ($33,166 per year).
- In 2016, the maximum GIS benefit for single seniors was increased by 10%, helping close to 900,000 seniors who rely almost exclusively on the OAS pension and the GIS, and providing up to almost $1,150 in additional benefits in 2023, indexed to inflation every quarter.
- In July 2022, the monthly OAS pension was increased by 10% for seniors aged 75 and over.
Canada Pension Plan / Québec Pension Plan
The CPP/QPP are mandatory for all workers; funded by employer/employee and self-employed contributions, and revenues earned on CPP investments.
- The QPP operates for workers in the province of Quebec, while the CPP covers the rest of Canada.
- Maximum monthly pension at age 65 is $1,364.60 and the average monthly benefit is $808 as of October 2024.
- The CPP Enhancement began in 2019 and will gradually increase the CPP replacement rate from 25% of earnings to 33.33%. Contribution rates for the Enhancement will be fully phased-in starting in January 2025.
- Federal and provincial governments manage the CPP together, while the QPP is wholly under Quebec's jurisdiction.
CPP Program Expenditures 2023 to 2024
[Chart: Retirement: $49.9 Billion
Disability: $4.92 Billion
Survivor and death: $6.1 Billion]
Source: 2023 to 2024 Consolidated Financial Statements.
Workplace pensions
Private sector pension coverage is shrinking: 9.6% of workers had defined benefit pension plans in 2020, down from 21.3% in 2000.
Source: Statistics Canada, Canadian Income Survey
Additional federal supports for seniors
Seniors' core housing need
[Chart: In 2021, Census data indicated that 84.6% of senior households in core housing need lived in housing that failed to meet the affordability criteria. In addition:
- 1.5% lived in housing that failed to meet the suitability criteria
- 7.0% lived in housing that failed to meet the adequacy criteria, and
- 6.9% lived in housing that failed to meet two or more of the criteria]
Source: Canada Mortgage and Housing Corporation (Census 2021)
- of the 4.1 million senior households in 2021, nearly 480,000 were in core housing need, largely due to affordability
Source: Canada Mortgage and Housing Corporation
- the National Housing Strategy has committed 10,300 new units intended to house seniors, as well as committing to the repairs of 41,300 units for housing seniors (as of March, 2024)
Source: Canada Mortgage and Housing Corporation.
New Horizons for Seniors program
Funds projects led by and for seniors that make a difference in their communities, helps to improve their social inclusion, and, ultimately, enhances their quality of life. For example:
- a 1-year community-based project by the Łıı́d́lı̨ı̨ Kų́ę́ First Nation called "Elder Inclusion" brings together community members by promoting volunteerism, connects Elders with younger generations, and engages seniors in the community through mentorship and participation in traditional events.
- a 5-year pan-Canadian project by the Calgary Seniors' Resource Society called "Igniting Neighbours for Kind Communities" is developing innovative methods to find isolated seniors and provide assistance to them in collaboration with 8 community organizations. This project will end in August 2024.
Age Well at Home initiative
This $90 million initiative, which has been extended until 2025 to 2026, funds seniors-serving organizations to provide local, volunteer-based practical supports to help low-income and otherwise vulnerable seniors to age in place. It also funds national and regional projects that expand services that have already demonstrated results. To date, more than 100 projects are underway.
Service Canada is the face of Government for millions of Canadians
Alternate formats
Service Canada is the face of Government for millions of Canadians [PDF - 269 KB]
Large print, braille, MP3 (audio), e-text and DAISY formats are available on demand by ordering online or calling 1 800 O-Canada (1-800-622-6232). If you use a teletypewriter (TTY), call 1-800-926-9105.
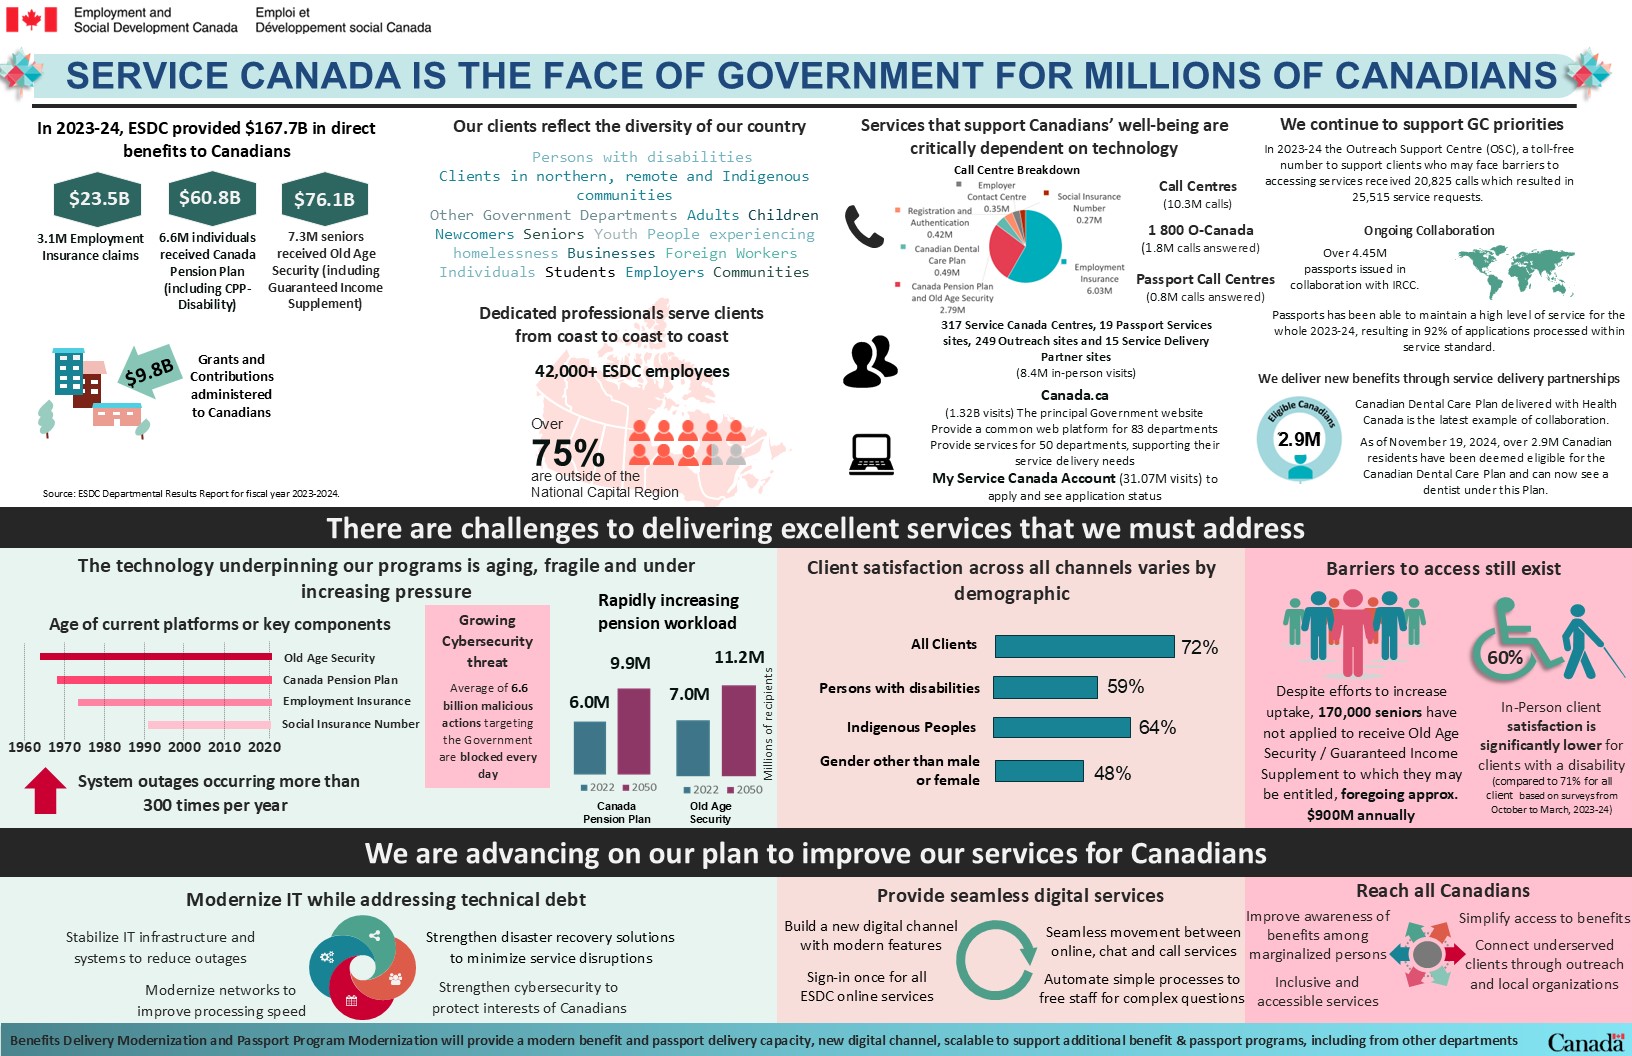
Figure 9. Text description
Service Canada is the face of Government for millions of Canadians infographic
In 2023 to 2024, ESDC provided $167.7B in direct benefits to Canadians
Of that amount, $23.5 billon were for 3.1 million Employment Insurance claims, $60.8 billion were for 6.6 million Canada Pension Plan payments, $76.1 billion were for 7.3 million seniors Old Age Security payments. A further, $9.8 billion in grants and contributions administered to Canadians.
Our clients reflect the diversity of our country:
- persons with disabilities
- clients in northern, remote and Indigenous communities
- other Government departments
- adults
- children
- newcomers
- seniors
- youth
- people experiencing homelessness
- businesses
- foreign workers
- individuals
- students
- employers, and
- communities
Dedicated professionals serve clients from coast to coast to coast
Employment and Social Development Canada has over 42,000 employees, over 75% of whom are located outside of the National Capital Region
Our services that support Canadian's well-being are critically dependent on technology
For telephone
- Call centers received over 10.3 M calls for program specific information.
- 1.8 M calls for general inquiries were received for the 1 800 O-Canada telephone line
- 0.8 M calls answered in the Passport Call Centres
Call center breakdown
- 6.03 M Employment Insurance
- 2.79 M Canada Pension Plan and Old age Security
- 0.49 M Canadian Dental Care Plan
- 0.42 M Registration and Authentication
- 0.35 M Employer Contact Centre
- 0.27 M Social Insurance Number
In-person: 317 Service Canada Centres, 19 Passport Services sites, 249 Outreach sites and 15 Service Delivery Partner sites with a total of 8.4M in-person visits.
Online: the principal Government website, Canada.ca, received 1.32 billion visits, the principal Government website Provide a common web platform for 83 departments. Provide services for 50 departments, supporting their service delivery needs.
- My Service Canada Account with 31.07 million visits was used to apply and see application status
We continue to support GC priorities
In 2023 to 2024 the Outreach Support Centre (OSC), a toll-free number to support clients who may face barriers to accessing services received 20,825 calls which resulted in 25,515 service requests.
Ongoing collaboration
Over 4.45 M passports issued in collaboration with IRCC.
Passports has been able to maintain a high level of service for the whole 2023-24, resulting in 92% of applications processed within service standard.
We deliver new benefits through service delivery partnerships
Canadian Dental Care Plan delivered with Health Canada is the latest example of collaboration. As of November 19, 2024, over 2.9M Canadian residents have been deemed eligible for the Canadian Dental Care Plan and can now see a dentist under this Plan.
There are challenges to delivering excellent services that we must address
The technology underpinning our programs is aging, fragile and under increasing pressure
Chart text: Age of current platforms or key components
The age of current platforms or key components for ESDC programs vary. For example, the Social Insurance Platform was created in 1992 and the Employment Insurance platform in 1975. In turn, the system that runs the Old Age Security program was created in 1965, and some components of the Canada Pension Plan in 1968.
System outages occurring more than 300 times per year
Growing cybersecurity threat
Average of 6.6 billion malicious actions targeting the Government are blocked every day.
Chart text: Rapidly increasing pension workload
It is anticipated that the workload for the Canada Pension Plan and Old Age Security will increase significantly in the next 29 years. In 2022, there were 6.0 million recipients of the Canadian Pension Plan. It is expected that this amount will increase to 9.9 million recipients by 2050. In 2022, there were 7.0 million recipients of Old Age Security and it is expected that by 2050 the number of recipients will increase to 11.2 million.
Chart text: Client satisfaction across all channels varies by demographic
- all clients: 72%
- persons with disabilities: 59%
- indigenous Peoples: 64%
- gender other than male or female: 48%
Barriers to access still exist
Despite efforts to increase uptake, 170,000 seniors have not applied to receive Old Age Security / Guaranteed Income Supplement to which they may be entitled, foregoing approximately $900M annually.
Client satisfaction is significantly lower for clients with a disability (compared to 71% for all client based on surveys from October to March, 2023 to 2024.
We are advancing on our plan to improve our services for Canadians
Modernize IT while addressing the technical debt by
- stabilizing IT infrastructure and systems to reduce outages
- modernizing networks to improve processing speed
- strengthening disaster recovery solutions to minimize service disruptions
- strengthening cybersecurity to protect interests of Canadians
Provide seamless digital services
- build a new digital channels with modern features
- sign-in once for all ESDC online services
- seamless movement between online, chat and call services
- automate simple processes to free staff for complex questions
Reach all Canadians
- improve awareness of benefits among marginalized persons
- inclusive and accessible services
- simplify access to benefits
- connect underserved clients through outreach and local organizations
Benefits Delivery Modernization and Passport Program Modernization will provide a modern benefit and passport delivery capacity, new digital channel, scalable to support additional benefit and passport programs, including from other departments.
Transforming service delivery while renewing technology
Alternate formats
Transforming service delivery while renewing technology [PDF - 275 KB]
Large print, braille, MP3 (audio), e-text and DAISY formats are available on demand by ordering online or calling 1 800 O-Canada (1-800-622-6232). If you use a teletypewriter (TTY), call 1-800-926-9105.
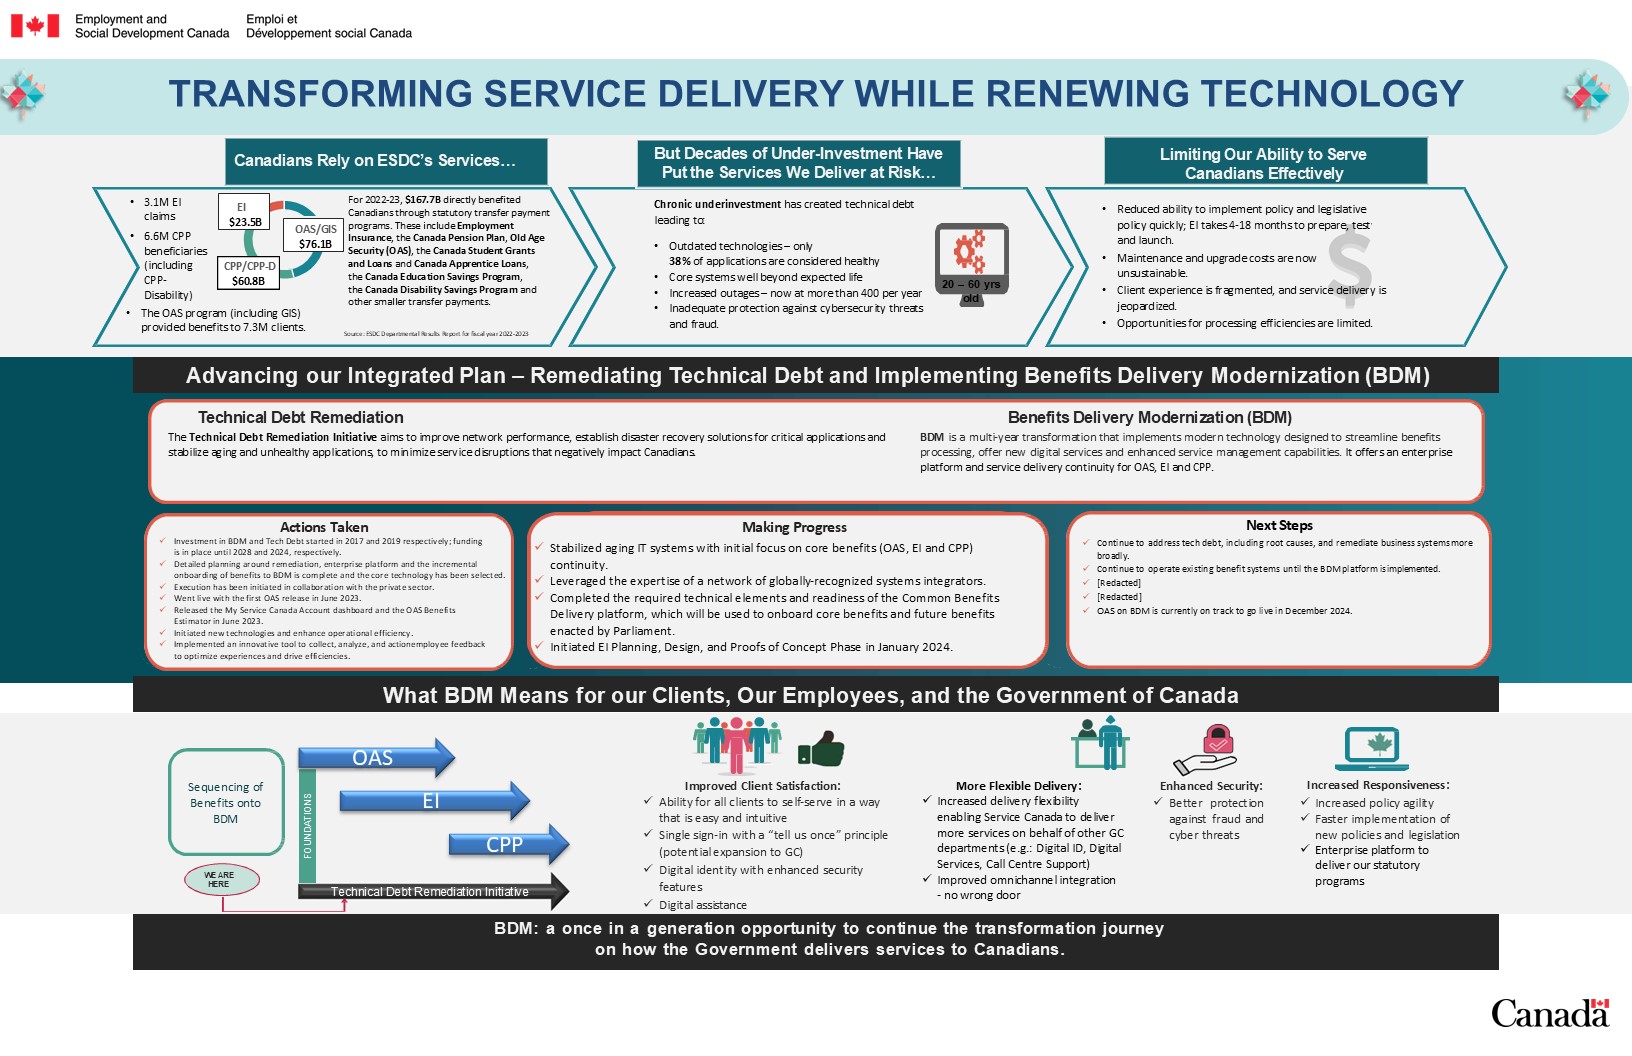
Figure 10. Text description
Transforming service delivery while renewing technology
Canadians rely on Employment and Social Development's services (ESDC)
- 3.1M EI claims
- 6.6M CPP beneficiaries (including CPP-Disability)
- the OAS program (including GIS) provided benefits to 7.3M clients
For 2022 to 2023, $167.7B directly benefited Canadians through statutory transfer payment programs. These include Employment Insurance, the Canada Pension Plan, Old Age Security (OAS), the Canada Student Grants and Loans and Canada Apprentice Loans, the Canada Education Savings Program, the Canada Disability Savings Program and other smaller transfer payments.
- $23.5 billion for Employment Insurance payments
- $60.8 billions for CPP/CPP-D payments
- $76.1 billions in OAS and Guaranteed Income Supplement (GIS) payments
But decades of under-investment have put the services we deliver at risk…
Chronic underinvestment has created technical debt leading to:
- outdated technologies - only 38% of applications are considered healthy
- core systems well beyond expected life
- increased outages - now at more than 400 per year
- inadequate protection against cybersecurity threats and fraud
Limiting our ability to serve Canadians effectively
- reduced ability to implement policy and legislative policy quickly; Employment Insurance takes 4 to 18 months to prepare, test and launch
- maintenance and upgrade costs are now unsustainable
- client experience is fragmented, and service delivery is jeopardized
- opportunities for processing efficiencies are limited
Advancing our Integrated Plan to remediate technical debt and implement Benefits Delivery Modernization (BDM)
Integrated Plan: Technical Debt Remediation and Benefits Delivery Modernization
The Technical Debt Remediation Initiative aims to improve network performance, establish disaster recovery solutions for critical applications and stabilize aging and unhealthy applications, to minimize service disruptions that negatively impact Canadians.
BDM is a multi-year transformation that implements modern technology designed to streamline benefits processing, offer new digital services and enhanced service management capabilities. It offers an enterprise platform and service delivery continuity for OAS, EI and CPP.
Action taken
- Investment in BDM and Tech Debt started in 2017 and 2019 respectively; funding is in place until 2028 and 2024, respectively.
- Detailed planning around remediation, enterprise platform and the incremental onboarding of benefits to BDM is complete and the core technology has been selected.
- Execution has been initiated in collaboration with the private sector.
- Went live with the first OAS release in June 2023.
- Released the My Service Canada Account dashboard and the OAS Benefits Estimator in June 2023.
- Initiated new technologies and enhanced operational efficiency.
- Implemented an innovative tool to collect, analyze, and action employee feedback to optimize experiences and drive efficiencies.
Making progress
- Stabilized aging IT systems with initial focus on core benefits (OAS, Employment Insurance and CPP) continuity.
- Leveraged the expertise of a network of globally-recognized systems integrators.
- Completed the required technical elements and readiness of the Common Benefits Delivery platform, which will be used to onboard core benefits and future benefits enacted by Parliament.
- Initiated Employment Insurance planning, design, and proofs of concept phase in January 2024.
Next steps
- Continue to address tech debt, including root causes, and remediate business systems more broadly.
- Continue to operate existing benefit systems until the BDM platform is implemented.
- [Redacted]
- [Redacted]
- OAS on BDM is currently on track to go live in December 2024.
What benefits delivery modernization means for our clients, our employees, and the Government of Canada
Proposed sequencing of benefits onto BDM
- Foundations (we are at this stage)
- OAS (underway)
- Employment Insurance (underway)
- CPP
Sequencing of Benefits onto BDM
Technical debt remediation initiative
Improved client satisfaction
- ability for all clients to self-serve in a way that is easy and intuitive
- single sign-in with a "tell us once" principle (potential expansion to GC)
- digital identity with enhanced security features
- digital assistance
More flexible delivery
- increased delivery flexibility enabling Service Canada to deliver more services on behalf of other GC departments (for example: Digital ID, Digital Services, Call Centre Support)
- improved omnichannel integration - no wrong door
Enhanced security
- better protection against fraud and cyber threats
Increased responsiveness
- increased policy agility
- faster implementation of new policies and legislation
- enterprise platform to deliver our statutory programs
BDM is a once in a generation opportunity to continue the transformation journey on how the Government delivers services to Canadians.