
Summative evaluation of the Budget 2008 Canada Student Loans Program (CSLP) Enhancements
List of abbreviations
- CAG
- Canada Access Grant
- CESP
- Canada Education Savings Program
- CMSF
- Canada Millennium Scholarship Foundation
- CSG
- Canada Student Grant
- CSG-FTDEP
- Canada Student Grant for Full-Time Students with Dependents
- CSG-LI
- Canada Student Grant for Students from Low-Income Families
- CSG-MI
- Canada Student Grant for Students from Middle-Income Families
- CSG-PD
- Canada Student Grant for Students with Permanent Disabilities
- CSG-PT
- Canada Student Grant for Part-Time Studies
- CSG-PTDEP
- Canada Student Grant for Part-Time Students with Dependents
- CSG-PDSE
- Canada Student Grant for Services and Equipment for Students with Permanent Disabilities
- CSGP
- Canada Student Grant Program
- CSLP
- Canada Student Loans Program
- DRR
- Debt Reduction in Repayment
- ESDC
- Employment and Social Development Canada
- IR
- Interest Relief
- LAD
- Longitudinal Administrative Databank
- NSLSC
- National Student Loans Service Centre
- PSE
- Post-Secondary Education
- RAP
- Repayment Assistance Plan
- RESP
- Registered Education Savings Plan
Executive summary
This summative evaluation examines the effectiveness of the Canada Student Loans Program (CSLP) enhancements introduced in Budget 2008 – specifically the new consolidated Canada Student Grant Program (CSGP), the Repayment Assistance Plan (or RAP – which replaced repayment assistance offered under the previous Interest Relief and Debt Reduction in Repayment provisions), and enhancements to loan access for part-time and married/common-law students.
The CSLP was created in 1964 to promote access to post-secondary education (PSE) and is financed and administered by the Government of Canada.
Footnote 1
The mandate of the CSLP is to promote accessibility to post-secondary education for students with demonstrated financial need. The CSLP lowers financial barriers through the provision of loans and grants which help ensure that Canadians have an opportunity to develop their knowledge and skills to participate in the economy and in society. Student loans are provided directly by the federal government with a 60/40 federal/provincial cost-sharing arrangement with participating provinces.
Footnote 2
This report summarizes the evidence collected from eleven studies prepared specifically for this evaluation (see Appendix 2). Many other studies were also used to complement these findings (see Appendix 3). Preliminary findings from an interim evaluation related to the implementation of the enhancements were published in 2015. Footnote 3
It is important to emphasize that the full impacts of the RAP require a longer timeframe to evaluate, as a student can receive assistance under the RAP for up to 15 years. Thus, the findings presented in this report can only provide preliminary evidence.
Main findings
Enhancements relevance
To what extent are the CSLP enhancements responsive to the needs of students? Footnote 4
Focus group participants aware of the CSLP enhancements introduced in Budget 2008 for part-time/married students perceived the enhancements to be valuable. Similarly, those who were aware of the RAP (the new repayment assistance measures) perceived it as being easier to apply for and more flexible than the previous provisions.
Regarding the CSGP, key informants in general agreed that it is important to offer grants alongside student loans. Grants help make PSE more accessible for disadvantaged students such as students from lower income families, students with children and those with disabilities. The literature suggested a need exists to help students overcome financial barriers, to help debt-averse students, for equity/societal reasons, and because they may be more effective than tax-related measures. Further, a survey of grant recipients indicated that 17.6% would not have continued with their studies if student grants were eliminated immediately and replaced by student loans, with lower income students being more likely not to continue.
CSGP disbursement and costs
What are the annual program costs and administrative costs of the CSGP? Footnote 5
After the introduction of the CSGP in the 2008-09 loan year, annual program costs (as measured by the total amount disbursed through grants and bursaries – including those under the former Canada Millennium Scholarship Foundation (CMSF)) increased from $421.2 million to $593.4 million in 2009-10, and to $715.3 million in 2013-14. The number of grants and bursaries disbursed increased almost every year between 2000-01 and 2013-14, with a major increase of roughly 180,000 after the implementation of the CSGP.
Administrative costs (including those related to the CMSF) increased from $42.8 million in 2008-09 to $53.0 million in 2013-14. As a percentage of annual program costs, administrative costs dropped from 10.0% to 7.3% over this period.
Impact of CSGP on CSLP
What has been the impact of the CSGP on student needs for the CSLP? Footnote 6
The introduction of the CSGP was expected to lower loan disbursements by $213.4 million between 2008-09 and 2009-10. However, little change in loan disbursements was seen ($2.08 billion in both 2008-09 and 2009-10), but the number of students accessing student loans increased by over 36,000. This increase could have been driven by a number of factors, including the introduction of the CSGP and/or the 2008 financial crisis, the latter of which may have compelled some to return to school – increasing the need for student loans. Given that for most students the CSGP grant amounts reduce the portion of financial assessed need covered by loans, it was estimated that the reduction in student loan amounts due to the CSGP was in the range of 11.5% to 17.0%. Further, statistical estimation analyses showed that student loan indebtedness levels at consolidation (the sum of all federal loan disbursements) were lower after the introduction of the CSGP. In the future, it is expected that the increasing use of Registered Education Savings Plans (RESPs) will also lead to lower student loan indebtedness levels.
Impact of CSGP on PSE access and persistence
Has the CSGP led to an increase in PSE access rates or in PSE persistence rates for the targeted groups? Footnote 7
Evidence collected for the CSG for students from low-income families and the CSG for students from middle-income families did not reveal an impact on PSE participation of either grant. However, from a more personal perspective, a survey of grant recipients suggested that those in receipt of the low-income grant were more likely to indicate that they would not have continued with their studies in the absence of the grant. One possible factor related to the lack of impact on PSE participation was the corresponding reduction in student loan amounts caused by the grant amounts and, hence, overall student financial aid remaining constant in most cases. Other potential factors that could have contributed to the lack of impact are the size of the grants relative to PSE costs and/or awareness issues. Further, the literature review suggested that if an existing student aid program switches from providing primarily loans to providing primarily grants or a combination of loans and grants, then there appears to be no statistically significant enrolment response except among low-income students. This last point could be an indication that the CSGP is an appropriate means for assisting Canadian families who struggle with the cost of higher education.
Although the literature indicated mixed effects of grants on PSE persistence, no strong evidence was found of a correlation between CSGP eligibility (for the two grants noted above) and a student remaining in school longer. It was again suggested that this finding was due to total student financial aid remaining constant (i.e. in most cases, little to no increase in overall financial liquidity).
Loan access – Part-time and married/common-law students
To what extent has there been an improvement in loan access for part-time students and for married students or students in common-law relationships? Footnote 8
Budget 2008 increased the maximum annual part-time student loan from $4,000 to $10,000. Following this change, there was a significant annual increase in the number of part-time student loan borrowers (rising from 1,425 in 2008-09 to 11,254 in 2013-14). It was estimated that 80.2% of the increase was related to the Budget 2008 change. Nevertheless, only about 1% of all part-time students access student loans.
Budget 2008 also announced a reduction in spousal contributions (from 80% to 70% of a spouse’s/partner’s disposable in-study income) to narrow the gap between contributions from spouses and parents of students. Although there was a 35% increase between 2008-09 and 2013-14 in the number of married/common-law student loan borrowers, this increase was identical to that for single students and was correlated with other factors such as the overall increase in the number of full-time married/common-law PSE students. Many key informants indicated that the decrease was insufficient.
Repayment Assistance Plan (RAP)
To what extent has the RAP made it easier for students to manage their loan debt? Footnote 9
The RAP was perceived by key informants and some focus group participants as a positive change, with the number of borrowers benefitting from repayment assistance measures increasing from 132,574 in 2008-09 to 160,572 in 2009-10 after the introduction of the RAP. Although the new parameters (e.g. affordable payments) can explain a portion of the increase in the number of beneficiaries, the impact of the 2008 financial crisis and resulting recession cannot be underestimated, as it negatively impacted employment outcomes for youth, making it more difficult for them to repay their student loans. The cost of loan repayment assistance decreased from $97.3 million in 2008-09 to $73.1 million in 2009-10, but eventually increased to $167.5 million in 2013-14.
Overall, the introduction of the RAP showed little impact on the repayment of loans compared to repayment under the old provisions. However, the full impact of the RAP had not yet been fully realized by 2013-14, and it is important to note that the recession likely had a tangible impact on loan repayment.
Awareness
To what extent are eligible students aware of the different measures? Footnote 10
Focus groups participants indicated that the canlearn.ca website has had minimal impact on their awareness of the RAP, since there was confusion between the canlearn.ca website and the National Student Loans Service Centre (NSLSC) website. However, among those who used the canlearn.ca website, there was a strong appreciation of the tools and a deeper understanding of the RAP than those who had not visited the website.
The CSGP survey conducted for the evaluation indicated that 39% of grant recipients were aware that they would qualify for a grant at the time of applying for a student loan and 30% knew of the variety of grants available when they first applied. Among those who were aware that they would qualify for a grant, 72% found that the eligibility criteria were clear at the time they applied for a loan.
Recommendations Footnote 11
Consider revising the formula used to calculate student loan repayment (e.g. basing repayment on net income instead of gross income) so that it is equitable for students in different circumstances. However, further analysis of the RAP may be required before implementing any major changes, given that the RAP has not yet fully matured.
- Continue to use the CSGP to target disadvantaged students and consider increasing the CSG amount and expanding CSG eligibility for lower income students to help reduce debt and provide extra liquidity to improve their PSE access and persistence.
- Further improve student loan access for married and common-law students, as the Budget 2008 changes were noted to have been insufficient and were shown to have not had any impact on loan access.
- Promote awareness of the information on the canlearn.ca website, as those who used the site found it to be of great benefit. In doing so, further awareness and understanding of the CSGP would also be enhanced for prospective PSE students.
Management response
Introduction
The Government of Canada is committed to enabling Canadians’ access to post-secondary education (PSE). Through the Canada Student Loans Program (CSLP), loans and grants are provided to eligible Canadians pursuing a post-secondary degree, diploma or certificate program at a designated educational institution.
The CSLP works in partnership with ten participating provincial and territorial governments and a third party service provider to deliver student financial assistance across the country. Within this extensive and complex operating environment, the Program and its partners have developed a successful relationship underpinned by a joint commitment to providing student financial assistance.
Announced in Budget 2008, the Government of Canada has taken action to increase the financial resources available to Canadian students and their families through three measures:
- The Canada Student Grants Program (CGSP), which provides low- and middle-income students with consistent and up-front funding to help pay for PSE
- The Repayment Assistance Plan (RAP), which assists borrowers who are having difficulty repaying their loans in managing their debt by paying back what they can reasonably afford; and
- The Repayment Assistance Plan for Borrowers with a Permanent Disability (RAP-PD), which assists borrowers who are having difficulty repaying their loans by making it easier to manage their debt by paying back what they can reasonably afford
The Program is currently in the process of negotiating a new service provider contract to provide financial and related administrative services for the CSLP, as the current one is set to expire in March 2018. This new contract includes the requirement for a dynamic service delivery model which utilizes a client-centric, modern, technologically advanced solution to ensure client satisfaction by providing clients and stakeholders with user-friendly access to services through online delivery channels and using streamlined paperless processes.
Moving forward, Budget 2016 proposes a package of reforms to the CSLP that will make PSE more affordable for students from low- and middle-income families and ensure that student debt loads are manageable. These measures will also simplify the application process for student financial assistance, making the CSLP more transparent and predictable.
Recommendations
The CSLP has considered the main findings of this evaluation and is pleased to present the following management response to the specific recommendations in the report. The CSLP within the Learning Branch of ESDC has responsibility for the proposed actions.
Recommendation 1
Consider revising the formula used to calculate student loan repayment (e.g. basing repayment on net income instead of gross income) so that it is equitable for students in different circumstances. However, it is understood that further evaluation of the RAP is required before implementing any major changes.
As part of Budget 2016, changes will be made to the RAP income thresholds to ensure that no borrower with student loans will be required to make any repayment until they are earning at least $25,000 per year (beginning in 2016-2017). This change will make student debt more manageable. The Program is mindful of the recommendation to consider basing repayment on net income instead of gross income so that it is equitable for students in different circumstances; however, such major changes to the program design elements need to be informed by further evidence in order to ensure a balance of program design with costs and simplicity of program operations. The CSLP strives to ensure the equitability and simplicity of use of the RAP and will continue to monitor uptake to ensure this debt management benefit fulfills its purpose.
With respect to fluctuating wages, it is the Program’s view that the RAP is sufficiently responsive to a borrower’s changing financial situation. RAP eligibility is assessed based on the applicant’s most recent monthly income. If an applicant is assessed as being able to make an Affordable Payment, and their income drops during their six-month RAP term, the applicant can ask for a re-assessment of their RAP application. This re-assessment would take the new income into account, and if eligible, the borrower’s Affordable Payment would be adjusted. Furthermore, if a borrower is ineligible for the RAP when they apply, but their financial situation changes in the future, they can re-apply and have their eligibility re-assessed. In lieu of revising the formula to account for fluctuating wages, steps could be taken to better inform applicants about the re-assessment process within the RAP.
Recommendation 2
Continue to use the CSGP to target disadvantaged students and consider increasing the CSG amount and expanding CSG eligibility for lower income students to help reduce debt and provide extra liquidity to improve their PSE access and persistence.
Canada Student Grants provide targeted, up-front, non-repayable financial assistance to PSE students from low- and middle-income families, students with dependants and students with disabilities. The grants are flat amounts that count towards the assessed need of students. Therefore, depending upon a student’s level of assessed need, the grants can contribute to the reduction of loan disbursement and amount of repayable student debt; it may also provide extra financial liquidity to the student.
As part of Budget 2016, grant amounts will be increased by 50% for the 2016-2017 academic year to ensure that students receive help that reflects the rising costs of PSE. Additionally, the Program will work with the provinces and territories to expand eligibility thresholds for grants starting in 2017-2018, so that even more students can receive non-repayable assistance.
The Program agrees with the report’s conclusion that the CSGP leads to a lower debt amount. This is consistent with the policy intent of the CSGP. Although currently there is no evidence to indicate that the CSGP has a positive impact on PSE access, this could be due to the fact that the amount of the grants (up to $2,000 for CSG-LI recipients) may still not be sufficient to create a financial incentive for under-represented groups to overcome the barriers to PSE participation. It is the Program’s view that enhancing grants could further improve PSE access. The recommendations from this evaluation will serve to inform the changes in CSGs.
Recommendation 3
Further improve student loan access for married and common-law students, as the Budget 2008 changes were noted to have been insufficient and were shown to have not had any impact on loan access.
Currently, students and parents are expected to contribute to the student’s education from income earned during their study periods. Parental contributions are assessed by determining the amount of discretionary income by subtracting the Moderate Standard Of Living cost from after-tax income. For married and common-law students, the spouses and partners are also expected to make a contribution. As part of Budget 2008, the requirement for spousal contributions was reduced from 80% to 70% of a spouse’s/partner’s disposable in-study income to narrow the gap between contributions from spouses and parents of students. Contributions for all groups of students are comparable to an objective standard rather than to each other.
Budget 2016 proposes to introduce a flat-rate student contribution to determine eligibility for Canada Student Loans and Grants to replace the current system of assessing student income and financial assets. This change would allow students to work and gain valuable labour market experience without having to worry about a reduction in their level of financial assistance. It would also benefit adult learners, many of whom may work while studying or have significant financial assets. The Program will be working collaboratively with provinces and territories to finalize the flat-rate contribution model for 2017–2018 academic year.
The Program recognizes that more could be done to improve access for married and common-law students. Treatment of married and common-law students and spousal income within the flat-rate design will be a focal point for discussions with provincial/territorial partners, to ensure the eligibility assessment remains transparent and predictable for all borrowers.
Recommendation 4
Promote awareness of the canlearn.ca website, as those who used it found it to be of great benefit. In doing so, further awareness and understanding of the CSGP would also be enhanced for prospective PSE students.
The program recognizes that the content of canlearn.ca proved valuable to those who use it and wants to find ways to make it more accessible for students. All correspondence to borrowers from the National Student Loan Service Centre (NSLSC) referred to canlearn.ca for further information on student loans and grants. Additionally, web searches for the NSLSC website automatically directed individuals to canlearn.ca. As of January 18, 2016, the content of canlearn.ca has migrated to Canada.ca. This content currently offers a number of interactive tools that help students save, plan, and pay for PSE. The CSLP will continue to work with partners to promote and increase use of the content, which can now be found on Canada.ca. As part of the transition to the new service provider contract, the Program is looking at ways to enhance borrower communications and promote awareness of program offerings. The new communication strategy will also include references to the content formerly found on canlearn.ca.
Conclusion
ESDC is committed to ensuring that the CSLP is fully responsive to the needs of Canada's post-secondary students, and will continue to explore ways to improve and enhance the design and delivery of the Program in collaboration with partners and stakeholders. The findings and recommendations of this evaluation will inform and support that work and contribute to a more effective and efficient program for the future.
1. Introduction
Budget 2008 included a number of enhancements to the Canada Student Loans Program (CSLP) and a new consolidated Canada Student Grant Program (CSGP). Among the CSLP enhancements were new measures to enhance student loan access for married/common-law and part-time students; improving the responsiveness of student loan repayment via the new Repayment Assistance Plan (RAP); and modernizing service delivery through improved online services, simplified application and repayment processes, and improved communications with students.
Although the intention was to have the majority of these CSLP enhancements and the CSGP implemented shortly on or after August 1, 2009, there were initial (intentional) delays in implementing the service delivery vision. A 2014 evaluation examined these delays and reported on the implementation status of the different enhancements, with a focus on the modernization of service delivery. Footnote 12
This evaluation report focuses on the extent to which the CSGP has increased post-secondary education (PSE) access and persistence and also examines various evaluation questions (see Appendix 1) surrounding the RAP and student loan access for married/common-law and part-time students. Ten separate lines of evidence were developed specifically for this evaluation (see Appendix 2).
1.1 Methodology and limitations
An evaluation framework for the Summative Evaluation of the Budget 2008 CSLP Enhancements was developed and it defines the scope of the overall evaluation of the new measures. A methodology document was also developed and provides details of the evaluation questions and the lines of evidence used to address them (see Appendix 2). It should be noted that the structure of the evaluation questions was based on the April 2009 Treasury Board Secretariat Policy on Evaluation.
Furthermore, an Evaluability Assessment report for the Summative Evaluation of the Budget 2008 CSLP Enhancements was also developed to ensure that the evaluation questions could be answered with the proposed methodology. The Evaluability Assessment determined that there were three key risks for the summative evaluation:
- (i) slow implementation of the CSLP enhancements that would prohibit a thorough evaluation of their impacts by the completed evaluation deadline of March 2016
- (ii) gaining access to a linked Longitudinal Administrative Databank (LAD), Canada Education Savings Program (CESP) and CSLP file from Statistics Canada in a timely manner; and
- (iii) having an appropriate methodology in place for measuring the impact of the CSGP on post-secondary education (PSE) access and persistence that is suitable for the available data
The first and third potential risks identified above have been addressed and are no longer outstanding risks. However, the second risk (i.e. gaining access to a linked LAD-CESP-CSLP file) did in fact occur and the evaluation was not able to access an income-based file (including an attempt to access a linked file containing Canada Revenue Agency T1 income tax data and CSLP administrative data). As a result, the analyses pertaining to the impact of the CSGP on PSE access and persistence had to rely on an unlinked LAD file which used a proxy for receipt of the Canada Student Grant (CSG). This represents a major limitation of this evaluation.
Another limitation is the absence of reliable microdata on Canada Study Grants prior to 2009-10, which has affected the ability to precisely determine the impact of the CSGP on indebtedness levels compared to the impact of grants and bursaries available prior to 2009-10.
Finally, to adequately measure the full impact of the RAP on student loan repayment requires additional years of data, as a student can receive assistance under the RAP for up to 15 years. Thus, the analysis presented here only provides evidence on the early impacts of the RAP.
2. Background
This section describes the rationale behind the Budget 2008 changes and details the specific CSLP enhancements that were announced. Footnote 13 The overall rationale for the changes introduced in 2008 stems from Advantage Canada, Footnote 14 where the government committed to making federal student financial assistance more effective. Footnote 15 As noted on page 113 in Budget 2008, “The combination of the new Canada Student Grant Program and measures to streamline and modernize the Canada Student Loans program will contribute to Canada’s Knowledge Advantage by helping to develop a highly-educated workforce well-equipped to take on the challenges of a fast-paced global economy.”
2.1 Budget 2008 CSLP enhancements
Budget 2008 committed $123 million over four years (starting in 2009) to streamline and modernize the CSLP. The new investments included the following three enhancements:
- $23 million over four years for a new service delivery vision to expand online services and enable students to manage their loans online from the point of applying through to repayment. Footnote 16
- $26 million over four years to narrow the gap between contributions from spouses and parents of students by reducing the expected spousal contributions (from 80% to 70% of a spouse’s/partner’s disposable income while in study), and to make federal student loans more attractive to part-time students. The specific measures that were implemented for part-time students included the ability to defer payments on the loan principal and accumulated interest until six months after studies are completed and an increase in the maximum loan amount available (from $4,000 to $10,000).
- $74 million over four years to make the CSLP more responsive to the economic circumstances of borrowers, including those with permanent disabilities, by providing greater assistance for those experiencing difficulty in repaying their loans – known as the Repayment Assistance Plan or RAP. Footnote 17
RAP eligibility is based on a student loan borrower’s family income, family size, and outstanding loan balance. Borrowers are approved for a period of six months and have the option to re-apply at the end of each six-month period.
The RAP consists of two stages. During Stage 1, student loan borrowers who qualify make affordable payments (which may be zero payment for some borrowers) toward their loan principal. Paying the loan principal first reduces the total debt. The government covers the interest amount owing that the borrower’s calculated affordable payment does not cover and borrower payments do not exceed 20% of personal income.
If a borrower requires further assistance after having received 60 months of RAP assistance during Stage 1, or has been in repayment for 10 years, the borrower may qualify for Stage 2, where the government continues to cover interest payments and begins to also cover the principal of the loan not met by the borrower’s affordable payment. The balance of the loan is gradually paid off so that no student loan debt remains after 15 years.
There is also a feature in the RAP for student loan borrowers with a permanent disability. In order to qualify, borrowers have to meet the eligibility criteria which are based on family income, family size, permanent disability status, disability-related expenses, and outstanding student loan balance. For this group, assistance with loan repayment ensures that no student loan debt remains after 10 years.
2.2 Canada Student Grant Program
In addition to the above enhancements, the federal government announced that “all federal grants will be integrated into one program that will provide more effective support to more students for more years of study, assisting Canadian families who struggle with the cost of higher education.” Footnote 18 Therefore, the CSGP replaces Canada Study Grants, Canada Access Grants and grants/bursaries previously offered by the Canada Millennium Scholarship Foundation (CMSF). Footnote 19
It was noted that “Budget 2008 invests $350 million in 2009–10, rising to $400 million in 2010–11, $415 million in 2011–12 and $430 million in 2012–13. The Canada Student Grant Program will consolidate this funding with approximately $138 million in annual investments currently provided through the patchwork of existing federal grants that go to students eligible for Canada Student Loans.” Footnote 20
The CSGP is aimed at increasing PSE participation and completion rates – particularly of under-represented groups (e.g. students from lower-income families, students with permanent disabilities, and students with dependents) – so that much needed talent and energy can be engaged in Canada’s future. The CSGP was designed so that students know up front how much money they will receive and when they will receive payments – a significant departure from the previous, less predictable granting system. The eligibility criteria for the new grants better reflects the particular financial circumstances facing the borrower (i.e. family income, months of study, number of dependants under the age of 12, etc.). Students’ eligibility for a CSG is assessed at the time the student applies for student financial assistance using the same application. To be eligible for a grant, a student must have at least $1 of assessed need. If an individual is eligible for more than one grant, he/she can receive more than one grant at the same time.
Canada Student Grants for full-time students Footnote 21
- Grant for Students from Low-Income Families (CSG-LI): if a student is from a low-income family and qualifies for a full-time Canada Student Loan, he/she may qualify to receive $250/month (half at the start of the year and half midway through). This grant is available for all years of undergraduate university, college or trade school programs, provided the entire program is a minimum of 60 weeks in length.
- Grant for Students from Middle-Income Families (CSG-MI): if a student is from a middle-income family and qualifies for a full-time Canada Student Loan, he/she may qualify to receive $100 per month of study. This grant is available for all years of undergraduate university, college or trade school programs, provided the entire program is a minimum of 60 weeks in length.
- Grant for Full-Time Students with Dependants (CSG-FTDEP): if a student is from a low-income family, qualifies for a full-time Canada Student Loan, and has children under the age of 12 as of the start of the study period, he/she may be eligible to receive $200 per month for each child.
- Grant for Students with Permanent Disabilities (CSG-PD): if a student has a permanent disability as defined in the Student Financial Aid regulations and qualifies for a full- or part-time Canada Student Loan, he/she may receive $2,000 per academic year to help cover the costs of accommodation, tuition and books.
- Grant for Services and Equipment for Students with Permanent Disabilities (CSG-PDSE): if a student is eligible for the CSG-PD and has a permanent disability which requires exceptional education-related costs for things such as tutors, note-takers, interpreters, brail assistance or technical aids, he/she may receive up to $8,000 per academic year to help pay for these expenses.
Canada Student Grants for part-time students
- Grant for Part-Time Studies (CSG-PT): if a student is a part-time student, qualifies for a part-time Canada Student Loan and is from a low-income family, he/she may be eligible for up to $1,200 per academic year.
- Grant for Part-Time Students with Dependants (CSG-PTDEP): if a student qualifies for a CSG-PT and has up to two children under the age of 12 as of the start of the study period, he/she may be eligible for $40 per week of study ($60 per week for those with three or more children under the age of 12).
Furthermore, following the introduction of the CSGP and the announcement that the “CMSF would close at the end of the 2008-2009 loan year”, Footnote 22 transition grants were also introduced for bursary and award recipients to ensure that each student continued to receive the same level of funding for the duration of their current PSE program as was the case under the CMSF.
3. Relevance of CSLP enhancements and Canada Student Grant Program
In order to address the relevance of the CSLP enhancements and CSGP, the following evaluation questions are addressed in this section:
- To what extent are the CSLP enhancements responsive to the needs of students?
- Is there a need to offer student grants alongside student loans?
- Do the objectives of the different measures align with federal government and Employment and Social Development Canada (ESDC) priorities?
- What is the role and responsibility for the federal government in delivering the CSLP/CSGP?
3.1 Responsiveness of CSLP enhancements
Most focus group participants indicated that they would not have been able to afford tuition and/or student living expenses without the CSLP, showing the importance of the program. Those aware of the CSLP enhancements introduced in Budget 2008 for part-time/married students perceived them as valuable, although awareness was not very widespread. Further, with regard to the expansion of online services, most believed the website canlearn.ca duplicated information already available from other sources, namely provincial student loan websites (e.g. Ontario Student Assistance Program). However, a small number of focus group participants found the canlearn.ca website to be valuable in terms of student loan management.
In general, focus group participants indicated that repayment assistance measures are helpful and some said they would have defaulted without them. Among focus group participants who were aware of the RAP (the new repayment assistance measures), the RAP was perceived as being easier to apply for and was considered to be more flexible than the previous programs (Interest Relief – IR and Debt Reduction in Repayment – DRR). Similarly, most key informants perceived the RAP as being a positive change for students, with several indicating that the RAP was a good program and/or a significant improvement over the IR and DRR provisions.
Nevertheless, most focus group participants felt that the formula used to calculate repayment assistance eligibility (based on gross income) should be based on net income, as some face automatic deductions from their gross income (e.g. union dues, health insurance, pension contributions, etc.) that others do not face. As well, some participants felt that the repayment system was not responsive to those with fluctuating wages, due to a requirement to estimate wages for the next three months (which also affects borrowers who are paid every two weeks). However, borrowers who experienced a job loss or more extreme situations (e.g. car accident) found the RAP responsive to their needs.
3.2 Need for Student Grants
Key informants in general agreed that it is important to offer student grants alongside student loans because grants help make PSE more accessible for disadvantaged students such as students from lower income families and those with disabilities. The literature suggests a need exists for the Canadian government to offer student grants alongside student loans to help students overcome financial barriers; Footnote 23 to help debt-averse students (particularly lower income students); Footnote 24 for equity reasons (e.g. for low-income students or those with disabilities); for societal reasons (e.g. return to society from education is higher than it is for individuals); Footnote 25 and because they may be more effective than current tax-related measures, which tend to mainly benefit higher income families. Footnote 26
The CSGP survey indicated that 17.6% of CSG recipients would not have continued with their studies if student grants were eliminated immediately and replaced by student loans. Of the 82.4% who would have continued, approximately 20% would have changed at least one of their enrolment decisions. Footnote 27 For example, some said that they would have worked while in school and/or worked more hours, while others would have taken fewer courses and/or enrolled part-time instead of full-time. A statistical analysis indicated that those receiving the CSG-LI were more likely to indicate that they would not have continued with their studies if it were not for the financial assistance received from the CSG-LI.
3.3 Alignment with federal government priorities
The CSLP enhancements and the CSGP are clearly aligned with federal government and ESDC priorities. Federal budgets and public statements made since Budget 2008 indicate they remain priorities, as additional enhancements continue to be made:
- Budget 2011 announced a number of changes, including:
Footnote 28
- Helping full-time students to earn more money by doubling the in-study income exemption from $50 per week to $100 per week
- Allowing part-time students to have higher family incomes without affecting their eligibility for a student loan
- Increasing the income eligibility threshold for part-time students used to determine eligibility for the CSG to align it with the threshold for full-time students from low-income families
- Reducing the in-study interest rate for part-time students from prime plus 2.5 per cent to zero, bringing them in line with full-time students
- Starting in 2012-13, forgiving a portion of the federal component of Canada Student Loans for new family physicians, nurses and nurse practitioners who agree to work in under-served rural and remote communities Footnote 29
- Budget 2014 eliminated the value of student-owned vehicles from the needs assessment process. More than 19,000 student loan borrowers who own vehicles will benefit from higher loan disbursements, for an estimated annual cost of $7.8 million
The 2015 Mandate Letter of the Minister of Employment, Workforce Development and Labour further noted that working with provinces and territories to make PSE more affordable for students from low- and middle-income families was a top priority. This included expanding the CSG-LI and increasing the income threshold for eligibility and making changes to the income thresholds in the RAP (the new repayment assistance measures) to ensure that no graduate with student loans will be required to make any repayment until they are earning at least $25,000 per year. Further, the 2015 Mandate Letter of the Minister of Finance indicated a top priority of supporting the Minister of Employment, Workforce Development and Labour in delivering on the plan to make PSE more affordable for students from low- and middle-income families.
Finally, ESDC reiterated the importance of the CSLP/CSGP on page 66 in the 2015-16 Report on Plans and Priorities, specifically that the learning program (which includes the CSLP and CSGP), “…helps Canadians participate in post-secondary education to acquire the skills and credentials that enable them to improve their labour market outcomes and adapt to changing labour market conditions. It reduces barriers to education by providing financial assistance to students…”
3.4 Delivering the CSLP/CSGP
The Government of Canada works in partnership with participating provincial and territorial governments to deliver student financial assistance to Canadian students. Footnote 30 Applicants for federal and provincial loans and grants are assessed through a single application process. For students receiving loan funding for full-time studies, roughly 60% is funded by the CSLP and 40% by provincial or territorial student loan programs. Footnote 31 Based on evidence collected for the 2011 CSLP summative evaluation, it was clearly demonstrated that there was a need for a federal program designed to facilitate equality in PSE access across the country. Footnote 32
Furthermore, the Government of Canada and five participating provinces have signed integration agreements (covering more than 80% of student loan borrowers) to ensure that the federal and provincial student loan programs operate with a common set of rules, principles and assistance measures, so that students receive financial assistance as a single loan product. Footnote 33
The CSLP contracts a private-sector Service Provider to manage borrower accounts, which operates under the name “National Student Loans Service Centre” or NSLSC. The NSLSC is the main point of contact for borrowers in managing their loans and it serves them throughout each phase of the loan cycle, from loan disbursement to repayment and repayment assistance. Borrowers in integrated provinces deal with the NSLSC as a single point of contact for their federal and provincial student loans.
The CSLP’s main information dissemination tool is the canlearn.ca website, which is the Government of Canada’s online source for information to help Canadians save, plan and pay for their PSE. Canlearn.ca also links to the NSLSC website, which allows borrowers to view and monitor details of their loans.
3.5 Summary of key findings
- The CSLP enhancements were generally seen as being responsive to the needs of students
- There are numerous reasons which justify the need to offer student grants alongside student loans
- The Government of Canada works with provincial/territorial governments to deliver the CSLP/CSGP and contracts a private-sector Service Provider to manage borrower accounts
4. Canada Student Grant Program
Evaluation questions pertaining to the CSGP are examined in this section, focussing on three specific areas:
- (i) program and administrative costs
- (ii) the impact of the CSGP on student loans and student loan debt; and
- (iii) the impact of the CSGP on PSE access and persistence
4.1 Program and administrative costs
This sub-section details CSGP activity and compares it with pre-CSGP financial support (i.e. the Canada Access Grant (CAG), Canada Study Grant and CMSF). The main questions addressed include the following:
- What are the annual program costs of the CSGP?
- What is the breakdown between the different grants?
- How does this compare to the annual program costs under the CAG, Canada Study Grant and CMSF?
- How many different students received a transition grant?
- What was the overall dollar value of all transition grants disbursed?
- What are the administrative costs for the CSGP?
- What are the administrative costs for the CSGP and how do they compare to the administrative costs under the CAG, Canada Study Grant and CMSF?
4.1.1 Total disbursements
Table 1 compares annual CSGP costs to those under the CAG, Canada Study Grant and CMSF. In 2000-01, the number of CSLP-related grants combined with CMSF grants and bursaries totalled 125,192 and amounted to $290.0 million, eventually rising to 186,604 and $421.2 million, respectively, by 2008-09. Footnote 34 Both figures continued to increase following CSGP implementation in 2009, with 425,860 grants and $715.3 million disbursed in 2013-14. It is noteworthy that there was a particularly sizeable jump in 2009-10, coinciding with the first full year under the CSGP. Footnote 35
The average grant amount declined from $2,257 in 2008-09 to $1,616 in 2009-10, mostly due to the more generous CMSF awards/bursaries (which averaged about $3,000 per year) ceasing to be offered after 2008-09. Note that since a student can receive more than one type of grant, award or bursary at the same time, the average amount received per grant/award/bursary recipient will be higher than the average grant amount presented in Table 1. Using the number of unique grant recipients provided in the CSLP Annual Reports, Evaluation calculated that the average grant amount per grant recipient declined since the implementation of the CSGP, from $2,010 in 2009-10 to $1,946 in 2013-14. Footnote 36 Thus, these results confirm that the average grant amount received per grant recipient has declined since the introduction of the CSGP.
| Loan year | Number of Grants/Awards/Bursaries disbursed | Total (millions of dollars) | Total (millions of dollars) in 2008 | Average amount (dollars) per Grant/Award/Bursary | Average amount (dollars) per Grant/Award/Bursary in 2008 |
|---|---|---|---|---|---|
| 2000-01 | 125,192 | 290.0 | 346.8 | 2,316 | 2,771 |
| 2001-02 | 119,427 | 277.9 | 324.2 | 2,327 | 2,715 |
| 2002-03 | 128,738 | 295.2 | 336.8 | 2,293 | 2,616 |
| 2003-04 | 126,903 | 303.2 | 336.5 | 2,389 | 2,652 |
| 2004-05 | 129,652 | 312.5 | 340.6 | 2,410 | 2,627 |
| 2005-06 | 172,643 | 392.0 | 418.0 | 2,271 | 2,421 |
| 2006-07 | 186,733 | 403.7 | 422.2 | 2,162 | 2,261 |
| 2007-08 | 177,896 | 397.3 | 406.6 | 2,233 | 2,285 |
| 2008-09 | 186,604 | 421.2 | 421.2 | 2,257 | 2,257 |
| 2009-10 | 367,309 | 593.4 | 591.8 | 1,616 | 1,611 |
| 2010-11 | 380,221 | 630.0 | 617.0 | 1,657 | 1,623 |
| 2011-12 | 389,395 | 646.7 | 615.4 | 1,661 | 1,580 |
| 2012-13 | 411,821 | 695.0 | 651.6 | 1,688 | 1,582 |
| 2013-14 | 425,860 | 715.3 | 664.6 | 1,680 | 1,561 |
Source: CSLP Annual Reports from 2000-01 to 2013-14 and Millennium Scholarship Annual Reports from 2000 to 2009.
1 Excludes CMSF Awards and bursaries disbursed in non-CSLP participating provinces and territories.
2 A loan year is equivalent to an academic year (i.e. from August 1 to July 31).
By type of grant delivered under the CSGP, Table A-4 in Appendix 4 indicates that three grants started under the Canada Study Grant (the grants for Students with Dependents, for the Accommodation of Students with Permanent Disabilities, and for High-Need Part-Time Students) and one grant started under the CAG (the grant for Permanent Disability) and that these continue to be provided. Since 2009-10, the number of grants and the amount disbursed for the CSG-FTDEP, CSG-PD, and CSG-PT have increased significantly, mainly due to the change in eligibility parameters and the maximum amount available per grant, while the number of grants for the CSG-PDSE has remained relatively constant.
The CAG-LI that was targeting first-year students from low-income families was eliminated in 2009-10 and a new CSG-LI was introduced, which provided 238,513 grants to students from low-income families in 2013-14 (amounting to $455.0 million) including grants to non-first-year students. The CSG-MI was also introduced in 2009-10, and provided 95,493 grants to students from middle-income families in 2013-14 (amounting to $72.3 million).
The total amount disbursed in transition grants was $52.1 million in 2009-10 (35,089 grants), $24.0 million in 2010-11 (15,884 grants), and $6.2 million in 2011-12 (4,365 grants) – the last year that transition grants were disbursed, as these grants were only introduced “to ensure that students would not be impacted negatively by the CMSF’s closure Footnote 37 ”, as explained in Section 2.2.
4.1.2 Administrative costs
To examine the administrative costs of disbursing grants before and after the CSGP, it is necessary to look at the different types of administrative costs (i.e. the statutory administrative cost of the grants, their operating costs, and the CMSF costs) to estimate total administrative costs over time.
Since no specific information on the administrative costs of the Canada Study Grant, CAG and CSGP exists, Evaluation pro-rated grant disbursements based on total CSLP disbursements in order to determine the portion of administrative costs attributable to grants. Footnote 38 The technical evaluation report related to CSGP costs estimated that statutory administrative costs (i.e. administration fees to provinces and territories and service provider costs) attributable to grants were $5.2 million 2008-09, rose to $14.7 million in the year after, and increased to $19.0 million in 2013-14 (as shown in Table 2).
To calculate the grant operating budget the Treasury Board Main Estimates (Part II) were used. These estimates provide information on operating expenses based on the departmental strategic outcome of “Learning”. Given that the CSLP and the related grants are part of “Learning”, Evaluation estimated the grant operating budget assuming that the same level of dollar effort is needed to operate all of the Learning programs. Footnote 39
Using the above assumption, the estimated costs for operating the grants are estimated to have been $4.3 million in 2004-05 and $34.0 million in 2013-14, with a significant increase between 2008-09 and 2009-10 (as shown in Table 2). Further, factoring in CMSF administrative costs, Table 2 shows that total administrative costs to deliver all grants and CMSF awards and bursaries rose from $27.6 million in 2004-05 to $53.0 million in 2013-14, although it is important to remember that the CMSF was not administered by the CSLP. Total administrative costs as a share of grant/CMSF expenditures rose from 7.4% in 2004-05 to 10.0% in 2008-09, but fell back to 7.3% by 2013-14.
Since the CSLP is delivered through the NSLSC, meaningful delivery cost comparisons with other ESDC programs that are not delivered by a third party are more problematic. Footnote 40 Nonetheless, the technical evaluation report concluded that the costs for delivering the CSGP and the other types of non-repayable student aid were not out of line compared to other ESDC programs, especially given the variance in the estimates for different ESDC programs. Footnote 41
| Fiscal year | Estimated statutory admin. costs related to grants (A) | Estimated grants operating budget (B) | CMSF admin. costs (C) | Total admin. costs (D) = (A) + (B) + (C) | Total grants and CMSF payments (E) | Total admin. costs as a percent of grant and CMSF payments (F) = (D) / (E) |
|---|---|---|---|---|---|---|
| 2000/01 | 0.3 | n/a | 10.0 | n/a | 350.5 | n/a |
| 2001/02 | 1.4 | n/a | 11.2 | n/a | 362.7 | n/a |
| 2002/03 | 1.5 | n/a | 15.0 | n/a | 346.7 | n/a |
| 2003/04 | 1.6 | n/a | 19.5 | n/a | 368.4 | n/a |
| 2004/05 | 1.8 | 4.3 | 21.4 | 27.6 | 371.9 | 7.4 |
| 2005-06 | 3.5 | 7.9 | 23.1 | 34.4 | 466.7 | 7.4 |
| 2006-07 | 5.1 | 11.7 | 25.9 | 42.7 | 500.0 | 8.5 |
| 2007-08 | 5.5 | 13.7 | 30.4 | 49.6 | 512.8 | 9.7 |
| 2008-09 | 5.2 | 11.8 | 25.7 | 42.8 | 429.3 | 10.0 |
| 2009-10 | 14.7 | 31.6 | 1.9 | 48.3 | 533.7 | 9.0 |
| 2010-11 | 17.8 | 30.9 | 0.0 | 48.7 | 620.7 | 7.8 |
| 2011-12 | 17.6 | 30.8 | 0.0 | 48.4 | 648.9 | 7.5 |
| 2012-13 | 19.0 | 32.9 | 0.0 | 51.8 | 680.2 | 7.6 |
| 2013-14 | 19.0 | 34.0 | 0.0 | 53.0 | 725.4 | 7.3 |
Sources: CMSF Annual Reports from 2000 to 2009, CSLP Annual Reports from 2000-01 to 2013-14, and Main Estimates, Part II, Treasury Board, from 2004-05 to 2013-14. Assumes CMSF payments were disbursed between January and March of each year.
4.2 Impact of CSGP on student loans
This section attempts to answer the following two evaluation questions:
- What has been the impact of the CSGP on student needs for the CSLP?
- To what extent has the CSGP impacted students’ overall student debt levels?
Although the introduction of the CSGP has led to a government expenditure increase, the Main Estimates indicated in 2009-10 that “…with the coming into force of the new Canada Student Grant Program, it is expected that loans disbursed will decrease by $213.4 million…” between 2008-09 and 2009-10. Footnote 42 This point was reiterated in the 2010 CSLP Actuarial Report, which indicated that “…the percentage of students at the loan limit is projected to decrease from 37% in 2008-09 to 33% in 2009-10 due to the new CSGP”. Footnote 43 The reason for these projections is that the grant amount is first applied against the assessed need, and the remaining assessed need (if any) is covered by the loan amount, except when the grant amount entirely covers the assessed need amount. Footnote 44
Looking at the effect of the CSGP on total student loan disbursements, Table 3 indicates that loans remained essentially unchanged at $2.08 billion between 2008-09 and 2009-2010 (contradicting the Main Estimates expected impact of a decrease of $213.4 million). However, the actual number of loans disbursed increased by roughly 10% between these two years, increasing from 365,363 to 401,734 loans disbursed.
This 10% increase could have been driven by a number of factors. Evidence collected in a technical report Footnote 45 suggests that this increase was only marginally related to an increase in the number of full-time PSE students, as the number of full-time PSE students grew at a slower pace than the number of student loan borrowers. However, a correlation was confirmed between the introduction of the CSGP and an increase in the proportion of PSE students receiving student loans. It is possible that the CSGP improved the attractiveness of student loans by providing more grants for students from low- and middle-income families. Another potential factor was the 2008 financial crisis, as some students may have had to rely more on student loans than they otherwise would have due to the contraction in the labour market and, subsequently, the inability to find a part- or full-time job. Footnote 46
| Loan year | Number of loans disbursed | Total loan amount disbursed (millions of dollars) | Average loan amount (dollars) | Average loan amount (of dollars in 2008) | Average loan balance at consolidation Footnote 47 (dollars) | Average loan balance at consolidation (of dollars in 2008) | Average tuition fees** (dollars) |
|---|---|---|---|---|---|---|---|
| 2000-01 | 343,588 | 1,570.1 | 4,554 | 5,447 | 9,655 | 11,548 | 3,447 |
| 2001-02 | 328,674 | 1,512.3 | 4,586 | 5,350 | 9,539 | 11,129 | 3,585 |
| 2002-03 | 328,991 | 1,549.2 | 4,695 | 5,357 | 10,265 | 11,712 | 3,749 |
| 2003-04 | 340,203 | 1,647.7 | 4,830 | 5,361 | 10,628 | 11,796 | 4,018 |
| 2004-05 | 337,256 | 1,634.0 | 4,829 | 5,263 | 11,051 | 12,043 | 4,140 |
| 2005-06 | 343,638 | 1,938.9 | 5,631 | 6,005 | 11,323 | 12,074 | 4,211 |
| 2006-07 | 343,261 | 1,930.7 | 5,614 | 5,871 | 12,232 | 12,793 | 4,400 |
| 2007-08 | 352,708 | 2,015.3 | 5,706 | 5,839 | 12,881 | 13,181 | 4,558 |
| 2008-09 | 365,363 | 2,078.0 | 5,687 | 5,687 | 13,222 | 13,222 | 4,747 |
| 2009-10 | 401,734 | 2,083.2 | 5,186 | 5,172 | 13,404 | 13,369 | 4,942 |
| 2010-11 | 424,575 | 2,218.9 | 5,226 | 5,118 | 13,013 | 12,745 | 5,146 |
| 2011-12 | 446,582 | 2,400.7 | 5,376 | 5,116 | 12,972 | 12,344 | 5,313 |
| 2012-13 | 472,167 | 2,566.4 | 5,435 | 5,096 | 13,250 | 12,423 | 5,586 |
| 2013-14 | 491,444 | 2,700.7 | 5,495 | 5,105 | 13,536* | 12,577* | 5,772 |
Source: CSLP Annual Reports from 2000-01 to 2013-14 and Statistics Canada (2013), “Tuition and Living Accommodation Costs for Full-Time Students at Canadian Degree-Granting Institutions Survey”.
Note: * Estimates from the CSLP administrative database for 2013-14 academic year.
** For full-time domestic undergraduate university students in Canada.
1 A loan year is equivalent to an academic year (i.e. from August 1 to July 31).
Table 3 also indicates that the average student loan amount (in nominal and 2008 dollars) for full-time borrowers declined significantly after the introduction of the CSGP and remained below pre-CSGP levels through 2013-14. Further analyses in a technical report Footnote 48 confirmed this by showing that most of the increase in the number of loans disbursed was due to a large increase in the number of small loans disbursed. As Table 4 shows, the number of loans disbursed with a loan amount of $2,500 or less increased by at least 64%, while the number of loans disbursed with a loan amount of over $5,000 declined by more than 4% between 2008-09 and 2009-10. This effect is likely related to the CSGP, as grant amounts reduce the need for larger loan amounts, by reducing the portion of financial assessed need covered by loans. Other contributing factors may have been the outreach activities for the new CSGP and the 2008 financial crisis. Using statistical analyses, it was estimated that the reduction in student loan amounts due to the CSGP was in the range of 11.5% to 17.0%.
| Student loan amount | |||||||||
|---|---|---|---|---|---|---|---|---|---|
| Academic year | $1 to $250 | $251 to $500 | $501 to $1,000 | $1,001 to $2,500 | $2,501 to $5,000 | $5,001 to $7,500 | $7,501 to $10,000 | More than $10,000 | Total |
| 2008-09 | 839 | 2,003 | 5,650 | 30,937 | 105,030 | 162,187 | 38,903 | 20,094 | 365,643 |
| Percent of distribution | 0.2 | 0.5 | 1.5 | 8.5 | 28.7 | 44.4 | 10.6 | 5.5 | 100.0 |
| 2009-10 | 1,866 | 3,771 | 10,578 | 50,945 | 122,646 | 154,738 | 38,215 | 18,954 | 401,713 |
| Percent of distribution | 0.5 | 0.9 | 2.6 | 12.7 | 30.5 | 38.5 | 9.5 | 4.7 | 100.0 |
| Percent of change | 122.4 | 88.3 | 87.2 | 64.7 | 16.8 | -4.6 | -1.8 | -5.7 | 9.9 |
Source: CSLP administrative data.
Given the decline in average student loan amounts, it is not surprising that the average student loan balance at consolidation Footnote 49 (in nominal and 2008 dollars) declined in 2010-11 and 2011-12 (as Table 3 showed), suggesting an impact of the CSGP. Footnote 50 Table 3 also indicated that the decline in average student loan amounts and student loan balances at consolidation occurred while tuition fees continued to increase, providing supplementary evidence that the introduction of the CSGP reduced student loan debt.
To determine whether or not the CSGP did in fact have an impact on student loan debt, statistical estimation analyses were completed. Accounting for socio-demographic factors and inflation, statistical analyses estimated that student loan indebtedness at consolidation fell by between 4.9% and 7.0% from 2010-11 to 2013-14. Footnote 51 This may have been partly due to the CSGP, but it is likely that other factors (including the increased use of Registered Education Savings Plans Footnote 52 ) may have also played a role. The statistical models also confirmed that the increase in student loan borrowing limits in 2005-06 (from $165 to $210 per week of study) led to an increase in debt levels at consolidation (as was evident in Table 3).
A survey of CSGP grant recipients conducted for the evaluation revealed that 82% of respondents reported student loan debt (including provincial student loans) averaging $19,521 (15% did not know how much student loan debt they had accumulated and 3% reported no debt). The survey also indicated that 76% did not currently owe anything in other forms of debt (including loans from banking institutions) that were strictly related to their studies. Among the other 24% the average amount owing was $3,569.
4.3 Impact of CSGP on PSE participation and persistence
As noted in Section 2.2, the objective of the CSGP is to increase PSE participation and completion rates. To measure whether or not this objective is being achieved, this section addresses the following evaluation questions:
- Are grants a better way of dealing with access and persistence issues than loans for certain types of students?
- Has the CSGP led to an increase in PSE access rates for the targeted groups?
- Has the CSGP led to an increase in PSE completion rates for the targeted groups?
- How much additional grant funding is needed in order to increase PSE participation/completion rates by 1%?
4.3.1 PSE participation
Although evidence collected from key informant interviews with federal/provincial student loan representatives and academics did not suggest an optimal combination of grants and loans for dealing with PSE access and persistence, grants were identified as more effective in assisting low-income students. Nevertheless, the literature review completed for the 2011 CSLP Summative Evaluation suggested that multiple forms of student financial assistance are critical to increasing PSE enrolment levels. Footnote 53
The literature review completed specifically for this evaluation indicates that budget/liquidity constraints impact PSE participation, especially in the U.S. For instance, it was determined that increasing liquidity through student financial aid or reducing budget constraints by $1,000 led to an increase in PSE participation rates of 3 to 4 percentage points, as noted in Dynarski (2000) and Dynarski (2003). Footnote 54 The literature review also suggested that if an existing student aid program switches from providing primarily loans to providing primarily grants or a combination of loans and grants, then there appears to be no statistically significant enrolment response except among low-income students. This last point could be an indication that the CSGP is an appropriate means for assisting “Canadian families who struggle with the cost of higher education.” Footnote 55
Related to this, three studies developed for the 2011 CSLP Summative Evaluation demonstrated that each additional $1,000 in loans increases the enrolment of students from low-income families by a range of 0.4 to 1.0 percentage points. It should be noted that one of the studies did not find any grant effect on PSE participation. However, the study indicated that “the smaller impact of grants than loans is counter-intuitive. It probably reflects the fact… that in many provinces grants are subtracted from need and reduce the amount of loans”, thereby corroborating U.S. results that switching from loans to grants without increasing liquidity has limited impacts.
A more recent study (Frenette 2011) estimated the impact of prospective debt load on the probability of PSE attendance among youth using data on the CAG for low-income youth and the Millennium Access Bursaries. Footnote 56 The study found no evidence that the grants helped raise PSE enrolment. Frenette (2012) focused on estimating the cost reducing ability of the CSG‐LI and CSG‐MI. Footnote 57 Unlike their predecessor (the CAG for youth from low‐income families) and the concurrent Millennium Access Bursaries – both of which offered loan remissions but no additional liquidity, the CSG‐LI and CSG‐MI offer both loan remissions and additional liquidity. Findings indicated that the CSG‐LI was successful in reducing direct costs of students but had no impact on out-of-pocket costs (the study found no impacts of the CSG-MI on either direct costs or out-of-pocket costs). Footnote 58 A technical report by Frenette (2015) that was developed for this evaluation provided little to no evidence of a statistical association between CSGP grant eligibility and PSE access. Footnote 59
Using a combination of several databases aggregated at the provincial level, two models were developed to capture the effect of loans and grants on PSE enrolment. Footnote 60 One model indicated a statistically significant positive effect of the total loan amount disbursed on the PSE participation rate, showing that an increase of 1% in the total amount of loans disbursed leads to an increase in PSE participation of between 0.119% and 0.135%. The other model that included total financial aid (loans and grants disbursed grouped together) suggested a similar impact on enrolment rates, showing that an increase of 1% in total financial aid leads to an increase of between 0.104% and 0.119% in the PSE participation rate. However, neither model showed a significant impact of grants on their own, corroborating results from previous studies.
In dollar terms, this implies that an additional loan disbursement or total financial aid increase of between $143 million and $162 million would lead to a 1% increase in PSE participation, assuming an average annual loan amount disbursement equal to the average loan disbursement between 2000-01 and 2012-13 ($1.93 billion) and holding other factors constant.
4.3.2 PSE persistence
In addition to the impact of the CSGP on PSE participation, the degree to which the presence of student financial aid contributes to students remaining in school and completing their studies is also important. The literature review noted that students whose financial aid package was not adequate to cover the actual cost of studying or who accumulated high levels of debt were less likely to complete their studies, suggesting that within a financial aid package, the non-repayable grant component can be a key component to encourage PSE persistence. A U.S. study showed that “need-based aid improves retention, but that its level of effectiveness varies with need. Specifically, grants… increase the retention probability by 1.3 percent per $1,000, whereas subsidized loans increase the retention probability by 4.3 percent per $1,000”. Footnote 61
Two other U.S. studies (Dynarski (2008) and Scott-Clayton (2011)) found that scholarships had a large impact on college completion. Footnote 62 In a more recent study, Castleman and Long (2013) found that an additional $1,000 in grant aid eligibility was associated with a 3.5 percentage point increase in the probability of earning a bachelor’s degree within six years. Footnote 63 As pointed out by Frenette (2015), the grant in the Castleman and Long study did not reduce the loan amount and, therefore, led to an increase in budget liquidity.
Similarly, in Canada, the study The Price of Knowledge (2009) indicated that receiving need-based student assistance in the form of loans or grants can improve PSE persistence. Footnote 64 Findings from another study related to the CMSF suggested that higher levels of persistence were positively correlated with low student loan debt levels and financial aid received in the form of grants. Footnote 65 However, two additional studies pertaining to the CMSF found no evidence of an increase in persistence after 2000, following the introduction of the CSMF. Footnote 66
The CSGP survey indicated that 67% of survey respondents would have continued with their studies without any changes even if student grants no longer existed. Another 15% would have changed an aspect of their enrolment decision such as working while studying, studying part-time, registering in a different program or in a different institution, and another 18% indicated they would not have continued with their studies, mainly due to having to borrow too much money. CSG-LI recipients were more likely to indicate that they would not have continued with their studies, perhaps reflecting the greater importance of grants for students from low-income families.
Frenette (2015) did not find any strong evidence that CSGP eligibility was related to PSE persistence. Evaluation also developed several models to estimate the impact of student grants and loans on the graduation rate. Footnote 67 In all models, the statistical estimation analyses indicated that student loans, grants, and total financial aid were not significantly correlated with graduation rates. Even when Evaluation measured the cumulative effect of several years of financial aid receipt on graduation rates, results again indicated no evidence of a strong correlation between financial aid and a change in graduation rates.
4.4 Summary of key findings
- The number and dollar value of grants disbursed increased substantially following the introduction of the CSGP, although the average grant amount declined
- Administrative costs for delivering the CSGP appear to be in line with other ESDC programs
- The average student loan amount for full-time borrowers declined significantly after the introduction of the CSGP, suggesting a positive CSGP impact
- Average student loan balances at consolidation fell by between 4.9% and 7.0% between 2010-11 and 2013-14 due to the CSGP
- There was little evidence to suggest that the CSG-LI or CSG-MI led to higher PSE access or persistence rates
5. Enhancements related to student loans
Along with the introduction of the CSGP, the government improved the attractiveness of student loans for married/common-law students and part-time students and also introduced the RAP (the new repayment assistance measures) to facilitate repayment for students facing financial hardship. This section presents findings on loan access for the two aforementioned groups and then examines the early effects of the RAP on student loan repayment.
5.1 Loan access – Part-time and married/common-law students
In this section, the following evaluation questions are addressed:
- To what extent has there been an improvement in loan access for part-time students?
- To what extent has there been an improvement in loan access for married students or students in common-law relationships?
Budget 2008 announced that the loan amount part-time students are eligible to receive increased from $4,000 to $10,000 and that they no longer have to justify the reason(s) for studying part-time. Part-time students are also able to defer loan re-payments and accumulated interest until after they have completed their studies. Footnote 68 Many of the key informants indicated that the changes made through Budget 2008 have improved loan access for part-time students and that it has brought the part-time program more in line with the full-time program. Footnote 69
As shown in Figure 1, during the 2000-01 to 2008-09 loan years the number of part-time student loan borrowers declined by more than 50% (from 2,867 to 1,425). Following the implementation of Budget 2008, the number of part-time borrowers increased significantly each year thereafter, eventually rising to 11,254 in 2013-14. Consequently, it is likely that the large increase in the number of part-time student loan borrowers after 2008 can be attributed to the Budget 2008 enhancement for part-time borrowers. A technical report Footnote 70 estimated that the 2008 enhancement accounted for 80.2% of the increase in the number of part-time borrowers.
The average student loan amount for part-time borrowers decreased after 2008. ESDC (2012A) showed that although close to 10% of part-time borrowers received a student loan of between $4,000 and $10,000 after 2008, close to 50% received less than $1,000 (compared to 23% before 2008).
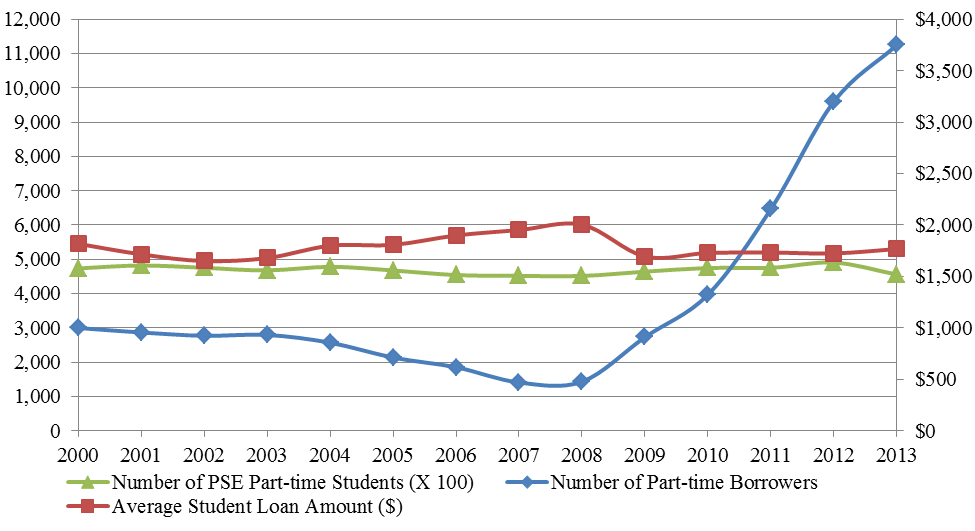
Text description of Figure 1 – Number of part-time PSE students, part-time student loan borrowers and the average student loan amount from 2000-01 to 2013-14
Figure 1 provides a line graph which includes the number of part-time post-secondary education students, part-time student loan borrowers, and the average student loan amount from 2000-01 to 2013-14. The data sources are the Canada Student Loans Program administrative data and Labour Force Survey data.”
Source: CSLP administrative data and Labour Force Survey data (tabulation ESDC).
Although key informants generally had a positive view of the enhancement for part-time students, opinion was divided on the change introduced for married/common-law students. Some key informants welcomed the 10% reduction in the in-study spouse/partner contribution from 80% to 70%, while others indicated that the 10% decrease was insufficient. Footnote 71
The technical analyses presented in ESDC (2012A) showed an increase of 35% in the number of married/common-law student loan borrowers following the enhancements, but this increase was identical to that for single students. Consequently, it is difficult to conclude that the changes in 2008 led to a relative improvement in loan access for married/common-law student loan borrowers compared to single borrowers. The analyses indicated that the increase in the number of married/common-law student loan borrowers was correlated with an increase in the number of full-time married/common-law PSE students. Also, it is quite likely that the implementation of the CSGP and other factors Footnote 72 were important in explaining the 35% increase.
5.2 Repayment Assistance Plan
This sub-section starts by comparing the cost of the RAP with the cost of the Interest Relief (IR) and Debt Reduction in Repayment (DRR) provisions (which were replaced by the RAP). Then, the early impact of the RAP on three debt repayment indicators (the percentage of a loan repaid, the number of loans being fully re-paid, and the default rate) is examined.
The following evaluation questions are addressed:
- To what extent have loan repayment assistance costs changed as a result of the RAP?
- To what extent has the RAP made it easier for students to manage their loan debt?
- To what extent are students making use of the RAP?
- How does the use of the RAP compare to that of previous measures in place?
- What has the impact of the RAP been on students with disabilities?
- Has there been an impact on the number of loans being re-paid?
- Has there been an impact on student loan default rates?
5.2.1 Repayment Assistance Plan use and costs
Prior to the introduction of the RAP, borrowers who faced repayment difficulties received on average $100 million in loan repayment assistance per year through the IR and DRR provisions (see Table 5 below). After the introduction of the RAP, loan repayment assistance decreased from $97.3 million in 2008-09 to $73.1 million in 2009-10, but had increased to $167.5 million by 2013-14. Even after accounting for inflation, the cost of the RAP in 2013-14 was significantly higher than the costs of IR/DRR in any given year. The annual cost of the RAP should continue to increase based on projections contained in the 2014 CSLP Actuarial Report. Footnote 73
The number of borrowers who benefited from loan repayment assistance increased from 132,574 in 2008-09 to 160,572 in 2009-10, and to 233,864 by 2013-14. The average amount of loan repayment assistance per student loan borrower dropped from $734 in 2008-09 to $455 in 2009-10, and reached $716 in 2013-14.
It should again be reminded that the RAP was introduced shortly after the 2008 financial crisis. The unemployment rate of those aged 15-24 rose from 11.4% in 2007-08, to 13.5% in 2008-09, and to 15.2% in 2009-10, while the average weekly wage rate fell slightly (by 0.7%) between 2008-09 and 2009-10, possibly making student loan repayment more difficult for borrowers just entering the labour force. Footnote 74 On this regard, Oreopoulos et al. (2012) showed that “young graduates entering the labor market in a recession suffer significant initial earnings losses that eventually fade, but after 8 to 10 years”. Footnote 75 This suggests that the large increase in the number of borrowers requesting loan repayment assistance in 2009-10 and in subsequence years might be partially correlated with the 2008-2009 recession.
As indicated in Section 3.1, the RAP was perceived by key informants and some focus group participants as a positive change compared to the IR/DRR provisions. An international comparison revealed that Canada provides greater assistance to borrowers in repayment facing financial hardship than most of the countries examined in the report. Footnote 76
| Loan year | Interest Relief (IR) | Debt Reduction Repayment (DRR) | Repayment Action Plan (RAP) | Total | Total | |||||
|---|---|---|---|---|---|---|---|---|---|---|
| Number of IR recipients | Millions of dollars | Number of DRR | Millions of dollars | Number of RAP recipients | Millions of dollars | Total number of recipients | Millions of dollars | Average per borrower (dollars) | Millions of dollars adjusted for inflation | |
| 2000-01 | 154,895 | 106.8 | 614 | 3.0 | n/a | n/a | 155,509 | 109.8 | 706 | 131.3 |
| 2001-02 | 140,461 | 76.7 | 876 | 5.3 | n/a | n/a | 141,337 | 82.0 | 580 | 95.7 |
| 2002-03 | 128,235 | 77.2 | 1,523 | 8.6 | n/a | n/a | 129,758 | 85.8 | 661 | 97.9 |
| 2003-04 | 117,520 | 71.6 | 1,952 | 9.9 | n/a | n/a | 119,472 | 81.5 | 682 | 90.5 |
| 2004-05 | 108,188 | 64.8 | 5,029 | 36.1 | n/a | n/a | 113,217 | 100.9 | 891 | 110.0 |
| 2005-06 | 102,338 | 60.5 | 4,376 | 26.7 | n/a | n/a | 106,714 | 87.2 | 817 | 93.0 |
| 2006-07 | 105,180 | 84.4 | 3,147 | 21.0 | n/a | n/a | 108,327 | 105.4 | 973 | 110.3 |
| 2007-08 | 116,530 | 95.4 | 2,808 | 23.0 | n/a | n/a | 119,338 | 118.4 | 992 | 121.2 |
| 2008-09 | 129,521 | 76.3 | 3,053 | 21.0 | n/a | n/a | 132,574 | 97.3 | 734 | 97.3 |
| 2009-102 | n/a | n/a | n/a | n/a | 160,572 | 73.1 | 160,572 | 73.1 | 455 | 72.9 |
| 2010-11 | n/a | n/a | n/a | n/a | 164,800 | 96.5 | 164,800 | 96.5 | 585 | 94.5 |
| 2011-12 | n/a | n/a | n/a | n/a | 184,813 | 121.8 | 184,813 | 121.8 | 659 | 115.9 |
| 2012-13 | n/a | n/a | n/a | n/a | 208,779 | 142.7 | 208,779 | 142.7 | 683 | 133.8 |
| 2013-14 | n/a | n/a | n/a | n/a | 233,864 | 167.5 | 233,864 | 167.5 | 716 | 155.6 |
Source: CSLP Annual Reports from 2000-01 to 2013-14 and CSLP Actuarial Reports from 2001 to 2014 by the Office of the Superintendent of Financial Institutions (OSFI).
Note:
1 A loan year is equivalent to an academic year (i.e. from August 1 to July 31).
2 Note that RAP disbursements in 2009-10 included $15.8 million in Interest Relief payments and $2.3 million in DRR payments approved before August 2009.
The vast majority of early RAP participants received RAP-Stage 1, where affordable payments are made by the student towards the loan principal while the government pays a portion (or all) of the interest on the student loan. In 2009-10, 89.6% of all cases involved the government paying the entire portion of interest (87% in 2013-14).
Although the number of borrowers benefitting from RAP-Stage 2 more than doubled between 2009-10 and 2010-11 (see Table 6 below), the average amount students benefitted from decreased significantly (from $1,563 to $963). This was likely due to the inclusion of $2.3 million in DRR payments approved before August 2009 but paid in 2009-10 (mostly in August 2009) as indicated in the 2010 CSLP Actuarial Report. Since 2010-11, the number of RAP-Stage 2 beneficiaries and total costs has increased steadily, with the average payment per beneficiary increasing from $963 in 2010-11 to $1,549 in 2013-14.
In the case of the RAP for those with a permanent disability (RAP-PD), the number of borrowers and the amount of repayment assistance disbursed increased substantially following 2009-10. The focus groups revealed that the RAP-PD had a positive impact on students with disabilities as it helped offset expenses related to their disability, thereby freeing up additional resources for educational expenses.
| Loan year | Repayment Assistance Plan (RAP)-Stage 12 | Repayment Assistance Plan (RAP)-Stage 23 | Repayment Assistance Plan (RAP) Permanent Disability (PD) | ||||||
|---|---|---|---|---|---|---|---|---|---|
| Number of RAP recipients | Millions of dollars | Average in dollars | Number of RAP recipients | Millions of dollars | Average in dollars | Number of RAP recipients | Millions of dollars | Average in dollars | |
| 2009-10 | 156,048 | 67.5 | 433 | 2,418 | 3.8 | 1,563 | 2,106 | 1.9 | 883 |
| 2010-11 | 152,742 | 82.7 | 541 | 4,910 | 4.7 | 963 | 7,148 | 9.1 | 1,267 |
| 2011-12 | 167,058 | 94.1 | 563 | 8,301 | 10.2 | 1,229 | 9,454 | 17.5 | 1,851 |
| 2012-13 | 184,769 | 106.1 | 574 | 12,602 | 17.6 | 1,397 | 11,408 | 19.0 | 1,665 |
| 2013-14 | 203,462 | 119.2 | 586 | 16,787 | 26.0 | 1,549 | 13,615 | 22.3 | 1,638 |
Source: CSLP Annual Reports from 2009-10 to 2013-14 and CSLP Actuarial Reports from 2010, 2011 and 2014.
Note:
1 A loan year is equivalent to an academic year (i.e. from August 1 to July 31).
2 Includes $15.8 million in Interest Relief payments approved before August 2009.
3 Includes $2.3 million in DRR payments approved before August 2009.
5.2.2 Impact of RAP on student loan repayment
Table 7 indicates that average student loan debt at consolidation increased steadily from 2005-06 ($11,323) to 2009-10 ($13,404), decreased for two years, and then increased again in 2012-13 ($13,250) and 2013-14 ($13,536). Footnote 77 A higher percentage of borrowers used loan repayment assistance measures in 2008-09 and 2009-10 compared to 2007-08, regardless of the number of years after consolidation, corroborating the results from Table 5. However, this increase also happens to coincide with the 2008-09 recession, perhaps indicative that some borrowers experienced difficulties securing stable employment after their studies ended and needed help with paying their student loans.
| 2005-06 | 2006-07 | 2007-08 | 2008-09 | 2009-10 | 2010-11 | 2011-12 | 2012-13 | 2013-14 | |
|---|---|---|---|---|---|---|---|---|---|
| Average debt at consolidation (dollars) | 11,323 | 12,232 | 12,881 | 13,222 | 13,404 | 13,013 | 12,972 | 13,250 | 13,536 |
| One year after loan consolidation | |||||||||
| 1- Percent using repayment assistance | 19.0 | 19.7 | 21.7 | 25.2 | 26.3 | 22.0 | 25.6 | 28.5 | 28.9 |
| 2- Percent who paid it off in 1 year | 10.9 | 11.5 | 13.3 | 9.6 | 8.0 | 8.6 | 9.1 | 8.7 | 8.7 |
| 3- Average percent of loan left to repay | 88.6 | 90.3 | 89.2 | 89.0 | 89.4 | 89.8 | 89.7 | 89.7 | 89.6 |
| Two years after loan consolidation | |||||||||
| 1- Percent using repayment assistance | 21.7 | 22.9 | 25.9 | 29.2 | 30.1 | 26.9 | 30.2 | 32.9 | n/a |
| 2- Percent who paid it off in 2 years | 26.5 | 33.2 | 32.6 | 27.4 | 26.9 | 28.1 | 26.7 | 25.1 | n/a |
| 3- Average percent of loan left to repay | 59.9 | 54.6 | 53.9 | 58.7 | 59.7 | 58.2 | 59.7 | 61.5 | n/a |
| a- Used RA at least once* | 78.3 | 80.7 | 81.8 | 83.2 | 82.3 | 84.0 | 84.2 | 85.1 | n/a |
| b- Never used RA* | 54.9 | 46.9 | 44.2 | 48.6 | 50.0 | 48.7 | 49.2 | 50.0 | n/a |
| 4- Percent who default and used RA* once | 5.2 | 5.0 | 4.5 | 4.4 | 4.8 | 4.5 | 4.1 | 3.6 | n/a |
| 5- % who default and never use RA* | 18.7 | 18.2 | 16.7 | 16.2 | 16.9 | 16.7 | 15.3 | 14.2 | n/a |
| Three years after loan consolidation | |||||||||
| 1- Percent using repayment assistance | 23.0 | 24.8 | 27.6 | 30.7 | 31.1 | 28.1 | 32.0 | n/a | n/a |
| 2- Percent who paid it off in 3 years | 42.9 | 42.5 | 41.4 | 36.9 | 37.5 | 38.2 | 35.4 | n/a | n/a |
| 3- Average percent of loan left to repay | 41.8 | 41.9 | 42.1 | 46.2 | 46.0 | 45.2 | 48.2 | n/a | n/a |
| a- Used RA at least once* | 65.2 | 67.1 | 68.9 | 69.4 | 67.4 | 70.4 | 72.1 | n/a | n/a |
| b- Never used RA* | 34.8 | 33.6 | 31.9 | 35.9 | 36.4 | 35.4 | 36.9 | n/a | n/a |
| 4- Percent who default and used RA* once | 11.9 | 11.7 | 10.7 | 11.7 | 12.7 | 11.4 | 10.1 | n/a | n/a |
| 5- Percent who default and never use RA* | 22.2 | 21.7 | 19.9 | 19.4 | 20.8 | 20.3 | 18.4 | n/a | n/a |
| Number of Observations | 126,532 | 126,873 | 130,376 | 126,165 | 131,401 | 147,194 | 158,210 | 171,953 | 178,476 |
Source: CSLP administrative database (tabulation ESDC). * RA stands for Repayment Assistance which includes IR/DRR and RAP.
Note: Borrowers consolidate their student loan(s) six months after completing their post-secondary studies (or ending full-time studies). Repayment begins once they have consolidated their loans.
Table 7 also reveals that there may have been a slight reduction in the percentage of borrowers who have repaid their loan in full since the introduction of the RAP, although it appears that this trend may have started before the RAP was implemented. This could again be a by-product of the recession in 2008-09. Nonetheless, from 2009-10 onwards, around 9% of borrowers paid off their loan one year after consolidation, 27% two years after consolidation, and over 35% three years after consolidation.
Finally, the percentage of student loan debt remaining to be paid was relatively stable during the period, particularly since 2008-09, at roughly 89% after one year, 59% after two years, and 46% after three years. This reduction in the percentage of student loan debt remaining to be paid confirms that borrowers continued to repay a portion of their debt every year. A technical report Footnote 78 revealed that there has been a significant increase in the percentage of debt remaining to be paid by RAP users and non-RAP users compared to under the IR/DRR provisions. The technical report also confirmed a decrease in the likelihood of having entirely repaid a student loan by these two groups over the period. This may be due to changes in RAP eligibility criteria (more recipients) combined with the effect of being able to make affordable payments under the RAP. It is possible that some borrowers were “forced” to make full payment on their loan (to avoid default) during the years of IR due to their ineligibility for IR, while similar borrowers became eligible for the RAP and were able to avoid this situation. Nevertheless, a longer period of data would be needed to clarify the impact since the results are based on only a few years of data.
Borrowers who face financial hardship can decide to apply for the RAP instead of going into default. Footnote 79 Table 7 shows that borrowers who have ever received repayment assistance had a significantly lower default rate than those who have never received repayment assistance. For instance, the former group had a default rate of around 4.5% two years after consolidation compared to about 16% for the latter group. Table 7 also reveals that, although default rates increased between 2008-09 and 2009-10 for both groups, default rates went down steadily after 2009-10. As mentioned previously, it is still too early to measure the full impact of the RAP.
5.3 Summary of key findings
- The number of part-time student loan borrowers in 2013-14 increased almost ten-fold from 2008-09, suggesting a significant impact of the Budget 2008 enhancement for part-time students on loan access
- There was little evidence to suggest an improvement in loan access for married students or students in common-law relationships following the Budget 2008 enhancement for this group
- Loan repayment assistance costs increased following the introduction of the RAP, but the average cost per borrower in 2013-14 was below that of 2008-09
- There was a steady increase in the share of student loan borrowers using repayment assistance, although this trend began well before the implementation of the RAP
- It may be too early to conclusively determine the full impact of the RAP on the number of loans being paid off and on student loan default rates. Estimation is further complicated by the impacts of the 2008 financial crisis
6. Program delivery and awareness
An interim evaluation report on the implementation status of the various Budget 2008 measures was published in June 2014 using evidence gathered from two reports based on key informant interviews. Footnote 80 Findings indicated that a new internal delivery system of federal grants was implemented, as was a more nuanced system for loan repayment assistance (including changes related to the service delivery vision and loan access for married and part-time students). Nevertheless, the changes involving cooperation with other organizations and other levels of government experienced some difficulties, but only a minimal number of students were ultimately impacted. The report concluded that efforts should continue in making the RAP application (for the new repayment assistance measures), application process and canlearn.ca website more user-friendly, as numerous issues were raised by the key informants.
Focus group participants indicated that the canlearn.ca website has had minimal impact on awareness of the RAP, especially since there was confusion among participants between the canlearn.ca website and the NSLSC website. However, among the small minority who used the site, there was strong appreciation of the tools offered to them and they demonstrated far deeper understanding of the RAP than those who had not visited the website.
In terms of CSGP awareness, findings from the CSGP survey conducted for the evaluation indicated that a minority of CSG recipients (39%) were aware that they would qualify for a grant at the time of applying for a student loan, and even less (30%) knew of the variety of grants available when they first applied. Of note, those who had RESP savings were more likely to be aware of the CSGP, perhaps indicating that they may be more financially literate than those without RESP savings. Among the 39% who were aware that they would qualify for a grant, 72% found the eligibility criteria were clear at the time they applied for a loan.
Among those who were aware that they would qualify for a grant and could recall the grant amount, half of CSG recipients indicated that the amount was about what they expected, while roughly 25% felt that the amount received was higher than expected and 25% lower than expected.
Further survey findings showed that among CSG recipients who were aware that they would qualify for a grant, most recalled that it took 2-4 weeks from when they applied for a student loan until they found out if they were eligible for a grant, corroborating results from the key informant interviews.
7. Conclusions, recommendations and future work
Overall, the CSLP enhancements and the CSGP, both introduced in Budget 2008, are perceived to have been positive changes. The government continues to make student loans and grants a high priority.
After the introduction of the CSGP, the total amount and number of grants disbursed increased significantly, while administrative costs (in terms of the percentage of total grant and bursary payments made) remained stable. Overall, the introduction of the CSGP coincided with a slight increase in total loan disbursements. Nonetheless, average loan disbursements fell by between 11.5% and 17.0% and student loan indebtedness levels at consolidation by between 4.9% and 7.0% after the implementation of the CSGP. However, evidence suggests that there was no CSGP impact on PSE participation or PSE persistence, likely due to there being little change in overall student financial aid available (a result corroborated by many findings in the literature).
The CSLP enhancements for part-time students announced in Budget 2008 improved loan access for them, but the changes introduced for married and common-law students did not have any impact.
In general, the RAP (the new repayment assistance measures) was perceived by key informants and some focus group participants as a positive change compared to the provisions under the previous regime. The number of borrowers benefitting from repayment assistance measures and the associated costs increased significantly. Nevertheless, the full impact of the RAP had not yet been fully realized by 2013-14 (the last year for which data was available). Although the canlearn.ca website has had minimal impact on awareness of the RAP, those who used the site demonstrated a far deeper understanding of the RAP than those who had not visited the website.
7.1 Recommendations
Consider revising the formula used to calculate student loan repayment (e.g. basing repayment on net income instead of gross income) so that it is equitable for students in different circumstances. However, further analysis of the RAP may be required before implementing any major changes, given that the RAP has not yet fully matured.
- Continue to use the CSGP to target disadvantaged students and consider increasing the CSG amount and expanding CSG eligibility for lower income students to help reduce debt and provide extra liquidity to improve their PSE access and persistence
- Further improve student loan access for married and common-law students, as the Budget 2008 changes were noted to have been insufficient and were shown to have not had any impact on loan access
- Promote awareness of the information on the canlearn.ca website, as those who used the site found it to be of great benefit. In doing so, further awareness and understanding of the CSGP would also be enhanced for prospective PSE students
7.2 Future work
Future evaluation work could include an examination of provincial and territorial loan programs and whether or not PSE access is equal across Canada.
As well, future work should include, contingent upon obtaining the necessary approvals, the merging and analyses of income tax data and CSLP administrative data, to better understand the differences in student loan repayment pre- and post-2009.
Appendix 1 – Evaluation questions
| Evaluation issue/question | Section of this report | Source documents |
|---|---|---|
| Relevance – Continued need for the program | ||
| 1. To what extent are the CSLP enhancements responsive to the needs of students? | 3.1 | FG |
| 2. Is there a need to offer student grants alongside student loans? | 3.2 | FLR, KI1, Survey |
| 3. Are grants a better way of dealing with access and persistence issues than loans for certain types of students? | 3.2 | FLR, KI1 |
| 4. Is there an optimal mix of grants and loans to deal with access and persistence issues? | 3.2 | FLR, KI1 |
| Relevance – Alignment with government priorities | ||
| 5. Do the objectives of the different measures align with federal government priorities? | 3.3 | FLR |
| 6. Do the objectives of the different measures align with HRSDC strategic objectives? | 3.3 | FLR |
| Relevance – Alignment with federal roles and responsibilities | ||
| 7. What is the role and responsibility for the federal government in delivering the CSLP/CSGP? | 3.4 | FLR |
| Performance – Achievement of expected outcomes | ||
| 8. To what extent has the RAP made it easier for students to manage their loan debt? | 5.2 | ADD1, FG, KI2 |
| a. To what extent are students making use of the RAP? | 5.2.1 | ADD1 |
| b. How does the use of the RAP compare to that of previous measures in place? | 5.2.1 | FG, FLR |
| c. Has there been an impact on student loan default rates? | 5.2.2 | ADD1 |
| d. Has there been an impact on the number of loans being re-paid? | 5.2.2 | ADD1 |
| e. Has the existence of the RAP had an impact on the number of students enrolled in PSE? | 5.2.2 | FG |
| f. What has the impact of the RAP been on students with disabilities? | 5.2.1 | FG |
| 9. To what extent have the CSLP enhancements streamlined and modernized the CSLP? | Interim Report | KI1, KI2 |
| a. To what extent have online services been improved? | Interim Report | KI1, KI2 |
| b. To what extent have the application and repayment processes been simplified? | Interim Report | KI1, KI2 |
| c. To what extent have communications with students improved? | Interim Report | KI1, KI2 |
| 10. To what extent have the CSLP enhancements allowed for the flexibility to correct for administrative errors, accept documents beyond prescribed deadlines and allowed repayment to be deferred for eligible students? | Interim Report | KI1, KI2 |
| 11. To what extent has there been an improvement in loan access for married students or students in common-law relationships? | 5.1 | ADD2, KI2 |
| 12. To what extent has there been an improvement in loan access for part-time students? | 5.1 | ADD2, KI2 |
| 13. To what extent has the canlearn.ca website increased the awareness of the RAP? | 6 | FG |
| 14. Has the CSGP led to an increase in PSE access rates for the targeted groups? | 4.3.1 | LAD |
| a. How do PSE access rates vary by different socio-economic characteristics? | 4.3.1 | LAD |
| 15. Has the CSGP led to an increase in PSE completion rates for the targeted groups? | 4.3.2 | LAD |
| a. How do PSE completion rates vary by different socio-economic characteristics? | 4.3.2 | LAD |
| 16. To what extent has the CSGP impacted students’ overall student debt levels? | 4.2 | ADD3, ADD4, Survey |
| Performance: Demonstration of efficiency and economy | ||
| 17. To what extent have loan repayment assistance costs changed as a result of the RAP? | 5.2.1 | ADD1 |
| 18. Where and how are incremental funds for service delivery changing previous expenditure patterns? | N/A | No findings |
| 19. What are the annual program costs of the CSGP? | 4.1.1 | ADD4 |
| a. What is the breakdown between the different grants? | 4.1.1 | ADD4, FLR |
| b. How does this compare to the annual program costs under the CAG, CSG and CMSF? | 4.3.1 | ADD4, FLR |
| 20. How much additional grant funding is needed in order to increase PSE participation/completion rates by 1%? | 4.3.1 4.3.2 |
ADD3, FLR |
| a. How does this compare to student loans? | 4.3.1 | ADD3, FLR |
| 21. What are the administrative costs for the CSGP? | 4.1.2 | ADD4, FLR |
| a. How do they compare to the administrative costs under the CAG, CSG and CMSF? | 4.1.2 | ADD4, FLR |
| 22. What has been the impact of the CSGP on student needs for the CSLP? | 4.2 | ADD3, Survey |
| 23. How many different students received a transition grant? | 4.1.1 | ADD4 |
| a. What was the overall dollar value of all transition grants disbursed? | 4.1.1 | ADD4 |
| Program delivery | ||
| 24. To what extent have there been implementation issues in delivering any of the measures? | Interim Report | KI1, KI2 |
| a. What has caused any implementation issues? | Interim Report | KI1, KI2 |
| b. To what extent have corrective actions been taken and how successful have they been? | Interim Report | KI1, KI2 |
| 25. How quickly are students informed about their grant eligibility? | 6 | Survey |
| a. Is the eligibility criteria clearly understood by students? | 6 | Survey |
| b. For those students deemed eligible for a grant, to what extent have grant amounts matched students’ expectations? | 6 | Survey |
| 26. To what extent has the transition from the CMSF to the CSGP been a smooth one in terms of students who were transferred from one regime to another? | Interim Report | KI1, KI2 |
| a. What problems, if any, have been encountered? | Interim Report | KI1, KI2 |
| 27. To what extent are eligible students aware of the different measures? | 6 | FG, KI2 |
| a. What steps are being taken to ensure that prospective, eligible students are aware of the different measures? | Interim Report | KI1, KI2 |
Source Documents (Technical Reports):
ADD1=Administrative Data Analysis (RAP)
ADD2=Administrative Data Analysis (Loan Access)
ADD3=Administrative Data Analysis (Interaction between CSGP/CSLP)
ADD4=Administrative Data Analysis (CSGP)
FG=Focus Groups (conducted in November 2012)
FLR=File/Literature Review
KI1=Key Informant Interviews (conducted in January/February 2011)
KI2=Key Informant Interviews (conducted in October/November 2012)
LAD=Longitudinal Administrative Databank Analysis (Frenette 2015)
Survey=CSGP Survey (conducted in September/October 2013)
Appendix 2 – Summary of studies conducted in support of the summative evaluation
Centre for Public Management Inc. (2011), “Key Informant Interviews for the Evaluation of the Canada Student Grants Program and for the Evaluation of Increased CSLP Activities Related to Budget 2008”, Prepared for ESDC
This technical report summarizes the findings and key messages from interviews conducted in January and February 2011 regarding the CSGP and the increased CSLP activities related to the 2008 Federal Budget. Forty-five (45) interviews were conducted to solicit feedback on the programs’ relevance, efficiency, and general effectiveness with federal and provincial CSGP and CSLP representatives, and leading academics in the field of post-secondary education.
ESDC (2012), “Literature/File for the Summative Evaluation of the Budget 2008 CSLP Enhancements”
The purpose of the literature and file review was to provide an overview of the information already available in the public domain and internal ESDC documents, completed surveys and research papers, and then compile the information (from over 40 documents) in order to provide evidence for a series of evaluation questions. This review demonstrated that much information was already available in the literature.
Cathexis Consulting (2013), “Mid-Stage Key Informant Interviews for the Summative Evaluation of the Budget 2008 Canada Student Loans Program Enhancements”, Prepared for ESDC
The purpose of this project was to conduct mid-evaluation key informant interviews with 32 federal and provincial officials involved in the delivery of the CSLP/CSGP in an effort to gain an understanding of the extent to which the different measures announced in Budget 2008 have been implemented, reasons for delays in implementation, actions that have been taken, and any potential impacts on the timing of the availability of relevant administrative data. The results from the interviews (conducted from September 2012 to November 2012) serve as a follow-up to the interviews conducted in January and February 2011.
R. A. Malatest and Associates Ltd. (2013), “Focus Groups for the Summative Evaluation of the Budget 2008 Canada Student Loans Program Enhancements”, Prepared for ESDC
This technical report summarizes findings from eight focus group sessions (two focus group sessions were conducted in Calgary, Winnipeg, Ottawa and Halifax in the fall of 2012). The focus groups involved a qualitative exploration of the impact of the CSLP enhancements based on borrower experiences. It reviewed how the enhancements addressed students’ needs and how the RAP assisted them in managing their student loan. Additionally, the research explored the perceived differences between the RAP and Interest Relief/Debt Reduction in Repayment, the two financial assistance programs that pre-dated the RAP. The exploration of this topic was only possible with students who had taken out loans and applied for assistance prior to the 2009 introduction of the RAP. A final topic explored in the research was the degree to which students’ awareness of the RAP could be attributed to the canlearn.ca website.
Ekos Research Associates Inc. (2014), “Survey of Canada Student Grants Program (CSGP) Recipients”, Prepared for ESDC
This study involved a hybrid telephone/online survey of 2,654 students who received a Canada Student Grant between August 2012 and July 2013. The purpose of this survey was to assess the impact of Canada Student Grants on overall student debt levels, student loan use, access to PSE, and to assess any program delivery issues.
ESDC (2014), “Additional Statistical Analysis of the Survey of Canada Student Grants Program (CSGP) Recipients – Supplementary Technical Report”
The purpose of this technical report was to provide a more in-depth analysis of the CSGP survey report, based on comments received by an external peer reviewer. This additional report provided detailed multivariate analyses to supplement the results presented in the main survey report.
ESDC (2015a), “Impacts of the Canada Student Grants Program (CSGP) on Program Costs”
This report used a series of administrative data files and information contained in publicly-available documents and covered the period starting with the introduction of the direct loan regime in 2000-01 and ending in 2013-14. The report examined and compared annual grant costs (including administrative costs) after the implementation of the CSGP and prior to 2009 (under the previous regime) – during the period of the Canada Access Grant (CAG), Canada Study Grant (CSG) and Canada Millennium Scholarship Foundation (CMSF). It also examined the transition grants, as they were part of the mandate of the summative evaluation, as well as socio-demographic factors correlated with receiving the different types of CSGP grants.
ESDC (2015b), “Interaction between the Canada Student Grants Program (CSGP) and the Canada Student Loans Program (CSLP)”
This report used a series of administrative data files, the Labour Force Survey (LFS) of Statistics Canada, and other information contained in publicly-available documents to measure the impact of the CSGP on the need for student loans. The report also examined the impact of the CSGP on student indebtedness levels at loan consolidation time and attempted to determine how much spending is required to increase overall post-secondary education (PSE) participation levels by 1% (as well as graduation rates) and whether it is more expensive to achieve this through grants or loans. The period covered by the analysis started with the introduction of the direct loan regime in 2000-01 and ended in 2013-14.
ESDC (2015c), “Impacts of the 2008 CSLP Enhancements on Loan Access for Part-Time and Married/Common-Law Students”
This report examined the extent to which there was an improvement in loan access for part-time and married/common-law students following the enhancements to the Canada Student Loans Program (CSLP) in 2008. Using administrative data and the Labour Force Survey (LFS) of Statistics Canada, the report provided detailed information on the loans received by married/common-law student borrowers and part-time borrowers. Socio-demographic characteristics of the two groups were presented in the report and compared with their respective populations of post-secondary education (PSE) students. As well, models were developed in an attempt to capture the effects of the CSLP enhancements on loan access for these groups. Another series of models attempted to measure the impact of the 2008 enhancements on the average loan amounts received.
ESDC (2015d), “Impacts of the Repayment Assistance Plan (RAP)”
This report used a series of administrative data files and information contained in the CSLP Annual Reports to analyze the RAP by targeted group. The period covered started with the introduction of the direct loan regime in 2000-01 and ended in 2011-12. The report first examined the cost of the RAP compared to the cost of the previous measures (Interest Relief and Debt Reduction in Repayment). Then, the report provided the socio-economic profile of students who benefitted from the RAP compared to the profile of those who benefited from Interest Relief and Debt Reduction in Repayment. Further, analysis attempted to measure the impact of the RAP on three repayment indicators: the percentage of outstanding loans remaining to be repaid, the percentage of loans fully repaid, and the percentage of loans in default. Finally, the report examined similar repayment programs existing in other countries.
Frenette (2015), “Post-Secondary Attendance and the Canada Student Grants Program”, Prepared for ESDC by Statistics Canada
This study used a regression discontinuity approach applied to longitudinal administrative data to estimate the relationship between CSG eligibility and post-secondary access at age 18 and persistence. As well, this study included a literature review on student financial assistance and its impact on PS attendance, and an overview of the key features of the CSGP and how its objective of raising access to post-secondary can be met from a conceptual point of view.
Appendix 3 – References
Berger, J., Motte A. and Parkin A. (2009), “The Price of Knowledge: Access and Student Finance in Canada”, Fourth Edition, Canada Millennium Scholarship Foundation.
Canada Millennium Scholarship Foundation, “Millennium Scholarship Annual Reports” 1999 to 2009.
Castleman and Long (2013), “Looking Beyond Enrolment: The Causal Effect of Need-Based Grants on College Access, Persistence, and Graduation”, National Bureau of Economic Research Paper, No. 19306.
Dynarski, S.M. (2000), “Hope for Whom? Financial Aid for the Middle Class and Its Impact on College Attendance” National Tax Journal. 53, 3 (Part 2): 629-661.
Dynarski, S.M. (2003), “Does Aid Matter? Measuring the Effect of Student Aid on College Attendance and Completion” American Economic Review”, 93, 1: 279-288.
Dynarski (2008), “Building the Stock of College-Educated Labor”, Journal of Human Resources, 43, 3.
ESDC (2014), “Canada Student Loans Program (CSLP): Budget 2008 Implementation Review Evaluation”.
ESDC (2000 to 2014), “CSLP Annual Reports”.
ESDC (2015), “2015-16 Report on Plans and Priorities”.
Finance Canada (2008), “Budget 2008: Responsible Leadership for Uncertain Times”.
Finance Canada (2011), “The Next Phase of Canada’s Economic Action Plan: A Low-Tax Plan for Jobs and Growth”
Finance Canada (2014), “The Road to Balance: creating Jobs and Opportunities”.
Finance Canada (2015), “Strong Leadership – a Balanced Budget, Low-Tax Plan for Jobs, Growth and Security”.
Finnie, R., Usher, A. & Vossensteyn, H. (2004), “Meeting the Need: A New Architecture for Canada’s Student Aid System”, Institute for Research on Public Policy.
Finnie, R. (2005), “A Simple Model of Access and Capacity for Post-Secondary Schooling in Canada”, Queen’s University School of Policy Studies Working Paper Number 40.
Frenette (2011), “Is Debt Relief as Good as Liquidity? The Impact of Prospective Student Debt on Post-Secondary Attendance among Low-income Youth”, Social Research and Demonstration Corporation.
Frenette (2012), “Assessing the Impacts of the New Canada Student Grants Program: Final Report”, done for HRSDC.
HRSDC (2008), “Post-Secondary Access and Student Financial Aid: A Historical Overview and Literature Review”, technical report.
HRSDC (2010), “A Discussion of the Rationale of the Canadian Student Loans Program”, Internal Draft.
HRSDC, 2011, “Summative Evaluation of the Canada Student Loans Program”.
HRSDC, 2012a “Evaluation Framework for the Summative Evaluation of the Budget 2008 CSLP Enhancements and Other CSLP Evaluative Work”.
HRSDC, 2012b, “Evaluation Methodology for the Summative Evaluation of the Budget 2008 CSLP Enhancements”.
Junor, S. and Usher, A. (2004), “The Price of Knowledge 2004: Access and Student Finance in Canada”, Canada Millennium Scholarship Foundation.
Lavallée, L. and Backus J. (2007), “Impact of Canada Millennium Scholarship Foundation Bursaries on Postsecondary Education”.
McElroy (2005), “Student Aid and University Persistence: Does Debt Matter?”
Neil, C. (2007), “Can We Say Whether the Canada Millennium Scholarship Bursaries have Affected Post-Secondary Enrolments?”, Ontario, Wilfrid Laurier University.
Office of the Superintendent of Financial Institutions Canada (2011), “Actuarial Report on the Canada Student Loans Program as at 31 July 2011”.
Singell Jr., L. D. (2001), “Come and Stay a While: Does Financial Aid Affect Enrolment and Retention at a Large Public University?”, Department of Economics, University of Oregon.
Treasury Board Secretariat,” Estimates, Parts I and II, The Government Expense Plan And The Main Estimates”, 2004-05 to 2014-15.
Appendix 4 – Detailed program disbursement
| Loan year | Canada study grant for students with dependents and CSG-FTDEP CSG-PTDEP1 | Canada study grant for the accommodation of students with permanent disabilities and CSG-PDSE2 | Canada study grant for high-need part-time students and CSG-PT3 | Canada study grant for high-need students with permanent disabilities | Canada study grant for females pursuing doctoral studies | CAG - permanent disability and CSG-PD4 | CAG - Low-income and CSG-LI | CSG-MI | CMSF awards and bursaries and CSG transition grants5 | |||||||||
|---|---|---|---|---|---|---|---|---|---|---|---|---|---|---|---|---|---|---|
| Number | Millions of dollars | Number of recipients | Millions of dollars | Number of recipients | Millions of dollars | Number of recipients | Millions of dollars | Number of recipients | Millions of dollars | Number of recipients | Millions of dollars | Number of recipients | Millions of dollars | Number of recipients | Millions of dollars | Number of recipients | Millions of dollars | |
| 2000-01 | 45,563 | 64.8 | 4,636 | 11.2 | 5,441 | 4.6 | n/a | n/a | 190 | 0.5 | n/a | n/a | n/a | n/a | n/a | n/a | 88,979 | 293.9 |
| 2001-02 | 38,445 | 50.4 | 5,276 | 12.2 | 4,786 | 4.1 | n/a | n/a | 223 | 0.6 | n/a | n/a | n/a | n/a | n/a | n/a | 89,741 | 293.0 |
| 2002-03 | 43,551 | 55.4 | 6,038 | 13.4 | 4,451 | 3.8 | 1,364 | 2.2 | 221 | 0.6 | n/a | n/a | n/a | n/a | n/a | n/a | 96,674 | 292.2 |
| 2003-04 | 39,775 | 52.3 | 6,784 | 16.7 | 4,215 | 3.7 | 2,297 | 3.6 | 201 | 0.5 | n/a | n/a | n/a | n/a | n/a | n/a | 97,739 | 301.6 |
| 2004-05 | 38,807 | 57.6 | 7,470 | 17.4 | 3,977 | 3.6 | 2,914 | 4.6 | 236 | 0.7 | n/a | n/a | n/a | n/a | n/a | n/a | 98,081 | 287.3 |
| 2005-06 | 37,890 | 56.3 | 8,488 | 19.4 | 2,847 | 3.0 | n/a | n/a | 275 | 0.8 | 9,794 | 18.8 | 22,088 | 40.0 | n/a | n/a | 122,353 | 338.4 |
| 2006-07 | 32,758 | 49.1 | 11,956 | 20.3 | 2,848 | 2.7 | n/a | n/a | 291 | 0.8 | 12,602 | 23.4 | 26,913 | 45.5 | n/a | n/a | 132,731 | 354.3 |
| 2007-08 | 30,169 | 46.0 | 7,320 | 20.2 | 2,570 | 2.6 | n/a | n/a | 343 | 1.0 | 14,376 | 26.7 | 25,903 | 45.3 | n/a | n/a | 121,362 | 338.3 |
| 2008-09 | 31,293 | 47.8 | 8,166 | 21.5 | 2,721 | 2.8 | n/a | n/a | 309 | 0.9 | 16,247 | 29.9 | 25,510 | 44.7 | n/a | n/a | 128,931 | 364.7 |
| 2009-10 | 28,326 | 66.4 | 8,099 | 22.1 | 4,147 | 4.4 | n/a | n/a | n/a | n/a | 18,185 | 33.8 | 190,083 | 353.4 | 83,341 | 60.9 | 35,089 | 52.1 |
| 2010-11 | 33,895 | 80.1 | 8,876 | 23.7 | 6,186 | 6.7 | n/a | n/a | n/a | n/a | 20,613 | 38.6 | 206,001 | 386.9 | 87,604 | 64.7 | 15,884 | 24.0 |
| 2011-12 | 36,913 | 87.5 | 7,753 | 20.5 | 8,802 | 9.7 | n/a | n/a | n/a | n/a | 22,881 | 42.7 | 218,837 | 410.4 | 89,076 | 65.7 | 4,365 | 6.2 |
| 2012-13 | 38,078 | 92.6 | 8,290 | 21.6 | 13,180 | 14.5 | n/a | n/a | n/a | n/a | 26,547 | 50.4 | 232,209 | 444.0 | 93,262 | 70.5 | n/a | n/a |
| 2013-14 | 33,055 | 94.1 | 8,622 | 21.9 | 14,937 | 16.6 | n/a | n/a | n/a | n/a | 29,222 | 55.3 | 238,513 | 455.0 | 95,493 | 72.3 | n/a | n/a |
Source: CSLP Annual Reports from 2000-01 to 2013-14.
Note: The 2000-01 to 2008-09 represents the CSG period, while the period beginning with 2009-10 represents the CSGP period.
1 Although the parameters of the grants for students with dependents have changed with the CSGP, the grants still target the same two groups (full-time and part-time students with dependents).
2 Under the CSGP, this grant is called the “Canada Student Grant for services and equipment for persons with permanent disabilities”.
3 Under the CSGP, this grant is called the “Canada Student Grant for part-time studies”. This table includes part- and full-time grants.
4 Under the CSGP, this grant is called the “Canada Student Grant for persons with permanent disabilities”.
5 Excluding CMSF Excellence Awards disbursed by CSLP in 2009-10 ($0.2 million), 2010-11 ($6.5 million), 2011-12 ($4.0 million), 2012-13 ($1.4 million), and 2013-14 ($0.1 million). Shaded cells represent the period covered by the CSGP.