
Evaluation of the Employment Insurance Fishing Benefits, 2026
On this page
- Executive summary
- Management response and action plan
- 1. Introduction
- 2. Evaluation approach
- 3. Eligibility and accessibility
- 4. Participation and usage
- 5. Delivery of benefits
- 6. Conclusion
- Appendix A – Evaluation matrix
- Appendix B – Lines of evidence
- Appendix C – Supplementary tables
- Appendix D – COVID-19 temporary measures
Alternate formats

Request other formats online or call 1 800 O-Canada (1-800-622-6232). If you use a teletypewriter (TTY), call 1-800-926-9105. Large print, braille, audio cassette, audio CD, e-text diskette, e-text CD and DAISY are available on demand.
List of tables
- Table 1: Qualifying and benefit periods
- Table 2: Minimum threshold of insurable earnings and divisors used to calculate fishing benefits
- Table 3: Summary statistics of EI regular and EI fishing claimants by occupation and non-fishing industry, 2018
- Table 4: EI fishing claims and reduced EI weekly benefits, fishing year 2018
- Table 5: Socio-economic profile of summer-only EI fishing benefits claimants
- Table 6: Claim profile of summer-only EI fishing benefits claimants
- Table 7: Socio-economic profile of winter-only EI fishing benefits claimants
- Table 8: Claim profile of winter-only EI fishing benefits claimants
- Table 9: Socio-economic profile of both season EI fishing benefits claimants
- Table 10: Claim profile of both season EI fishing benefits claimants
- Table 11: Temporary measures – 2020 to 2022
List of figures
- Figure 1: Number of self-employed fishers, 2000 to 2021
- Figure 2: Qualifying and benefit periods of a fishing season
- Figure 3: Eligibility rates of self-employed fishers to EI fishing and regular benefits, 2001 to 2021
- Figure 4: Usage rate for self-employed fishers who were covered, 2001 to 2021
- Figure 5: Number of EI fishing claims and benefits paid, 2001 to 2022
- Figure 6: Number of EI fishing claims established by fishing year, 2001 to 2021
- Figure 7: Number of self-employed fishers who fished or claimed EI fishing benefits by week for single-season fishers (pure claim), 2018
- Figure 8: Number of self-employed fishers who fished or who claimed EI fishing benefits by week for both-season fishers (both pure claim), 2018
- Figure 9: Share of fishing claims by province, 2000 to 2022
- Figure 10: Share of EI fishing benefit claims that reached the maximum weekly benefit rate by fishing year, 2000 to 2021
- Figure 11: Average gross fishing, net fishing, EI benefits, and total income per year for one-season EI fishing benefits claimants, 2001 to 2021
- Figure 12: Average gross fishing, net fishing, EI benefits, and total income per year for 2-season EI fishing benefits claimants, 2001 to 2021
- Figure 13: Share of fishing-to-regular claims of total fishing claims in commodity regions, 2010 to 2019
- Figure 14: Percentage of self-employed fishers with an ROE, 2001 to 2021
List of abbreviations
- BPC
- Benefit Period Commencement
- CRA
- Canada Revenue Agency
- CTD
- Content Training and Development
- DFO
- Fisheries and Oceans Canada
- DG
- Director General
- EI
- Employment Insurance
- ESDC
- Employment and Social Development Canada
- IENB
- Integrated Expertise Network Branch
- IWWMB
- Integrated Workload and Workforce Management Branch
- KII
- Key Informant Interview
- MAR
- Monitoring and Assessment Report
- PRA
- Prairie Research Associates
- PSM
- Propensity Score Matching
- P&F
- Planning and Forecasting
- ROE
- Record of Employment
- SEB
- Skills and Employment Branch
- SIN
- Social Insurance Number
- TD
- Training Delivery
Executive summary
Overview
EI provides fishing benefits to qualifying, self-employed fishers who are actively seeking work. Unlike EI regular benefits, eligibility for EI fishing benefits is based on insurable earnings from fishing, not hours of insurable employment.
Evaluation scope and objectives
The evaluation scope covers the period from January 2000 to December 2022. The evaluation focuses on a full assessment of the fishing benefits between 2000 and 2019 and presents early impacts of the temporary COVID-19 measures. This evaluation was carried out in alignment with departmental priorities. EI fishing benefits were last assessed as part of the last comprehensive summative evaluation of EI benefits which was completed in 2006.
Key findings
Usage
- The number of self-employed fishers in Canada steadily declined from 38,000 in 2001 to 25,000 in 2021
- The number of fishers who received EI fishing benefits peaked in 2004 at 27,513 and has since declined to 20,457 in 2021
- Over the evaluation period, the total number of EI fishing claims established per year peaked at 37,494 in 2004 and steadily declined to 29,958 in 2021
Eligibility and accessibility
- From January 2000 to December 2022, about 80% of self-employed fishers who had a Record of Employment (ROE) and paid EI premiums were eligible for EI fishing benefits
- Some focus group and key informant respondents report that the regional unemployment rate used for the purpose of determining income thresholds to qualify did not reflect the conditions of the fishing season and made qualifying difficult and uncertain
Participation
- On average, EI fishing claimants in 2021 were likely to be 50 years old, married, males without dependents, living in a rural area, and to have a high-school diploma as their highest level of education. Fishing benefits claims were concentrated among the Atlantic provinces, Quebec, and British Columbia
- All 6 focus groups with 22 participating employers indicated that EI fishing benefits were essential for keeping people employed in the fishing industry and that without these benefits, they did not believe that many would continue to work in the industry because of the nature of the work
- In 2018, approximately 44.8% of fishers claimed both summer and winter benefits during the same year and did not receive EI benefits for 8 weeks on average within the April to July period
Weekly benefit rate and entitlement
- During the study period, the share of EI fishing claimants receiving the maximum weekly benefit rate ranged between 60% in 2009, an average of 73% between 2017 and 2019, and 75% in 2021. These levels are higher than those observed for EI regular benefits claimants, for whom the same share ranged from about 47% to nearly 50% between 2017 and 2019
- There was agreement across all focus groups with recipients (self-employed fishers and employed fishing industry regular benefit claimants) that the benefit rate of 55% of weekly insurable earnings was insufficient
Delivery of benefits
- Most focus groups of self-employed fishers pointed to the delivery of benefits as an area of satisfaction. In terms of creating and filing ROEs, few employers reported having issues or suggestions and felt that the process worked very well
- A few groups of EI fishing claimants identified challenges where they failed to obtain accurate information or the required assistance from Service Canada during the application process, which was a finding corroborated by some employer focus groups as well
Observations
- Temporary COVID-19 measures did not appear to have any influence on off-season employment, as focus group participants did not indicate that they were significantly impacted during COVID in their ability to fish or the value of their catch
- Both comparator groups of EI regular claimants in fishing-related occupations and seasonal industries had higher weeks of entitlement than single season fishing claimants (a maximum of 26 weeks) but less than both seasons fishing claimants (maximum of 26 weeks, twice a year), and also had lower total annual income than EI fishing claimants
- In most focus groups with employers, they had concerns with their obligations as the designated employer and were of the view that they should not be characterised as such. They did not consider themselves as the employer because they did not have authority in hiring the crew members on each vessel, and establishing sharing agreements, or other aspects of their employment
- Some Interviewed (7 of 17) internal Service Canada officers and representatives from external fisher associations noted that climate change has impacted the fishing seasons, fishing seasons were becoming less defined as summer and winter seasons and resulting in premature ending of seasons, and their fishing activities are becoming harder to contain within specific qualifying periods
Recommendations
- It is recommended to review the qualifying conditions for fishing benefits, including the process for issuing ROE, with consideration given to fishing industry conditions.
- It is recommended that Service Canada improve officer training on EI fishing benefit regulations and improve expertise to provide efficient and accurate service to self-employed fishers during the application process.
Management response and action plan
Overall management response
The SEB and Service Canada would like to thank the evaluation directorate for their work on the evaluation of EI fishing benefits. We are also appreciative of the time given by all those who participated, including the key informants and focus group participants.
Overall, the findings of the EI fishing benefits evaluation are positive and demonstrate that there is a continued need for the benefit. The evaluation found that EI fishing benefits were effective in meeting the needs of self-employed fishers. EI fishing benefits also had high usage rates by self-employed fishers, and they reported satisfaction with their benefits.
The evaluation identified 2 recommendations to 1) review the qualifying conditions for the benefit and 2) increase Service Canada officer training. SEB and Service Canada accept these recommendations.
Recommendation #1
It is recommended to review the qualifying conditions for fishing benefits, including the process for issuing Records of Employment, with consideration given to fishing industry conditions.
Management response
Management agrees with this recommendation.
EI provides fishing benefits to qualifying, self-employed fishers who are actively seeking work. Unlike EI regular benefits, eligibility for EI fishing benefits is not based on hours of insurable employment. Rather, it is based on insurable earnings from self-employment in fishing in the qualifying period.
Self-employed fishers are eligible for EI fishing benefits if they do not qualify for EI regular benefits and have earned a minimum amount of insurable earnings from self-employment in fishing during their qualifying period. This amount varies between $2,500 and $4,200, depending on the unemployment rate in the claimant's EI region.
EI fishing benefits are available for 2 fishing seasons per year: the winter fishing season and the summer fishing season. Self-employed fishers who have established a claim for EI fishing benefits are entitled to a maximum of 26 weeks of EI fishing benefits per claim.
No changes have been made to these rules since 1996.
The evaluation recognizes that the fishing industry has evolved, creating both opportunities and challenges. In response to these findings, SEB will undertake a review of the qualifying conditions for fishing benefits which includes, but is not limited to, earnings requirements, use of regional unemployment rates, process for issuing Records of Employment, and the defined start and end dates of qualifying and/or benefit periods.
Management action plan 1.1
Analyze how the qualifying conditions for EI fishing benefits impact the level of support provided to self-employed fishers in a changing fishing industry
Planned completion date: June, 2027
Action status: Yet to commence
Accountable lead(s): DG, Employment Insurance Policy Directorate, SEB
Recommendation #2
It is recommended that Service Canada improve officer training on EI fishing benefit regulations and improve expertise to provide efficient and accurate service to self-employed fishers during the application process.
Management response
Each step involves distinct actions, which may be addressed independently or in some instances, in parallel to each other. In the end, officers at first point of contact will be provided with the necessary knowledge needed throughout the application process, as referenced in the EI Fishing benefits evaluation. Specifically, it aims to enhance the knowledge and expertise of officers and business expertise with the standardization of learning materials in EI processing and implementing targeted technical meetings for the EI Call Centre network.
Management action plan 2.1
Gathered existing learning materials for EI processing Fishing Benefits
Planned completion date: January, 2026
Action status: Complete
Accountable lead(s): DG, CTD Directorate, IENB
Management action plan 2.2
Standardization of learning materials for EI processing Fishing Benefits
Planned completion date: June, 2026
Action status: In progress
Accountable lead(s): DG, CTD Directorate, IENB
Management action plan 2.3
Consulted with Training Delivery and Integrated Workload and Workforce Management teams to assess both short-term and medium to long term Fishing benefit training needs in the EI processing network
Planned completion date: January, 2026
Action status: Complete
Accountable lead(s): DG, CTD Directorate, IENB
Supporting: DG, TD Directorate, IENB, DG, P&F Directorate, IWWMB
Additional information:
the regions are not involved in the MRAP and as such no approval is needed. At the moment Atlantic and Quebec Regions are the only regions delivering fishing benefits and have approximately 60 officers.
Management action plan 2.4
Upon completion of the standardization for EI processing Fishing Benefits, share learning materials across expertise teams
Planned completion date: July, 2026
Action status: Yet to commence
Accountable lead(s): DG, CTD Directorate, IENB
Management action plan 2.5
Develop targeted Technical meetings for the EI Call Centre network, designed to clarify, review and reinforce knowledge of Fishing benefits, at first point of contact
Planned completion date: June, 2026
Action status: Yet to commence
Accountable lead(s): DG, CTD Directorate, IENB
Management action plan 2.6
Consult with Training Delivery to schedule targeted Technical meetings for the EI Call Centre network prior to the completion date of the development of materials
Planned completion date: April, 2026
Action status: Yet to commence
Accountable lead(s): DG, CTD Directorate, IENB
Supporting: DG, TD Directorate, IENB, DG, P&F Directorate, IWWMB
Management action plan 2.7
Implementation of targeted Technical meetings for the EI Call Centre network
Planned completion date: July, 2026
Action status: Yet to commence
Accountable lead(s): DG, CTD Directorate, IENB
Supporting: DG, TD Directorate, IENB
1. Introduction
This report presents the findings of the evaluation of the EI Fishing Benefits. This evaluation incorporates multiple lines of qualitative and quantitative evidence to assess the eligibility, accessibility, participation, usage, and delivery of EI fishing benefits. The evaluation covers the period from 2000 to 2022, including the temporary measures introduced during this period. This evaluation was carried out in alignment with departmental priorities. The last comprehensive summative evaluation of EI benefits was completed in 2006.
1.1 Background
Unemployment InsuranceFootnote 1 benefits for fishers were first introduced in 1957. Since then, fishing benefits have been modified and modernized several times with the latest being made under the EI Reform in 1996. Figure 1 provides the number of self-employed fishers (not including workers who were paid a wage on a fishing vessel) in Canada by gender between 2000 and 2021. Over that period, the number of self-employed fishers steadily declined from 38,000 in 2001 to 25,000 in 2021.
The decline in EI fishing claimants follows a similar trend in the number of licence holders and registered vessels. Under DFO fisheries management strategies, the number of available licences has been reduced annually.
- The number of licence holders in Canada has declined from 49,927 in 2000 to 20,820 in 2021.
- The number of vessels registered has also declined from 23,819 in 2000 to 16,255 in 2021.

Text description of figure 1
| Number of self-employed fishers | Number of males | Number of females | Total |
|---|---|---|---|
| 2001 | 31,747 | 6,567 | 38,314 |
| 2001 | 31,076 | 6,848 | 37,924 |
| 2002 | 30,852 | 7,161 | 38,013 |
| 2003 | 31,021 | 7,281 | 38,302 |
| 2004 | 30,948 | 7,372 | 38,320 |
| 2005 | 29,353 | 6,909 | 36,262 |
| 2006 | 27,959 | 6,743 | 34,702 |
| 2007 | 26,818 | 6,637 | 33,455 |
| 2008 | 25,534 | 6,303 | 31,837 |
| 2009 | 24,725 | 5,839 | 30,564 |
| 2010 | 24,784 | 5,789 | 30,573 |
| 2011 | 24,702 | 6,033 | 30,735 |
| 2012 | 24,090 | 5,907 | 29,997 |
| 2013 | 23,056 | 5,361 | 28,417 |
| 2014 | 23,424 | 5,658 | 29,082 |
| 2015 | 23,401 | 5,692 | 29,093 |
| 2016 | 23,400 | 5,915 | 29,315 |
| 2017 | 22,899 | 6,187 | 29,086 |
| 2018 | 22,680 | 6,250 | 28,930 |
| 2019 | 21,674 | 6,041 | 27,715 |
| 2020 | 20,134 | 5,442 | 25,576 |
| 2021 | 19,673 | 5,513 | 25,186 |
- Source: EI administrative data
1.2 Objective of the benefit
EI provides fishing benefits to qualifying, self-employed fishers who are actively seeking work. Unlike EI regular benefits, eligibility for EI fishing benefits is based on insurable earnings from fishing, not hours of insurable employment.
Under the Employment Insurance (Fishing) Regulations,Footnote 2 a fisher is a self-employed person engaged in fishing and includes a person engaged, other than under a contract of service or for their own or another person's sport:
- in making a catch
- in any work incidental to making or handling catch, such as loading, unloading, transporting or curing the catch; preparing, repairing, dismantling or laying up the fishing vessel or fishing gear, or
- in the construction of a fishing vessel for his or her own use or for the use of a crew of which the person is a member in making a catch
Self-employed fishers may be eligible to receive fishing benefits and other EI benefits such as sickness, maternity, parental, compassionate care and/or family caregiver benefits. EI fishing benefits are available for 2 fishing seasons per year: winter and summer fishing season.
1.3 Eligibility and qualification
To be eligible to receive EI fishing benefits,Footnote 3 self-employed fishers must be actively looking for work with respect to their fishing activities, have earned a minimum amount of insurable earnings from self-employment in fishing during their qualifying period, and not be qualified to receive regular benefits.
The qualifying period for EI fishing benefits is different from other types of benefits (typically a period of 52 weeks or since the last claim). It is defined as the shorter of either:
- the 31 weeks preceding the establishment of a new claim, or
- since the establishment of a previous claim
EI fishing benefits is divided into 2 seasons: summer and winter. Unlike other EI benefits, EI fishing benefits claimants may only receive entitlement (a maximum of 26 weeks) from their claim during specified benefit periods which correspond to either summer or winter EI fishing benefits.
| Season | Qualifying Period | Benefit Period |
|---|---|---|
| Summer | The 31 weeks immediately before you apply, but cannot start earlier than March 1. | From the week of October 1 to the week of June 15. |
| Winter | The 31 weeks immediately before you apply, but cannot start earlier than September 1. | From the week of April 1 to the week of December 15. |
As the 2 qualifying periods and benefit periods overlap and cover a full year, situations may arise where the fisher has sufficient insured earnings to qualify for either winter or summer fishing benefits. The decision as to which fishing benefit period, summer or winter, is claimed rests with the fisher and the decision is not reversibleFootnote 4. Figure 2 provides a visual representation of the qualifying and benefit periods.
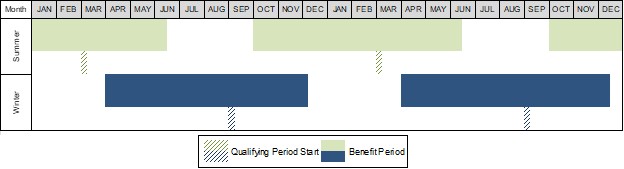
Text description of figure 2
This figure is a visual representation of the information provided in Table 1.
A self-employed fisher needs to earn a minimum amount of insurable earnings from self-employment in fishing during their qualifying period. This amount varies between $2,500 and $4,200, depending on the unemployment rate in the claimant’s region (see Table 1). These amounts have remained the same since January 1997.Footnote 5
The insurable earnings of a fisher are:
- the fisher's share of proceeds from the sale of catches during the qualifying period
- in the case of boat owners or lessees, total value of the sales minus 25% of the gross value of the sales (as expenses) minus shares of the crew members, wages and salaries paid. There is no minimum amount of weekly earnings
To calculate the benefit rate, total self-employed earnings from fishing during the qualifying period are divided by the applicable divisor.Footnote 6 The divisor ranges from 14 to 22 based on the regional rate of unemployment (see Table 2). This provides the weekly insurable earnings from fishing.
| Regional Unemployment Rate | Insurable Earnings | Earnings Divisor |
|---|---|---|
| 6.0% or lower | $4,200 | 22 |
| 6.1% to 7.0% | $4,000 | 21 |
| 7.1% to 8.0% | $3,800 | 20 |
| 8.1% to 9.0% | $3,600 | 19 |
| 9.1% to 10.0% | $3,400 | 18 |
| 10.1% to 11.0% | $3,200 | 17 |
| 11.1% to 12.0% | $2,900 | 16 |
| 12.1% to 13.0% | $2,700 | 15 |
| 13.1% or higher | $2,500 | 14 |
Any insurable earnings from other employment are added to the insurable earnings from fishing.Footnote 7 The rate calculation period is the most recent 26 consecutive weeks of employment in the qualifying period prior to the commencement of a fishing claim. The insurable earnings from insurable employment other than fishing is divided by the applicable divisor (see Table 1 above) or by the number of weeks worked, whichever is greater, to obtain the weekly insurable earnings from regular employment.
The weekly insurable earnings from fishing and regular employment (if any) are added together to obtain the total weekly insurable earnings. The total weekly insurable earnings are then multiplied by 55% to arrive at the weekly benefit rate, which is subject to a maximum weekly benefit rate ($638 in 2022).
2. Evaluation approach
The evaluation approach uses both quantitative and qualitative methods to provide evidence demonstrating whether the Program met its stated objective. It covers EI fishing benefits claims established between 2000 and 2022.
The scope of the evaluation and evaluation questions were developed in consultation with the Department of Employment and Social Development Canada’s Skills and Employment Branch, Service Canada, and Fisheries and Oceans Canada. The evaluation questions inform labour market needs, eligibility, participation, and usage of the benefits by self-employed fishers and the delivery of the benefits. Multiple lines of evidence were used, including:
- targeted literature and program documentation review
- 3 technical studies using administrative data
- 17 internal key informant interviews with Government of Canada officials
- 5 external key informant interviews with employers, employer/employee associations and experts
- 18 focus groups with a total of 73 participants across 6 provinces with:
- 26 EI regular claimants in the fishing industry
- 25 self-employed fishers, and
- 22 designated employers
Refer to Appendix A for the evaluation matrix, and Appendix B for more information about these lines of evidence
This scale is used in the report to contextualise findings from the interviews and focus groups:
- all.
- Theme was mentioned across 100% of the groups
- almost all.
- Theme was mentioned in 76% to 99% of the groups
- most.
- Theme was mentioned in 51% to 75% of the groups
- half.
- Theme was mentioned in 50% of the groups
- some.
- Theme was mentioned in 34% to 49% of the groups
- few.
- Theme was mentioned in 20% to 33% of the groups
- very few.
- Theme was mentioned in 1% to 19% of the groups
3. Eligibility and accessibility
3.1 Eligibility for EI fishing benefits
Key finding: Eligibility for EI fishing benefits over the study period was estimated at 80.7% for self-employed fishers who had a Record of Employment, paid EI premiums, and met the minimum insurable earnings threshold. However, some focus group and key informant respondents reported that the use of the regional unemployment rate, which can vary from 1 season to another, in determining the earnings threshold required to be eligible, made access to fishing benefits challenging and uncertain.
The eligibility rate is defined as the share of individuals who paid EI premiums and had a Record of Employment (ROE)Footnote 8 and met the minimum insurable earnings threshold required.Footnote 9 In order to estimate the eligibility rate, the analysis is broken down for each of these conditions.
From 2001 to 2021, of those who had an ROE and paid EI premiums, 84.4% of self-employed fishers had earned more than the minimum insurable earnings required for the EI region in which they resided (between $2,500 and $4,200). This proportion was relatively stable at around 84% until 2015 (Figure 3, blue line) but has since increased to over 88% in recent years. However, to qualify for EI fishing benefits, self-employed fishers must not have enough hours of insurable employment to qualify for EI regular benefits. As a result of that rule, on average an additional 3.7% of self-employed fishers (approximately 1,100 fishers per year) with an ROE did not qualify for EI fishing benefits due to their accumulated hours, which made them eligible for EI regular benefits (Figure 3, red line). Consequently, the average eligibility rate to EI fishing benefits over the period studied was estimated at 80.7% but ranged from 78.0% in 2014 to 85.0% in 2021.

Text description of figure 3
| Eligibility rate | Eligible for both EI regular and fishing | Eligible for EI fishing only |
|---|---|---|
| 2001 | 84.0% | 80.7% |
| 2002 | 85.2% | 81.8% |
| 2003 | 84.2% | 81.1% |
| 2004 | 83.7% | 80.5% |
| 2005 | 83.8% | 80.9% |
| 2006 | 83.3% | 79.9% |
| 2007 | 83.4% | 79.5% |
| 2008 | 83.4% | 79.7% |
| 2009 | 83.6% | 80.1% |
| 2010 | 83.9% | 80.0% |
| 2011 | 84.5% | 80.3% |
| 2012 | 83.8% | 79.2% |
| 2013 | 83.8% | 79.5% |
| 2014 | 82.1% | 78.2% |
| 2015 | 83.7% | 79.6% |
| 2016 | 84.6% | 80.7% |
| 2017 | 84.9% | 81.2% |
| 2018 | 85.8% | 82.0% |
| 2019 | 86.5% | 82.6% |
| 2020 | 87.1% | 83.4% |
| 2021 | 88.6% | 85.0% |
- Source: EI administrative data
Some key informants interviewed (7 of 22) said they believe the earnings threshold of $2,500 to $4,200 was generally achievable for self-employed fishers. However, opinions vary based on annual conditions and the specific fish species being targeted. While some reported that meeting this threshold was not a significant challenge, few key informants (2 of 22) mentioned notable exceptions where fluctuations in catch volumes and values impacted certain regions and fisheries. They expressed that it depended on the year and the fish species, saying that some species were low in catch volume some years and required more effort and in others, catch volume was more plentiful and valuable.
Most focus groups (self-employed fishers, employers) stated that the eligibility criteria were not a concern. As per the 2016 MAR, over 98% of all self-employed fishers who qualify for fishing benefits had $5,500 or more in earnings between 2010 and 2015. The rate continued to remain above 98.0% for the remainder of the evaluation period from 2017 to 2022. In half of the groups with self-employed fishers, focus group participants mentioned that work that may take place before or after the fishing season, specifically repairs and upkeep that the crew may have done on fishing vessels or equipment, was missing from defining eligibility for self-employed fishers as this work is often unpaid (directly) but was considered by participants to be part of the work required to receive a share of the catch value.
In a few focus groups (both self-employed fishers and regular benefits recipients), participants questioned the use of the regional unemployment rate in calculating benefits via the use of a varying earnings divisor. They felt that an unemployment rate for the province would be more appropriate. Their main argument was that fishing work does not change based on regional employment conditions, and the amount fishers catch is not tied to how many jobs exist in that particular region. In particular, fishers in regions with lower unemployment rates faced relatively stricter eligibility criteria and had to work more to qualify for the same level of weekly benefits. Some focus group participants even noted that fishers in urban EI regions had to earn nearly twice as much to reach the maximum weekly benefit rate, compared to those in rural EI regions despite fishing in the same waters.
Some Service Canada officers and representatives from fisher associations interviewed (7 of 22) noted the changing of fishing seasons relative to EI fishing qualifying and benefit periods. It was noted that climate change has impacted the fishing seasons, and they were becoming less defined as summer and winter seasons, resulting in EI fishing claimants having difficulty in establishing their claims within the benefit period windows. For example, if there were delays in fishing due to weather conditions (for example, a severe storm), some fishers had to wait to apply for EI fishing benefits until later in the summer. EI regulations require that EI fishing benefits’ applications include the past 31 weeks of work history, and now this period crossed over into both fishing seasons and included 2 ROEs from fishing. As a result, some self-employed fishers have had to establish their claims at varying times during the benefit periods resulting in claims that are not able to use the maximum 26 weeks of entitlement due to the benefit period ending.
4. Participation and usage
The usage rate is defined as the share of self-employed fishers (or workers) who received EI fishing benefits among self-employed fishers who paid EI premiums. Figure 4 below shows the usage rate of EI fishing benefits by self-employed fishers over the study period.
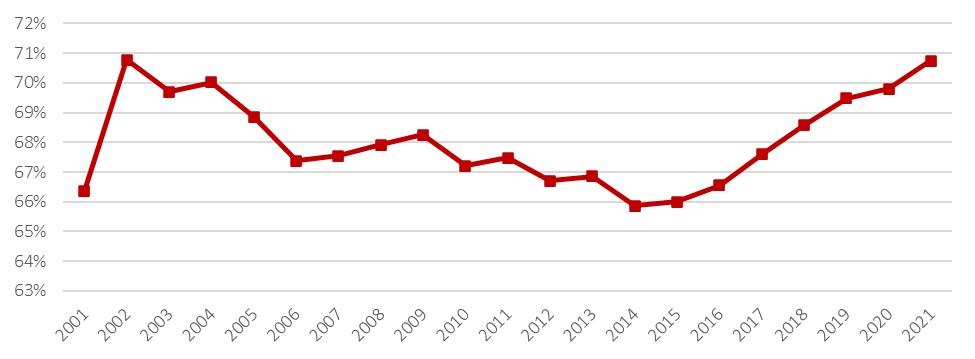
Text description of figure 4
| Year | Usage rate |
|---|---|
| 2001 | 66.4% |
| 2002 | 70.8% |
| 2003 | 69.7% |
| 2004 | 70.0% |
| 2005 | 68.9% |
| 2006 | 67.4% |
| 2007 | 67.5% |
| 2008 | 67.9% |
| 2009 | 68.3% |
| 2010 | 67.2% |
| 2011 | 67.5% |
| 2012 | 66.7% |
| 2013 | 66.9% |
| 2014 | 65.9% |
| 2015 | 66.0% |
| 2016 | 66.5% |
| 2017 | 67.6% |
| 2018 | 68.6% |
| 2019 | 69.5% |
| 2020 | 69.8% |
| 2021 | 70.7% |
- Source: EI administrative data
EI fishing benefits claims reached an annual peak of 37,494 claims in 2004 and steadily declined to 29,958 in 2021. Figure 5 below presents an illustration of the total number of EI fishing benefits claims established annually during the study period along with the total amount of EI benefits paid. The total number of EI fishing claims established per year peaked at 37,494 in 2004 and then steadily declined to 29,958 in 2021. The total amount of benefits paid to EI fishing claims has similarly fallen from a peak of $382.6 million in 2003 to $354.5 million in 2021.

Text description of figure 5
| Year | Benefits paid | Fishing claims |
|---|---|---|
| 2000 | 341 | 28176 |
| 2001 | 352 | 30434 |
| 2002 | 383 | 35726 |
| 2003 | 380 | 36878 |
| 2004 | 307 | 37494 |
| 2005 | 325 | 33964 |
| 2006 | 308 | 32207 |
| 2007 | 309 | 31839 |
| 2008 | 296 | 30452 |
| 2009 | 286 | 29071 |
| 2010 | 283 | 28526 |
| 2011 | 301 | 29716 |
| 2012 | 291 | 28631 |
| 2013 | 286 | 27162 |
| 2014 | 297 | 27632 |
| 2015 | 302 | 28073 |
| 2016 | 319 | 28996 |
| 2017 | 338 | 30366 |
| 2018 | 337 | 30435 |
| 2019 | 349 | 30264 |
| 2020 | 330 | 28410 |
| 2021 | 355 | 29958 |
| 2022 | 343 | 30446 |
- Source: EI administrative data
The decline was mostly attributed to a decline in EI summer fishing benefits which dropped from a high of 25,031 claims in 2003 to 17,656 in 2021. The share of claimants who establish both EI summer and winter fishing claims within the same year represented the largest group of fishers by a margin which increased over the study period to represent 44.8% of EI fishing claimants in 2021.
Figure 6 shows the volume of EI summer and winter fishing claims per fishing year.Footnote 11 During the study period, the number of unique claimants dropped from a peak of almost 28,000 in 2003 to 21,117 in 2021. In part due to the decline in total claims and the number of unique claimants, the total amount of fishing benefits paid in dollarsFootnote 12 per fishing year decreased from a high of $382.6 million in 2010 to $354.2 million in 2021 in a trend as seen previously in Figure 1.
The share of EI fishing claimants who claim both summer and winter benefits increased over the reference period and now averages over 8,500 claimants per year and represented the largest group of claimants. Winter-only claimants averaged below 3,000 throughout the study period and summer-only claimants declined to 8,140 in 2021.

Text description of figure 6
| Year | Summer only | Winter only | 2-season |
|---|---|---|---|
| 2000 | 18012 | 2396 | 9538 |
| 2001 | 15308 | 2735 | 16143 |
| 2002 | 15647 | 2442 | 18795 |
| 2003 | 14932 | 2558 | 20192 |
| 2004 | 16217 | 2264 | 17636 |
| 2005 | 14680 | 2254 | 16366 |
| 2006 | 12504 | 2315 | 17916 |
| 2007 | 11631 | 2167 | 17922 |
| 2008 | 11053 | 2280 | 16684 |
| 2009 | 10612 | 2400 | 15728 |
| 2010 | 9759 | 2597 | 17168 |
| 2011 | 9978 | 2471 | 16998 |
| 2012 | 9344 | 2473 | 16013 |
| 2013 | 8845 | 2630 | 15856 |
| 2014 | 9167 | 2812 | 15965 |
| 2015 | 9178 | 3039 | 16366 |
| 2016 | 9492 | 3257 | 16939 |
| 2017 | 9533 | 3200 | 17660 |
| 2018 | 9353 | 3336 | 18052 |
| 2019 | 9782 | 2697 | 16519 |
| 2020 | 7865 | 2782 | 19021 |
| 2021 | 8140 | 3484 | 18976 |
- Source: EI administrative data
EI fishing benefits are considered essential to maintaining participation in the fishing industry. All 6 focus groups with 22 participating employers indicated that EI benefits were essential for keeping people employed in the fishing industry and that without these benefits, they did not believe that many would continue to work in the industry because of the nature of the employment.
4.1 Timing of EI fishing benefit claims
Key finding: About 45% of fishers claim both summer and winter benefits during the same year and typically do not claim benefits for 8 consecutive weeks within the April to July period. Most claimants interviewed as part of a focus group began claiming their summer benefits right after the end of the winter benefit period and encountered issues closing 1 claim and establishing another, causing processing delays.
Self-employed fishers’ ROE and pure fishing claimsFootnote 13 data were merged to identify when fishers were working (based on the ROE’s first week worked and last week worked) and when they were receiving fishing benefits or served a waiting period (based on the Status Vector weekly variables).Footnote 14 Figure 7 shows the number of self-employed fishers who fished or claimed EI fishing benefits by week for single-season fishers (pure claim) in 2018.Footnote 15 Panel A shows summer fishing benefits and Panel B presents winter fishing benefits. Fishers who only established summer fishing benefits claims typically fish from May to October and receive benefits from October to May, while winter benefits fishers typically fish from December to May and receive benefits from May to December.Footnote 16
Figure 7: Number of self-employed fishers who fished or claimed EI fishing benefits by week for single-season fishers (pure claim), 2018

Text description of figure 7
| Week | Month | Summer | Waiting Period | Work |
|---|---|---|---|---|
| 1 | January | 4754 | 80 | 131 |
| 2 | January | 4811 | 93 | 118 |
| 3 | January | 4911 | 56 | 113 |
| 4 | January | 4961 | 42 | 112 |
| 5 | February | 4990 | 28 | 118 |
| 6 | February | 5005 | 24 | 130 |
| 7 | February | 5011 | 13 | 132 |
| 8 | February | 4963 | 18 | 181 |
| 9 | March | 4906 | 4 | 248 |
| 10 | March | 5005 | 1 | 172 |
| 11 | March | 4971 | 0 | 195 |
| 12 | March | 4920 | 1 | 214 |
| 13 | April | 4909 | 0 | 252 |
| 14 | April | 3839 | 2 | 441 |
| 15 | April | 3372 | 2 | 650 |
| 16 | April | 2834 | 0 | 1117 |
| 17 | April | 2355 | 10 | 1602 |
| 18 | May | 1849 | 17 | 2139 |
| 19 | May | 1470 | 12 | 2454 |
| 20 | May | 1252 | 18 | 2646 |
| 21 | May | 1043 | 17 | 2872 |
| 22 | June | 864 | 17 | 3111 |
| 23 | June | 684 | 12 | 3321 |
| 24 | June | 28 | 43 | 3596 |
| 25 | June | 23 | 24 | 3433 |
| 26 | July | 23 | 65 | 3361 |
| 27 | July | 24 | 20 | 3384 |
| 28 | July | 21 | 42 | 3386 |
| 29 | July | 16 | 6 | 3351 |
| 30 | July | 13 | 11 | 3366 |
| 31 | August | 11 | 6 | 3592 |
| 32 | August | 7 | 3 | 3668 |
| 33 | August | 8 | 1 | 3608 |
| 34 | August | 7 | 0 | 3391 |
| 35 | September | 4 | 2 | 3216 |
| 36 | September | 3 | 0 | 2963 |
| 37 | September | 3 | 0 | 2771 |
| 38 | September | 1 | 0 | 2596 |
| 39 | September | 0 | 1645 | 2340 |
| 40 | October | 1616 | 968 | 1942 |
| 41 | October | 2549 | 698 | 1530 |
| 42 | October | 3214 | 479 | 1284 |
| 43 | October | 3659 | 486 | 1030 |
| 44 | November | 4114 | 506 | 733 |
| 45 | November | 4627 | 356 | 511 |
| 46 | November | 4953 | 327 | 368 |
| 47 | November | 5268 | 251 | 278 |
| 48 | December | 5439 | 232 | 258 |
| 49 | December | 5671 | 216 | 196 |
| 50 | December | 5877 | 270 | 156 |
| 51 | December | 6136 | 155 | 104 |
| 52 | December | 6254 | 150 | 92 |
- Source: EI administrative data

Text description of figure 7
| Week | Month | Winter | Waiting Period | Work |
|---|---|---|---|---|
| 1 | January | 2 | 0 | 1202 |
| 2 | January | 2 | 0 | 1230 |
| 3 | January | 3 | 0 | 1234 |
| 4 | January | 3 | 0 | 1241 |
| 5 | February | 2 | 0 | 1252 |
| 6 | February | 3 | 0 | 1245 |
| 7 | February | 3 | 0 | 1252 |
| 8 | February | 3 | 0 | 1266 |
| 9 | March | 1 | 0 | 1265 |
| 10 | March | 1 | 0 | 1238 |
| 11 | March | 1 | 0 | 1227 |
| 12 | March | 0 | 0 | 1194 |
| 13 | April | 0 | 225 | 1036 |
| 14 | April | 221 | 79 | 1041 |
| 15 | April | 294 | 86 | 1038 |
| 16 | April | 369 | 53 | 1083 |
| 17 | April | 422 | 48 | 1108 |
| 18 | May | 464 | 47 | 1116 |
| 19 | May | 508 | 29 | 1115 |
| 20 | May | 530 | 33 | 1096 |
| 21 | May | 554 | 113 | 1017 |
| 22 | June | 664 | 800 | 282 |
| 23 | June | 1448 | 77 | 261 |
| 24 | June | 1511 | 50 | 233 |
| 25 | June | 1559 | 51 | 196 |
| 26 | July | 1603 | 117 | 118 |
| 27 | July | 1709 | 56 | 84 |
| 28 | July | 1778 | 42 | 63 |
| 29 | July | 1806 | 26 | 57 |
| 30 | July | 1827 | 34 | 48 |
| 31 | August | 1857 | 29 | 35 |
| 32 | August | 1867 | 24 | 28 |
| 33 | August | 1866 | 5 | 34 |
| 34 | August | 1876 | 11 | 28 |
| 35 | September | 1848 | 0 | 43 |
| 36 | September | 1825 | 2 | 53 |
| 37 | September | 1812 | 0 | 58 |
| 38 | September | 1810 | 0 | 64 |
| 39 | September | 1769 | 2 | 92 |
| 40 | October | 1646 | 1 | 94 |
| 41 | October | 1574 | 1 | 110 |
| 42 | October | 1495 | 0 | 107 |
| 43 | October | 1446 | 0 | 103 |
| 44 | November | 1424 | 0 | 81 |
| 45 | November | 1365 | 0 | 132 |
| 46 | November | 1272 | 0 | 210 |
| 47 | November | 975 | 0 | 250 |
| 48 | December | 454 | 0 | 858 |
| 49 | December | 331 | 0 | 990 |
| 50 | December | 4 | 1 | 1065 |
| 51 | December | 4 | 3 | 1067 |
| 52 | December | 0 | 17 | 1134 |
- Source: EI administrative data
Figure 8 shows the number of self-employed fishers who fished or claimed EI fishing benefits by week in both winter and summer seasons (both pure claims) in 2018. These fishers typically did not receive benefits for approximately 8 weeks on average around the end of April to June because they were fishing. The April to June timing also reflects the overlap of qualifying periods for both seasons, meaning fishers could have met the eligibility requirements for both benefits.

Text description of figure 8
| Week | Month | Summer | Winter | Waiting Period | Work |
|---|---|---|---|---|---|
| 1 | January | 6651 | 25 | 124 | 235 |
| 2 | January | 6686 | 12 | 89 | 244 |
| 3 | January | 6781 | 11 | 71 | 188 |
| 4 | January | 6851 | 11 | 47 | 167 |
| 5 | February | 6848 | 11 | 32 | 167 |
| 6 | February | 6870 | 10 | 23 | 188 |
| 7 | February | 6877 | 9 | 14 | 155 |
| 8 | February | 6809 | 5 | 17 | 175 |
| 9 | March | 6892 | 6 | 3 | 144 |
| 10 | March | 6929 | 5 | 0 | 147 |
| 11 | March | 6871 | 2 | 1 | 162 |
| 12 | March | 6866 | 0 | 1 | 177 |
| 13 | April | 6872 | 0 | 58 | 186 |
| 14 | April | 6229 | 47 | 17 | 586 |
| 15 | April | 5543 | 62 | 46 | 1146 |
| 16 | April | 4446 | 78 | 60 | 2242 |
| 17 | April | 2683 | 128 | 254 | 3715 |
| 18 | May | 2051 | 290 | 413 | 4195 |
| 19 | May | 1575 | 548 | 429 | 4463 |
| 20 | May | 1332 | 842 | 407 | 4508 |
| 21 | May | 947 | 1052 | 376 | 4812 |
| 22 | June | 878 | 1292 | 407 | 4686 |
| 23 | June | 673 | 1624 | 356 | 4622 |
| 24 | June | 11 | 1910 | 881 | 4461 |
| 25 | June | 7 | 3028 | 754 | 3554 |
| 26 | July | 7 | 3353 | 1755 | 2286 |
| 27 | July | 3 | 5217 | 522 | 1701 |
| 28 | July | 1 | 5483 | 470 | 1536 |
| 29 | July | 0 | 6156 | 156 | 1214 |
| 30 | July | 0 | 6421 | 111 | 1003 |
| 31 | August | 0 | 6617 | 83 | 838 |
| 32 | August | 0 | 6524 | 87 | 934 |
| 33 | August | 0 | 6536 | 36 | 944 |
| 34 | August | 0 | 6686 | 16 | 818 |
| 35 | September | 0 | 6699 | 7 | 800 |
| 36 | September | 0 | 6759 | 9 | 707 |
| 37 | September | 0 | 7034 | 6 | 476 |
| 38 | September | 0 | 6996 | 8 | 517 |
| 39 | September | 0 | 6848 | 24 | 644 |
| 40 | October | 21 | 6969 | 39 | 477 |
| 41 | October | 53 | 7171 | 57 | 260 |
| 42 | October | 97 | 7087 | 50 | 308 |
| 43 | October | 138 | 7006 | 71 | 295 |
| 44 | November | 206 | 7008 | 103 | 159 |
| 45 | November | 306 | 6833 | 185 | 171 |
| 46 | November | 483 | 6511 | 251 | 235 |
| 47 | November | 720 | 6211 | 270 | 222 |
| 48 | December | 949 | 5577 | 401 | 397 |
| 49 | December | 1365 | 5139 | 342 | 330 |
| 50 | December | 1689 | 17 | 5333 | 300 |
| 51 | December | 6980 | 4 | 267 | 244 |
| 52 | December | 7214 | 0 | 100 | 234 |
- Source: EI administrative data
4.2 Backdating claims
EI applicants who file a claim for benefits but want to have the claim begin at an earlier date than the week in which their claim is made must make a request to backdate the claim (also known as antedates) to that earlier date. To be eligible for an antedate, the applicant must qualify on the earlier date and show good cause for the delay in filing. If approved, Service Canada officers must manually adjust the start date of the claim. Historically, Service Canada received a large number of antedate requests involving short delays in applying for EI benefits of all types, with the majority of those antedate requests being approved. Therefore, to offer better service to claimants applying for any EI benefit and to remove the burden of requesting an antedate, the Administrative Policy, also commonly referred to as the administrative rule, was introducedFootnote 17. For fishers, if they established their claim within 4 weeks of the week in which the trip ends (fresh catch) or the week in which the date of purchase (cured catch) occurs short delay is considered as good cause for the delay and the antedate is automatically approved if the fisher qualifies on the earlier date.
An EI fishing claim begins in the week the claim for benefits is made and the applicant must indicate when they want their claim to begin on their application. However, fishers often submit their applications several months after their last fishing trip, meaning that not all requests are granted automatically, and the applicant must submit a separate request.
When asked what common challenges existed in processing EI fishing claims, some internal key informants (8 of 22) pointed to a recurring issue related to this submission practice. They stated that this process adds complexity and is burdensome. In 2022, of the 31,816 EI fishing benefits claims established, 2.1% required Service Canada officers to complete backdating work items. At the claimant level, this represented 2.0% of the 21,569 individuals who established a claim that year.
This issue occurs among self-employed fishers who apply for both summer and winter, which requires careful timing so that they can split their ROEs so as to have their fishing earnings in the correct qualifying periods. For example, fishers have a 31-week qualifying period to accumulate earnings for a new claim. However, when they try to split earnings across multiple ROEs from 1 fishing season between 2 claims, they often miscalculate the dates. This can lead to the early termination of a previous claim, making the process even more complicated.
The need for precise timing can cause confusion for both claimants and Service Canada officers. The challenge is not only ending the benefit period of EI fishing benefits claims on time, but also about retroactively canceling and re-establishing benefit periods with antedates to provide clients their full entitlement to both winter and summer fishing benefits. According to Service Canada key informants (8 of 22), this not only increases administrative workload but may also cause barriers for fishers trying to access EI fishing benefits.
For example, earnings from multiple ROEs are used to establish 1 EI fishing benefits claim instead of having the ROEs split across 2 separate benefit periods for each season of EI fishing benefits. When all earnings are used for 1 benefit period, fishers cannot qualify for the next season’s claim, creating eligibility issues. Officers must then perform complex manual interventions as outlined in current legislative and regulatory requirements, including but not limited to:
- retroactively canceling the benefit period
- re-establishing a new claim that is antedated, to include only 1 ROE
- determining the timing of the next claim, to ensure the “newly established antedated claim” is terminated in a timely manner
4.3 EI fishing benefits and regular benefits compared
Key finding: On average, EI fishing claimants in 2021 were likely to be 50 years old, married, male without dependents, living in a rural area, with a high-school diploma. Fishing benefits claims were concentrated among the Atlantic provinces, Quebec, and British Columbia.
EI fishing benefit claimants in 2018 were compared to regular benefits claimants from fishing-related occupationsFootnote 18 and claimants from seasonal primary industriesFootnote 19 along key socio-demographic characteristics, claim-related characteristics, and income variables. EI fishing claimants were categorized as single season summer or winter or as claiming both seasons during the year.
As shown in Table 3 (below), in terms of gender, among each of the 2 comparator groups of EI regular claimants a higher proportion were women compared to self-employed fishers. On average, claimants in both comparator groups were slightly younger than fishers who claimed benefits for both seasons (-3.5 years at most). The education level across groups was comparable with at least 75% of claimants reporting a high school education as their highest level of education.
Both comparator groups of EI regular claimants had higher average weeks of benefit entitlement than fishers who claim benefits for a single season (maximum of 26 weeks) but less than fishers who claim benefits for both seasons (maximum of 26 weeks for each of the 2 claims). In terms of the number of weeks of entitlement used, EI regular benefits claimants from seasonal primary industries had similar usage fishers who claimed benefits for a single season (24.0 versus 23.4 for winter and 26.0 weeks for summerFootnote 20). On the other hand, claimants from fishing-related occupations used 31.2 weeks on average and fishers who claimed benefits for both seasons used 40.6 weeks. The average weekly benefit rate of both comparator groups of EI regular claimants was lower than the average for all fishing claimants.
Based on the EI administrative data, the average total benefit amount received was similar for both regular claimants and fishers who claim benefits for a single season (between $10,000 to $13,000 per claim). Self-employed fishers claiming in both seasons had the highest average weekly benefit rate ($528) and received on average the highest amount of benefits ($21,246 for both claims) in a calendar year. In terms of income, EI fishing claimants had higher total individual annual income (as reported on income tax and benefit returns) than the 2 groups of EI regular claimants.
Approximately, 61.6% of claims from fishing-related occupations and 52.9% of claims from seasonal primary industries were considered seasonal according to the definition used in the EI MAR.Footnote 21
| Claimant characteristics | EI fishing benefit claimants (Summer) | EI fishing benefit claimants (Winter) | EI fishing benefit claimants ( Both seasons*) | EI Regular benefit claimants (Group 1: Occupations) | EI Regular benefit claimants ( Group 2: Industry) |
|---|---|---|---|---|---|
| Gender (share of female) | 24.0% | 16.3% | 18.6% | 39.6% | 29.7% |
| Average Age | 49.0 | 46.1 | 50.6 | 47.1 | 48.3 |
| Age: Under 35 | 20.0% | 25.0% | 11.8% | 23.2% | 21.8% |
| Age: 35 to 54 | 38.5% | 43.0% | 46.1% | 39.0% | 36.2% |
| Age: 55 or Older | 41.5% | 32.0% | 42.1% | 37.8% | 42.0% |
| Marital Status: Couple | 58.9% | 58.4% | 73.0% | 48.7% | 57.3% |
| Marital Status: Single | 32.6% | 33.2% | 19.2% | 41.5% | 32.3% |
| Marital Status: Widowed/Divorced/Separated | 8.5% | 8.4% | 7.8% | 9.8% | 10.4% |
| Education: Primary - Elementary | 15.4% | 15.8% | 14.0% | 16.8% | 17.5% |
| Education: Secondary - High School | 65.7% | 62.8% | 65.0% | 65.6% | 58.4% |
| Education: College | 11.3% | 12.1% | 14.4% | 11.7% | 12.7% |
| Education: Apprenticeship/University/Other | 7.6% | 9.3% | 6.6% | 5.9% | 12.4% |
| Average Entitlement (Weeks)** | 26.0 | 26.0 | 52.0 | 34.8 | 32.1 |
| Average Number of Weeks Used** | 26.0 | 23.4 | 40.6 | 31.2 | 23.4 |
| Average Benefit Amount ($)** | 12,710 | 11,716 | 21,246 | 13,363 | 10,108 |
| Average Weekly Benefit Rate ($) | 490 | 504 | 528 | 455 | 448 |
| % of Seasonal claims*** | 0 | 0 | 0 | 61.6% | 52.9% |
| Average Employment Earnings ($) | 1,563 | 4,088 | 851 | 18,592 | 33,731 |
| Average Gross fishing earnings ($) | 44,327 | 62,128 | 99,087 | 904 | 147 |
| Average EI Benefits ($) | 12,474 | 13,960 | 20,871 | 12,868 | 8,870 |
| Average Total income ($) | 42,482 | 60,536 | 74,993 | 34,597 | 39,660 |
| % of spouses receiving benefits | 56.5% | 42.3% | 64.0% | 57.3% | 36.2% |
| Observations | 9,425 | 3,291 | 8,641 | 18,539 | 13,855 |
- *Claimants appear once, claim-related variables are the sum of both claims except for the weekly benefit rate where it the average
- ** Any type of benefits during the claim
- *** Seasonal as defined for the purposes of the EI MAR
- Source: EI administrative data
4.4 Geographic distribution of EI fishing claimants
Fishing benefit claims were concentrated among the Atlantic provinces, Quebec, and British Columbia. Figure 9 shows how fishing claims were distributed across provinces for each year of the reference period. In 2021, more than half (56.6%) of self-employed fishers were concentrated in 3 EI regions:
- Newfoundland and Labrador
- Western Nova Scotia
- Prince Edward Island

Text description of figure 9
| Year | Newfoundland and Labrador | Prince Edward Island | Nova Scotia | New Brunswick | Quebec | British Columbia | Other |
|---|---|---|---|---|---|---|---|
| 2000 | 52.52 | 10.77 | 30.11 | 13.65 | 7.25 | 18.49 | 1.95 |
| 2001 | 53.81 | 10.69 | 28.43 | 13.09 | 6.92 | 17.68 | 1.93 |
| 2002 | 48.86 | 9.65 | 24.19 | 11.36 | 5.87 | 15.17 | 1.7 |
| 2003 | 48.83 | 9.65 | 23.67 | 11.21 | 5.65 | 14.83 | 1.69 |
| 2004 | 46.18 | 9.60 | 23.40 | 11.07 | 5.4 | 14.27 | 1.72 |
| 2005 | 47.21 | 10.61 | 25.70 | 12.09 | 5.79 | 15.46 | 1.77 |
| 2006 | 48.98 | 11.07 | 27.17 | 12.65 | 6.05 | 15.65 | 1.86 |
| 2007 | 49.45 | 10.93 | 27.46 | 12.53 | 6.04 | 15.72 | 1.86 |
| 2008 | 50.80 | 11.13 | 28.59 | 12.97 | 6.29 | 17.23 | 1.93 |
| 2009 | 51.28 | 11.42 | 30.00 | 13.54 | 6.47 | 18.25 | 1.9 |
| 2010 | 52.51 | 11.43 | 30.44 | 13.81 | 6.56 | 17.99 | 2.04 |
| 2011 | 50.05 | 10.86 | 29.12 | 13.24 | 6.23 | 17.35 | 1.92 |
| 2012 | 51.45 | 11.09 | 29.98 | 13.64 | 6.38 | 17.56 | 1.91 |
| 2013 | 53.51 | 11.58 | 31.19 | 14.21 | 6.65 | 18.14 | 1.98 |
| 2014 | 52.28 | 11.47 | 30.58 | 13.97 | 6.46 | 18.08 | 1.9 |
| 2015 | 51.97 | 11.53 | 30.13 | 13.84 | 6.34 | 17.63 | 1.73 |
| 2016 | 48.83 | 11.41 | 29.05 | 13.64 | 6.12 | 16.69 | 1.58 |
| 2017 | 48.63 | 11.16 | 27.89 | 13.12 | 5.88 | 15.5 | 1.72 |
| 2018 | 49.38 | 11.20 | 27.77 | 13.03 | 5.79 | 15.59 | 1.74 |
| 2019 | 48.80 | 11.17 | 27.41 | 12.81 | 5.68 | 15.26 | 1.75 |
| 2020 | 55.46 | 11.96 | 32.87 | 14.59 | 6.47 | 21.37 | 1.67 |
| 2021 | 51.68 | 11.01 | 27.12 | 12.77 | 5.63 | 16.16 | 1.69 |
| 2022 | 49.45 | 10.84 | 26.37 | 12.25 | 5.32 | 14.68 | 1.79 |
- Source: EI administrative data
4.5 Benefit rate and income
Key finding: There was agreement across all focus groups with claimants (self-employed fishers and regular benefits) that the benefit rate of 55% of weekly insurable earnings was low and sometimes was too low to meet their off-season financial needs. The share of EI fishing claims who received the maximum weekly benefit rate ranged from 60% in 2009 to 75% in 2021.
Since 2000, there has been relatively little variation in the share of EI fishing benefit claims entitled to the maximum weekly benefit rate aside from the low of 60% in 2009. In the 3 years prior to the 2020 COVID-19 pandemic, approximately 73% of claims reached the maximum weekly benefit rate threshold, and in 2021, 75% reached it. In comparison, the share of EI regular claimants receiving the maximum weekly benefit rate was just below 50.0% in the years just before the COVID-19 pandemic in 2018-2019.Footnote 22
Figure 10 details the share of claims reaching the maximum weekly benefit rate by season from 2000 to 2021. In the figure, claims are shown by summer and winter benefit and by single-season and 2-season claimants. Summer 2-season includes all summer EI fishing benefit claims for those who claim both summer and winter and winter 2-season includes their winter EI fishing benefit claims.

Text description of figure 10
| Year | Summer only | Winter only | Summer 2-season | Winter 2-season |
|---|---|---|---|---|
| 2000 | 68.3 | 62.2 | 88.7 | 66.2 |
| 2001 | 61.5 | 59.4 | 85.2 | 63.3 |
| 2002 | 60.9 | 58.8 | 81.4 | 66.1 |
| 2003 | 61.2 | 57.1 | 81.7 | 67.9 |
| 2004 | 62.0 | 58.3 | 83.3 | 63.0 |
| 2005 | 54.8 | 58.9 | 81.3 | 68.2 |
| 2006 | 55.5 | 57.0 | 77.8 | 62.5 |
| 2007 | 56.9 | 60.8 | 78.8 | 63.2 |
| 2008 | 56.1 | 62.4 | 78.4 | 60.8 |
| 2009 | 53.4 | 60.1 | 65.9 | 59.4 |
| 2010 | 58.8 | 60.2 | 75.9 | 70.7 |
| 2011 | 58.5 | 65.0 | 81.4 | 69.3 |
| 2012 | 56.3 | 59.2 | 78.3 | 67.2 |
| 2013 | 55.7 | 66.4 | 74.8 | 74.4 |
| 2014 | 62.2 | 68.9 | 82.7 | 77.6 |
| 2015 | 61.4 | 65.1 | 86.5 | 76.7 |
| 2016 | 61.1 | 67.0 | 84.6 | 79.2 |
| 2017 | 57.6 | 68.2 | 84.8 | 79.3 |
| 2018 | 59.8 | 67.5 | 82.7 | 78.8 |
| 2019 | 59.5 | 67.7 | 84.9 | 70.2 |
| 2020 | 70.7 | 74.2 | 69.8 | 78.6 |
| 2021 | 56.4 | 63.4 | 83.7 | 77.1 |
- Source: EI administrative data
Compared to EI regular benefits claimants from fishing-related occupations and seasonal primary industries in Table 3, all EI fishing benefits claimants received higher average weekly benefit rates in 2018. The average weekly benefit rate of regular benefits claimants in both groups of EI regular benefits claimants was lower than for fishing benefits claimants. Self-employed fishers claiming in both seasons had the highest average weekly benefit rate ($528) and received the highest amount of EI benefits on average (a total amount of $21,246 for both claims). Although the average EI fishing claimant uses fewer weeks of benefits per claim than the average regular EI claimant, they receive a higher average weekly benefit.
While the proportion of EI fishing benefits claimants at the maximum weekly benefit rate was higher than both groups of EI regular benefits claimants, all EI fishing claimants focus groups reported that the weekly benefit rate was too low to meet their off-season financial needs. All 12 focus groups with 50 participating recipients (self-employed fishers and regular benefits) reported that the benefit rate of 55% of weekly average insurable earnings was perceived as insufficient. Participants were not concerned if a potential increase in the weekly benefit rate was due to an increase in the share of average insurable earnings replaced (for example, increasing from 55% to 60% of average insurable earnings) or increasing the level of maximum insurable earnings.
In a few focus groups (both EI fishing and EI regular claimants), participants stated that the impact of the divisor was significant, and because it is subject to fluctuation, it made it difficult for them to understand the insurable earnings required to receive the maximum weekly benefit rate if they were claiming EI fishing benefits. There were a few EI fishing claimants who stated the divisor was not a concern because participants had little difficulty reaching the maximum threshold.
Incomes for EI fishing claimants have steadily risen over the evaluation period and are shown in Figure 11 and 12 below in real 2019 Canadian dollars. The average total income (T1) for an EI fishing claimant has risen from approximately $27,000 in 2001 to almost $80,000 in 2021. Gross fishing incomes have also seen an increase from just under $70,000 to just over $105,000 in 2021. The amount of EI benefits receivedFootnote 23 in a year has seen a smaller increase from approximately $10,000 in 2001 to approximately $18,600 in 2021.

Text description of figure 11
| Year | Gross fishing | Net fishing | EI benefits | Total income |
|---|---|---|---|---|
| 2000 | 52270 | 19893 | 8471 | 23256 |
| 2001 | 49353 | 18613 | 8698 | 22985 |
| 2002 | 45644 | 18554 | 9563 | 24278 |
| 2003 | 34477 | 14205 | 7042 | 18702 |
| 2004 | 38337 | 15157 | 8699 | 22193 |
| 2005 | 39796 | 15716 | 8236 | 22927 |
| 2006 | 41655 | 16668 | 8925 | 25191 |
| 2007 | 39644 | 15544 | 9118 | 24843 |
| 2008 | 37235 | 14916 | 9347 | 24642 |
| 2009 | 42493 | 17170 | 9122 | 26804 |
| 2010 | 43079 | 19595 | 9704 | 29707 |
| 2011 | 42007 | 18798 | 10344 | 30137 |
| 2012 | 42829 | 19165 | 10203 | 30451 |
| 2013 | 51253 | 25078 | 10271 | 35457 |
| 2014 | 53324 | 27530 | 10860 | 38022 |
| 2015 | 59136 | 31219 | 10974 | 41240 |
| 2016 | 55829 | 28630 | 11481 | 42180 |
| 2017 | 55799 | 28410 | 11989 | 43680 |
| 2018 | 55430 | 28460 | 12368 | 44369 |
| 2019 | 50975 | 23514 | 13273 | 46427 |
| 2020 | 68769 | 37466 | 13898 | 59140 |
| 2021 | 52270 | 19893 | 8471 | 23256 |
- Source: EI administrative data

Text description of figure 12
| Year | Gross fishing | Net fishing | EI benefits | Total income |
|---|---|---|---|---|
| 2000 | 88443 | 29433 | 12879 | 33358 |
| 2001 | 83865 | 29752 | 13525 | 34688 |
| 2002 | 81574 | 29236 | 16285 | 37768 |
| 2003 | 66883 | 23385 | 10514 | 28254 |
| 2004 | 78989 | 25809 | 12670 | 33319 |
| 2005 | 76430 | 23301 | 12431 | 32223 |
| 2006 | 79927 | 26593 | 13067 | 35681 |
| 2007 | 75759 | 23734 | 13688 | 35089 |
| 2008 | 66720 | 18929 | 13807 | 31778 |
| 2009 | 68160 | 21239 | 13619 | 33567 |
| 2010 | 80052 | 28869 | 14588 | 41121 |
| 2011 | 81850 | 30055 | 15165 | 42916 |
| 2012 | 77166 | 28629 | 15712 | 42650 |
| 2013 | 91257 | 37813 | 16026 | 51148 |
| 2014 | 103549 | 48431 | 16672 | 60871 |
| 2015 | 106563 | 49600 | 16897 | 62516 |
| 2016 | 116908 | 55458 | 17801 | 71660 |
| 2017 | 103185 | 45823 | 18704 | 66559 |
| 2018 | 111102 | 49171 | 19211 | 70766 |
| 2019 | 78987 | 31646 | 19482 | 59729 |
| 2020 | 124431 | 63430 | 21024 | 89988 |
| 2021 | 88443 | 29433 | 12879 | 33358 |
- Source: EI administrative data
4.6 Working while on claim
Key finding: EI Fishing claimants rarely worked while on claim during the off-season. Focus group participants explained that jobs were difficult to find in the off-season due to the rural and remote nature of fishing communities. In 2018, about 21% of summer claimants, 19% of winter claimants, and 35% of both season claimants saw their weekly benefit rate reduced.
While on claim, EI fishing claimants may continue to work either in fishing related activities or in off-season regular employment. For EI fishing claimants, their benefits were typically not affected as income earned while on claim was typically below the 90% threshold. Table 4 (below) provides the statistics on all EI fishing claims and the share of those which had their weekly benefits reduced for the 2018 fishing year.Footnote 24 Among fishing claims, those which were established by claimants who claimed in both seasons (35.2%) were more likely to experience reductions in claims, compared with claims from claimants who established only 1 summer (20.7%) or 1 winter (19.2%) fishing claim. However, in total, the amount of benefits reduced for claims established in both seasons represented 3.7% of the total fishing benefits they would have received otherwise.
| Claim Population | Summer Only | Winter Only | Both Seasons |
|---|---|---|---|
| Share of fishing claims receiving reduced benefit rate | 20.7% | 19.2% | 35.2% |
| Claims with reduced benefits: average % reduction in total benefit amount | 5.5% | 6.9% | 3.7% |
| Claims with reduced benefits: average dollar amount reduction by week | $27.2 | $35.1 | $20.1 |
- Source: EI administrative data
In most focus groups of self-employed fishers, there were mentions of a scarcity of employment in some regions. Others also mentioned the only jobs available were low paying or minimum wage jobs, so most self-employed fishers stated they were even less motivated to work when their hourly take-home wage would have been half of minimum wage after their EI benefits were reduced by 50 cents for every dollar of earned income.
4.7 Temporary measures
Key finding: Temporary COVID-19 measures had limited influence on off-season employment. In some focus groups with fishing claimants, participants noted that seasons were sometimes delayed or prices dropped; however, they indicated that their annual income during the COVID-19 pandemic was not drastically impacted.
During the evaluation period, 2 temporary measures were introduced that affected EI fishing benefits either directly or indirectly.
Commodity prices downturn
In the wake of the commodity (Oil and Gas) prices downturn, the Government of Canada announced special measures in Budget 2016. The temporary measures targeted 15 EI economic regions that exhibited a sharp and sustained increase in the unemployment rate without showing significant signs of a recovery, including regions with significant EI fishing claims. The temporary measures included an additional 5 weeks of entitlement for all EI regular claimants for a total entitlement of up to 50 weeks for claims established between January 4, 2015 and July 8, 2017.
To examine the effects of the commodity downturn measures, the number of EI regular claimants who were previously self-employed fishers who established EI fishing claims located in affected regions were compared with those in unaffected regions. Figure 12 shows that while temporary measures were in effect, the net number of fishing-to-regular claimants continued to decrease with more claimants instead becoming regular-to-fishing claimants in both commodity regions and other regions. In commodity regions, 959 claimants established EI regular benefits claims after previously claiming EI fishing benefits while 1,494 claimants established claims for EI fishing benefits after previously claiming EI regular benefits. This results in the net change of -1.7% relative to the 30,782 EI fishing benefits claims that were established in the same regions during this period.

Text description of figure 13
| Year | Commodity regions | Other regions |
|---|---|---|
| 2011 | 0.1 | -1.3 |
| 2012 | 0.1 | -1.3 |
| 2013 | 0.6 | -1.6 |
| 2014 | -1.0 | -2.2 |
| 2015 | -1.3 | -2.8 |
| 2016 | -2.1 | -3.4 |
| 2017 | -2.9 | -3.5 |
| 2018 | -3.7 | -3.1 |
| 2019 | -3.5 | -2.5 |
- Source: EI administrative data
In context, from 2005-2022 there were 24,814 cases where claimants established EI regular benefit claims and then within a 5-year period established EI fishing benefit claims. Of those who established fishing benefit claims after regular benefit claims, 9,992 (40.3%) of these claimants eventually returned to establish EI regular benefit claims within 5 years. For fishing-to-regular benefit claims, there were 18,752 cases recorded with 6,187 (33.0%) returning to establish an EI fishing benefit claim within 5 years after collecting regular benefits. Therefore, the number of EI claimants who claim either EI regular or EI fishing benefits and then later claim the opposite benefit type represent a small population relative to the number of EI fishing claimants who access benefits annually.
COVID-19 pandemic
The temporary measuresFootnote 25 introduced during the COVID-19 pandemic did not appear to have any influence on off-season employment, as focus group participants did not indicate that they were significantly impacted during COVID in their specific situations. In some focus groups with fishing claimants, they noted that seasons were sometimes delayed or the value of the catch declined in some communities; however, their annual incomes during the COVID-19 pandemic were not drastically impacted. Some participants stated they remember receiving benefits quicker during the COVID-19 pandemic than for previous claims and that the time to process an application significantly improved and this has continued after the end of the temporary measures.
The minimum regional unemployment rate of 13.1% was applied to all EI economic regions between September 27, 2020 and September 25, 2021, which led to all fishers requiring a minimum of $2,500 in insurable earnings rather than an amount ranging between $2,500 to $4,200. Less than 1% of fishing claims established during the temporary measures qualified for fishing benefits due to the temporary $2,500 common entrance requirement, whereas around 2% of fishing claims qualified based on their insurable earnings used to establish 1 of their previous 2 claims of the same type, a temporary measure which allowed self-employed fishers to use earnings from a previous claim of the same type within the past 2 years to qualify for a new EI fishing benefits claim.
During the same period the minimum regional rate of unemployment was set at 13.1%, a divisor of 14 was uniformly used to calculate the weekly benefit rate of all EI fishing benefits claims, with a minimum weekly benefit rate of $500. Among fishing claims established when this first set of EI temporary measures was in effect, 6.9% of claims with a weekly benefit rate above $500 benefitted from a higher benefit rate (an additional $66 per week on average), whereas 8.6% of claims benefitted from the minimum $500 weekly benefit rate (an additional $231 per week on average). Moreover, 8.2% of fishing claims established between September 26, 2021 and November 20, 2021 benefitted from the minimum $300 weekly benefit rate.
5. Delivery of benefits
5.1 Application process
Key finding: Most focus groups of self-employed fishers noted that delivery of benefits was not an issue, and the process was straightforward and efficient. Some key informants and focus group participants noted that delivery issues stemmed from confusion and a lack of clear information when contacting Service Canada.
When asked about their views on the delivery of EI fishing benefits, most groups of self-employed fishers expressed satisfaction with the delivery of benefits. In terms of creating and filing ROEs, few employers reported having issues and felt that the process worked very well, although it can be time consuming for large employers to create hundreds of ROEs.
Challenges in service delivery were identified by a few groups of EI fishing claimants when they required assistance from Service Canada during the application process. A few focus groups of EI fishing claimants mentioned that often they had to call several times or speak to several people who were knowledgeable enough to be able to provide correct information about their claim. For example, a few participants summarized this by saying that they had to spend hours on the phone with a Service Canada officer and often had to provide more details about their catch without obtaining accurate information on their claim.
In most of the focus groups with employers, participants also mentioned that they were aware that self-employed fishers had concerns with obtaining timely and accurate information when calling Service Canada for assistance. This finding was shared by a few key informant interviewees (4 of 22) who described that many times self-employed fishers had called to ask about fishing benefit applications but received advice related to EI regular benefits instead. Service Canada key informants shared their perspective on service delivery, suggesting that discrepancies between Service Canada officers and the variability and correct information was frustrating for system users.
5.2 Timeliness and delivery
Most focus group participants who were self-employed fishers and fishing industry employees noted that they had few concerns with the delivery and service of fishing or regular benefits both from improvements in service and their previous experience applying for EI benefits claims. Some focus group participants spoke about how the service and delivery have improved over the past few years,Footnote 26 with timelier payment of benefits and fewer issues, especially during the COVID-19 pandemic. External and internal key informant respondents (9 of 22) who provided feedback on the electronic filing option, all reported that it has significantly improved processing including reducing instances of missing ROEs, transcription errors, and delays in the delivery of benefits.
Processing of EI fishing benefits aligns with the timelines expected for all EI benefits claims, as most respondents indicated that the processing of fishing claims was typically straightforward and efficient, provided that all necessary documentation was accurate and complete. Some noted that the streamlined processes and automation contributed to quick approvals, especially when there were no contentious issues. However, some respondents highlighted recent delays, particularly when manual intervention was required by officers due to missing ROEs. Key informant interviews with Service Canada officers (9 of 22) shared a consensus view by noting that they met their service standards because fishing benefit claims were quicker to process given that there was just 1 self-employed fisher ROE and it was straightforward.
5.3 Accuracy and investigations
The Quality Services Division of Service Canada produces the quarterly Processing Excellence, Accuracy and Quality (PEAQ) report which prepares a summary of EI claims processing accuracy. For EI fishing claims in the 2022-2023 fiscal year,Footnote 27 61 reviews were completed of EI fishing claims. There were 19 claims with issues identified with fact-findingFootnote 28 being incomplete as the most common error reported.
In addition to service quality, the Integrity Services Branch of Service Canada investigated on average 392 fishing claims per fiscal year (2013-2022) which represents approximately 0.16% of all EI claims investigated. The predominant investigation types were claimants possibly receiving Canada Pension Plan (CPP) payments while also receiving EI fishing benefits, followed by investigations of a discrepancy between reported and computer recorded earnings. Fishing claim investigations reported an average annual savings of $321,640 for the EI program which represented an average of 0.1% of all EI savings annually.
5.4 ROEs, designated employers, and filing
In most focus groups with employers, concerns with their obligations as the designated employer was expressed. Participants said that because the buyer completes and files the ROEs, they were seen as the designated employer for self-employed fishers; however, they did not consider their business to be the employer because they did not have authority in hiring the crew members on each vessel, in establishing sharing agreements for income allocation, or other aspects of their employment. They were also concerned that if a crew member was found not to have worked on a vessel as reported, it could negatively impact their business, since they relied solely on the captain’s documentation such as crew, crew share agreements, fishing days, to complete information for the ROEs.
In addition, employers were also concerned that because they were the deemed employer, that they had to pay the EI-portion of the employer contributions, which they also did not believe was fair. For example, it was explained, that 1 difficulty was from an operational perspective, as they have no authority to verify whether all the information received on the participation of crew members and their sharing agreement were accurate.
One participant from an employer focus group said that the buyer should not be responsible for paying the employer portion of EI because the buyer was not technically the employer.
Issuance of ROEs
Employer and self-employed fisher focus group participants used a mix of electronic and paper ROEs, with paper almost exclusively used for older workersFootnote 29 who either preferred paper or did not have access or the technical proficiency to use electronic methods according to participants who were employers. All 6 focus groups with 22 participating employers reported few issues or complications with issuing ROEs for self-employed fishers and said the process was straightforward. Employers noted that receiving necessary information from the captain or adjusting fishing dates and crew-sharing arrangements was typically not problematic.
Administrative data shows that self-employed fishers who had paid EI premiums and had an ROE issued ranged between 92.2% in 2001 and 85.5% in 2014. Since 2014, the ratio of self-employed fishers who received an ROE has steadily increased to 90.6% in 2021 as shown in Figure 13.

Text description of figure 14
| Year | Percentage of fishers with an ROE |
|---|---|
| 2001 | 89.2% |
| 2002 | 89.9% |
| 2003 | 89.0% |
| 2004 | 89.0% |
| 2005 | 89.3% |
| 2006 | 88.8% |
| 2007 | 88.5% |
| 2008 | 87.5% |
| 2009 | 87.9% |
| 2010 | 88.1% |
| 2011 | 88.5% |
| 2012 | 87.8% |
| 2013 | 87.8% |
| 2014 | 85.5% |
| 2015 | 87.4% |
| 2016 | 87.5% |
| 2017 | 87.8% |
| 2018 | 88.6% |
| 2019 | 89.8% |
| 2020 | 89.7% |
| 2021 | 90.6% |
- Source: EI administrative data
6. Conclusion
EI fishing benefits have been perceived as effective by self-employed fishers in addressing their needs by providing sufficient weeks of entitlement to provide support during the fishing off-seasons. EI fishing benefits were reported to be accessible in relation to the qualifying earnings thresholds, including during economic crises such as the commodity price downturn and the COVID-19 pandemic with eligibility averaging 80.7% over the study period.
Many employer and key informants fishing associations members reported that fishing benefits were crucial to:
- retaining fishers
- reducing turnover, and
- preventing attrition in the fishing industry
Usage of EI fishing benefits has declined over the reference period, with participation dropping from a peak of almost 28,000 unique claimants in 2003 to 21,117 in 2021. The total amount of benefits paid to EI fishing claims has similarly fallen from a peak of $382.6 million in 2003 to $354.5 million in 2021.Footnote 30 Most claimants received both summer and winter benefits, with over 17,000 claimants participating in both seasons in 2021.
The profile of EI fishing claimants indicates they were predominantly:
- male
- older
- residing in the Atlantic provinces, and
- married
They tended to have a higher total annual income compared to EI regular claimants from fishing-related occupations or seasonal primary industries. Most claimants who took part in focus groups generally held positive views of the benefits, indicating that it strengthened their attachment to the fishing industry, and they expressed that the eligibility requirements were not burdensome or difficult to meet.
Focus groups feedback indicates that some claimants experienced challenges when contacting Service Canada for assistance in establishing their claims. In addition, common barriers were identified by some key informants. These included instances where fishers received inconsistent or unclear information when seeking clarification on eligibility, as well as general confusion about the program, and uncertainty around the distinction between self-employed and employed status.
The share of EI fishing claimants reaching the maximum weekly benefit rate fluctuated over the evaluation period, ranging between:
- 60% in 2009
- 75% in 2021, and
- with an average of 73% between 2017 to 2019
Despite most EI fishing claimants receiving the maximum weekly benefit rate, many focus group participants expressed that the benefit rate of 55% of weekly insurable earnings was insufficient. Many claimants believe that the weekly benefit rate did not adequately cover their financial needs during the offseason and report limited offseason employment opportunities in rural areas, with available jobs often being low wage.
Overall, the administration of EI fishing benefits was perceived positively by both employers and employees who participated in focus groups. However, some employers expressed concerns regarding their legal liability associated with issuing ROEs and their role as the designated employer for fishing claimants.
Participants in focus groups indicated that they did not feel it was accurate to consider their business as the employer for the purposes of a fisher’s ROE since they have limited control over:
- the hiring of crew members of each vessel
- the establishment of sharing agreements for income allocation, and
- other employment-related decisions
In conclusion, EI fishing benefits were effective in meeting the needs of self-employed fishers. EI fishing benefits had significant participation and usage by self-employed fishers. Claimants reported satisfaction with their entitlements but expressed concerns regarding the maximum weekly benefit rate and service-related issues when contacting Service Canada.
While benefit delivery received positive feedback from both recipients (self-employed fishers and employed fishers) and employers, there is room for improvement in client support for EI fishing claimants. Overall, EI fishing benefits have played a significant role:
- in maintaining job stability, and
- economic resilience within the fishing industry
Appendix A – Evaluation matrix
Eligibility and Accessibility:
- Evaluation question 1. To what extent do the eligibility criteria (including the share of catch value) make the fishing benefits accessible?
- How have fishing moratoriums, number of days fishing, catch value fluctuation, and fisher's share affected eligibility?
- How have contributions (in other words, premiums paid) from fishers and fishing benefits received fluctuated since 2000 compared to comparable workers?
Lines of evidence
- Literature review
- Technical studies
- Focus groups
- Key informant interviews
Participation and usage:
- Evaluation question 2. What is the socio-economic profile (for example, marital status, education, and income) of self-employed fishers compared to comparable claimants? How has it changed since 2000?
- Evaluation question 3. What is the usage pattern (for example, frequency, duration) of self-employed fishers compared to comparable claimants?
- What are the impacts of the fishing benefit rules—such as the calculation of the benefit rate, the divisor, the waiting period, the working while on claim rule, the maximum duration, and the clawback rule—on fishing claimants?
- How have contributions (in other words, premiums paid) from fishers and fishing benefits received fluctuated since 2000 compared to comparable workers?
- Evaluation question 4. To what extent did fishing claimants also establish claims for EI regular benefits and special benefits since 2000?
- To what extent have changes to the EI regular benefits impacted fishing claims, including the changes related to temporary measures, commodity price downturn measures, and the variation of the unemployment rates?
- Evaluation question 5. What are the effects of the fishing benefits on off-season work compared to the effects of regular benefits for comparable claimants?
- What were the effects of the temporary measures on off-season work?
Lines of evidence
- Technical studies
- Focus groups
- Key informant interviews
Delivery:
- Evaluation question 6. What works well and what improvements could be made to the delivery of fishing benefits?
- How does the delivery and service quality of fishing benefits (for example, delivery satisfaction, requirements reporting - ROE, payment and process accuracy, administrative reviews) compare to regular benefits?
Lines of evidence
- Literature review
- Focus groups
- Key informant interviews
Appendix B – Lines of evidence
This evaluation incorporated a mixed-methods approach using both quantitative and qualitative lines of evidence. While it primarily relied on administrative data, the evaluation also consisted of a literature review, focus groups, and key informant interviews.
Literature review
The literature review assessed EI fishing benefits and various international fishing industry support and subsidy schemes to identify if they have been effective at preventing layoffs and stabilizing employment during off-seasons and times of economic downturns. More broadly, the literature review helped contextualize the history and effect of EI fishing benefits within Canada and internationally in terms of its participation, usage, effect, design, and delivery of the benefit. Industry reports and surveys were included to provide more context on the fishing industry and the self-employed fisher population. The studies discussed in this literature review have been primarily collected using the EBSCO and Google Scholar search engines.
Focus groups
The focus groups sought information directly from employers (registered buyers), self-employed fishers, and employed fishers and fishing industry workers who established a claim for EI fishing or EI regular benefits with employment in the fishing industry, relatively recently, anytime between 2018 and 2021.
ESDC identified 6 provinces with high numbers of individuals working in the fishing industry:
- British Columbia
- New Brunswick
- Nova Scotia
- Newfoundland & Labrador
- Prince Edward Island
- Quebec
Within each of those 6 provinces, the contracted consultant Prairie Research Associates (PRA) conducted 3 focus groups. The 3 focus groups included:
- those who received regular benefits and worked in the fishing industry
- those who received fishing benefits, and
- employers of those working in the fishing industry
Employer recruiting
- To recruit employers, ESDC initially attempted to identify an email address for employers provided by Statistics Canada and then sent an invitation email to that address.
- For those that ESDC could not identify an email address, PRA phoned employers to invite them to participate in the focus groups and PRA sent employers who were interested an email to participate in their province-specific group.
Recipient recruiting
- ESDC provided a list to PRA of potential participants with approximately 300 per group.
- For those with an email address, PRA sent participants an invitation email to recruit participants for each group.
In total, 72 people participated across the 18 groups.
The focus groups included questions related to, but not limited to:
- eligibility criteria accessibility – in other words, are the eligibility criteria acceptable or challenging for EI fishing claimants to meet
- whether the weekly benefit rate calculation was fair and the amounts calculated sufficient to meet financial needs
- the effect of EI fishing benefits on local communities and employment in the fishing industry
- the effect of temporary measures – for example, commodity prices downturn, COVID-19
The focus groups were administered through a contracted consultant by ESDC with the final report submitted by PRA
Key informant interviews
The KIIs were built upon the focus groups and quantitative analysis to provide context and a deeper understanding of the EI fishing benefit. 4 groups of key informants that could provide insight into EI fishing benefits were selected to be interviewed. These groups included:
- employer and employee associations and unions that represent employers and employees that may have participated in EI fishing benefits
- program internal officials and policy experts whose work involve EI fishing benefits and the fishing industry
Internal officials and experts came from departments and agencies including:
- Service Canada
- Canada Revenue Agency
- ESDC, and
- DFO
In total, 22 key informant interviewees were interviewed:
- 2 employers
- 1 union
- 17 internal officials, and
- 2 experts
The interviewed employers were selected from the employers who were referred to by program officials and policy experts with experience interacting with employers in the fishing industry. These interviewees were chosen from diverse regions and industries. Notably, the majority were from the Atlantic provinces, reflecting the predominant area where fishing occurs.
Technical studies – administrative data analysis
Three technical studies using administrative data, from 2000 to 2022, provided quantitative evidence for 5 evaluation questions: Eligibility criteria; participation and usage; socio-economic profile; combination and alternating of EI benefits; and the effects of off-season work.
Data for these analyses was extracted from the EI Status Vector file, the ROE, and the Canada Revenue Agency tax files (T4/T1).
Technical Report #1: Eligibility
The report presented empirical evidence about eligibility and entrance requirements in terms of insurable earnings from fishing over time. The report provided empirical evidence related to, but not limited to:
- a socio-economic profile of self-employed fishers and their eligibility rates (age, gender, education, region/province, and income)
- compare eligibility rates of self-employed fishers with those from comparable groups on EI regular benefits, and
- the ratio of benefits paid to premiums of self-employed fishers and with those of comparable groups
Technical Report #2: Usage Pattern and Socio-Economic Profile of EI Fishing Claimants
The report presented empirical evidence about the participation, usage, and effects of fishing benefits. The primary group examined was EI fishing claimants who established a claim between 2000 and 2022.The report provided empirical evidence related to, but not limited to:
- a socio-economic profile of EI fishing claimants as compared to EI regular claimants in comparable industries (age, gender, region, education, income)
- examine the duration, exhaustion rate, weekly benefit rate, number of fishing claims per year, and
- estimate the impacts of fishing benefits rules such as the divisor, benefit rate calculation, waiting period, working while on claim, and temporary measures
Technical Report #3: Interaction Between Winter and Summer Fishing Benefits and other EI Benefits
The report presented empirical evidence about the combination of EI fishing and special benefits and the flow of claimants between EI fishing and EI regular benefits.
The report provided empirical evidence related to, but not limited to:
- examine the prevalence of claimants who claim both EI fishing and regular benefits throughout their career and the factors which may cause such changes, and
- The frequency of claimants combining EI fishing benefits with special benefits (sickness, maternity, parental, etc.).
Appendix C – Supplementary tables
| Claimant characteristics | 2010 | 2018 | 2021 |
|---|---|---|---|
| Gender (Share of Female) | 22.27 | 25.26 | 24.75 |
| Age group: 34 and under | 25.54 | 25.97 | 26.45 |
| Age group: 35 - 54 | 40.62 | 35.11 | 34.26 |
| Age group: 55 and older | 33.84 | 38.92 | 39.28 |
| Marital status: married/common Law | 59.08 | 51.34 | 71.4 |
| Marital status: single | 32.05 | 39.86 | 20.7 |
| Marital status: divorced/separated/other | 8.87 | 8.8 | 7.9 |
| Spouse fishing income | 59.96 | 65.52 | 64.56 |
| Spouse fishing claim | 24.78 | 20.73 | 20.81 |
| 0 children (0-18 years old) | 90.3 | 89.52 | - |
| 1 or more children (0-18 years old) | 9.7 | 10.48 | 0 |
| Urban | 42.38 | 39.13 | 37.59 |
| Education level: primary-elementary | 19.68 | 13.43 | 13.22 |
| Education level: secondary-high school | 66.17 | 64.77 | 66.12 |
| Education level: apprenticeship | 2.34 | 2.69 | 2.44 |
| Education level: college | 9.72 | 15.19 | 15.62 |
| Education level: university | 2.09 | 3.94 | 2.59 |
| Province: Newfoundland and Labrador | 34.42 | 34.44 | 37.97 |
| Province: Prince Edward Island | 7.36 | 8.82 | 6.99 |
| Province: Nova Scotia | 15.31 | 14.06 | 13.26 |
| Province: New Brunswick | 8.12 | 7.66 | 10.08 |
| Province: Quebec | 3.86 | 3.18 | 3.22 |
| Province: Ontario | 0.53 | 0.72 | 0.59 |
| Province: Manitoba | 3.39 | 2.82 | 3.45 |
| Province: Saskatchewan | 0.53 | 0.58 | 0.79 |
| Province: Alberta | 0.29 | 0.9 | 0.53 |
| Province: British Columbia | 25.77 | 26.11 | 22.25 |
| Other (Territories and Outside Canada) | 0.41 | 0.71 | 0.88 |
| Observations | 1,711 | 2,233 | 3,047 |
- Source: EI administrative data
| Claim characteristics | 2010 | 2018 | 2021 |
|---|---|---|---|
| Weeks of Entitlement | 26 | 26 | 52 |
| Average Insurable Catch per Year | $11,421 | $14,442 | $15,033 |
| Fishing Weeks Used per Claim | 21.08 | 22.18 | 22.22 |
| Weeks of Fishing Benefits Used | 81.08% | 85.31% | 85.46% |
| Average Fishing Weeks Used per Year | 21.263 | 22.517 | 22.5 |
| Average Weeks of Benefits (any EI benefit types) Used Per Claim | 22.66 | 23.93 | 23.699 |
| Average Weeks of Benefits (any EI benefit types) Used per Year | 22.847 | 24.288 | 24.005 |
| Entitlement Exhaustion | 45.30% | 51.05% | 51.76% |
| Benefit Period Exhaustion | 3.68% | 40.66% | 42.73% |
| Average Weekly Fishing Benefit Rate | $389.82 | $458.75 | $508.99 |
| Claims at Maximum Benefit Rate | 51.90% | 52.04% | 54.38% |
| Average Fishing Benefits Received per Claim | $8,197.64 | $10,156.45 | $11,254.79 |
| Average Benefits (any EI benefit types) Received per Claim | $8,848.58 | $10,991.26 | $12,023.07 |
| Average Fishing Benefits Received per Year | $8,265.60 | $10,295.46 | $11,417.61 |
| Observations | 1,711 | 2,233 | 3,047 |
- Source: EI administrative data
| Claimant characteristics | 2010 | 2018 | 2021 |
|---|---|---|---|
| Gender (Share of Female) | 19.19 | 23.71 | 26.48 |
| Age group: 34 and under | 27.57 | 35.26 | 35.71 |
| Age group: 35 - 54 | 50.68 | 39.02 | 33.52 |
| Age group: 55 and older | 21.76 | 25.72 | 30.78 |
| Marital status: married/common Law | 63.15 | 49.91 | 50.38 |
| Marital status: single | 28.41 | 42.38 | 41.78 |
| Marital status: divorced/separated/other | 8.44 | 7.71 | 7.83 |
| Spouse fishing income | 63.11 | 68.77 | 68.77 |
| Spouse fishing claim | 24.59 | 18.29 | 15.16 |
| 0 children (0-18 years old) | 89.73 | 88.98 | N/A |
| 1 or more children (0-18 years old) | 10.27 | 11.02 | N/A |
| Urban | 34.83 | 34.17 | 31.09 |
| Education level: primary-elementary | 14.94 | 10.51 | 9.36 |
| Education level: secondary-high school | 66 | 63.41 | 66.41 |
| Education level: apprenticeship | 2.28 | 3.62 | 2.86 |
| Education level: college | 14.08 | 18.93 | 17.51 |
| Education level: university | 2.7 | 3.53 | 3.85 |
| Province: Newfoundland and Labrador | 34.73 | 39.9 | 41.64 |
| Province: Prince Edward Island | 5.95 | 6.47 | 3.56 |
| Province: Nova Scotia | 21.89 | 22.22 | 21.19 |
| Province: New Brunswick | 11.89 | 10.76 | 11.69 |
| Province: Quebec | 2.43 | 2.8 | 1.1 |
| Province: Ontario | 0.68 | 0.26 | 0.09 |
| Province: Manitoba | 7.43 | 4.99 | 7.03 |
| Province: Saskatchewan | 2.16 | 2.36 | 2.19 |
| Province: Alberta | 0.54 | 0.26 | 0.46 |
| Province: British Columbia | 12.03 | 9.19 | 9.95 |
| Other (Territories and Outside Canada) | 0.27 | 0.79 | 1.1 |
| Observations | 740 | 1,143 | 1,095 |
- Source: EI administrative data
| Claim characteristics | 2010 | 2018 | 2021 |
|---|---|---|---|
| Weeks of Entitlement | 26 | 26 | 52 |
| Average Insurable Catch per Year | $11,222 | $14,231 | $14,545 |
| Fishing Weeks Used per Claim | 19.259 | 20.314 | 22.347 |
| Weeks of Fishing Benefits Used | 74.07% | 78.13% | 85.95% |
| Average Fishing Weeks Used per Year | 19.27 | 20.34 | 22.37 |
| Average Weeks of Benefits (any EI benefit types) Used Per Claim | 20.2473 | 21.64479 | 23.45205 |
| Average Weeks of Benefits (any EI benefit types) Used per Year | 20.26 | 21.67 | 23.48 |
| Entitlement Exhaustion | 23.65% | 27.21% | 48.68% |
| Benefit Period Exhaustion | 7.03% | 20.12% | 11.87% |
| Average Weekly Fishing Benefit Rate | $392.14 | $479.51 | $562.80 |
| Claims at Maximum Benefit Rate | 51.22% | 60.54% | 61.46% |
| Average Fishing Benefits Received per Claim | $7,618.50 | $9,766.34 | $12,595.41 |
| Average Benefits (any EI benefit types) Received per Claim | $7,983.72 | $10,416.90 | $13,221.28 |
| Average Fishing Benefits Received per Year | $7,620.09 | $9,779.37 | $12,611.05 |
| Observations | 740 | 1,143 | 1,095 |
- Source: EI administrative data
| Claimant characteristics | 2010 | 2018 | 2021 |
|---|---|---|---|
| Gender (Share of Female) | 17.43 | 19.7 | 20.85 |
| Age group: 34 and under | 18.13 | 19.24 | 16.21 |
| Age group: 35 - 54 | 42.68 | 37.08 | 34.08 |
| Age group: 55 and older | 39.19 | 43.68 | 49.71 |
| Marital status: married/common Law | 72.88 | 59.7 | 65.17 |
| Marital status: single | 17.22 | 30.41 | 24.76 |
| Marital status: divorced/separated/other | 9.9 | 9.89 | 10.07 |
| Spouse fishing income | 51.05 | 58.86 | 54.61 |
| Spouse fishing claim | 29.85 | 26.07 | 27.21 |
| 0 children (0-18 years old) | 91.77 | 91.66 | N/A |
| 1 or more children (0-18 years old) | 8.23 | 8.34 | N/A |
| Urban | 29.9 | 28.06 | 27.99 |
| Education level: primary-elementary | 19.53 | 17.32 | 13.14 |
| Education level: secondary-high school | 65.31 | 66.07 | 65.98 |
| Education level: apprenticeship | 1.46 | 1.78 | 2.58 |
| Education level: college | 12.39 | 12.69 | 15.46 |
| Education level: university | 1.31 | 2.14 | 2.84 |
| Province: Newfoundland and Labrador | 40.86 | 47.51 | 50.79 |
| Province: Prince Edward Island | 10.46 | 8.69 | 7.69 |
| Province: Nova Scotia | 20.08 | 20.28 | 18.25 |
| Province: New Brunswick | 8.23 | 12.63 | 11.7 |
| Province: Quebec | 5.86 | 4.4 | 4.58 |
| Province: Ontario | 0.56 | 0.23 | 0.13 |
| Province: Manitoba | 6.42 | 3.13 | 1.72 |
| Province: Saskatchewan | 0.28 | 0 | 0.32 |
| Province: Alberta | 0.17 | 0.12 | 0.06 |
| Province: British Columbia | 6.97 | 2.78 | 4.51 |
| Other (Territories and Outside Canada) | 0.14 | 0.23 | 0.25 |
| Observations | 717 | 863 | 1,573 |
- Source: EI administrative data
| Claim characteristics | 2010 | 2018 | 2021 |
|---|---|---|---|
| Weeks of Entitlement | 26 | 26 | 52 |
| Average Insurable Catch per Year | $12,123 | $15,993 | $15,978 |
| Fishing Weeks Used per Claim | 17.54 | 19.84 | 21.43 |
| Weeks of Fishing Benefits Used | 67.46% | 76.31% | 82.42% |
| Average Fishing Weeks Used per Year | 27.85 | 32.64 | 34.25 |
| Average Weeks of Benefits (any EI benefit types) Used Per Claim | 18.87 | 21.13 | 22.46 |
| Average Weeks of Benefits (any EI benefit types) Used per Year | 29.95 | 34.73 | 35.97 |
| Entitlement Exhaustion | 4.88% | 14.72% | 32.74% |
| Benefit Period Exhaustion | 6.42% | 10.31% | 8.20% |
| Average Weekly Fishing Benefit Rate | $386.96 | $498.69 | $563.38 |
| Claims at Maximum Benefit Rate | 48.54% | 64.19% | 68.84% |
| Average Fishing Benefits Received per Claim | $6,847.23 | $9,938.96 | $12,074.44 |
| Average Benefits (any EI benefit types) Received per Claim | $7,348.97 | $10,606.54 | $12,656.86 |
| Average Fishing Benefits Received per Year | $11,008.41 | $16,195.29 | $19,048.30 |
| Observations | 717 | 863 | 1,573 |
- Source: EI administrative data
Appendix D – COVID-19 temporary measures
In response to the COVID-19 pandemic, EI temporary measures were introduced to support self-employed fishers who rely on EI fishing benefits in the off-season for fishing claims established between September 27, 2020 and September 25, 2021 and between September 25, 2021 and September 24, 2022.
Temporary measures – 2020 to 2022
EI rules for claims established prior to September 27, 2020:
- between $2,500 and $4,200 insurable earnings threshold for self-employed fishers to qualify for fishing benefits depending on the regional unemployment rate
- $3,760 insurable earnings threshold for self-employed fishers to qualify for special benefits
- a 1-week waiting period must be served before a claimant can begin to receive EI benefits
- the benefit rate is calculated by using the earnings in the current qualifying period
- if a fisher qualifies for a regular benefits, the fisher must claim that benefit
EI rules for claims established between September 27, 2020 and September 25, 2021:
- $2,500 insurable earnings threshold for self-employed fishers to qualify for fishing or special benefits
- the claim could be based on their earnings in their current qualifying period, or the earnings used to establish a fishing claim of the same type (summer or winter) from 1 of the 2 previous years, whichever amount was the highest.
- the one-week waiting period was waived from January 31, 2021
- the benefit rate was calculated using either the earnings in the current qualifying period, or the earnings used to establish a fishing claim of the same type (summer or winter) from 1 of the 2 previous years, whichever was the highest
- the EI temporary measures also granted fishers the ability to claim fishing benefits even if they qualified for regular benefits
EI rules for claims established between September 26, 2021 and September 24, 2022:
- $2,500 insurable earnings threshold for fishers to qualify for fishing or special benefits.
- The claim could be based on their earnings in their current qualifying period, or the earnings used to establish a fishing claim of the same type (summer or winter) from 1 of the 2 previous years, whichever amount was the highestFootnote 31.
- a 1-week waiting period must be served before a claimant can begin to receive EI benefits
- the benefit rate was calculated using either the earnings in the current qualifying period, or the earnings used to establish a fishing claim of the same type (summer or winter) from 1 of the 2 previous years, whichever was the highestFootnote 32
- the EI temporary measures also granted fishers the ability to claim fishing benefits even if they qualified for regular benefits
EI rules for claims established after September 24, 2022:
- between $2,500 and $4,200 insurable earnings threshold for self-employed fishers to qualify for fishing benefits depending on the regional unemployment rate
- $3,760 insurable earnings threshold for self-employed fishers to qualify for special benefits
- a 1-week waiting period must be served before a claimant can begin to receive EI benefits
- the benefit rate is calculated by using the earnings in the current qualifying period
- if a fisher qualifies for regular benefits, the fisher must claim that benefit