
Horizontal Evaluation of the Youth Employment Strategy - Skills Link stream
On this page
Alternate formats

Large print, braille, MP3 (audio), e-text and DAISY formats are available on demand by ordering online or calling 1 800 O-Canada (1-800-622-6232). If you use a teletypewriter (TTY), call 1-800-926-9105.
Main findings and observations
Four main findings emerged from this evaluation:
- immediately after the completion of their respective intervention, more than 7-in-10 participants reported to be employed or to have returned to school, exceeding the projected program target of 60%. Notably, 85% of participants who took part in an Entrepreneurship intervention reported to be employed or to have returned to school
- overall, when comparing results for participants with the results of a comparison group, the magnitude of the incremental impacts of Skills Link interventions on participants' labour market attachment was limited. This points to inherent challenges associated with helping youth facing barriers to employment who may require a wider and more comprehensive range of interventions
- youth who received interventions in the form of work experiences had stronger labour market attachment, relative to youth who received interventions in the form of group-based workshops
- although the incremental impacts of interventions involving a workshop approach were generally negative, analysis at the sub-group level suggests that this type of intervention was relatively more effective for youth who had a lower level of education. In addition, impacts were relatively better for older youth (over the age of 19), particularly for interventions with a work experience component
From these main findings, the following observation can be drawn.
- Findings suggest that there are potential challenges associated with the group-based workshop approach when applied to a mixed group of youth facing various barriers to employment. This points to the benefits of better tailoring interventions in line with the needs of the different segments of participating youth
Introduction
This evaluation report presents key findings and observations regarding the Skills Link stream of the Youth Employment Strategy (hereafter referred to as the Strategy). This report was completed in compliance with the Financial Administration Act and the Policy on Results.
In addition to the Skills Link stream, the Strategy also consisted of two other separate streams: Career Focus and Summer Work Experience. Although all streams worked with youth aged 15 to 30, their respective objectives and segment of youth targeted were different resulting in the need to present findings in separate reports.
Employment and Social Development Canada (ESDC) is the lead department working in collaboration with ten other departments and agencies on this horizontal initiative.
From the program design and delivery perspective, every department is accountable for the management and implementation of their respective programs to achieve results. As the lead department, ESDC performed an oversight role, which included the coordination for an evaluation.
To that end, this report builds on the previous 2015 evaluation report. It provides an overview of the profile of participants and their immediate outcomes following participation, for all contributing departments and agencies for which the information was available. These results are then complemented by an incremental impact analysis for ESDC Skills Link participants, who received an intervention between January 2010 and December 2011.
Incremental impact analysis compares participants' labour market outcomes with those of a comparison group to learn about what would have happened in the absence of the program. For the first time, incremental impact analysis was conducted at the intervention level and, for the most prominent interventions, at the sub-group level. This type of analysis requires the linking of participants' administrative records to the Canada Revenue Agency and Employment Insurance databases and this could only be done for ESDC participants.
The cohort of January 2010 to December 2011 was selected to allow for the assessment of interventions' impacts on labour market attachment for a period of at least five years following their completion up to calendar year 2016 (most recent tax records released in 2018 at the time of the evaluation).
The specific methodology used to assess the ESDC Skills Link initiative performance is described in Annex A and in the technical report which is available upon request.
Given the similarities between the target population of the various initiatives under the Skills Link umbrella, participating organizations can draw from key findings and observations from this report to inform their own initiative; taking into account their respective policy, design and delivery features.
Program background
About Skills Link
Under Skills Link, youth aged 15 to 30 were provided with opportunities to gain employment experiences and to acquire knowledge/skills through a mix of interventions. In particular, Skills Link targeted youth who faced barriers.
- Barriers included, but were not limited to, challenges faced by recent immigrant youth, youth with disabilities, youth who have not completed high school, and Indigenous youth
Skills Link interventions included an income support component to ensure that the participants had the means to support themselves, while they were taking steps to become employed. Income support was provided when no other support such as social assistance was available. It took the form of an allowance equal to the provincial/territorial minimum wages, up to a maximum amount per participant.
The Skills Link stream involved two federal departments and one Crown Corporation, who each delivered different initiatives (see Table 1 for more detailed information):
- Employment and Social Development Canada (ESDC)
- Indigenous and Northern Affairs Canada (INAC)
- Canada Mortgage and Housing Corporation (CMHC)
For the period 2013 to 2018, about 72% of the Skills link funding envelope was allocated to ESDC, with the remaining 25% and 3% allocated to INAC and CMHC respectively.
| Department | intervention | Participants (#) | Percentage of total participants | Spending ($M) | Percentage of total spending |
|---|---|---|---|---|---|
| ESDC | Skills Link supports youth who face barriers to develop employability skills and gain valuable job experience. | 41,639 | 69% | 437.8 | 72% |
| INAC* | First Nations and Inuit Skills Link Program supports activities that assist youth in acquiring the essential skills that will help them gain employment, function well in the workplace, and learn about job and career options. | 17,003 | 28% | 151.3 | 25% |
| CMHC | Housing Internship Initiative for First Nations and Inuit Youth provides financial assistance to help First Nations and Inuit businesses and organizations create housing-related internships for youth. | 1,748 | 3% | 16.4 | 3% |
| Total | 60,390 | 100% | 605.5 | 100% | |
*For 2014 to 2015, INAC's spending reflects planned spending rather than actual spending.
Transitioning from the Youth Employment Strategy to the Youth Employment and Skills Strategy
As part of the modernization of the Youth Employment Strategy, all three streams –Summer Work Experience, Skills Link and Career Focus – underwent a re-design to respond to a range of labour market challenges faced by youth, particularly those facing barriers to employment, under a new Youth Employment and Skills Strategy (YESS) that came into effect in June 2019.
The new Strategy continues to be delivered by 11 departments and agencies across the Government of Canada. It aims to provide more flexible employment services tailored to each individual and enhanced supports for all young Canadians as well as to broaden eligibility and offer a wider range of programs to help young people gain the skills, abilities and experience they need to get good-quality jobs.
The transition from the Youth Employment Strategy to a modernized Youth Employment and Skills Strategy took place during the preparation of this evaluation report for Skills Link. Preliminary evidence for this and the other reports on the components of the Strategy were shared with the program area in order to support policy development as it became available. In addition, findings and observations from this report will serve policy development and inform the design and delivery of similar programs.
Changes in program design
Under the modernized strategy, the Skills Link stream no longer exists independently but has been merged with the Career Focus and Summer Work Experience streams in order to offer a more integrated and flexible set of program interventions that would be more responsive to the needs of individual youth. Some YESS federal partner departments will continue to deliver initiatives similar in design to those that were previously offered under Career Focus. Lastly, the Goal Getters program has also been added as an additional program area to help youth facing barriers to complete high school and transition to post-secondary education and/or employment.
Changes to the performance framework
In addition, the modernized strategy includes a new performance framework whereby all federal partners will track common, standardized outcomes that are indicative that youth is moving along a continuum towards employment. New outcomes include job-readiness and career advancement, which involve tracking if young Canadians are acquiring the skills employers are looking for through modernized YESS programming. The new performance framework also focuses on collecting more in-depth information about the types and combinations of interventions youth receive.The transition from the Youth Employment Strategy to a modernized Youth Employment and Skills Strategy took place during the preparation of this evaluation report for Summer Work Experience. Preliminary evidence for this and the other reports on the components of the Strategy were shared with the program area in order to support policy development as it became available.
Scope and evaluation questions
- Did Skills Link reach its eligible participants and what were the characteristics of the participants?
- To what extent did Skills Link participants improve their labour market participation (employed, unemployed, self-employed, returned to school)?
- What was the average cost per participant and what were the costs compared to the benefits of participating in Skills Link?
- What impacts did Skills Link interventions have on supporting participants to obtain employment, decrease reliance on income support programs such as EI or on social assistance?
- Did impacts vary by region, by target groups, by duration or type of intervention?
Data sources and timeframe
To report on recent trends in the number of participants as well as actual spending, we used information from the TBS Horizontal Initiatives Database as well as ESDC's Data Collection System and Common System for Grants and Contributions from 2013 to 2018 (including departmental annual Year-End reports when available). In addition, for the period of 2013 to 2018, information supplied by Indigenous and Northern Affairs Canada (INAC) was used.
Information on immediate outcomes or status within 12 weeks after participating in Skills Link was also drawn from these data sources. Similar information was not available for INAC.
For the purposes of conducting the incremental impact analysis for ESDC Skills Link participants, information from the Common System for Grants and Contributions for the period from January 2010 to December 2011 was used to establish a profile of participants.
This cohort of participants was used in order to properly evaluate the impact of the program on participants. These cohorts provided five years of labour market outcomes after participation to assess the effectiveness of an intervention. By using these cohorts, the evaluation can leverage the most recent tax records released in 2018 for the 2016 tax year.
Other data sources were used including the Employment Insurance Status Vector and Records of Employment. Where appropriate, lines of evidence were enriched with other external sources of data and relevant literature to provide context to the analysis.
Skills Link: Horizontal perspective
From 2013 to 2018, about 60,400 youth took part in Skills Link interventions, translating in an average cost of about $10,000 per participant.
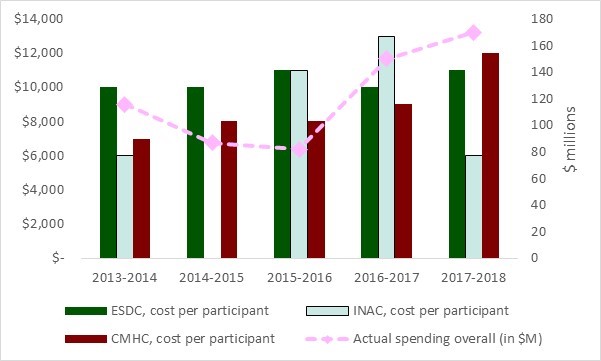
- Over the period of 2013 to 2018, the level of actual spending fluctuated and reached a low of about $82M in 2015 to 2016 and a high of about $170M in 2017-2018 (Figure 2 - right axis)
- Similarly, as shown in figure 1, the number of participants reached a low of about 7,600 in 2015 to 2016 and a high of about 19,000 in 2017 to 2018
- Over this period, the average cost per participants trended differently depending on the department (Figure 2 - left axis)
- For ESDC, the cost per participant remained steady at around $10,500
- For INAC, the cost per participant fluctuated and reached a high of about $13,400 in 2016 to 2017 and a low of about $6,200 in 2013 to 2014 and 2017 to 2018
- For CMHC, the cost per participant trended upward from about $7,100 in 2013 to 2014 to about $11,800 in 2017 to 2018
- Lastly, prior to 2016 to 2017, actual spending tended to be consistently lower than planned spending. This reflected, in part, the re-allocation of federal funding between Skills Link and Career Focus as well as other factors such as delays in launching the calls for proposals
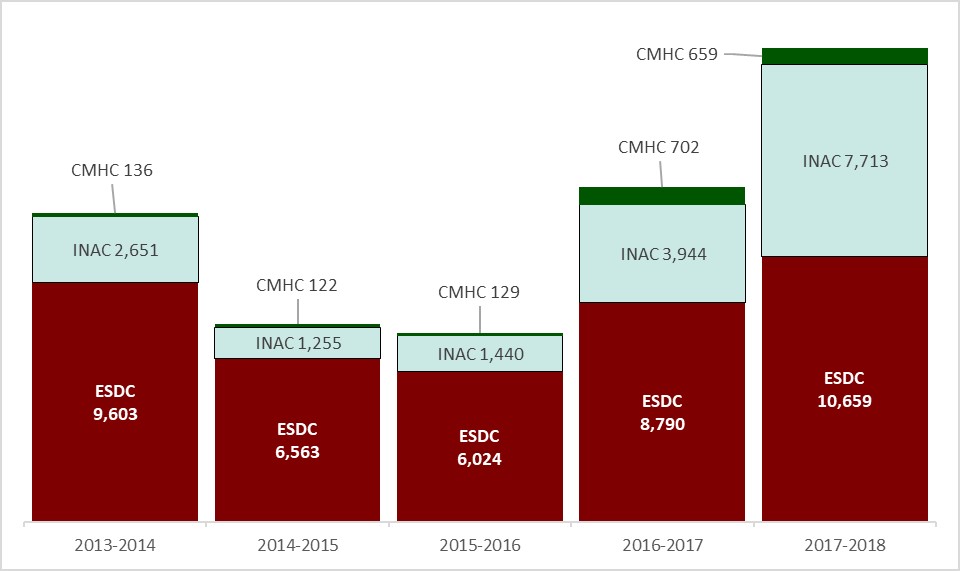
Text description of Figure 1
| Department | 2013 to 2014 | 2014 to 2015 | 2015 to 2016 | 2016 to 2017 | 2017 to 2018 |
|---|---|---|---|---|---|
| ESDC | 9603 | 6563 | 6024 | 8790 | 10659 |
| INAC | 2651 | 1255 | 1440 | 3944 | 7713 |
| CMHC | 136 | 122 | 129 | 702 | 659 |
| Total | 12390 | 7940 | 7593 | 13436 | 19031 |
Text description of Figure 2 MISSING
[MISSING DESCRIPTION MISSING]
- Sources: Horizontal Initiative Database and ESDC Data Collection System. As of 2015 to 2016, information regarding the First Nations and Inuit Skills Link Program was supplied directly by INAC. For 2014 to 2015, INAC's spending reflects planned spending rather than actual.
Indigenous and Northern Affairs Canada Intervention: First Nations and Inuit Skills Link Program
The First Nations and Inuit Skills Link Program supported activities that assist youth in acquiring the essential skills that will help them gain employment, function well in the workplace, and learn about job and career options. The program consisted of four specific initiatives:
- Mentored Work Placements
- Co-operative Education Placements and Internships;
- Career Promotion and Awareness
- Science and technology activities (for example, National Science Camp)
The following key activities underpinned these initiatives:
- wage subsidies for work placements and mentorship for youth who are not in school to enable them to develop employability skills and support their educational and career development
- activities designed to support First Nations and Inuit youth entrepreneurs gain self-employment
- training experiences that support youth in acquiring skills needed for work placements
- career development information, including awareness and support activities like career fairs and leadership projects
- career planning and counselling activities
- activities that promote science and technology as an educational or career choice, including science camps, computer clubs, and activities that connect science and technology to traditional Indigenous knowledge
First Nations Robotics Project – A practical example
The project was delivered by the First Peoples Development Inc. and Cogmation Robotics. It focused on providing First Nations with training and mentored work experience in Robotics and workshop facilitation and instruction.
Under this project, six (6) First Nations youth developed the qualifications to become Certified First Nations Robotics instructors. During the four-week training period, the participants were mentored by experienced Robotics instructors to provide Robotics workshops to 120 youth across then First Nations communities in Manitoba.
Through this project, the six trainees and the 120 workshop participants, gained career awareness and hands-on experience in the field of Information and Communication Technology (ICT). Indigenous youth were oriented in the world of Robotics and ICT opportunities, and be able to promote their own capabilities and interest in further education and careers in the emerging field.
Canada Mortgage and Housing Corporation Intervention: Housing Internship Initiative for First Nations and Inuit Youth
The Housing Internship Initiative for First Nations and Inuit Youth provided wage subsidies to Indigenous organizations such as First Nations Councils, Tribal Councils, self-government entities and Indigenous businesses to provide on-the-job training in the housing sector to youth between the ages of 15 and 30.
- Internship opportunities included administration or office positions, maintenance, construction, renovation, or client counseling, for a minimum of 8 weeks up to a maximum of 2 years – subject to funding.
- Through this internship, CMHC supported the development of skills and employment opportunities to help transition First Nation and Inuit youth from school to employment.
Between 2013 and 2018, an average of about 350 interns per year were provided with work experiences. Among participants, most interns were men and most were 20 years and older (see Figure 3). In addition:
- About 4 in 10 completed their secondary education prior to the internship; and
- About 1 in 8 (13%) were employed or self-employed 12 weeks following their internship, with about 4% who returned to school (see Figure 4).
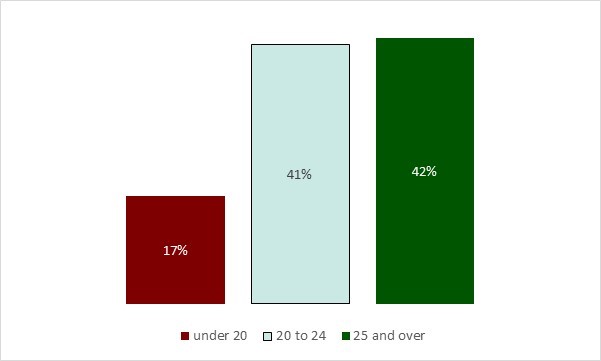
Text description of Figure 3
| Age group | Average share (in %) |
|---|---|
| Under 20 years old | 17% |
| 20 to 24 years old | 41% |
| 25 years old or older | 42% |
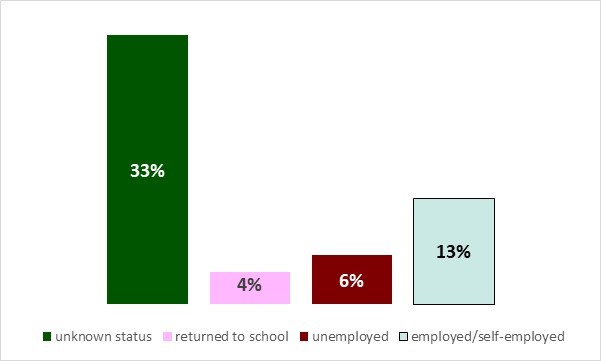
Text description of Figure 4
| Status | Average share (in %) |
|---|---|
| Unknown status | 33% |
| Returned to school | 4% |
| Unemployed | 6% |
| Employed/self-employed | 13% |
- Source: ESDC Data Collection System.
- Note: Percentages do not add up to 100% due to non-responses (43% not specified)
ESDC's Skills Link eligibility requirements
Skills Link interventions were delivered by regional and local organizations responding to calls for proposals. Following an assessment process, funding in the form of contributions was provided directly to employers, organizations or community coordinators.
- A community coordinator is a contribution recipient that received funding to enter into its own agreement with eligible participants and employers to undertake activities that further the objectives of Skills Link
For the ease of reporting, organizations in receipt of funding from ESDC will be referred to as ESDC service providers from hereon and throughout the report.
Eligible participants
To participate, youth had to be:
- eligible youth between 15 and 30 years of age (inclusive) at the time of intake/selection
- a Canadian citizen, permanent resident, or person on whom refugee status had been conferred
- legally entitled to work according to the relevant provincial/territorial legislation and regulations
- not in receipt of Employment Insurance (EI) benefits
- in need of assistance to overcome employment barriers
Eligible organizations
Organizations eligible to receive funding from ESDC included:
- not-for-profit organizations
- municipal governments
- Indigenous organizations (including band councils, tribal councils and self-government entities)
- for-profit organizations
- provincial and territorial governments, institutions, agencies and Crown Corporations
Funding decisions were based on program priorities, labour market needs, program terms and conditions, and available funding. To be eligible for Skills Link funding, proposed projects had to involve a minimum of eight youth participants. Exceptions were made for rural and remote regions.
Skills Link: ESDC perspective
From January 2010 to December 2011, 86% of participants took part in Group-Based Employment Skills or Employability Skills through Work Experience interventions.
- ESDC Skills Link interventions were compiled into five types available to participants. During the reference period, most participants took part in only one intervention. For those who took part in multiple interventions, they were assigned to the longest intervention received
| Intervention name | Intervention description | Number of participants (Jan. 2010 to Dec. 2011) |
Percentage of total participants |
|---|---|---|---|
| Group-Based Employment Skills - GBES | Youth participated in short-term workshops to learn or to enhance skills that are transferable to the workplace such as leadership, teamwork and communication skills. •Maximum duration of 24 weeks (30 hours a week or more); and •Maximum cost per participant of $12,000. |
16,180 | 56% |
| Employability Skills through Work Experience - ESWE | Employability skills workshops were blended with periods where participants worked directly with employers. •Maximum duration of 52 weeks; and •Maximum cost per participant of $25,000. |
8,832 | 30% |
| Work Experience - WE | Youth are provided with opportunities to work with employers. Work experiences can also be supported by coaching or on-the-job training. •Maximum duration of 52 weeks; and •Maximum cost per participant of $25,000. |
2,245 | 8% |
| Individual Skills Enhancement - ISE | Youth participated to short-term courses. •Maximum duration of 12 weeks. •Maximum cost per participant of $10,000. |
1,425 | 5% |
| Employability Skills through Entrepreneurship - ESE | ESE provided entrepreneurial skills to support individuals to establish a new enterprise, rather than assume ownership and/or operation of an existing business. •Maximum duration of 52 weeks; and •Maximum cost per participant of $25,000. |
310 | 1% |
| Total | 28,992 | 100% |
- Source: ESDC (2019). Internal Technical Report.
Profiles of selected cohorts
Between January 2010 and December 2011, about 29,000 youth took part in an ESDC Skills Link intervention ranging from 12 to 17 weeks in duration. Among participants:
- Close to 3 out of 5 were men (59%)
- Most were between the age of 20 and 24 (44%)
Relative to the Canadian youth population at-large, a higher proportion of participants self-identified as an Indigenous, while the proportion for those who self-identified as a person with disabilities was comparable.
- 20% of participants self-identified as Indigenous relative to about 6% for the Canadian youth at large (Census 2016 and National Household Survey, 2011)
- 11% of participants self-identified as a person with disability relative to about 13% for the Canadian youth at large (Statistics Canada, 2019). Results from the 2017 Canadian Survey on Disability are used rather than those from the 2012 Survey, since they include persons with cognitive and mental health related disabilities (Statistics Canada, 2018)
Lastly, close to 6 out of 10 participants had not completed high school (55%) and 25% received some social assistance benefits in the year prior to their participation.
| gender | Percentage of participants |
|---|---|
| male | 59% |
| female | 41% |
| Age | Percentage of participants |
| 15 to 19 | 34% |
| 20 to 24 | 43% |
| 25 to 30 | 22% |
| Auto-identification | Percentage of participants |
| Visible minority | 19% |
| Indigenous | 20% |
| Persons with disability | 11% |
| Location | Percentage of participants |
| Urban | 85% |
| Education | Percentage of participants |
| Did not complete high school | 55% |
| Social assistance | Percentage of participants |
| Receipt of SA (prior year) | 25% |
- Source: Common System for Grants and Contributions.
- Note : Participants may belong to more than one sub-group.
ESDC participants across Canada
Geographically, the distribution of participants by province is roughly in line with the distribution of the Canadian youth across the country (see Table 4).
A majority of participants lived in Ontario and Quebec - with the smallest shares living in the Atlantic provinces (NB, NS and PEI) and the Territories.
- Along an urban-rural dimension, 85% of participants lived in urban communities while 15% resided in rural communities. This distribution is also roughly in line with the distribution of the Canadian youth living in rural communities across the country
Though not shown in Table 4, most participants who lived in the Territories were part of interventions taking the form of work experiences rather than skills training. More detail information on the profile of participants, at the intervention level, can be found in the technical report, which is available upon request (ESDC, June 2019).
| Provinces and territories | Number of participants | Percentage of total participants |
|---|---|---|
| Alberta | 3240 | 11.2% |
| British Columbia | 3213 | 11.1% |
| Manitoba | 1597 | 5.5% |
| New Brunswick | 820 | 2.8% |
| Newfoundland and Labrador | 507 | 1.7% |
| Nova Scotia | 743 | 2.6% |
| Ontario | 11413 | 39.4% |
| Prince Edward Island | 377 | 1.3% |
| Quebec | 5594 | 19.3% |
| Saskatchewan | 1361 | 4.7% |
| Territories | 123 | 0.4% |
| Total | 28988 | 100% |
- Source: ESDC (2019). Internal Technical Report.
Main findings
Main finding #1
Immediately after the completion of their respective intervention, more than 7 in 10 participants reported to be employed or to have returned to school, exceeding the projected program target of 60%. Notably, 85% of participants who took part in an Entrepreneurship intervention reported to be employed or to have returned to school.
For ESDC, the desired outcomes of Skills Link interventions were to see at least 60% of participating youth employed or returned to school.
- Immediately after completing an intervention and according to ESDC service providers, about 48% of participants were employed and 25% returned to school, for a total of 73% (see Figure 5). Across interventions, individuals who completed:
- An Individual Skills Enhancement (ISE) intervention were more likely to be in school (35%) than to be employed (26%)
- A Group-Based Employment Skills intervention (GBES) were more likely to be unemployed

Text description of Figure 5
| Intervention | Employed | In school | Unemployed |
|---|---|---|---|
| All | 48% | 25% | 15% |
| GBES | 45% | 26% | 18% |
| ESWE | 52% | 23% | 13% |
| WE | 57% | 24% | 9% |
| ISE | 26% | 35% | 7% |
| ESE | 70% | 15% | 4% |
- Source: Common System for Grants and Contributions.
Notes:
- GBES: Group-Based Employability Skills, ESWE: Employability Skills through Work Experience, WE: Work Experience, ISE: Individual Skills Enhancement, and ESE: Employability Skills through Entrepreneurship.
- Percentages do not add up to 100% due to missing values or unknown status that varied from 11% for Group-Based Employment Skills intervention to 32% for the Individual Skills Enhancement intervention.
- Some youth may have not found work or decided not to return to school or were out of reach. In the latter situation, a follow-up after 12 weeks was required in order to verify if their status had changed.
During the 5-year period following an intervention, participating youth earned about $6,300 more per year relative to what they earned prior to their intervention.
As shown in Figure 6, during the five-year period following their participation:
- Youth earned an average of close to $6,300 more per year, compared to what they earned in the year prior to their participation
- About 6 in 10 (57%) participants were employed in the fifth year following their intervention
- The largest average increase in post-participation earnings (about $8,750 per year) was observed for participants who took part in Work Experience (WE) intervention
- A more modest average increase of about $4,000 per year was observed for participants who took part in Employability Skills through Entrepreneurship intervention (ESE)

Text description of Figure 6
| Intervention | Average annual increase |
|---|---|
| Overall | $6,345 |
| GBES | $5,890 |
| ESWE | $6,735 |
| WE | $8,745 |
| ISE | $5,825 |
| ESE | $4,030 |
- Source: Administrative Data Technical Report
- Note: GBES: Group-Based Employability Skills, ESWE: Employability Skills through Work Experience, WE: Work Experience, ISE: Individual Skills Enhancement, and ESE: Employability Skills through Entrepreneurship.
On average, participants earned less than $2,400 in the year prior to their intervention.
ESDC Skills Link – Indigenous Youth Participants
Similar results were found of Indigenous youth who participated in ESDC's Skills Link. More specifically, during the five-year period following their interventions, they earned close to $4,400 more per year relative to what they earned prior to their intervention. About 27% of Indigenous youth who participated in ESDC's Skills Link lived in a rural area.
Clustering analysis of GBES participants points to a very heterogeneous group, facing very different barriers and pre/post-programs outcomes
For the purposes of examining the various segments of the population youth facing barriers to employment, clustering analysis was performed for participants who took part in Group-Based Employment Skills (GBES) interventions. As shown in Figure7, four distinct groups were identified, representing about 50% of participants.
- Machine learning clustering algorithm consists of an iterative process that partitions a given data set into homogeneous groups (clusters) based on given features or characteristics, such that similar objects are kept in a group whereas dissimilar objects are in different groups
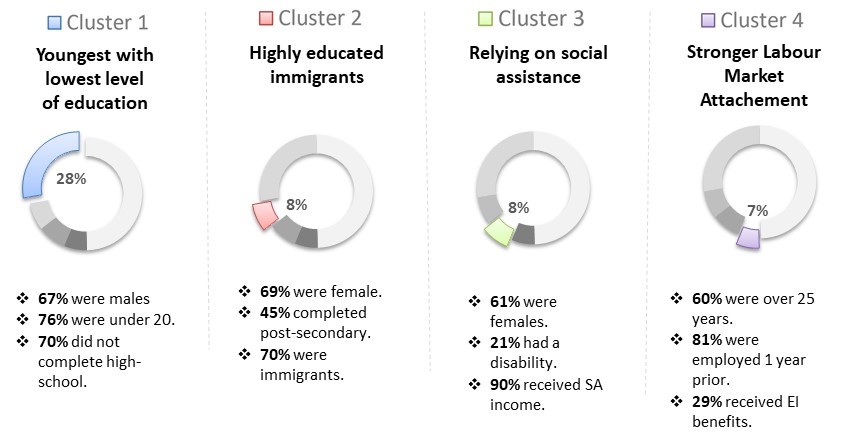
Text description of Figure 7
Among the youngest youth, with the lowest level of education, 67% were males; 76% were under 20 and 70% did not complete high-school. The highest educated immigrants were mostly made up of women (69%), 45% of whom completed their post-secondary education, and 70% were immigrants. Among youth who relied on social assistance, 61% were females, 21% had a disability, and 90% received social assistance income. Among youth who had the strongest labour market attachment, 60% were over 25 years old, 81% were employed prior to participating in the program, and 29% received EI benefits.
Relative to the pre/post-program outcomes observed for all GBES participants, certain groups of participants had distinct pre/post-program outcomes. For instance, relative to how much they earned or received in benefits in the year prior to their intervention:
- Highly educated immigrants (Cluster 2) saw the largest increase in post-participation earnings ($14,730 per year relative to $5,890 for all GBES participants as shown in Figure 6)
- Those relying on social assistance (Cluster 3) were the only group who saw a reduction in their post-participation receipt of social assistance ($2,030 per year)
- Those with stronger labour market attachment (Cluster 4) were the only group who saw a reduction in post-participation receipt of employment insurance benefits ($465 per year)
Main finding #2
Overall, when comparing results for participants with the results of a comparison group, the magnitude of the incremental impacts of Skills Link interventions on participants' labour market attachment was limited. This points to inherent challenges associated with helping youth facing barriers to employment who may require a wider and more comprehensive range of interventions.
As for the previous 2015 evaluation report, an incremental impact analysis was conducted for ESDC Skills Link participants. To that end, the Department relied on its Labour Market Data Platform using participants who received an intervention between January 2010 and December 2011. This period was selected to allow for the assessment of the interventions' impacts on labour market attachment over a period of at least five years following their completion up to calendar year 2016 (most recent available information). Building on previous evaluations, the incremental impact analysis was extended and conducted at the intervention level as well as at the sub-group level (for example, age and gender) for the two most prominent interventions.
Overall, following a Skills Link intervention, ESDC participants did not improve their labour market attachment, relative to a similar group of non-participants. As shown in Table 8, in the year when an intervention was received, the amount earned and the incidence of employment of participants was comparable to those observed for non-participants.
- Participants earned about $125 less than non-participants, and their incidence of employment was about 7.3 percentage point higher (bars in dark blue). The higher incidence of employment reflects, in part, the impact of participants who benefitted from a work placement as an intervention, which was not the case for the comparison group
- In addition, due to data limitations, the incidence of employment is determined based on whether an individual had any earnings during a calendar year. Therefore, it is possible to find instances where the net impact of an intervention is negative for earnings and positive for the incidence of employment; or vice versa. The former occurs when a relatively larger number of employed participants earn less than a relatively smaller number of employed individuals in the comparison group over a calendar year
| Reference period | Total reported earnings | Incidence of employment |
|---|---|---|
| Skills Link overall (in-year) | -$125 * | +7.3 pp |
| Skills Link overall (annual average, 5-year post) | -$910 | -0.2 pp * |
- Source: Administrative Data Technical Report. pp = percentage points
- * Results are statistically not significant, still they are valid in terms of informing the direction of the impact (negative or positive).
Over the five-year period following their intervention, participants' outcomes did not improve relative to those observed for non-participants.
- Participants earned about $910 less a year than non-participants, and their incidence of employment was about 0.2 percentage point lower, on average (bar in light blue in Table 8).
Incremental impacts of Skills Link interventions on participants' reliance on income support programs such as Employment Insurance or on social assistance were of smaller magnitude and can be found in Annex E.
These limited results point to inherent challenges associated with helping youth with barriers to employment and with weak labour market attachment. These findings are also consistent with results found as part of the 2015 Evaluation as well as for similar active labour market programs targeting disadvantaged youth in other OECD countries (Kluve, 2014).
Comparison group
Incremental impact analysis compares participant results to those of a comparison group to learn about what would have happened in the absence of the program.
The comparison group consisted of a subset of individuals aged 15 to 30 who have the same characteristics as Skills Links participants, but had received only a limited level of treatment through minor Employment Assistance Services (EAS) interventions as part of the Labour Market Development Agreements (LMDA). This approach is consistent with the approach used in a number of past LMDA evaluations.
- Annex C provides an example of how the social-economic characteristics of the comparison group match those of the group of participants.
No impact analysis was conducted for the Employability Skills through Entrepreneurship (ESE) intervention, since no comparator group could be built.
It should be noted that results from an incremental impact analysis are dependent on the observable characteristics of the participants at the time, and that it is on this set of characteristics that a comparison group is built. In practice, this means that when an incremental impact analysis is conducted for women who received a Skill Link intervention, a separate control group consisting only of women with similar observable characteristics was built. The same approach was applied to every other sub-group.
Therefore, caution should be exercised in over-generalizing the results presented at the sub-group level.
See Annex B for more details on the methodology.
Main finding #3
Youth who received interventions in the form of work experiences had stronger labour market attachment, relative to youth who received interventions in the form of group-based workshops.
Building on the 2015 evaluation, incremental impact analysis was conducted at the intervention-level to assess the relative effectiveness of various interventions.
As shown in Table 9, youth who participated in Skills Link interventions that included a work experience component (Employability Skills through Work Experience and Work Experience interventions) had more positive labour market attachment impacts relative to other interventions. Still, the positive impact on participants' labour market attachment was not sustained over time and tended to revert back to those observed for the comparison group within five years following an intervention (bars in light blue).
Incremental Impacts on Employment Earnings and Incidence of Employment
For the year of participation (In-Year) and the following five years (Annual Average), by Intervention
| Intervention and reference period | Total reported earnings | Incidence of employment |
|---|---|---|
| GBES (in-year) | -$630 | +2.6 pp |
| GBES (annual average, 5 year post) | -$1,310 * | -1.3 pp * |
| ISE (in-year) | -$640 | -3.1 pp |
| ISE (annual average, 5 year post) | -$800 | -2.1 pp * |
| ESWE (in-year) | $600 | +16.1 pp |
| ESWE (annual average, 5 year post) | -$670 | +2.3 pp |
| WE (in-year) | $860 | +17.2 pp |
| WE (annual average, 5 year post) | $100 * | +5.9 pp |
- Source: Administrative Data Technical Report. pp = percentage points.
- * Results are statistically not significant, still they are valid in terms of informing the direction of the impact (negative or positive).
For example, as shown in Table 9, in the year when a Work Experience intervention was received, participants earned about $860 more than non-participants and their incidence of employment was about 17.2 percentage points higher. This was expected since the intervention involved a work placement associated with additional earnings, which was not the case for the comparison group.
Over the five-year period following their intervention, participants earned about $100 more per year than non-participants and their incidence of employment was about 5.9 percentage point higher, on average.
Similar to the results found for all Skills Link interventions (see Table 8), participants who took part in Group-Based Employment Skills (GBES) and Individual Skills Enhancement (ISE) did not improve their labour market attachment relative to their respective comparison groups in the years following an intervention.
These findings are also consistent with international evidence, which suggests that active labour market programs targeting disadvantaged youth can help, if they are comprehensive – including job search assistance, counselling, training, and placement services (Kluve, 2014).
Robustness checks were performed to examine whether the relative ranking of the effects of each Skills link intervention were sensitive to the choice of the control group (see Annex D). Incremental impacts of Skills Link interventions on participants' reliance on income support programs such as Employment Insurance or on social assistance were of smaller magnitude and can be found in Annex E.
Main finding #4
Although the incremental impacts of interventions involving a workshop approach were generally negative, analysis at the sub-group level suggests that this type of interventions were relatively more effective for youth who had a lower level of education. In addition, impacts were relatively better for older youth (over the age of 19), particularly for interventions with a work experience component.
Lastly, an incremental impact analysis was conducted at the sub-group level (e.g., gender, age, level of education and rural/urban) for the two most prominent Skills Link interventions, that is Group-Based Employability Skills as shown in Table 10 and Employability Skills through Work Experience as shown in Table 11. Selecting the two most prominent interventions provided for a sufficiently large number of participants to support the conduct of a more granular analysis at the sub-group level.
Main takeaways
Results on the impacts of both interventions on post-participation earnings and the incidence of employment point to:
- Gender: Incremental impacts on both men and women were somewhat comparable, with relatively larger impacts found for men taking part in Group-based Employability Skills interventions and for women taking part in Employability Skills through Work Experience interventions.
- Level of education: Youth with a lower level of education (that is, secondary complete or incomplete) had relatively more positive impacts compared with youth with a higher level of education (post-secondary complete or incomplete).
- Age: Participants were segmented in three subgroups 15 to 19, 20 to 24 and 25 to 29. This is a traditional approach when examining youth-at-risk, given their different relationship with the education system and the labour market (Statistics Canada 2018). Results found are somewhat mixed. Still, when examining the indicator on incidence of employment, the analysis suggests that older youth (20 to 24 and 25 to 30) saw larger gains relative to their younger counterparts, particularly for interventions with a work experience component. This points to the benefits of early interventions when it comes to improving schoolto-work transitions for the younger youth (ESDC, 2019).
- Rural/Urban: Incremental impacts were similar across urban/rural settings.
Incremental impacts on participants' reliance on income support programs, at the sub-group level, were of smaller magnitude and can be found in Annex F (Group-Based Employability Skills) and Annex G (Employability Skills through Work Experience).
As shown in Table 10, for Group-Based Employability Skills interventions, dark blue bars point to relatively better results for those with a lower level of education and for older youth. For example, in the five-year period following an intervention, the intervention led to:
- An average annual decrease of $450 in post-participation earnings for participants who had completed their secondary studies compared to a decrease of $2,590 for those who had completed their post-secondary studies
- An average annual increase of 3.2 percentage points in the incidence of employment for participants in the 25 to 30 age sub-group, relative to a decrease of 3.9 percentage points for those in the 15 to 19 age sub-group
| Intervention | Total reported earnings | Incidence of employment |
|---|---|---|
| GBES (overall) | -$1,310 * | -1.3 pp * |
| Secondary incomplete | -$660 | -0.4 pp * |
| Secondary complete | -$450 * | -1.0 pp * |
| Postsecondary incomplete | -$2,360 | -2.3 pp * |
| Postsecondary complete | -$2,590 | -4.7 pp * |
| 15 to 19 | -$1,420 | -3.9 pp |
| 20 to 24 | -$1,540 | -0.8 pp * |
| 25 to 30 | -$1,065 | +3.2 pp* |
| Female | -$2,240 | -1.4 pp * |
| Male | -$870 | +0.2 pp * |
| Urban | -$2,050 | -1.8 pp * |
| Rural | -$1,670 | +0.3 pp * |
- Source: Administrative Data Technical Report. pp = percentage points
- * Results are statistically not significant, still they are valid in terms of informing the direction of the impact (negative or positive).
As shown in Table 11, for Employability Skills through Work Experience interventions, dark blue bars point to relatively better results for those with a lower level of education and for older youth. For example, in the five-year period following an intervention, the intervention led to:
- An average annual increase of $320 in the post-participation earnings of participants who had completed their secondary studies compared to a decrease of $1,710 for those who had completed their post-secondary studies
- An average annual increase of 3.8 percentage points in the incidence of employment for participants in the 25 to 30 age sub-group, relative to a decrease of 3.3 percentage points for those in the 15 to 19 age sub-group
| Intervention | Total reported earnings | Incidence of employment |
|---|---|---|
| ESWE (overall) | -$670 | +2.3 pp |
| Secondary incomplete | -$440 | +1.8 pp * |
| Secondary complete | $320 * | +2.8 pp * |
| Postsecondary incomplete | -$1,420 * | -0.8 pp * |
| Postsecondary complete | -$1,710 * | -0.6 pp * |
| 15 to 19 | -$1,080 | -3.3 pp |
| 20 to 24 | -$580 | +1.0 pp * |
| 25 to 30 | -$1,220 | +3.8 pp * |
| Female | -$560 | +1.0 pp * |
| Male | -$990 | +1.3 pp * |
| Urban | -$1,020 | +2.4 pp |
| Rural | -$1,420 | +2.6 pp * |
- Source: Administrative Data Technical Report. pp = percentage points
- * Results are statistically not significant, still they are valid in terms of informing the direction of the impact (negative or positive).
Conclusions and observations
The report shows that helping youth with employment barriers to gain the skills, abilities and experience to facilitate their transition into the labour market can be challenging. Canada does not stand alone in this regard, and similar takeaways were reached for other OECD countries.
As shown in this report, the group of youth participating in Skills Link interventions is quite heterogeneous ranging from young high school dropouts to relatively older visible minorities with university-level education. In particular, we found that:
- Immediately after the completion of their respective intervention, more than 7 in 10 participants reported to be employed or to have returned to school, exceeding the projected program target of 60%. Notably, 85% of participants who took part in an Entrepreneurship intervention reported to be employed or to have returned to school
- Overall, when comparing results for participants with the results of a comparison group, the magnitude of the incremental impacts of skills link interventions on participants' labour market attachment were limited. This points to inherent challenges associated with helping youth with barriers to employment who generally require a wider and more comprehensive range of interventions
- Youth who received interventions in the form of work experiences had stronger labour market attachment, relative to youth who received interventions in the form of group-based workshops
- Although the incremental impacts of interventions involving a workshop approach were generally negative, analysis at the sub-group level suggests that this type of interventions were relatively more effective for youth who had a lower level of education. In addition, impacts were relatively better for older youth (over the age of 19), particularly for interventions with a work experience component
These findings suggest that there are potential challenges associated with the group-based workshop approach when applied to a mixed group of youth facing various barriers to employment. This points to the benefits of better tailoring interventions in line with the needs of the different segments of participating youth.
Annexes
Annex A: Bibliography
Data sources:
- Employment and Social Development Canada. Administrative data known as the Common System for Grants and Contributions
Internal sources, technical studies (not published, available on demand):
- ESDC (June 2019). Net Impact Results of the Youth Employment Strategy. Evaluation Directorate
- ESDC (February 2019). Evaluation of Pathways to Education, Final report. Evaluation Directorate
External sources:
- Aboriginal Peoples: Fact Sheets, released in 2015 and used the 2011 National Household Survey (NHS) and the 2012 Aboriginal Peoples Survey (APS) as main data sources. Statistics Canada - Catalogue no. 89-656-X2015000
- Canada Mortgage and Housing Corporation (no date). Housing Internship Initiative for First Nations and Inuit Youth (PDF).
- Employment and Social Development Canada (June 2015). Youth Employment Strategy Skills Link.
- Employment and Social Development Canada. Departmental performance report.
- Gebel, M., & Vossemer, J. (2014). The impact of employment transitions on health in Germany: a difference-in-differences propensity score matching approach. Social Science and Medicine, 108, 128–136.
- Heckman, J., Ichimura, H., & Todd, P. (1997). Matching As An Econometric Evaluation Estimator: Evidence from Evaluating a Job Training Programme. Review of Economic Studies, 64(4), 605-654. doi: 10.2307/2971733
- Human Resources and Skills Development Canada (2011). Disability in Canada: A 2006 Profile. Released in 2011.
- Human Resources and Social Development Canada (2008 to 2009). Departmental Performance Report.
- Kluve, J. (2014), Youth labor market interventions. IZA World of Labour, December 2014
- Lechner, M., & Wunsch, C. (2013). Sensitivity of matching-based program evaluations to the availability of control variables. Labour Economics, 21, 111-121.
- Statistics Canada (2011). Aboriginal Peoples in Canada: First nations People, Métis and Inuit, National Household Survey, 2011
- Statistics Canada (2019). A Portrait of Canadian Youth
- Statistics Canada (2018). Canadian Survey on Disability, the evolution of disability data in Canada: Keeping in step with a more inclusive Canada
- Statistics Canada (2018). Transition from school to work – the not in employment, education and training (NEET) indicator for 15 to 19 year old in Canada
- Stuart, E.A., Huskamp, H.A., Duckworth, K., Simmons, J., Song, Z., Chernew, M., & Barry, C.L. (2014). Using propensity scores in difference-in-differences models to estimate the effects of a policy change. Health Services Outcomes Research Methodology, 14(4), 166–182. doi: 10.1007/s10742-014-0123-z
Annex B: Evaluation approach
Lines of evidence / Methodology
Administrative data / Incremental impact methodology
The incremental impact analysis is conducted using the integrated Labour Market Program Data Platform, which contains administrative data collected at the intervention and project level through the Common System for Grants and Contributions, linked to the EI benefits databank and Canada Revenue Agency (CRA) taxation files.
The data were thoroughly assessed and transformed into high-quality analytical files that included a large number of variables relevant to individuals' labour market experiences, including socio-demographic characteristics of both participant and comparison cases (for example, age, gender, education, marital status, disability), as well as their province of residence, background qualifications (for example, occupational group, industry codes), and labour market history (for example, use of EI benefits, employment/self-employment earnings, use of social assistance, incidence of employment in the five-year pre-participation period).
Moreover, the current evaluation marks the first time that the program data contains information broken down by specific types of Skills Link interventions. In collaboration with the program area, ESDC evaluation staff mapped the interventions into five main categories: Group Based Employability Skills (GBES), Employability Skills through Work Experience (ESWE), Work Experience (WE), Individual Skills Enhancement (ISE), and Employability Skills through Entrepreneurship (ESE). Consequently, the current evaluation is able to examine the incremental impacts for participants who started a specific Skills Link intervention between 2010 and 2011, and follows their subsequent labour market trajectories for up to five consecutive years up to 2016, in accordance with the current availability of CRA data.
The methodology is built on the same framework as the evaluation of the Labour Market Development Agreements. The procedure for estimating incremental impacts is based on a quasi-experimental approach that measures the effectiveness of the program by comparing the actual outcomes for the participants in the different interventions to their counterfactual outcomes (that is, the outcomes they would have experienced in the absence of an intervention). Because one cannot measure a given individual's outcomes under both participation and non-participation in a Youth Employment Strategy intervention, one needs an appropriate comparison group to “stand in” as the counterfactual. Based on the available data, two approaches for building a comparison group were considered for the Skills Link evaluation.
In line with the same strategy applied in many previous ESDC evaluations, the first approach used a subset of individuals who have the same characteristics as Skills Link participants, but had received only a limited level of treatment through minor Employment Assistance Services interventions as part of the Labour Market Development Agreements.
A second approach was used as a robustness check for the first approach and relied on a discrete subset of Group-Based Employability Skills (GBES) participants. These were selected to be as similar as possible to the participants in each of the other Skills Link intervention types. The advantage of the second approach is to assess the sensitivity of the incremental impact results to unobserved variables given that GBES participants are more likely to be similar to those in the other Skills Link interventions in terms of unobservable barriers to gaining and sustaining employment. Based on consultation with external academic experts (peer reviewers), this dual comparison group approach was deemed the optimal choice in order to account for the possible effects of unobserved variables and strengthen the conclusions of the evaluation. There were some differences in the magnitude of the incremental impact estimates across the two comparison group scenarios. However the relative ranking of the different interventions was similar and therefore the conclusions remain the same.
For all counterfactual comparisons, the incremental impact results were produced using a state-of-the-art combination of difference-in-differences estimation and propensity score kernel matching methods (Heckman et al., 1997). Given the breadth of background variables available in the linked data files, one can be reasonably confident that the impact estimates are robust (Lechner & Wunsch, 2013). For validation purposes, the results were also produced with alternative techniques (that is, inverse probability weighting and nearest-neighbour matching). This triangulation exercise confirmed that the incremental impact results were insensitive to the choice of estimation method.
Potential limitations
The main advantage of this evaluation methodology is the ability to draw conclusions about the impacts of the YES program at the intervention-specific level. However, a potential limitation for interpreting the results is that the collected data may not fully capture other detailed information related to the sequence of Skills Link interventions taken by participants.
Another possible limitation is that the universal eligibility of the YES program creates challenges for comparison group selection.
Annex C: Comparison between the making of a group of participants and their control group
Table 5 provides a comparison between various observed socio-demographic and economic characteristics for the group of participants who took part in Group-Based Employability Skill and their comparison group consisting of youth who received low-intensity employment assistance measures (EAS) as part of the Labour Market Development Agreement. The table shows how both groups had similar traits over a subset of socio-demographic and economic characteristics that were taken into account.
| Socio-demographic and economic characteristics | Participants to GBES | Control group with Youth who received EAS |
|---|---|---|
| Number of participants | 16,160 | 25,630 |
| Gender, male | 58% | 58% |
| Gender, female | 42% | 42% |
| Age, under 20 | 37% | 35% |
| Age, 20 to 25 | 42% | 44% |
| Age, 25 and over | 21% | 21% |
| Self-Identification, aboriginal status | 17% | 17% |
| Self-Identification, person with disability | 9% | 10% |
| Self-Identification, visible minority | 21% | 24% |
| Self-Identification, immigrant status | 6% | 6% |
| Education, secondary incomplete | 55% | 53% |
| Education, secondary incomplete | 24% | 24% |
| Education, secondary incomplete | 6% | 6% |
| Education, secondary incomplete | 11% | 10% |
| Education, secondary incomplete | 4% | 5% |
| Level of income one-year before participation, no earnings | 47% | 47% |
| Level of income one-year before participation, $1 to $5,000 | 36% | 34% |
| Level of income one-year before participation, $5,000 to $10,000 | 11% | 12% |
| Level of income one-year before participation, more than $10,000 | 6% | 7% |
Annex D: Robustness check: Using a discrete subset of Group-Based Employability Skills (GBES) participants
- The relative ranking of the effects of each Skills link interventions was similar whether the comparison group was built from youth who received limited level of treatment through minor Employment Assistance Services (EAS) interventions or from youth who received a Group-Based Employability Skills interventions
- In particular, under both approach, Skills Link' interventions that included a work experience component (ESWE and WE interventions) led to better labour market attachment impacts
- For example, as shown in table 12, in the year when a WE intervention was received, participants earned about $1,940 more than comparable GBES participants and their incidence of employment was about 13.1 percentage point higher
- Over the five-year period following a Work Experience (WE) intervention, participants earned about $1,730 more a year than comparable GBES participants and their incidence of employment was about 5.6 percentage point higher on average
- Similarly, Individual Skills Enhancements (ISE) taking the form of short-term courses had a more sustained impact on labour market attachment, but to a lesser extent
| Intervention and reference period | Total reported earnings | Incidence of employment |
|---|---|---|
| ISE (in-year) | $200 * | -6.4 pp |
| ISE (annual average, 5 year post) | $890 | -0.5 pp * |
| ESWE (in-year) | $1,280 | +12.8 pp |
| ESWE (annual average, 5 year post) | $900 | +3.0 pp |
| WE (in-year) | $1,940 | +13.1 pp |
| WE (annual average, 5 year post) | $1,730 | +5.6 pp |
- Source: Administrative Data Technical Report. pp = percentage points
- * Results are statistically not significant, still they are valid in terms of informing the direction of the impact (negative or positive)
Annex E: Incremental impacts of Skills Link interventions on participants' reliance on income support programs, by intervention.
As shown in Table 13, in the year when a Group-Based Employability Skills (GBES) intervention was received, participants received about $110 less than non-participants in Employment Insurance benefits and about $190 less in Social Assistance benefits.
Over the five-year period following their intervention, participants received about $80 less a year than non-participants in Employment Insurance benefits, and about $90 more in Social Assistance benefits.
| Intervention and reference period | EI benefits | SA benefits |
|---|---|---|
| Skills Link overall (in -year) | $120 | $200 |
| Skills Link overall (annual average, 5 year post) | -$10 * | $30 * |
| GBES (in-year) | -$110 | -$190 |
| GBES (annual average, 5 year post) | -$80 | $90 |
| ISE (in-year) | -$150 | -$80 * |
| ISE (annual average, 5 year post) | $60 * | $50 |
| ESWE (in-year) | -$110 | -$190 |
| ESWE (annual average, 5 year post) | $40 | $40 * |
| WE (in-year) | -$80 | -$230 |
| WE (annual average, 5 year post) | $141 | -$170 |
- Source: Administrative Data Technical Report. pp = percentage points.
- * Results are statistically not significant, still they are valid in terms of informing the direction of the impact (negative or positive). (GBES = Group-Based Employability Skills; ISE = Individual Skills Enhancement; ESWE = Employability Skills through Work Experience; and WE = Work Experience)
Annex F: Incremental impacts of Group-Based Employability Skills on participants' reliance on income support programs, by subgroup
As part of Table 14, in the five-year period following a Group-Based Employability Skills intervention, the intervention led to:
- An average annual decrease of about $29 in post-participation receipt of Employment Insurance benefits and an decrease of about $493 in the receipt of Social Assistance benefits for participants who had completed their secondary studies
| Intervention | EI benefits | SA benefits |
|---|---|---|
| GBES (overall) | -$80 | $90 |
| Secondary incomplete | -$70 | $30 * |
| Secondary complete | -$30 * | -$490 |
| Postsecondary incomplete | -$140 | $270 |
| Postsecondary complete | $40 * | -$50 * |
| 15 to 19 | -$20 * | $10 * |
| 20 to 24 | -$60 | -$20 * |
| 25 to 30 | -$190 | $90 * |
| Female | -$90 | $20 * |
| Male | -$70 | $150 |
| Urban | -$170 | $130 |
| Rural | -$60 * | $20 * |
- Source: Administrative Data Technical Report. pp = percentage points
- * Results are statistically not significant, still they are valid in terms of informing the direction of the impact (negative or positive). Source: Administrative Data Technical Report. pp = percentage points
Annex G. Incremental impacts of Employability Skills through Work Experience interventions on participants' reliance on income support programs, by subgroup
As part of Table 15, in the five-year period following a Employability Skills through Work Experience intervention, the intervention led to:
- An average annual increase of about $120 in post-participation receipt of Employment Insurance benefits and a decrease of about $330 in the receipt of Social Assistance benefits by participants that had completed their secondary study
| Intervention | EI benefits | SA benefits |
|---|---|---|
| GBES (overall) | $40* | $40 * |
| Secondary incomplete | -$20* | $70 * |
| Secondary complete | $120 | -$330 |
| Postsecondary incomplete | $40 | $30 * |
| Postsecondary complete | $160 * | -$20 * |
| 15 to 19 | $70 * | $0 |
| 20 to 24 | $30* | $40 * |
| 25 to 30 | -$30* | $120 * |
| Female | $20* | $120 |
| Male | $50 | $0 |
| Urban | $100* | $50 |
| Rural | $60* | $100 |
- Source: Administrative Data Technical Report. pp = percentage points
- * Results are statistically not significant, still they are valid in terms of informing the direction of the impact (negative or positive). Source: Administrative Data Technical Report. pp = percentage points