
Chapter 1. Introduction
Official title: Evaluation of the Labour Market Development Agreements
On this page
1. Introduction
Employment and Social Development Canada (ESDC) worked jointly with twelve Provinces and Territories (P/Ts) to undertake the 2012-2017 second cycle for the Labour Market Development Agreement (LMDA) evaluations. The first cycle of LMDA evaluation was carried out between 1998 and 2012 and involved the conduct of bilateral formative and summative evaluations in all P/Ts. Under the second cycle, the evaluation work consisted of conducting two to three studies per year on the Employment Benefits and Support Measures (EBSMs) similar programming delivered under these agreements. The studies aimed to generate evaluation evidence on the effectiveness, efficiency and design/delivery of programs and services for Canada overall and for the twelve P/Ts that opted for a joint evaluation process with the Government of Canada. Quebec is responsible for its own evaluation but data from Quebec were included in the national level analyses.
This report presents a summary of the findings from nine national level studies. Similar reports will be available for each P/T in 2017 and 2018. The report is organised as follows:
- Introduction with an overview of the studies summarized in this report including their scope and methodology, and contextual information on the LMDAs.
- Findings section with a discussion around the rationale for investing in labour market programming.
- Conclusions and lessons learned.
- Recommendations that emerged from the evaluation findings.
1.1 Labour Market Development Agreement background
LMDAs are bilateral agreements between Canada and each P/T and were established under Part II of the 1996 Employment Insurance (EI) Act. As part of these agreements, Canada transfers $2.14B annually to P/Ts (including $190M in administration funds) in order to design and deliver programs and services aiming at assisting individuals to prepare for, obtain and maintain employment. Program delivery was either devolved or co-managed until 2010 and became fully devolved to all P/Ts at that time. Funded programs and services can be classified under two categories: 1) Employment Benefits and 2) Support Measures.
Employment benefits
Employment Benefits funded under the LMDAs are offered to unemployed individuals who 1) are actively on EI (in other words, active claimants); 2) ended their benefit period within three years before participating (in other words, former claimants); or 3) established a claim for maternity or parental benefits within the past five years and are returning to the labour force for the first time (in other words, former claimants)Footnote 5. Employment Benefits include the following categories:
- Skills Development helps participants obtain employment skills by giving them financial assistance that enables them to select, arrange and pay for classroom training.
- Targeted Wage Subsidies help participants obtain on-the-job work experience by providing employers with financial assistance to help paying the wages of participants.
- Self-Employment provides financial assistance and business planning advice to EI-eligible participants to help them start their own business. This financial assistance is intended to cover personal living and other types of expenses during the initial stages of the business.
- Job Creation Partnerships provide participants with opportunities to gain work experience that will lead to ongoing employment. Employment opportunities are provided by projects that contribute to developing the community and the local economy.
- Targeted Earnings Supplements encourage unemployed persons to accept employment by offering them financial incentives. This program was not covered by the evaluation given the fact that it was delivered in one province only.
Support measures
Support Measures are available to all unemployed individuals including those not eligible to receive EI and include:
- Employment Assistance Services such as individual counselling, action planning, help with job search skills, job-finding clubs, job placement services, the provision of labour market information, case management and follow-up.
- Labour Market Partnerships provide funding to help employers, employee and employer associations, and communities improve their capacity to deal with human resource requirements and implement labour force adjustments. These partnerships involve developing plans and strategies, and implementing labour force adjustment measures. This support measure was not covered by the evaluation.
- Research and Innovation supports activities that identify better ways of helping people prepare for or keep employment and be productive participants in the labour force. Funds are provided to eligible recipients to enable them to carry out demonstration projects and research for this purpose. This support measure was not covered by the evaluation.
Table 2 provides an overview of the share of funding allocated to the five programs and services examined under the second cycle for LMDA evaluation and the average cost per participant. It is noted that the average cost per participant was calculated based on the 2002-2005 data from the EI Monitoring and Assessment Reports. The 2002-2005 period corresponds to the cohort of participants selected for incremental impacts and cost-benefit analysis in the LMDA evaluation.
| Program and service | Share of funding 2014-2015 |
Average cost per participant 2002-2005 |
|---|---|---|
| Skills Development | 51% | $7,150 |
| Employment Assistance Services | 35% | $700 |
| Targeted Wage Subsidies | 6% | $4,700 |
| Self-Employment | 6% | $11,100 |
| Job Creation Partnerships | 2% | $8,400 |
| Total | 100% | n/a |
Sources: EI Monitoring and Assessment Reports 2002-2003 to 2014-2015.
1.2 Methodology
This section presents key aspects of the quantitative analyses carried out as part of the LMDA studies, while a more detailed description of the methodology is provided in Appendix A.
All quantitative analyses were based on administrative data from the EI Part I (EI claim data) and Part II (EBSM participation data) linked to the T1 and T4 taxation files from the Canada Revenue Agency. Incremental impact analyses and the cost-benefit analyses were based on up to 100% of participants in the reference period selected.
Incremental impacts analysis
Five studies assessed program effectiveness by estimating incremental impacts from EBSM participation on participants’ labour market experience (in other words, earnings from employment/self-employment, incidence of employment, use of EI or Social Assistance and dependence on income support) after participation. The role of the incremental impact analysis is to isolate the effects of participation from other factors such as the economic cycle. In order to achieve this, the incremental impact analysis compared the labour market experience of participants before and after their participation with that of non-participants (see the example of incremental impact calculation in Figure 1).
The matching of participants and comparison group members used up to 75 socio-demographic and labour market variables observed over five years before participation. Two different comparison groups were used to measure impacts for active and former EI claimants. For active claimants, the incremental impacts were measured relative to a comparison group of active claimants who were eligible to, but did not, participate in EBSMs during the reference period.
Former claimants can be underemployed and unable to requalify for EI, out of the labour force for various reasons or on Social Assistance. Based on previous evaluation methodologies, on expert advice and given the difficulty in generating a suitable comparison for former claimants using administrative data alone, the comparison group for former claimants was created using individuals who participated in Employment Assistance Services only during the reference period. This is a conservative approach given the fact that participation in Employment Assistance Services can lead to limited effects on labour market outcomes. In other words, the experience of former claimants who received Employment Benefits (in other words, Skills Development, Targeted Wage Subsidies, Self-employment and Job Creation Partnerships) was compared to the experience of former claimants who received low intensity employment services (in other words, Employment Assistance Services only). Due to this difference in measurement, incremental impacts estimated for active claimant participants should not be directly compared to those of former claimant participantsFootnote 6.
Figure 1 presents an example of the approach used to estimate the incremental impacts on earnings.
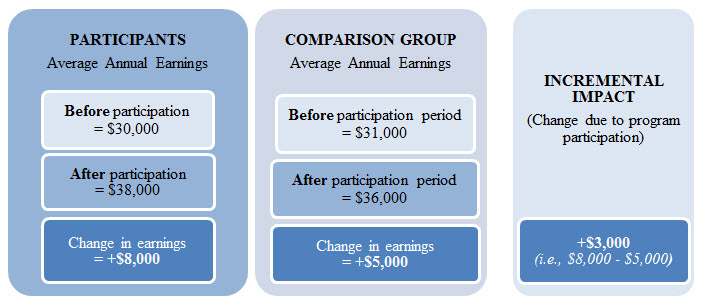
Figure 1 -Text description
| Participants | |||
|---|---|---|---|
| Average annual earnings | Before participation | After participation | Change in earnings |
| $30,000 | $38,000 | $8,000 | |
| Comparison group | |||
|---|---|---|---|
| Average annual earnings | Before participation | After participation | Change in earnings |
| $31,000 | $36,000 | $5,000 | |
Incremental Impact (Change due to program participation): + $3,000 (in other words, $8,000 - $5,000)
Factors accounted for in the cost-benefit analysis
Program efficiency was assessed through a cost-benefit analysis which compared the cost of participating in the program for the participants and the cost of delivering the program for the government to the benefits generated by the program. Overall, this analysis provided insights on the extent to which the program is efficient for the society (in other words, for both the participants and the government). The costs and benefits accounted for in the calculations were as follows (detailed definitions in Appendix A):
- Program cost: includes program and administration costs paid by the government.
- Marginal social costs of public funds: represent the loss incurred by society when raising additional revenues such as taxes to fund government programs.
- Employment earnings: consists of incremental impacts on participants’ earnings during and after participation. The calculation accounts for the participant’s forgone earnings during participation (in other words, opportunity cost). Employment earnings were also increased by 15% to account for fringe benefits such as the employer-paid health, life insurance and pensions contributions.
Strengths and limitations of the studies
One of the key strength from the studies is that all quantitative analyses were based on administrative data rather than survey responses. Compared to survey data, administrative data are not subject to recall errors or response bias.
The propensity score models used to match participants and non-participants for the incremental impact analyses are judged to be robust in part because they were based on five years of pre-participation data and on a vast array of variables including socio-demographic characteristics, location, skills level related to last occupation and indicators of labour market attachment. Sensitivity analysis and the use of alternative estimation methods have increased confidence in the incremental impact estimates. However, one limitation with the propensity score matching techniques is that no one can be fully sure the impacts were not influenced by factors not captured in the data.
The cost-benefit analysis accounted for all quantifiable costs and benefits that are directly attributable to the EBSMs and could be estimated with the available administrative data. The analysis did not account for non-quantifiable benefits such as improvements in participant’s wellbeing or for the multiplier effect of increased spending on the economy.
In some studies that relied on the use of qualitative data collection methods, the number of key informants interviewed was relatively small in some P/Ts. Responses provided by key informants reflect their own experience and their own region, and may not be fully representative of the entire province and territory.
1.3 Overview of the studies summarized in this report
Findings presented in this report were drawn from nine separate studies carried out at the national level. These studies examined issues related to program effectiveness, efficiency, design/delivery and used a mix of qualitative and quantitative methods. Each study examined evaluation issues in relation to active and former EI claimants.
Table H1 in Appendix H presents an overview of these studies, including the type of evidence generated, the methods used, the reference period and the length of the post-program period over which program effects were observed.