
Chapter 2. Evaluation findings
Official title: Evaluation of the Labour Market Development Agreements
On this page
Chapter 2. Evaluation findings
2.1 Rationale and labour market context
LMDA investments align with federal government priorities
Active labour market programs are fairly similar across Organization for Economic Co-operation and Development countries and consist of skills training in a classroom setting, work experience with employers (often subsidized) or in the public/non-profit sector, return-to-employment assistance and self-employment assistance. In Canada, the largest active labour market investment is made under the LMDAs and targeted mainly to unemployed individuals who are eligible for EI. An additional $500M is invested under the Canada Job Fund agreements and is targeted mainly to low-skilled workers and unemployed Canadians who are not eligible for EI benefits. As well, specific programs are targeted toward youth (Youth Employment Strategy), older workers (Targeted Initiative for Older Workers), Indigenous Peoples (Aboriginal Skills and Employment Training Strategy) and persons with disabilities (Labour Market Agreements for Persons with Disabilities).
The 2016/17 Report on Plans and Priorities for ESDC links LMDA investments to the strategic outcome of having A skilled, adaptable and inclusive labour force and an efficient labour market. The report aligns this strategic outcome with the Whole-of-government Framework outcome area of providing Income security and employment for Canadians.
LMDA investments are responsive to the needs of unemployed Canadians
As shown in Figure 2, from 2004/05 to 2014/15, the number of unemployed Canadians ranged between 1,077,000 and 1,523,000 annually. Figure 2 also shows the number of EBSM participants who were EI eligible as well as the total number of EBSM participants, including those who are non-EI eligible.
Overall, these data show the important contribution made by the LMDA over the last decade to assist unemployed Canadians in finding and keeping employment. Unemployed Canadians included both EI and non-EI eligible individuals:
- The annual number of EI eligible participants varied between 405,000 and 550,000.
- The total annual number of EI and non-EI eligible participants varied between 602,000 and 760,000.
Unemployed Canadians who are not eligible for EI and requiring assistance can also access support under other P/T or federally funded programs and services such as the Canada Job Funds which followed the Labour Market Agreements introduced in 2008.
Sub-sections 2.2 to 2.7 of this report will provide evidence that EBSMs are, overall, improving participants’ incidence of employment, earnings and reducing dependence on government income support. As such, EBSMs are addressing actual needs and strengthening the labour market attachment of LMDA participants.
Figure 2 compares the number of unemployed Canadians, the number of EBSM participants who are eligible for employment insurance benefits and the total number of EBSM participants (participants eligible and non- eligible for employment insurance) from 2004-2005 to 2014-2015.
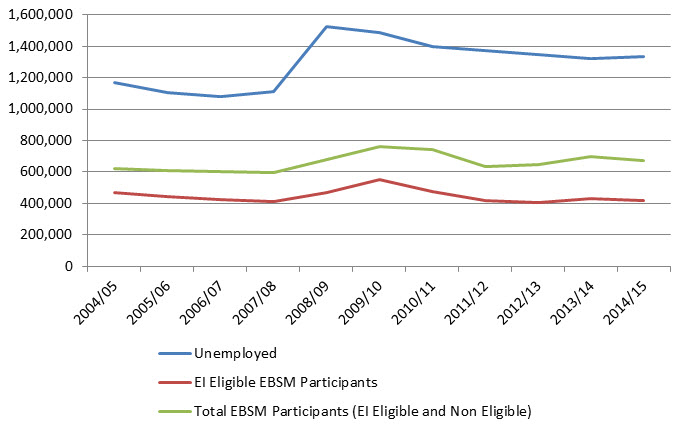
Figure 2 -Text description
| 2004/05 | 2005/06 | 2006/07 | 2007/08 | 2008/09 | 2009/10 | 2010/11 | 2011/12 | 2012/13 | 2013/14 | 2014/15 | |
|---|---|---|---|---|---|---|---|---|---|---|---|
| Unemployed | 1,169,000 | 1,106,000 | 1,077,000 | 1,112,000 | 1,523,000 | 1,486,000 | 1,399,000 | 1,372,000 | 1,347,000 | 1,322,000 | 1,331,000 |
| EI Eligible EBSM participants | 466,800 | 440,706 | 425,278 | 409,751 | 466,971 | 549,741 | 473,557 | 416,935 | 405,293 | 431,029 | 416,416 |
| Total EBSM participants (EI eligible and Non eligible) | 620,787 | 611,420 | 602,157 | 595,910 | 676,842 | 758,761 | 742,907 | 631,522 | 647,127 | 695,745 | 674,081 |
Sources: Statistics Canada, CANSIM, Table 282-0002 and EI Monitoring and Assessment Reports (2004-2015)
Note: For the 2008-2010 period, it is not surprising to see the delay in EBSM participation compared to the increase in the number of unemployed. This is due to the fact that EBSM participation is reported on annual basis and that for most interventions there is a normal delay between becoming unemployed and starting interventions such as Skills Development, Targeted Wage Subsidies, Self-Employment and Job Creation Partnerships. As well, increased funding under Budget 2009 affected the number of EBSM participants.
2.2 Skills Development
2.2.1 Program description
Based on a document review and key informant interviews completed in 9 P/Ts in summer 2015
The objective of the Skills Development program is to assist active and former EI claimants in obtaining the skills they need for employment, ranging from basic to advanced skills. The proportion of total EBSM expenditures spent on this program ranged from 51% to 54% between 2002/03 and 2014/15. The program provides financial supports to cover the following expenses:
- Tuition (9 P/Ts)
- Living allowance to cover expenses such as rent/mortgage, food and utilities (9 P/Ts)
- Childcare and dependent care (9 P/Ts)
- Transportation (9 P/Ts)
- Books and other materials (9 P/Ts).
- Disability-related supports (6 P/Ts)
- Living away from home allowance in temporary housing during training (6 P/Ts)
- Student fees (5 P/Ts)
- Special equipment, clothing and tools (4 P/Ts)
- Tutoring (3 P/Ts)
- Relocation costs (3 P/Ts)
- Health and dental care (3 P/Ts)
- Certification/licensing allowance (2 P/Ts)
- Specialized assessments (for example, psycho-educational and ergonomic) (2 P/Ts)
The level of financial support provided under the program is determined through an assessment of the participant’s need. Funding is generally granted to individuals who pursue essential skills training/adult basic education, English or French as second language training or occupational skills training. In some cases, occupational skills can include college or university training (4 P/Ts). Five P/Ts submitted information on the proportion of Skills Development interventions dedicated to supporting individuals in each training type for fiscal year 2014/15. The focus of Skills Development funding varies across those P/Ts:
In 3 out of 5 P/Ts:
- Occupational skills training represented 51% to 88% of interventions
- Adult basic education/essential skills training represented 12% to 26% of interventions
- In one P/T, 32% of interventions were for training such as pre-apprenticeship
In 2 out of 5 P/Ts:
- Focused primarily on adult basic education or essential skills training (51% and 56% of interventions)
- Occupational skills training represented 13% and 44% of interventions
- In one P/T, 36% of interventions consisted of English or French as a second language
2.2.2 Program delivery
Based on a document review and key informant interviews completed in 9 P/Ts in summer 2015
Program delivery varied across the 9 P/Ts examined in the Skills Development study. Participants were entirely case-managed by government staff in 3 P/Ts and exclusively by third-party service providers in another 3 P/Ts. In the remaining 3 P/Ts, service providers case-managed participants while government staff negotiated the level of financial supports with participants. The application process for the program usually starts with a need assessment which identifies the individual’s skill level, credential, education, work experience and goals (9 P/Ts). The assessment may also look at other factors such as job readiness (5 P/Ts) and the amount of time spent on EI or searching for employment (2 P/Ts).
Once the individual is deemed eligible, he/she works with a caseworker to establish a return-to-work action plan and an application. As part of this process, the individual has to justify his/her choice of training program by demonstrating that labour market demand exists (9 P/Ts). The individual may have to conduct interviews with employers (9 P/Ts), identify job advertisements or use other labour market information sources (8 P/Ts). In 5 P/Ts, applications for training leading to employment in low demand occupations may not be approved. In two other P/Ts, training for occupations in low demand may be funded if the individual’s action plan demonstrates how the training will improve his/her employability.
The application process may also involve a financial needs assessment which aims to determine the types of supports and level of funding required by the individual. Two P/Ts also provide budget planning advice to assist the individual in managing expenses during training (2 P/Ts). Overall, the length of the application and approval process ranges from 2 weeks to 6 months, depending on how long the individual takes to develop a return-to-work action plan and to proceed through the steps of the application process.
2.2.3 Profile of Skills Development participants
As shown in Table B1 in Appendix B, more than half of active claimants who started their Skills Development intervention in the 2002/05 and 2007/08 periods were male (54% and 52% respectively) and the majority were between 25 and 44 years of age (60% and 56% respectively). They most frequently had an occupation requiring secondary or occupational training prior to participation (40% of participants in each cohort). The 2002/05 participants had slightly lower earnings prior to participation ($19,206) compared to the 2007/08 participants ($20,024).
Former claimants who started their Skills Development intervention in the 2002/05 and 2007/08 periods were mainly female (53% and 56% respectively) and the majority were between 25 to 44 years of age (61% and 58% respectively). They most frequently had occupations requiring secondary or occupational training before participation (41% each). Both cohorts had very similar earnings from employment in the year before participation ($8,280 and $8,669).
2.2.4 Incremental impacts
Active claimants
As shown in Table B2 in Appendix B, active claimants who started their Skills Development participation between 2002 and 2005 had incremental gains in earnings and incidence of employment in each of the five years after participation. As shown in Figure 3, earnings continuously increased over time with gains ranging from $204 in the first year after participation to $4,059 in the fifth year. Similarly, the increases in incidence of employment ranged between 2.4 percentage points in the first year and 4.4 percentage points in the fifth year.
Figure 3 illustrates the incremental gains in employment earnings over the 5 post-program years for active and former employment insurance claimants who participated in the Skills Development program.
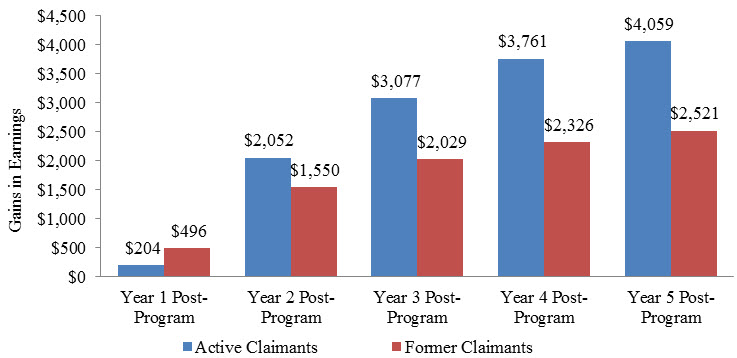
Figure 3 -Text description
| Gains in earnings | Year 1 post-program | Year 2 post-program | Year 3 post-program | Year 4 post-program | Year 5 post-program |
|---|---|---|---|---|---|
| Active claimants who participated in the Skills Development program | $204 | $2,052 | $3,077 | $3,761 | $4,059 |
| Former claimants who participated in the Skills Development program | $496 | $1,550 | $2,029 | $2,326 | $2,521 |
Gains in employment earnings and incidence of employment were accompanied by decreases in EI use ranging between $69 and $470 in all years after participation. Active claimant’s use of social assistance benefits decreased in the last three years of the five years post-program period while their level of dependence on income support decreased between 1 and 2.2 percentage points in all years after participation.
Results for the more recent participants (in other words, 2007/08) were in the same direction with gains in earnings and incidence of employment and decreases in the use of government income support. However, the size of the impacts was slightly larger for the more recent participants (for example, larger increases in incidence of employment and decreases in EI use).
Overall, active claimants increased their labour market attachment through increases in earnings, incidence of employment and a decrease in the level of dependence on government income support (use of EI and social assistance).
The results for sub-groups of active claimants were as follows:
- Youth (under 30 years old) who started their Skills Development participation between 2002 and 2005 improved their earnings and incidence of employment in most years after participation. As well, they had short-term decreases in EI use and decreases in social assistance use over most post-program years.
- Older workers (55 years old and over) who started their Skills Development participation between 2002 and 2005 had the largest incremental increases in earnings and incidence of employment when compared to youth and all active claimants. Their use of EI and social assistance increased over most of the post-program period indicating the inability of some older workers to maintain the employment secured in the short-term.
- Long-tenured workers who started their Skills Development participation between 2007 and 2009 had increases in earnings in the second and third years after participation but these increases did not compensate for losses in earnings during the participation years and in the first year after participation. Participants did increase their incidence of employment and decrease their use of EI after participating in this program.
Former claimants
As shown in Table B3 in Appendix B, former claimants who started their Skills Development participation between 2002 and 2005 had incremental gains in earnings in all five-year post-program period. As shown in Figure 3, earnings continuously increased over time with gains ranging from $496 in the first year post-program to $2,521 in the fifth year. As well, participants had increases in incidence of employment ranging between 3 and 5 percentage points over the five-year post-program period.
Their use of social assistance decreased in all years after participation by annual averages ranging between $195 and $247 while their overall dependence on income support decreased by averages ranging between 2.3 and 3.3 percentage points. While former claimants had a decrease of $54 in the amount of EI benefit collected in the first year after participation, they had increases in their use of EI in all remaining years. These increases ranged between $171 and $217.
Former claimants who started their Skills Development participation in 2007 and 2008 had comparable increases in incidence of employment and comparable decreases in social assistance use and dependence on income support after participation. Their results for earnings and EI use were partially different compared to the 2002-2005 participants. Those who started participation in 2007 or 2008 had a decrease in earnings in the first year after participation but increases in the second and third year. As well, they had a decrease in EI use in the first year after participation but increases in the second and third years post-program.
Overall, former claimants increased their use of EI following participation. This indicates the inability of some former claimants to maintain the employment secured in the short-term. It can also be argued that the increase in EI use is an indication of increase labour market attachment for this client group since they did experience increases in employment earnings and incidence of employment as well as a decrease in the use of social assistance. As a reminder, former claimants are participants for whom the EI benefit period ended up to three years pre-participation.
Results by sub-groups showed that:
- Skills Development was effective at improving the earnings and incidence of employment of youth who started participation between 2002 and 2005. The program was also effective at reducing their use of social assistance after participation.
- Skills Development was also effective at improving the earnings and incidence of employment of older workers who started participation in the 2002/05 period. Most of the results for other indicators were not statistically significant.
- Long-tenured workers who started program participation between 2007 and 2009 had increases in earnings in the second and third years after participation but these increases did not compensate for the decreases experienced during and right after participation. They improved their incidence of employment and decreased their use of social assistance in all years after participation. As well, they had a short-term decrease in EI use but increases in the second and third years post-program.
2.2.5 Cost-benefit results
As shown in Table B4 in Appendix B, in order to recover the costs, the benefits of Skills Development for society would need to be maintained 7.4 years after participation for active claimants and 8.6 years for former claimants.
2.2.6 Challenges and lessons learned about skills development design and delivery
Based on a document review and key informant interviews completed in 9 P/Ts in summer 2015
- Managers and caseworkers involved in program delivery and interviewed during the summer of 2015 spoke about challenges related to program participation and delivery:
- Geographic locations and remoteness pose barriers to accessing training due to factors such as lack of training options in certain areas or lack of transportation (9 P/Ts).
- Caseworkers need extra time and resources to case manage participants with multiple barriers (8 P/Ts). As well, they may not be fully equipped to assist participants who face significant challenges or mental health issues (3 P/Ts).
- EI eligibility can be a barrier to low-skilled individuals (including those with multiple barriers to employment) who are in need of skills training but who cannot qualify for EI (5 P/Ts).
- The lack of essential skills (5 P/Ts), learning disabilities (3 P/Ts) and literacy issues (3 P/Ts) are common barriers to accessing and completing training. Individuals lacking the pre-requisite skills needed to succeed in occupational-specific training may drop out of more advanced related training.
- Some participants face financial constraints during the waiting period prior to the start of training and this may cause some to drop out (4 P/Ts). For example, participants may exhaust all their EI benefits while going through the Skills Development application process and waiting for the training to start (3 P/Ts).
- There is a lack of awareness about the program (4 P/Ts) by potential participants.
- Early engagement of EI claimants is difficult since Service Canada does not refer recent EI claimants to P/T offices (3 P/Ts).
Key informants also spoke about best practices and lessons learned for this program. These include:
- Requesting prospective participants to undertake labour market research and interviews with employers and training institutions helps them to take ownership of their return-to-work process and make an informed decision about training (8 P/Ts).
- Regular coordination and communication among caseworkers, training providers and other stakeholders is important (7 P/Ts).
- The financial assistance to cover child care expenses (7 P/Ts) living allowance (4 P/Ts), transportation (3 P/Ts), and tuition (3 P/Ts) could be increased in order to improve access and completion of training.
- Flexible or multi-stage training plans that consider occupational, life and essential skills along with occupational training is beneficial for individuals facing multiple barriers to employment (6 P/Ts).
- Regular monitoring of participants during and after training is beneficial particularly for individuals with multiple barriers. It allows for the identification of additional supports that can be offered if participants encounter challenges while in training (6 P/Ts).
- Conducting more learning disability and skills assessments at the outset of participation allow for the identification of supports needed by participants to succeed in training (4 P/Ts).
- Extending the financial assistance after the training period would help the participant while he/she is undertaking a job search (4 P/Ts).
- It was suggested to increase the living allowance (4 P/Ts) and the funding for transportation (3 P/Ts), and tuition (3 P/Ts). It was also suggested to provide disability-related employment and financial supports (2 P/Ts).
2.3 Skills Development - Apprentices
2.3.1 Program description
Based on a document review and key informant interviews completed in 10 P/Ts in summer 2015
The objective of the program is to help apprentices become skilled tradespeople and to increase their labour market attachment. Program participants have generally chosen a career and are already attached to the labour market. The apprenticeship process involves on-the-job learning and technical training in a classroom setting which may range from 4 to 12 weeks per year (4 P/Ts). Apprentices who have worked enough hours to qualify for EI can apply to receive EI Part I benefits while on training.
The program provides financial assistance to EI eligible apprentices to help them offset the costs they incur while they attend technical training. It covers the following expenses:
- Transportation/travel (9 P/Ts)
- Childcare and/or dependent care (8 P/Ts)
- Living away from home allowance (8 P/Ts)
- Living allowance (7 P/Ts)
- Tuition (7 P/Ts)
- Books (4 P/Ts)
- Essential skills, academic upgrading, tutoring, salary of learning strategists (3 P/Ts)
- Supplies, tools and equipment (2 P/Ts)
The level of funding is based on the needs of apprentices, the location of the training, and any fees paid by the apprentices. Funding is generally attributed based on fixed rates.
2.3.2 Program delivery
Based on a document review and key informant interviews completed in 10 P/Ts in summer 2015
Since participants are generally already employed, they are not necessarily case managed. In fact, at least 5 P/Ts do not provide case management as part of the program. Apprentices may receive case management services in 3 jurisdictions but this is not a requirement. Overall, out of the 3 P/Ts that provide case management services, 2 confirmed that only a small share of participants received such services.
The application for funding differs across P/Ts. The participant most often completes the application on his/her own:
- In 3 P/Ts, the application is self-directed and the participant does not have any contact with a caseworker.
- In 4 other P/Ts, the caseworkers meet with the apprentices either before they start their training or during the first days of their training to discuss what financial supports are available and to determine the financial needs of apprentices.
- In two other P/Ts, the application is self-directed for some apprentices and involves meeting with a caseworker for others (for example, the caseworkers meet with the first-year apprentices to complete the application but upper-year apprentices apply on their own).
At least 3 P/Ts send an application or information package to the apprentices, which includes information on how and where to apply for funding, either before they start their training or at the time of starting their training.
2.3.3 Profile of Skills Development-Apprentices participants
Table C1 in Appendix C presents the socio-demographic characteristics of active and former claimants who started receiving funding in 2003/05 and in 2013/14.
Both cohorts of active claimants were predominantly male (93% and 95% respectively). These participants were fairly young but the less recent participants were younger as 84% of them were below 34 years of age compared to 72% for the 2013/14 cohort. Both the 2003/05 and 2013/14 participants most frequently had an occupation requiring college of apprenticeship training prior to participation (84% and 90% respectively). The most recent participants had higher earnings in the year before participation ($33,250) compared to the 2003/05 participants.
Former claimants who started receiving funding from 2003 to 2005 and from 2013 to 2014 were mainly male (83% and 89% respectively) and below 34 years of age (68% and 72%). Most of them had an occupation requiring college or apprenticeship prior to participation and the incidence was higher for the most recent participants (70%) when compared to the 2003/05 participants (48%). As well, in the year before participation, the most recent participants had higher earnings from employment ($23,345 versus $18,388). They also had a lower incidence of EI use (49% versus 55%) and social assistance use (4% versus 6%).
2.3.4 Labour market outcomes
The labour market outcomes were based on individuals who began their participation during the 2003 to 2005 period. Statistics presented in Tables C2 and C3 in Appendix C focused on 5 years prior and 7 years after the program start year.
Active claimants
As shown in Figure 4, program participants increased their average earnings from $14,965 in the 5th year pre-program to $58,245 in the 7th year after the program start year. The proportion of employed participants declined by 1 to 2 percentage points annually after the program start year, but remained at around 95%. The proportion of participants on EI Part I decreased from 99% in the program start year to 23% in the 7th year after the program start year. Participants decreased their dependence on income support from 15% in the program start year to 5% in the 7th year after participation.
Figure 4 presents the average employment earnings for active employment insurance claimants who participated in the Skills Development-Apprentices program between the 5th year pre-program participation and the 7th year after the start of program participation.
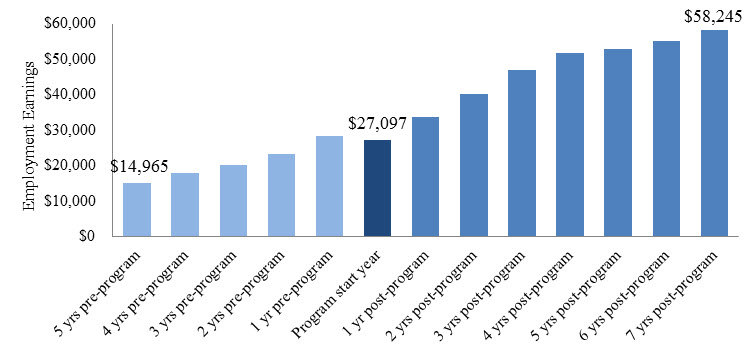
Figure 4 -Text description
| Employment earnings | |
|---|---|
| 5 yrs pre-program | $14,965 |
| 4 yrs pre-program | $17,821 |
| 3 yrs pre-program | $20,243 |
| 2 yrs pre-program | $23,379 |
| 1 yr pre-program | $28,199 |
| Program start year | $27,097 |
| 1 yr post-program | $33,817 |
| 2 yrs post-program | $40,107 |
| 3 yrs post-program | $46,861 |
| 4 yrs post-program | $51,817 |
| 5 yrs post-program | $52,845 |
| 6 yrs post-program | $55,112 |
| 7 yrs post-program | $58,245 |
| avg | $36,193 |
Former claimants
As shown in Figure 5, employment earnings increased steadily for former claimants from $14,885 in the 5th year before participation to $43,400 in the 7th year after the participation start year. On average, 93% to 97% of former claimants were employed before participation while 88% to 95% were employed after the start of participation. The proportion of former claimants receiving EI benefits decreased from 54% to 37% between the 1st and 7th years after the program start year. The level of dependence on income support of former claimants increased from 15% in the 5th year to 22% in the 1st year pre-program, and decreased from 17% to 14% between the program start year and the 7th year post program.
Figure 5 presents the average employment earnings for former employment insurance claimants who participated in the Skills Development-Apprentices program between the 5th year pre-program participation and the 7th year after the start of program participation.
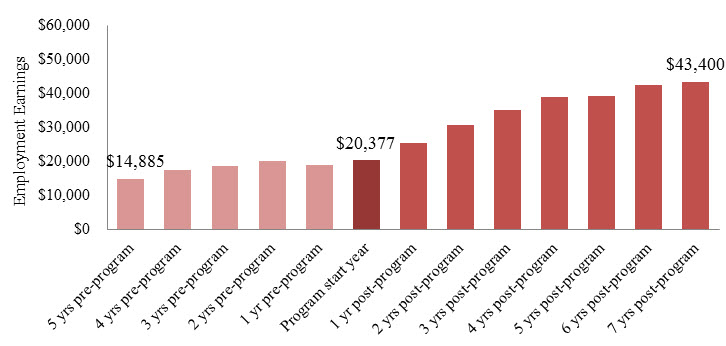
Figure 5 -Text description
| Employment earnings | |
|---|---|
| 5 yrs pre-program | $14,885 |
| 4 yrs pre-program | $17,425 |
| 3 yrs pre-program | $18,662 |
| 2 yrs pre-program | $20,003 |
| 1 yr pre-program | $18,997 |
| Program start year | $20,377 |
| 1 yr post-program | $25,333 |
| 2 yrs post-program | $30,651 |
| 3 yrs post-program | $35,146 |
| 4 yrs post-program | $38,994 |
| 5 yrs post-program | $39,253 |
| 6 yrs post-program | $42,369 |
| 7 yrs post-program | $43,400 |
| avg | $28,115 |
2.3.5 Challenges and lessons learned about Skills Development-Apprentices design and delivery
Based on a document review and key informant interviews completed in 10 P/Ts in summer 2015
Existing Canadian literature reports a fairly high non-completion rate among apprentices (40-50%)Footnote 8. Furthermore, subject matter literature revealed that despite the growth in apprenticeship registrations in Canada, there has not been a corresponding increase in completionsFootnote 9. While available data do not provide reliable information on completion and non-completion rates of participants, key informants from 6 P/Ts confirmed this trend and explained what factors could lead the apprentices to dropping out. These include:
- Financial difficulties (for example, not being able to live on EI benefits while on training) (10 P/Ts).
- Apprentices leaving the trade (7 P/Ts).
- Employers were unwilling or unable to release their apprentices for training (7 P/Ts).
- Lack of training opportunities in local communities (7 P/Ts).
- Labour market fluctuations and/or low demand for certain trades (6 P/Ts).
- Lack of or low level of essential skills (6 P/Ts).
- Delays in getting EI benefits (for example, EI eligibility is not confirmed until training is almost complete) (5 P/Ts).
Key informants also highlighted lessons learned related to program design and delivery or apprenticeship in general. These include:
- Providing more financial supports for apprentices (6 P/Ts)
- Providing essential skills training to individuals facing multiple barriers to employment prior to the technical training sessions (6 P/Ts).
- Conducting needs assessments to identify all potential barriers to training at the beginning of the apprenticeship process (4 P/Ts).
- Providing apprentices with training on how to create and maintain a budget (3 P/Ts).
2.4 Targeted Wage Subsidies
2.4.1 Program description
Based on a document review and key informant interviews completed in 8 P/Ts in summer 2015
The program provides a subsidy to employers to cover a portion of the participant’s salary. The objective of the program is to encourage employers to hire unemployed EI-eligible individuals who they would not normally hire, to help them gain work experience. In this regard, key informants in 5 P/Ts confirmed that employers are generally hiring those they would not have otherwise hired without the assistance provided under the program.
The maximum level of the subsidy ranges from 50% to 100% of the employee’s wage and its duration ranges from 16 to 52 weeks. In most (6) P/Ts, the rate and level of subsidy provided are negotiated individually with employers. The Targeted Wage Subsidies program also funds employment-related costs such as disability supports (for example, adaptive tools or specialised equipment) (4 P/Ts); work supplies and safety equipment (2 P/Ts); and supplemental training or other courses (for example, workplace safety, computer training) (2 P/Ts).
The wage subsidy is usually used to fund full-time positions but in 2 P/Ts, seasonal, temporary or part-time positions may be considered in unique circumstances. Wage subsidies are generally not confined to specific occupations or industries (6 P/Ts) and subsidies are offered to a broad range of occupations that include entry-level and more highly skilled jobs. The wage subsidy is expected to lead to a permanent position. In this regard, 3 P/Ts conducted systematic follow-ups with participants in order to examine whether they remained employed with the same employer after the end of the subsidy. The retention levels varied in these 3 P/Ts from 36.5% at 12 weeks after the subsidy, 50% after one year and 31% after 5 years.
2.4.2 Program delivery
Based on a document review and key informant interviews completed in 8 P/Ts in summer 2015
The Targeted Wage Subsidies program is delivered by government caseworkers (3 P/Ts), caseworkers at third-party service providers (2 P/Ts) or a combination or both (3 P/Ts). Applications for participation may be driven primarily by the employer (2 P/Ts), primarily by the participants (2 P/Ts), or a mix of both (8 P/Ts).
Figure 6 illustrates the application process depending on whether this process was driven by an employer or a participant. The figure presents key steps of the process from the initial assessment to the start of program participation. Whether the wage subsidy is participant or employer-driven, in 7 out of 8 P/Ts, participants meet with caseworkers and a needs assessment is conducted where work history, skills levels, goals and barriers to employment are identified and evaluated.
Figure 6 describes the various steps of the Targeted Wage Subsidies application process. This process can be driven by the employer or the participant.
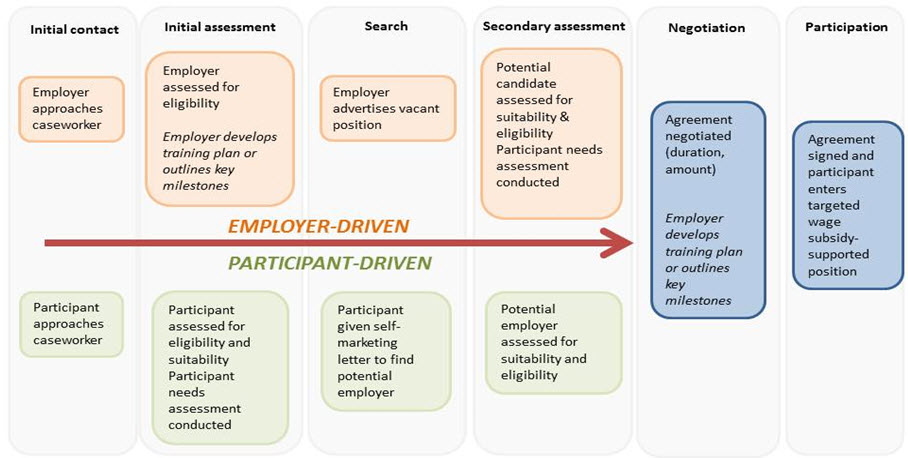
Figure 6 -Text description
Employer-driven Targeted Wage Subsidies application process
- Initial contact: Employer approaches caseworker
- Initial assessment: Employer assessed for eligibility. Employer develops training plan or outlines key milestones
- Search: Employer advertises vacant position
- Secondary assessment: Potential candidate assessed for suitability and eligibility. Participant needs assessment conducted
- Negotiation: Agreement negotiated (duration, amount). Employer develops training plan or outlines key milestones.
- Participation: Agreement signed and participant enters targeted wage subsidy-supported position.
Participant-driven Targeted Wage Subsidies application process
- Initial contact: Participant approaches caseworker
- Initial assessment: Participant assessed for eligibility and suitability. Participant needs assessment conducted
- Search: Participant given self-marketing letter to find potential employer.
- Secondary assessment: Potential employer assessed for suitability and eligibility.
- Negotiation: Agreement negotiated (duration, amount). Employer develops training plan or outlines key milestones.
- Participation: Agreement signed and participant enters targeted wage subsidy-supported position.
Caseworkers may recommend that participants enter the program if they are lacking work experience or require the development of work-related skills (5 P/Ts). In two P/Ts, priority is given to individuals with barriers to employment or who may be in one of the following sub-groups: Indigenous peoples, persons with disabilities, visible minorities, immigrants, older workers and recent post-secondary graduates. In addition, a wage subsidy may be used for an unemployed apprentice who needs to be attached to an employer to continue progressing in their apprenticeship (3 P/Ts).
The length of the application and approval process ranges from 3 days to 8 weeks. In 5 out of 8 P/Ts, the application and approval process takes less than 2 weeks.
2.4.3 Profile of Targeted Wage Subsidies participants
Socio-demographic statistics presented in Table D1 in Appendix D show that active claimants who started participation from 2002 to 2005 and 2007 to 2008 were primarily male (55% and 53% respectively). One third of those who started participating between 2002 and 2005 were over 45 years of age and this proportion was even higher for the most recent participants (42%). Both cohorts most frequently occupied jobs requiring secondary or occupational training prior to participation (36% and 38% respectively). The most recent participants had higher earnings from employment in the year before participation ($20,866 versus $18,511).
More than half of the former claimants who started participation either between 2002 and 2005 or between 2007 and 2008 were male (53% and 51% respectively). Slightly less than one third of participants in these two cohorts were between 25 and 34 years of age (31% and 30% respectively) and the proportions of participants above 45 year of age were in a similar range for both cohorts (29% and 34% respectively). These participants most frequently had occupations requiring secondary or occupational training prior to participation (35% and 36% respectively). Both the 2002/05 and 2007/08 cohorts had similar earnings from employment in the year before participation ($10,971 and $11,302 respectively).
2.4.4 Incremental impacts
Active claimants
As shown in Table D2 in Appendix D, active claimants who started participation in Targeted Wage Subsidies between 2002 and 2005 had incremental gains in earnings in all years after participation and those gains grew in size over the years. Gains in earnings increased from $661 in the first year to $1,930 in the fifth year (see Figure 7). They also had incremental increases in the incidence of employment ranging between 4.9 and 5.1 percentage points in all post-program years. Their use of social assistance decreased in all years post-program with annual reductions in the $58 to $79 range. Active claimants had incremental increases in the number of weeks in receipt of EI ranging between 0.3 and 0.5 weeks per year over the five post-program years. When interpreting these results, readers should keep in mind that participants collect insurable hours under EI while working in the subsidized job. This may allow them to start claiming EI if they are not able to maintain their subsidized job.
Figure 7 illustrates the incremental gains in earnings for active and former employment insurance claimants who participated in the Targeted Wage Subsidies program for each of the 5 years following participation
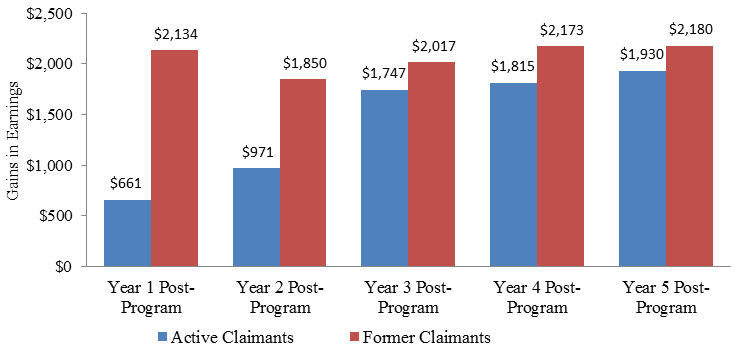
Figure 7 -Text description
| Gains in earnings | Year 1 post-program | Year 2 post-program | Year 3 post-program | Year 4 post-program | Year 5 post-program |
|---|---|---|---|---|---|
| Active claimants who participated in the Skills Development program | $661 | $971 | $1,747 | $1,815 | $1,930 |
| Former claimants who participated in the Skills Development program | $2,134 | $1,850 | $2,017 | $2,173 | $2,180 |
Active claimants who started participation in 2007 or 2008 also had increases in earnings and incidence of employment as well as decreases in social assistance use in all years after participation. The incremental impacts for each of these three indicators were generally larger than those found for the 2002/05 participants. Most of the results for EI use were not statistically significant for the 2007/08 cohort.
Overall, despite the increase use of EI, active claimants improved their labour market attachment through increases in earnings and incidence of employment, and a decrease in the use of social assistance.
Results for the various sub-groups showed:
- Youth (under 30 years old) who started participation between 2002 and 2005 had increases in earnings and incidence of employment in most post-program years. Their use of social assistance decreased after participation but their use of EI generally increased.
- Older workers (55 years old and over) who started participation between 2002 and 2005 improved their earnings and incidence of employment. In fact, they had the largest gains of all active claimants examined. Like youth and all active claimants, their use of EI generally increased after participation.
- Unlike other groups, long-tenured workers who started participation between 2007 and 2009 had decreases in earnings in the first two years after program participation. Their incidence of employment increased but the time spent on EI generally increased as well.
Former claimants
As shown in Table D3 in Appendix D, the Targeted Wage Subsidies program was effective at improving the earnings and incidence of employment of former claimants who started their participation between 2002 and 2005. As shown in Figure 7, participants had incremental gains in earnings ranging between $1,850 and $2,180. As well, they had incremental gains in incidence of employment ranging between 5.5 and 6.9 percentage points.
Their use of social assistance also decreased in all years after participation by annual averages ranging between $266 and $387. As well, their level of dependence decreased between 0.5 and 2.2 percentage points per year. Former claimants had incremental increases in EI use in all years after participation. These increases were in the $296 to $679 and 0.7 to 2.4 weeks range. When interpreting these results, readers should keep in mind that participants collect insurable hours under EI while working in the subsidized job. This may allow them to start claiming EI if they are not able to maintain their subsidized job.
The results for former claimants who started participation in 2007 or 2008 were similar in terms of direction and size. This cohort also improved its earnings and incidence of employment and reduced its use of social assistance and level of dependence on income support while increasing its use of EI.
Overall, former claimants increased their use of EI following participation. This indicates the inability of some former claimants to maintain the employment secured in the short-term. It can also be argued that the increase in EI use is an indication of increase labour market attachment for this client group since they did experience increases in employment earnings and incidence of employment as well as a decrease in the use of social assistance. As a reminder, former claimants are participants for whom the EI benefit period ended up to three years pre-participation.
Results were generally in the same directions for other groups of former claimants:
- Youth and older workers who started participation between 2002 and 2005 and long-tenured workers who started participation between 2007 and 2009 had increases in earnings and incidence of employment in all years post-program. They also decreased their use of social assistance while their use of EI generally increased after program participation.
2.4.5 Cost-benefit results
For active claimants, as shown in Table D4 in Appendix D, the benefits of Targeted Wage Subsidies recovered the costs within 5.9 years after participation from the society perspective. As well, the benefits of the program for former claimants exceeded the costs during the second year of the participation period.
2.4.6 Challenges and lessons learned about Targeted Wage Subsidies design and delivery
Based on a document review and key informant interviews completed in 8 P/Ts in summer 2015
Despite improving the labour market attachment of participants, the use of the program has been falling in recent years. According to the EI Monitoring and Assessment Reports, the proportion of new interventions decreased from 3% to 1% of total EBSM interventions between 2002/03 and 2014/15, while investments in the program remained stable at 6% of total EBSM expenditures.
Key informants in 7 P/Ts confirmed the decline and identified potential reasons including:
- The reporting requirements for the employers make the subsidy less appealing (7 P/Ts).
- Employers are unaware of the program due to a lack of marketing or outreach (5 P/Ts).
- The subsidy and the self-marketing letter given to participants to promote the program create a negative perception of the quality of candidates among employers (5 P/Ts).
- Mismatches between employers’ needs and the skills of available candidates (4 P/Ts).
- Some employers are hesitant to work with the government due to past negative experiences (3 P/Ts).
- Local economic conditions have a direct impact on the use of the program by employers (3 P/Ts). For example, strong local economies with a low unemployment rate mean that employers are more willing to hire individuals without the subsidy (2 P/Ts).
- The length of time to secure program approval is an issue for employers (2 P/Ts) who want the participant to start working immediately.
Key informants highlighted a number of lessons learned related to the program design and delivery. The main lessons learned are detailed below:
- Matching participants’ skills with employer needs in order to enhance retention (5 P/Ts).
- There is a need to increase the awareness of the program. For example, there is a need for service delivery organizations to have job developers responsible for conducting outreach with employers and matching employers and more difficult-to-employ participants (3 P/Ts).
- Have a simple, easy to use application process for employers and ensure timely approval. Using electronic systems can help reduce the processing time for employers when they have to submit monthly and quarterly updates (3 P/Ts).
- Have sufficient flexibility to adjust the program in order to meet the needs of persons with disabilities (for example, level of subsidy and hours of work requirements) (3 P/Ts).
- Ongoing monitoring is important. For example, conducting regular monitoring and site visits helps to ensure that employers respect the training provisions established in the signed contract (3 P/Ts). As well, having ongoing contacts with employers and participants helps to resolve issues during the subsidy period (2 P/Ts).
2.5 Self-Employment
2.5.1 Program description
Self-Employment helps individuals create jobs for themselves by starting a business or otherwise becoming self-employed. It provides financial assistance and business planning advice to EI eligible participants to help them start their own business. This financial assistance is intended to cover personal living expenses and other expenses during the initial stages of the business. Investments in the program declined from 8% to 6% of total EBSM expenditures between 2002/03 and 2014/15.
2.5.2 Profile of Self-Employment participants
As shown in Table E1 in Appendix E, active claimants who started participation between 2002 and 2005 were mainly male (58%) while those who started in 2007 or 2008 were almost evenly split between male and female. Four percent of participants in both cohorts were under 25 years of age while the remaining participants were almost evenly distributed across other age categories (in other words, 25-34, 35-44 and 45 and over).
Both the 2002/05 and 2007/08 participants most frequently had occupations requiring college or apprenticeship prior to participation (37% and 39% respectively). Notably, 26% of the 2002/05 and 23% of the 2007/08 participants had occupations requiring either university or managerial skills. This is a higher proportion than for other EBSM participants. In the year before participation, the 2002/05 participants earned more from employment ($27,719) than the more recent participants ($25,801).
Former claimants who started program participation in 2002/05 were almost evenly split between male and female. The distribution was different for the most recent participants whom included more female (58%) than male (42%). Participants in both cohorts had a similar age distribution with 3-4% being less than 25 years old and the remaining participants being fairly evenly distributed across other age categories (in other words, 25-34, 35-44 and 45 and over).
Both the 2002/05 and 2007/08 participants most frequently had occupations requiring either college/apprenticeship (32% and 33% respectively) or secondary/occupational training (31% each) prior to participation. As well, respectively 24% and 23% of these participants had an occupation requiring either university or managerial skills which is also higher than usually seen for other EBSMs. Both cohorts had similar earnings in the year before participation ($11,387 and $11,642).
2.5.3 Challenges in measuring Self-Employment incremental impacts
Like other EBSMs, incremental impacts were estimated for Self-Employment participants in the 2002/05 and 2007/08 periods. Results showed large decreases in employment/self-employment earnings and decreases in the incidence of employment. As well, compared to similar non-participants, participants decreased their use of EI and social assistance and reduced their dependence on government income support.
Detailed estimates are presented in Tables E2 and E3 in Appendix E. However, they are not discussed in the report since they may not provide an accurate depiction of the financial well-being of participants in the post-program period. Impacts were examined using individual earnings reported in the T1 and T4 taxation files from Canada Revenue Agency, and measured relative to active claimants who did not participate in SE and may have been in any employment/unemployment situation following participation (for example, unemployed, paid employee or self-employed).
According to a study from Statistics Canada, self-employed individuals in Canada have a lower average annual income than paid employees ($46,200 versus $52,400 in 2009), but the average net worth of their households is 2.7 times greater than that of the paid employee households, which indicates that some self-employed individuals may leave funds within their business for reinvestment purposes.Footnote 10 Overall, this suggests that looking at individual earnings alone, without taking the net worth into consideration, may not provide a fair assessment of how well participants are doing financially after participation.
As well, currently, little is known about the design and delivery of this program. In particular, there is a lack of understanding around the role played by this program in helping future entrepreneur to implement viable business plans and to develop their entrepreneurship skills. Overall, it is not clear whether participant’s success in improving their labour market attachment through self-employment is more closely associated with their business idea and their entrepreneurship skills than the assistance provided under the Self-Employment program.
2.6 Job Creation Partnerships
2.6.1 Program description
Job Creation Partnership projects provide participants with opportunities to gain work experience. Participants continue to receive their EI Part I benefits or receive an allocation while they are employed by a project funded under the program. Activities of the project help develop the community and the local economy. Program expenditures decreased from 4% to 2% of total EBSM expenditures between 2002/03 and 2014/15.
2.6.2 Profile of Job Creation Partnerships participants
Active claimants
As shown in Table F1 in Appendix F, the proportion of female active claimants who participated in Job Creation Partnerships increased over time. Specifically, the 2002/05 participants included 49% female while the share increased to 55% for the 2007/08 cohort. As well, the most recent participants were older as the share of individuals over 45 years old increased from 28% for the 2002/05 cohort to 40% for the 2007/08 cohort. Participants in both cohorts most frequently had occupations requiring secondary or occupational training prior to participation (34% of participants in each cohort). They also had similar employment earnings in the year before participation ($15,733 for 2002/05 participants and $14,833 for 2007/08 participants).
Former claimants
Former claimants who participated in Job Creation Partnerships in 2002/05 were more likely to be male (55%) while those who participated in 2007/08 were more likely to be female (52%). Like active claimants, the less recent participants were more likely to be younger as compared to the more recent participants as 29% of those who participated in 2002/05 were over 45 years of age while this share increased to 38% for those participated in 2007/08. Participants in both cohorts most frequently had an occupation requiring secondary or occupational training before participation. These represented 34% of 2002/05 participants and 35% of 2007/08 participants. In the year before participation, both the 2002/05 and 2007/08 participants had similar level of earnings ($8,776 and $7,811, respectively).
2.6.3 Incremental impacts
Active claimants
Active claimants who participated in Job Creation Partnerships between 2002 and 2005 had incremental gains in earnings and incidence of employment in all years after participation. As shown in Table F2 in Appendix F, these gains ranged between $1,899 and $4,409 for earnings (see Figure 8) and between 5.5 and 6.3 percentage points for incidence of employment. These participants reduced their use of EI benefits in the first ($549) and second years ($220) after participation while most results for social assistance use were not statistically significant. Overall, these participants reduced their level of dependence on income support in the first four years after participation (between 1.1 and 3.1 percentage points).
Figure 8 presents the incremental gains in earnings for active and former employment insurance claimants who participated in the Job Creation Partnerships program for each of the 5 years following participation.
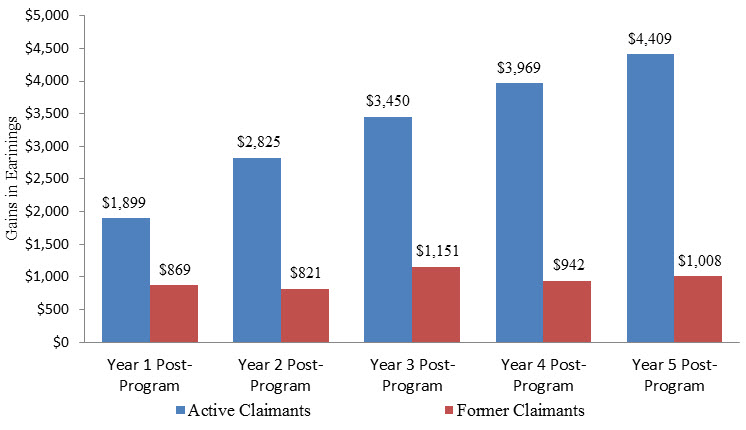
Figure 8 -Text description
| Gains in earnings | Year 1 post-program | Year 2 post-program | Year 3 post-program | Year 4 post-program | Year 5 post-program |
|---|---|---|---|---|---|
| Increased earnings of active Job Creation Partnerships participants relative to non-participants | $1,899 | $2,825 | $3,450 | $3,969 | $4,409 |
| Increased earnings of former Job Creation Partnerships participants relative to non-participants | $869 | $821 | $1,151 | $942 | $1,008 |
Active claimants who participated in Job Creation Partnerships in 2007 or 2008 had increases in earnings in the first two years after participation and those were smaller in size when compared to the gains found for the 2002/05 participants. As well, like the 2002/05 participants, active claimants who participated in the program in 2007/08 had increases in incidence of employment in all years after participation but these gains were also smaller in size. These individuals had decreases in the their use of EI benefits and overall level of dependence on income support in the first two years after participation and decreases in their use of social assistance benefits in all three years.
Impacts by sub-groups were as follows:
- Youth (under 30 years old) who participated in the program between 2002 and 2005 had increases in earnings and incidence of employment in all years after participation but decreases in EI use and dependence on income support only in the first year after program completion. Results for other years and for social assistance use were generally not statistically significant.
- Older workers (55 years old and over) who participated in the program between 2002 and 2005 also improved their earnings and incidence of employment over most of the five post-program years. Their use of EI increased in the medium-term after program participation. Results for social assistance and dependence on income support were not statistically significant.
- Long-tenured workers who started program participation between 2007 and 2009 increased their incidence of employment in all three years after program participation and decreased their use of EI in the first post-program year. Results for other indicators were not statistically significant.
Former claimants
As shown in Table F3 in Appendix F, the Job Creation Partnerships program was effective at improving the earnings of former claimants who participated in the 2002 to 2005 period. These individuals experienced gains ranging between $821 and $1,151 in all years after participation (see Figure 8). As well, they had gains in incidence of employment ranging between 3.8 and 4.9 percentage points over the same years. These increases in earnings and incidence of employment were accompanied by increases in EI use ranging between $144 and $284 in the second to fifth year after participation. On the other hand, their use of social assistance and overall dependence on income support decreased over the entire post-program period by annual averages ranging between $158 and $277 for social assistance benefits and between 1.1 and 3.9 percentage points for dependence on income support.
Overall, former claimants who participated in the program between 2002 and 2005 increased their use of EI following participation. This indicates the inability of some former claimants to maintain the employment secured in the short-term. It can also be argued that the increase in EI use is an indication of increase labour market attachment for this client group since they did experience increases in employment earnings and incidence of employment as well as a decrease in the use of social assistance. As a reminder, former claimants are participants for whom the EI benefit period ended up to three years pre-participation.
Unlike the less recent participants, former claimants who started participation in 2007 and 2008 had decreases in earnings after participation while their results for incidence of employment were not statistically significant at the 95% level and above. Results for other indicators generally followed the same patterns as those found for 2002/05 participants with increases in EI use as well as decreases in social assistance use and dependence on income support over most of the post-program period.
There were some variations in the results for the three sub-groups of former claimants examined:
- Results for youth former claimants who participated in the program between 2002 and 2005 followed similar trends as those found for all former claimants. Youth experienced increases in earnings and incidence of employment as well as decreases in social assistance use over most post-program years. They increased their use of EI over that period. In terms of the extent of impacts, their gains in earnings were higher than those found for all former claimants.
- Impacts on earnings and EI use for older workers who participated in the program between 2002 and 2005 were generally not statistically significant at the 95% level or above. The results however show increases in incidence of employment as well as decreases in social assistance use and dependence on income support over most years after participation.
- Results for long-tenured workers who participated in the program between 2007 and 2009 followed similar trends as those found for all former claimants who participated in the same period. Long-tenured workers had decreases in earnings after participation while their impacts on incidence of employment were not statistically significant. Their use of EI generally increased while their use of social assistance decreased in the short term after participation. Impacts on dependence on income support were not statistically significant.
2.6.4 Cost-benefit results
As shown in Table F4 in Appendix F, the benefits of Job Creation Partnerships exceeded the costs of those programs within 5.9 years for active claimants. The results were different for former claimants where the benefits may never recover the costs. Overall, when interpreting cost-benefit results for Job Creation Partnerships, it should also be acknowledged that program funding helps develop the community and the local economy and none of those benefits were accounted for in the calculations as they are difficult to quantify.
2.7 Employment Assistances Services
2.7.1 Program description
Based on a document review from 8 P/Ts and key informant interviews completed in 10 P/Ts in summer 2013
The objective of Employment Assistance Services is to assist unemployed individuals to prepare for, obtain and maintain employment. This support measure includes a wide range of assisted and unassisted employment-related services and resources which are made available in order to respond to the career, employment and training needs of unemployed individuals. As well, some services are targeted directly to meet the human resource needs of employers. Employment Assistance Services are often provided in conjunction with Employment Benefits such as Skills Development but some individuals may only access the services provided under Employment Assistance Services. The share of the program among the total EBSM expenditure increased from 28% to 35% between 2002/03 and 2014/15.
Employment Assistance Services services may include:
- Employment resource centres providing equipment (for example, computers, phones.), local labour market information and resources that can assist in job search, career planning as well as learning about occupational requirements and available training programs.
- Needs/employability assessment, career advice and planning, employment counselling and return to work action plans are activities carried out to determine the employment and training related needs of participants. Once their needs are determined, the participants work with a case manager to develop a return to work action plan which addresses identified employment barriers and activities that will lead to employment.
- Individualized case management services and supports provided by case managers on an ongoing basis in order to monitor the participants’ progression in implementing their return to work action plan.
- Specialized assessments and diagnostics to assess the implications of physical, social, intellectual and/or psychological traits on the participant’s ability to participate in specific types of employment. These services can include psychological, functional capacity, learning disability and ergonomic assessments.
- Job preparation and job search activities provide individualized services in support of a job search such as career clarification, goal setting, resume writing, interview and job preparation (for example, orientation to workplace rules and employer expectations, rights and responsibilities of employees) as well as life skills workshops.
- Job finding clubs are employment group services offered to assist participants in improving their job searching skills.
- Job placement and matching services are provided to participants who are unlikely to succeed in conducting their own job search. Services include skill analysis, job search techniques, interview skills, résumé writing, self-marketing, tapping into the hidden job market and/or job retention skills, matching of skills and interests with employment opportunities and employers’ needs. In some P/Ts, funding incentives are provided to either the employer or the participant in order to remove financial barriers to participating in the placement program.
- Work exploration provides more structured and individualized support for participants who have demonstrated challenges in maintaining employment, or participants with a disability who need support to transition to an identified employment opportunity. Services can include, job shadowing, virtual work experience, job placement services and work exploration.
- Job retention services provide longer-term support to participants to help them obtain either employment advancement or longer-term attachment to the labour force. These services are provided mainly to participants with multiple barriers to employment.
- Job coaching provides employment support to assist participants in developing essential knowledge and skills needed in their new employment. On-site job coaching is also available to those who are facing multiple barriers to employment and require additional support in obtaining some degree of self-sufficiency in their position.
- Short-term training is provided to job ready participants to support the completion of short duration training certificates/courses (for example, first aid certification, food safety).
- Workshops aim to address a variety of career and employment needs such as job search techniques, resume writing, and marketing skills.
- Labour market information products are made available to job seekers to support them in their job search, as well as in their training and career decision making. These products are also made available to employers to assist them in hiring, training and retraining workers, and in developing human resource strategies.
- Services to employers are provided to employers in situations where businesses and employees are affected by production slowdowns or layoffs as well as to address labour shortages through training, job placement and matching, and retention. Some P/Ts offer employers the possibility of advertising for job openings.
2.7.2 Program delivery
Based on a document review from 8 P/Ts and key informant interviews completed in 10 P/Ts in summer 2013
Among the 10 P/Ts examined in the study, Employment Assistance Services are most often delivered by third party service providers (5 P/Ts). Three P/Ts use a mixed approach where services are delivered by both government staff and service providers while two other jurisdictions deliver Employment Assistance Services directly. Service providers from 8 P/Ts confirmed that labour market information is used to support the provision of Employment Assistance Services. Among other things, labour market information can be used to support participants in applying for Skills Development training, to inform participants about the local labour market and employment opportunities, for the provisions of workshops or to create a job board that is available within the employment resource centres.
When asked about the adequacy of available labour market information, service providers in 3 P/Ts specified that national level information is of limited value for them. As well, they indicated that regional level information is limited and not available or outdated at the rural area level. In two jurisdictions, service providers indicated that they lack capacity and resources to collect labour market information.
2.7.3 Profile of Employment Assistance Services participants
The following presents the main socio-demographic characteristics of active and former claimants who only participated in Employment Assistance Services without receiving Employment Benefits.
Active claimants
As shown in Table G1 in Appendix G, active claimants who participated only in Employment Assistance Services in 2002/05 included a higher share of males (54%) while those who participated in 2007/08 were slightly more likely to be female (51%). The 2002/05 participants were more likely to be younger than those who received assistance in more recent years as 39% of them were under 34 years of age while 34% of the 2007/08 participants were in this age group. Both cohorts most frequently had employment requiring secondary or occupational training before participation (38% for 2002/05 and 40% for 2007/08). Both cohorts had similar levels of employment earnings ($22,335 and $22,214).
Former claimants
Like active claimants, the share of female former claimants who participated only in Employment Assistance Services increased over time. It went from 45% for 2002-2005 participants to 52% for 2007/08 participants. Forty two percent of the 2002/05 participants were under 34 years old compared to 39% for 2007/08 participants. Both the 2002/05 and 2007/08 participants most frequently had occupations requiring secondary or occupational training before participation (38% and 39%, respectively). Those who participated in 2002/05 had slightly lower earnings ($10,530) while the latter group earned $11,991 on average.
Labour market barriers faced by Employment Assistance Services participants in general
Based on key informant interviews completed in 10 P/Ts in summer 2013
According to key informants, the main labour market barriers faced by individual who access Employment Assistance Services with or without participating in Employment Benefits include:
- Lack of work experience or skills mismatches (9 P/Ts).
- Low essential and foundational skills (8 P/Ts).
- Access and affordability of transportation (8 P/Ts).
- Access and affordability of childcare (8 P/Ts).
- Criminal records and addictions (8 P/Ts).
- Being a person with disability or having mental health issues (7 P/Ts).
- Temporary, seasonal or part-time employment (7 P/Ts).
- Lack of marketable skills (outdated skills, inability to network) (7 P/Ts).
- Employers’ perception toward individuals in some groups (visible minorities, persons with disabilities, new immigrants, Indigenous peoples, etc.) (7 P/Ts).
- Lack of employment opportunities, particularly in rural and remote areas (6 P/Ts).
- Language barriers (6 P/Ts).
- Low self-esteem, lack of motivation and negative attitude (6 P/Ts).
- Lack of job search/interview skills (5 P/Ts).
- Homelessness and lack of affordable housing (4 P/Ts).
2.7.4 Incremental impacts
Incremental impacts were produced only for active claimants since former claimants who participated only in Employment Assistance Services were used as a comparison group for former claimants who participated in other EBSMs.
Results presented in Table G2 in Appendix G indicate that active claimants who participated exclusively in Employment Assistance Services had decreases in earnings in the first ($1,097) and second years ($279) after participation while they had gains in the fourth ($645) and fifth years ($742). While their earnings improved in the medium-term after participation, they increased their incidence of employment by annual averages ranging between 0.8 and 1.8 percentages points starting the second year after participation (see Figure 9). As well, they reduced their use of EI in all years after participation by averages ranging between $136 and $451. Their use of social assistance increased after participation by averages ranging between $29 and $94 but their level of dependence in income support decreased in the first four years by averages ranging between 0.6 and 1.2 percentage points.
Figure 9 illustrates the incidence of employment for active employment insurance claimants who participated in Employment Assistance Services for each of the 5 years following participation.
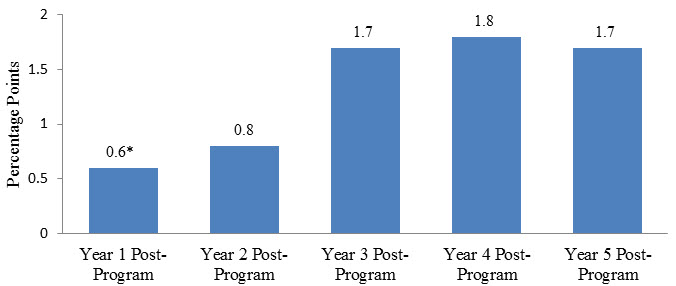
Figure 9 -Text description
| Year 1 post-program | Year 2 post-program | Year 3 post-program | Year 4 post-program | Year 5 post-program | |
|---|---|---|---|---|---|
| Incidence of employment for active claimant participants in Employment Assistance Services | 0.6 | 0.8 | 1.7 | 1.8 | 1.7 |
*The estimate for year 1 post-program is statistically significant at 90% level.
Results for active claimants who participated exclusively in Employment Assistance Services in 2007 or 2008 were in the same direction as those for the 2002/05 participants. The most recent participants also had decreases in earnings in the first and second years after participation and gains in incidence of employment in all post-program years. They decreased their use of EI and their level of dependence on income support but increased their use of social assistance.
The three sub-groups examined had the following results:
- Youth (under 30 years old) who started participation between 2002 and 2005 had gains in earnings starting in the third year after participation and in incidence of employment starting in the second year. Their use of EI decreased in all post-program years while their use of social assistance increased. Their dependence on income support decreased in the first three years after participation and increased during the remainder of the post-program period.
- Older workers (55 years old and over) who started participation between 2002 and 2005 had gains in earnings starting in the second post-program year and increases in incidence of employment during the entire post-program period. Their use of EI decreased in the first three years after participation while their dependence on income support decreased in the first two years. Their use of social assistance benefits increased over all post-program years.
- Unlike other participants, long-tenured workers who started participation between 2007 and 2009 had decreases in earnings and incidence of employment in all three post-program years. Like other active claimants, their use of EI and dependence on income support decreased over most of the post-program period while their use of social assistance increased.
Earlier participation in employment assistance services improves participants’ labour market outcomes
The study on the effects related to the timing of participation showed that incremental impacts on earnings and employment were larger for individuals who participated exclusively in Employment Assistance Services early during their EI claim compared to non-participants and to individuals who remained longer on EI before receiving these services (see Figure 10 below and Table G3 in Appendix G). Specifically, individuals who started their participation within four weeks following the start of their EI benefit period had a cumulative increase of $10,192 in their earnings over five years post-program and increases in their incidence of employment ranging between 0.9 to 2.6 percentage points per year.
Participants who received Employment Assistance Services between 5 and 8 weeks and those who started between 9 and 12 weeks after the start of their EI claim had cumulative increases in their earnings totalling $3,888 and $2,543 respectively over the post-program period. The increases in earnings for participants who started between 5 and 8 weeks were accompanied by statistically non-significant impacts on incidence of employment. Participants who started between 9 and 12 weeks had decreases in their incidence of employment after participation. The participants who started participation during the second and third quarters of their EI claim generally had decreases in their employment earnings and incidence of employment after participation.
Figure 10 shows the cumulative incremental gains in employment earnings related to the timing of participation in Employment Assistance Services. The earnings are presented for 6 sub-groups of participants based on the time elapsed between the start of the employment insurance claim and the start of participation in Employment Assistance Services (1 to 4 weeks, 5 to 8 weeks, 9 to 12 weeks, 2nd quarter, 3rd quarter and 4th quarter).
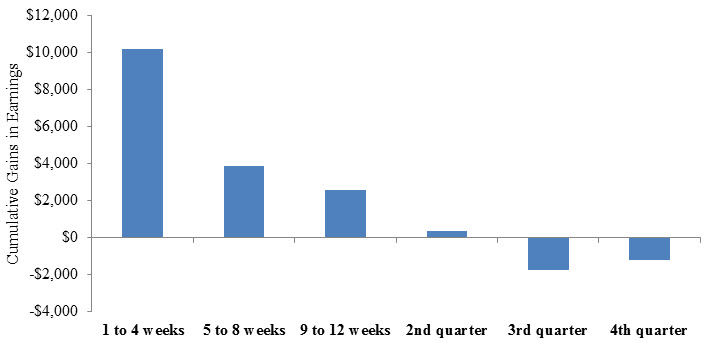
Figure 10 -Text description
| 1 to 4 weeks | 5 to 8 weeks | 9 to 12 weeks | 2nd quarter | 3rd quarter | 4th quarter | |
|---|---|---|---|---|---|---|
| Cumulative incremental impacts on earnings related to the timing of participation in Employment Assistance | $10,192 | $3,888 | $2,543 | $358 | -$1,754 | -$1,218 |
As well, the study looked at the difference between the number of EI weeks unused by participants and the number of EI weeks unused by their comparison group in order to determine the effect of the timing of participation in Employment Assistance Services on the return to employment. It was found that only those who received assistance within the first four weeks of their claim returned to employment faster than the comparison group. Specifically, they returned to employment 3 weeks earlier than the comparison group. Participants who received assistance after the fourth week of their EI claim returned to employment 0.5 to 3.5 weeks later than the comparison group (see Table G4 in Appendix G).
Among all participants in the 2002-2005 period, 39,354 received assistance within the first 4 weeks of establishing an EI claim. With average weekly EI benefits of $312 during this period, the 39,354 participants did not use $35,607,499 in EI benefits (39,354 * $312 * 2.9 weeks). The average cost of receiving Employment Assistance Services in the 2002-2005 period was $692. This represents a cost of $27,232,968 (39,354 * $692) for a net saving of $8,374,531.
2.7.5 Cost-benefit results
As shown in Table G5 in Appendix G, the benefits from Employment Assistance Services would need to persist over 10.9 years in order to recover the costs from the social perspective. This result is partly due to the decreases in earnings experienced by active claimants during and immediately after participation. The main expected benefit from Employment Assistance Services is the return to employment by itself and not necessarily improvements in earnings that may follow as Employment Assistance Services alone do not focus on skill acquisition.
Incremental impact analyses showed that Employment Assistance Services are achieving this objective since it increased participant’s employment and decreased their EI use after participation. The value of the return in employment was not accounted for in this analysis since it is difficult to attribute a dollar figure to this impact. The decrease in EI use was also not considered from the social perspective because it represents a benefit for the government and a cost to the individual – they cancel each other out.
2.7.6 Challenges and lessons learned about Employment Assistance Services design and delivery
Based on key informant interviews completed in 10 P/Ts in summer 2013
Key informants interviewed as part of the Employment Assistance Services study identified the following challenges with respect to program design and delivery:
- Participants in some regions face issues with limited access to services, mobility and transportation (7 P/Ts).
- There is a lack of awareness about the program among potential participants (6 P/Ts).
- The current budget allocation is not enough to support the delivery of Employment Assistance Services. This led some service providers to eliminate services and reduce the number of participants served (5 P/Ts).
- Service providers cannot necessarily provide all the services required by participants facing multiple barriers to employment. They have to refer these individuals to other organizations and sometimes, one individual can be referred to more than one organization. This may lead some participants to give up on their return-to-work process (5 P/Ts).
- The current performance measurement strategy does not capture the various outcomes achieved over time when assisting people with multiple barriers to employment (3 P/Ts).
- Service providers have difficulties in hiring skilled and knowledgeable staff (2 P/Ts). As well, some service providers have a high turn-over of staff and staff training is very costly (2 P/Ts).
- Service providers lack capacity to follow up with each participant in order to provide job maintenance support (2 P/Ts).
Key informants also provided examples of best practices and lessons learned with respect to program design and delivery. These include:
It is important to case manage participants and to provide a client-centered holistic approach through counselling, motivation, building self-esteem and assisting them in choosing a career path (9 P/Ts).
- It is important for service providers to be engaged in their community and well connected to other service providers (for information sharing and referral purposes) particularly with those dealing with persons with disabilities and mental health issues. As well, partnerships and ongoing communication with employers can facilitate the labour market integration of participants through job placements and subsidy) (8 P/Ts).
- Since participants with multiple barriers to employment often require more intensive interventions, it is important to conduct a strong needs assessment in order to make the best training decision (7 P/Ts).
- Having a one stop shop for services and to streamline services (co-location, no wrong door approach, offering a comprehensive suite of services from self-serve to workshops, employability assessment, career orientation, need determination and ongoing case management) and to remove barriers to access and participation (7 P/Ts).
- It is important to keep a long-term perspective when assisting participants facing multiple barriers to employment (6 P/Ts).
- Providing long-term follow-up with participants for employment retention support is seen as a best practice (6 P/Ts).
- Giving service providers increased flexibility when assisting participants with multiple barriers to employment particularly in terms of the length of services and the type of financial support that can be made available to participants (6 P/Ts).
- It is important for service providers to have dedicated workers, specialized teams to deal with participants facing multiple barriers to employment, having job coaches/developers that are dedicated and committed to support these participants (6 P/Ts).
- Service providers need to make appropriate referrals, when available, to specialized community organizations for Employment Assistance Services participants dealing with disabilities, mental health issues, addictions and criminal records (5 P/Ts).
- Providing participants with help to contact employers (for example, assisting in handing out resumes) and networking opportunities (5 P/Ts).
- Providing participants with an opportunity to try and test prospective jobs (5 P/Ts).
- It is important for provincial/territorial governments to have strong partnerships with third-party service providers and employers in order to be able to mobilize the service delivery network in cases of emerging labour market challenges (major lay-offs, downturn, etc.) and to organize job fairs and joint group workshops (5 P/Ts).
- There is a need to enhance the promotion of programs and services (5 P/Ts).
- There is a need to provide services in an innovative way depending on local needs and reality (for example, online resources and training) (3 P/Ts).
- There is a need to change the way success is measured under Employment Assistance Services. For example, the progress of a participant with multiple barriers to employment should be measured through small steps from securing adequate housing to dealing with addictions, improving life skills and integrating the labour market (3 P/Ts).
- Services providers need additional resources in order to maintain the level and quality of services and to train staff, particularly those operating in rural areas (3 P/Ts).